Abstract
Citrus huanglongbing (HLB) is one of the most severe diseases affecting the citrus industry, with Diaphorina citri (Hemiptera: Liviidae) serving as its primary natural vector. To understand the genetic diversity and population structure of D. citri in the context of HLB diffusion, we analyzed 13 populations from the HLB diffusion frontier and 25 populations from epidemic areas in China. The HLB diffusion frontier areas refer to the peripheral regions of HLB distribution in China, including the western Zhejiang, southern Jiangsu, northern Jiangxi, northern Hunan, and eastern Sichuan provinces. In contrast, the HLB epidemic areas represent regions in China where HLB is actively widespread and causing significant impacts. We utilized mitochondrial genes (COI, ND5, and Cytb) of D. citri and housekeeping genes (dnaQ, rpoC, and argH) of its endosymbiont Candidatus Carsonella ruddii (Ca. C. ruddii) for this analysis. Our findings revealed that the D. citri and Ca. C. ruddii in different regions showed low haplotype diversity and nucleotide diversity. While the genetic variation in D. citri populations primarily occurred within populations, the endosymbiont showed contrasting patterns in the HLB epidemic areas. We identified three dispersal paths: (1) migration of the Yunnan population to Sichuan, Guizhou, and Guangxi; (2) movement of the Guangdong population to Fujian, Jiangxi, and Zhejiang; and (3) dispersal of the Guangdong population to Hunan and Guangxi. Our study suggests that D. citri populations at the HLB diffusion frontier are predominantly transmitted from neighboring epidemic areas.
1. Introduction
Citrus Huanglongbing (HLB), an extremely destructive bacterial disease, is caused by the Gram-negative bacterium Candidatus Liberibacter asiaticus (CLas), which acts as a phloem-localized parasite [1]. Based on differences in the 16S rRNA sequence and geographic distribution of the citrus HLB pathogen, it is categorized into three species: Candidatus Liberibacter asiaticus (CLas) [2], Candidatus Liberibacter africanus (CLaf) [3], and Candidatus Liberibacter americanus (CLam) [4,5]. Among these, CLas is the most widespread and destructive. It is found not only in Asia but also in the Americas, Africa, and the Middle East. In China, HLB is specifically caused by CLas [6]. The disease was first identified in Taipei, China, in 1913 [7], and later appeared on the Chinese mainland in 1919 [8]. Today, it is prevalent in 10 provinces (autonomous regions) and 349 counties (cities and districts) across China [9,10].
Diaphorina citri (Hemiptera: Liviidae) primarily infests citrus and other Rutaceae plants. Infestations result in stunted tree growth in mild cases and plant mortality in severe cases. Furthermore, D. citri serves as the primary natural vector for citrus HLB transmission [11]. The pest was first recorded in Taiwan, China, in 1907 [12] and later in mainland China in 1934 [13]. Subsequently, D. citri was identified in Brazil in 1936 [14] and spread to Florida in the 1990s [15]. Currently, it is distributed across Asia, the Middle East, the southern United States, the Caribbean Islands, and Central and South America [16,17,18,19,20,21,22].
Understanding the genetic variation and population structure of D. citri in China provides crucial insights into its geographic origins and invasion pathways. This can offer valuable information for biological control and pest management programs [23]. Mitochondrial DNA analysis is a widely used method for phylogenetic and population genetic studies [24,25,26,27]. Compared with nuclear genes, mtDNA is a highly conserved maternal marker that is unaffected by life stage, polymorphism, or gender [28]. Zhang et al. [29] investigated potential invasion sources and dispersal routes of D. citri in China using mitochondrial genes COI and Cytb, identifying two possible origins in Guangdong and Yunnan, along with three dispersal pathways. In a separate study, Luo et al. [30] analyzed 356 D. citri populations from 106 regions worldwide using mitochondrial genes COI, revealing low nucleotide diversity but high haplotype diversity. Their findings suggested three transmission routes for D. citri: from South Asia to North America via West Asia, from Southeast Asia to East Asia, and from Southeast Asia to South America through Africa [30]. Additionally, Huang et al. [31] assessed the genetic diversity and population structure of D. citri in southwest, central, east, and south China using the mitochondrial genes COI. They found that the population in southwest China exhibited significantly greater differentiation compared to the other three regions [31]. These comprehensive studies enhance our understanding of D. citri dynamics and contribute to the development of effective pest management strategies. Cui et al. [32] conducted a phylogenetic analysis of the D. citri mitochondrial genome, revealing that D. citri from Leibo, Pingshan, and Xuzhou (rural areas) formed a distinct group (MG4), characterized by three unique SNPs in cox1, nad4, and cytb. In contrast, D. citri from Cuiping and Xuzhou (urban areas) clustered with the southeast China group. A study on the genetic diversity of D. citri in Puerto Rico revealed a unique haplotype in the Caribbean, which was more closely related to haplotypes from Southwest Asia than other regions. This suggested that the Caribbean invasion did not originate from the United States [33].
Endosymbionts are microorganisms that reside within insects for extended periods, forming a symbiotic relationship with their insect hosts. These microorganisms include bacteria, fungi, viruses, and small protists [34]. In the evolutionary context of insect biology, insect endosymbionts are categorized as primary or secondary endosymbionts [35]. Most insects host only one primary endosymbiont, establishing a strict symbiotic bond. For example, the primary endosymbiont of D. citri is Ca. C. ruddii [36]. Nakabachi et al. [37] were the first to sequence and annotate the genome of Ca. C. ruddii, an indigenous endosymbiont of D. citri, revealing a genome size of 159,622 bp, primarily comprising genes related to amino acid synthesis. Therefore, it is believed to function as a nutritional endosymbiont for D. citri, providing essential amino acids and other nutrients absent in its diet. Wang et al. [38] utilized mutation sites for population dynamics analysis of the geographical lineage of D. citri, focusing on the endosymbionts Ca. C. ruddii. By integrating mitochondrial genes, they unveiled the genetic evolutionary relationships among 24 geographical populations of D. citri across Asian countries and the United States. This study demonstrated the utility of Ca. C. ruddii in tracing the history of population lineage diffusion in D. citri populations. Wu et al. [39] analyzed the population diversity of D. citri across 54 citrus-producing areas in 11 provinces in China. Diversity primarily arose from single nucleotide polymorphisms in five mitochondrial genes: nad3, cox2, rrnL, cob, and atp6. Nine SNPs grouped the mitochondrial genomes of D. citri into three main clusters, including seven subgroups. Additionally, the genomes of D. citri endosymbionts Ca. C. ruddii and Candidatus Profftella armatura were sequenced from 31 new samples in China, and independent phylogenetic trees were constructed, supporting the mitochondrial genome analysis. Zhang et al. [40] analyzed the genomes of 65 Wolbachia endosymbionts, classifying them into Asian and North American strains. Concurrently, the analysis confirmed that D. citri in Florida did not originate from China. This study provides valuable insights into the geographical distribution of Wolbachia, its host’s origin, and the host–endosymbiont interaction. Endosymbionts of D. citri have been extensively used in host genetic analyses [41,42].
This study focused on D. citri in the diffusion frontier and epidemic areas of HLB. Using mitochondrial genes of D. citri (COI, ND5, and Cytb) and genes of its primary endosymbiont Ca. C. ruddii housekeeping genes (dnaQ, rpoC, and argH) as molecular markers, the genetic structure was examined. The aim was to provide robust evidence for analyzing the relationship between the geographical distribution and genetic lineage of D. citri in the HLB diffusion frontier and epidemic areas.
2. Materials and Methods
2.1. Sample Collection and DNA Extraction
Between 2021 and 2023, 1140 D. citri adults were collected from commercial and unmanaged citrus groves at 38 sites across southern China, a major region for D. citri occurrence. The coordinates of each sampling site were recorded using a portable GPS device (Zhuolin A6, Hefei, China) (Figure 1). Of these, two were from Fujian, four from Guangdong, four from Guangxi, two from Guizhou, six from Hunan, eight from Jiangxi, five from Sichuan, two from Yunnan, and five from Zhejiang. Based on the incidence of HLB, the collection sites were categorized into 13 HLB diffusion frontier areas and 25 epidemic areas were included in the study. The collected samples were preserved in 75% ethanol and stored at −20 °C until DNA extraction. Detailed information on sample collection by region is provided in Table 1.

Figure 1.
D. citri sampling sites. The black solid circle is the sampling location from the HLB diffusion frontier areas, and the red solid circle is the sampling location from the HLB epidemic areas.

Table 1.
Localities, host, number of D. citri individuals (N), latitude and longitude in each sampled locality.
2.2. DNA Extraction, PCR, and Sequencing
Whole-genome DNA was extracted from individual specimens using the DNeasy Blood and Tissue Kit (Qiagen, Valencia, CA, USA) following the manufacturer’s protocol. The mitochondrial genes COI of D. citri was amplified as described by Boykin et al. [19], while the Cytb primers were obtained from Zhang et al. [29]. Primers for ND5 were designed based on available complete mitochondrial genome sequences of D. citri. The primer sequence for Ca. C. ruddii housekeeping genes (dnaQ, rpoC, and argH) was adopted from Wang et al. [38]. Details of primer fragment names and sequences are provided in Table 2.
Table 2.
Primers used for the amplification and sequencing.
The polymerase chain reaction (PCR) mixture comprised 10.5 μL of nuclease-free water, 12.5 μL of 2× Taq PCR MasterMix II (TaKaRa Co., Dalian, China), 0.5 μL each of forward and reverse primers (10 μM), and 1 μL of DNA template (50–200 ng/μL), resulting in a total reaction volume of 25 μL. Amplifications were performed using a Veriti 96-well thermal cycler (Applied Biosystems, Foster City, CA, USA) under the following conditions: initial denaturation at 95 °C for 3 min; 35 cycles of 95 °C for 30 s, annealing at the specific temperature (Tm) for 1 min, and extension at 72 °C for 1 min; followed by a final extension at 72 °C for 10 min.
All amplified products were subjected to electrophoresis on a 1.2% agarose gel. The length of the target bands was determined using DL 2000 (TaKaRa Co., Dalian, China) as a reference marker, and a single product with clear bands was selected for sequencing at Sangon Biotech (Shanghai, China).
2.3. Genetic Diversity and Genetic Structure
To analyze the genetic diversity of D. citri populations, we used various bioinformatics tools and statistical methods. First, we employed SeqMan 7.1.0 [43] to assemble and manually correct the sequenced data. The clipped and spliced sequences were then aligned using ClustalW in MEGA 7.0 [44]. Genetic diversity parameters, including base composition, the proportion of bases, the number of polymorphic sites (S), synonymous (Ks) and non-synonymous (Ka) substitution rates, haplotype diversity (Hd), haplotype number (H), and nucleotide diversity (π), were calculated using DnaSP 5.0 [45]. A mismatch analysis was performed, and the data were visualized in Excel 2020. To assess genetic differentiation between D. citri populations, pairwise Fst values were calculated and a molecular analysis of variance (AMOVA) was performed across 38 geographic regions using Arlequin 3.5 [46]. Fst values were interpreted as follows: 0 < Fst ≤ 0.05 for mild genetic differentiation, 0.05 < Fst ≤ 0.15 for moderate differentiation, 0.15 < Fst ≤ 0.25 for high differentiation, and Fst > 0.25 for severe differentiation. To infer the phylogenetic relationships among haplotypes, after screening the HKY’s best model, a maximum likelihood (ML) tree with 1000 bootstrap replicates was constructed using MEGA 7.0. The haplotype network was visualized using the Templeton, Crandall, and Sing (TCS) method [47] in PopART 1.7 [48]. To investigate the correlation between genetic and geographic distance, we conducted principal coordinate analysis (PCoA) and Mantel tests (10,000 permutations) [49] using GenAlEx v.6.5 [50]. Furthermore, neutral tests, including Tajima’s D [51], Fu and Li’s D, and Fu and Li’s F [52] tests were performed using DnaSP to examine evidence of historical population expansion.
3. Results
3.1. Genetic Diversity and Population Structure of D. citri
In this study, the mitochondrial multi-gene concatenated sequences of D. citri was 2251 bp, consisting of COI (725 bp), ND5 (794 bp), and Cytb (732 bp). In the dataset of 1140 sequences from 38 regions, the A + T content was 68.90%, indicating a significant A + T bias. A total of 81 polymorphic loci were identified, including 39 parsimony-informative loci and 42 single-variation loci. Among the analyzed sequences, 82 haplotypes (designated H1 to H82) were identified (Table 3). Notably, 18 haplotypes were shared across two or more populations, while 64 were exclusive to a single population. The most prevalent haplotype, H1, accounted for 66.49% of the total samples (758 sequences) and was found in all populations except GZQXN, SCLS, and YNBS. H63 (4.82%, 55 sequences) and H23 (4.65%, 53 sequences) were the second and third most common haplotypes.
Table 3.
Haplotype (Hap), haplotype diversity (Hd), and nucleotide diversity (π) in each sampled locality.
High Hd (0.551 ± 0.018) and low π (0.00039 ± 0.00002) were observed, with a mean nucleotide difference (k) of 0.883. Certain populations, such as FJZZ (0.766), GXBS (0.630), GXCZ (0.745), GXGL (0.570), JXLC (0.515), JXNF (0.726), JXYS (0.591), SCPZH (0.540), YNBS (0.729), and YNYX (0.770), exhibited high Hd (Table 3). The non-synonymous (Ka) to synonymous (Ks) substitution rate ratios, which assess selection pressure at the protein level, revealed Ka/Ks values > 1 (12.92).
Genetic analysis revealed that haplotypes from all populations could be categorized into two groups, i.e., Groups A and B (Figure 2a). Group A comprises 64 haplotypes, with H1 being the most prevalent. Group B is further subdivided into two subgroups: BI and BII. BI consists of nine haplotypes (H4, H10, H18, H26, H30, H45, H70, H73, and H81), distributed across all sampled provinces in this study. BII also contains nine haplotypes (H16, H36, H39, H65, H66, H67, H71, H72, and H74), primarily found in four regions: Guangdong, Hunan, Zhejiang, and Guangxi. However, there were other regions, including Yunnan, Guizhou, and Sichuan. PCoA analysis (Figure 2b) demonstrated that while some D. citri from different populations showed widely varying distributions, most populations exhibited overlapping distributions. The populations can be categorized into three groups: (1) YNBS, FJZZ, GDZQ, HNCZ, ZJTZ, and SCPZH; (2) YNBS, YNYX, SCPZH, and GZQN; and (3) other populations, corresponding to lineages BI, BII, and A, respectively.
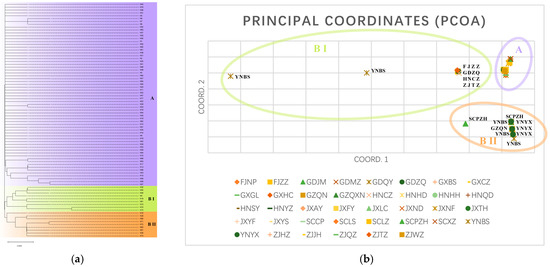
Figure 2.
(a) Phylogenetic tree between haplotypes based on Maximum Likelihood Method of mitochondrial multi-gene concatenated sequences in D. citri. (b) PCoA based on mitochondrial multi-gene concatenated sequences of all D. citri populations.
The haplotype network, constructed using the TCS inference method, is divided into two subregions. The network exhibits a star-shaped pattern, with the most frequent haplotype, H1, at the central position. All other haplotypes are derived through one or a few mutation steps (Figure 3).
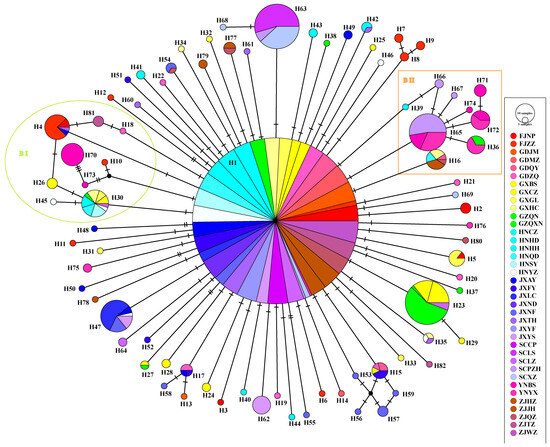
Figure 3.
Haploid network of mitochondrial multi-gene concatenated sequences in D. citri. BI and BII rep-resent a group different from other haplotypes.
A global non-stratified analysis of molecular variance (AMOVA) was conducted on all samples to reveal the genetic structure of the population. The results indicated that 20.25% of the genetic variation occurred among populations, while the remaining 79.75% originated within populations (Table 4). The fixation index (Fst) value of 0.20253, which falls between 0.15 and 0.25 (p < 0.0001), is a key measure of population differentiation.
Table 4.
AMOVA of mitochondrial multi-gene concatenated sequences in all populations of D. citri.
The neutral test showed that Tajima’s D (D = −2.51218, p < 0.001), Fu and Li’s D (Fs = −8.40780, p < 0.02), and Fu and Li’s F (Fs = −6.47071, p < 0.02) all reached statistically significant levels, with p < 0.05. Additionally, the mismatch distribution of D. citri populations in the three regions were found to be monotonous (Figure 4).
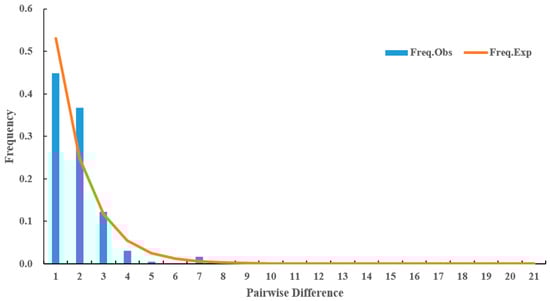
Figure 4.
Mismatch distribution of mitochondria multi-gene concatenated sequences based on all D. citri populations.
Mantel test results revealed a significant correlation between genetic distance and geographical distance of D. citri (R2 = 0.085, p < 0.01) (Figure 5).
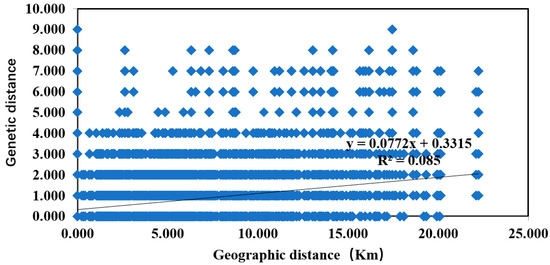
Figure 5.
Relationship between genetic distance and geographic distance of D. citri.
3.2. Genetic Diversity and Population Structure of Two Populations of D. citri
All sampling sites were categorized into HLB diffusion frontier areas (390 individuals) and epidemic areas (750 individuals), with 28 and 70 haplotypes identified, respectively. The Hd of D. citri in the HLB epidemic areas was notably higher (Hd = 0.615 ± 0.021) (Table 5), likely due to the early occurrence and wide distribution of D. citri in this region. Ancestral haplotype H1 was the most prevalent in both regions, with frequencies of 76.67% and 61.20%, respectively. Additionally, certain regions exhibited high Hd values, such as JXLC (0.515) and JXYS (0.591) in the HLB diffusion frontier areas, and FJZZ (0.766), GXBS (0.630), GXCZ (0.745), GXGL (0.570), JXNF (0.726), SCPZH (0.540), YNBS (0.729), and YNYX (0.770) in the HLB epidemic areas. In contrast, other populations showed low Hd and π values (Table 3).
Table 5.
Genetic diversity parameters of D. citri in HLB diffusion frontier and epidemic areas.
The average nucleotide difference and Ka/Ks ratio of D. citri in the HLB epidemic areas were higher than those in the HLB diffusion frontier areas. Similarly, genetic variation within D. citri populations predominated in both regions, with significantly negative results from neutral tests.
Moreover, the mismatch distribution exhibited a monotonous pattern (Figure 6).
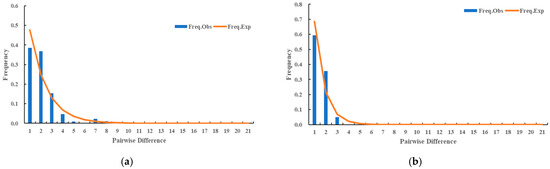
Figure 6.
(a) Mismatch distribution of mitochondria multi-gene concatenated sequences based on D. citri populations in the diffusion frontier areas of HLB. (b) Mismatch distribution of mitochondria multi-gene concatenated sequences based on D. citri populations in the epidemic areas of HLB.
3.3. Genetic Diversity and Population Structure of Ca. C. ruddii
The Ca. C. ruddii multi-gene concatenated sequence alignment was 2410 bp in length (dnaQ: 436 bp; rpoC: 1189 bp; argH: 785 bp). The A + T content was 79.29%, indicating a notable A + T bias. A total of 64 polymorphic loci were identified, including 43 parsimony-informative loci and 21 single-variation loci. A total of 71 haplotypes (designated C1–C71) were defined (Table 3). Among these, 10 haplotypes were shared across two or more populations, while 61 were exclusive to a single population. The most widespread genotype, C1, accounted for 49.21% (561 sequences) of the total sample. Except GZQXN, SCLS, SCXZ, YNBS, YNYX, and ZJWZ, the C1 genotype was present in all other populations. Notably, unlike the D. citri populations, the second most abundant haplotype, C2, represented 20.79% of the Ca. C. ruddii samples.
Similar to D. citri, Ca. C. ruddii exhibited high Hd (0.708 ± 0.012) and low π (0.00064 ± 0.00003). The mean nucleotide difference (k) among Ca. C. ruddii samples was 1.531. Interestingly, more Ca. C. ruddii populations showed high Hd values (>0.5) compared to D. citri populations. Furthermore, Ka/Ks values were > 1 (2.89) for all populations.
Phylogenetic analysis revealed that the haplotypes from all populations could be grouped into two distinct groups, A and B (Figure 7a). Group A radiated outward with C1 and C2 at its core, encompassing 56 haplotypes that were widely dispersed across all sampled provinces. In contrast, group B comprised 15 haplotypes (C18, C22, C49, C50, C51, C53, C54, C55, C56, C57, C58, C59, C60, C61, C62) connected by two major haplotypes, C18 and C22, and was predominantly found in southwest China, including the Yunnan, Guangxi, Guizhou, Sichuan, and Hunan provinces. PCoA analysis (Figure 7b) showed that while some Ca. C. ruddii from different populations had distinct distributions, most populations overlapped. The two groups were distinguishable in populations such as SCPZH, SCXZ, SCLS, HNSY, GXGL, YNBS, GZQN, and YNYX, which corresponded to Lineages B and A, respectively.
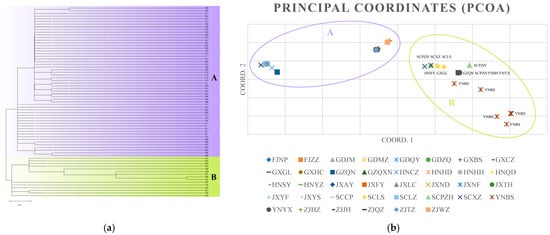
Figure 7.
(a) Phylogenetic tree between haplotypes based on Maximum Likelihood Method of multi-gene concatenated sequences in Ca. C. ruddii. (b) PCoA based on multi-gene concatenated sequences of all Ca. C. ruddii populations.
The haplotype network exhibited a star-shaped structure, with C1, the most frequent haplotype, at the center. C2, the second most frequent haplotype, diverged from C1 through a single mutation. It is likely that C1 and C2 represent the ancestral maternal haplotypes of the Ca. C. ruddii populations (Figure 8).
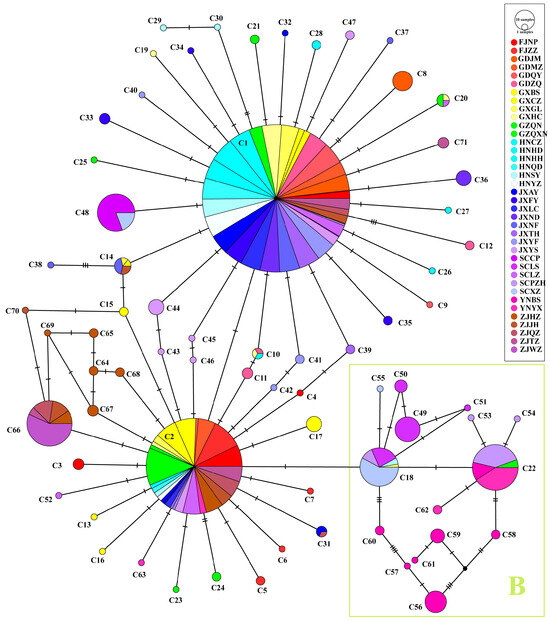
Figure 8.
Haploid network of multi-gene concatenated sequences in Ca. C. ruddii. B represents a group different from other haplotypes.
AMOVA analysis revealed that 56.32% of the genetic variation occurred among populations, while 43.68% occurred within populations. The primary source of genetic variation was among populations (Table 6), with the genetic variation within the D. citri populations being predominant. The Fst value: (Fst = 0.56323 > 0.25, p < 0.0001).
Table 6.
AMOVA of multi-gene concatenated sequences in all populations of Ca. C. ruddii.
The neutral test results indicated that Tajima’s D (D = −2.20842, p < 0.01), Fu and Li’s D (Fs = −4.21476, p < 0.02), and Fu and Li’s F (Fs = −3.89280, p < 0.02) were significantly negative, with p < 0.05. Additionally, the mismatch distribution of the total populations exhibited a monotonous pattern (Figure 9).
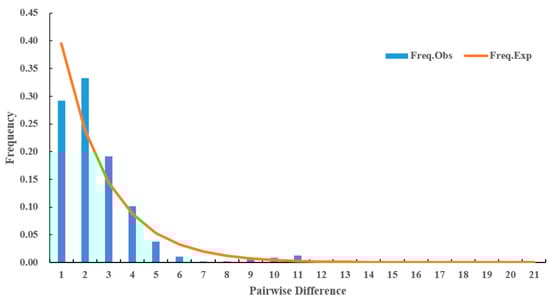
Figure 9.
Mismatch distribution of multi-gene concatenated sequences based on all Ca. C. ruddii populations.
Moreover, the Mantel test also showed a significant correlation between the genetic and geographical distances of Ca. C. ruddii (R2 = 0.1962, p < 0.01) (Figure 10).
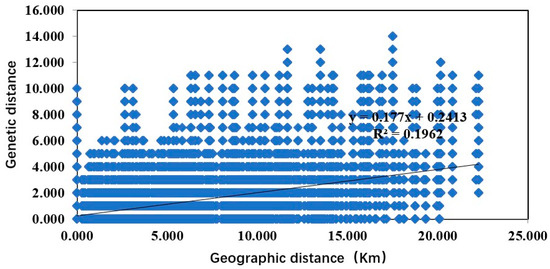
Figure 10.
Relationship between genetic distance and geographic distance of Ca. C. ruddii.
3.4. Genetic Diversity and Population Structure of Two Populations of Ca. C. ruddii
Similar to D. citri, the Ca. C. ruddii populations can be categorized into two regions: the HLB diffusion frontier (390 individuals) and the epidemic areas (750 individuals), with 28 and 70 haplotypes identified, respectively. Both regions displayed high Hd (Hd = 0.691 ± 0.021 and 0.711 ± 0.015, respectively) (Table 7). The most prevalent haplotype in both regions was C1 (51.03% and 48.24%, respectively), likely the ancestral haplotype of the Chinese citrus woodlouse. Notably, populations in specific areas showed high Hd, such as JXYS (0.763), SCLZ (0.582), ZJHZ (0.754), ZJJH (0.743), and ZJQZ (0.692) in the HLB diffusion frontier areas, and FJNP (0.598), GDMZ (0.515), GXBS (0.621), GXCZ (0.605), GZQN (0.703), SCLS (0.628), YNBS (0.772), and ZJTZ (0.683) in the HLB epidemic areas. In contrast, populations in other areas exhibited low Hd and π values (Table 3).
Table 7.
Genetic diversity parameters of Ca. C. ruddii in HLB diffusion frontier and epidemic areas.
The Ka/Ks ratio of the Ca. C. ruddii populations were higher in the HLB diffusion frontier areas, while the mean nucleotide difference was greater in the HLB epidemic areas. Variation in the HLB diffusion frontier areas primarily resulted from within populations differences, whereas variation in the epidemic areas was mainly driven by among populations dynamics. The mismatch distribution of D. citri populations in the two regions showed a single peak (Figure 11).
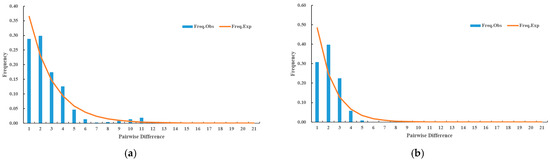
Figure 11.
(a) Mismatch distribution of multi-gene concatenated sequences based on Ca. C. ruddii populations in the diffusion frontier areas of HLB. (b) Mismatch distribution of multi-gene concatenated sequences based on Ca. C. ruddii populations in the epidemic areas of HLB.
4. Discussion
Phylogeographic studies of D. citri have predominantly focused on mitochondrial genes [2,29,30], such as COI and Cytb, in order to reconstruct species invasion routes and evolutionary trends [53]. This study found low genetic diversity in D. citri, likely due to limited sequence variation in the mitochondrial genes COI, ND5, and Cytb. Specifically, despite that both Cytb and ND5 are mitochondrial genes, they exhibited significantly less sequence variation than COI. This may be linked to small population size and/or a bottleneck effect [54]. The nuclear gene of D. citri is maternally inherited [55], evolving slowly. Consequently, recently separated populations often exhibit high genetic similarity [56], further supporting the idea that haplotype and genetic diversity in D. citri are lower in the HLB diffusion frontier areas compared to those in HLB epidemic areas. Another possibility is that Wolbachia infection may reduce mtDNA mutations [30]
Among all D. citri and its endosymbionts populations, we observed consistent genetic patterns. Some populations exhibited high Hd, suggesting they may have experienced population bottlenecks followed by rapid growth and mutation accumulation. Conversely, other populations showed low Hd and π, indicating potential bottleneck effects or founder events in their evolutionary history. Additionally, a KA/KS ratio > 1 was observed in two populations, thereby indicating that the D. citri and its endosymbionts were naturally selected. The Fst values for all populations exceeded 0.15, indicating a high degree of genetic differentiation within the D. citri and endosymbiont populations. Neutrality tests, including Tajima’s D, Fu and Li’s D, and Fu and Li’s F, yielded statistically significant results (p < 0.05), suggesting the absence of neutral mutations and pointed towards a recent population expansion [51,52]. The monotonous distribution of the population mismatch further supports the hypothesis of a recent population expansion. Lastly, Mantel test results showed a significant correlation between genetic and geographical distances, indicating that gene flow in these populations may be influenced by geographic factors.
Parasites are valuable tools for inferring the evolutionary history of their hosts [57]. Vertically transmitted parasites are particularly informative, as they preserve the pedigree history of their hosts most effectively [58,59]. Some microorganisms, closely linked to their hosts’ evolutionary history, provide insights into host origins and migrations [59]. Endosymbionts, in particular, exhibit strict vertical transmission, closely mirroring the evolutionary trajectories of their insect hosts [60]. For example, the symbiotic relationship between Ca. C. ruddii and D. citri is well-established through systematic development [61]. Analyzing the genomic characteristics of Ca. C. ruddii offers a useful tool for understanding the evolutionary history of its host [62], revealing a pattern of parallel evolution. Notably, haplotype network and population structure analyses show genetic distinctions between the citrus canker pathogen and its endosymbionts, Ca. C. ruddii, consistent with prior research [63]. This discrepancy may result from the faster evolution of endosymbionts’ genes compared to their hosts, facilitating the inference of evolutionary and geographical relationships among recently differentiated host species [64]. Differences in generation time, mutation rates, or the significance of interactions may cause endosymbionts to evolve more rapidly than their hosts [65,66]. Additionally, host dispersal plays a pivotal role in determining gene flow and genetic structure among symbiotic populations [67,68].
In the haplotype network diagram of Ca. C. ruddii, the two predominant haplotypes were C1 and C2. These haplotypes were present in nearly all sampling sites, except for a few distributions in Sichuan and Yunnan provinces, where ZJWZ was absent. Additionally, C2 and C1 differed by only one mutation base, suggesting that they could be considered ancestral haplotypes of Ca. C. ruddii. The haplotype network diagram of Ca. C. ruddii can be categorized into two distinct groups, namely Group A and Group B. Notably, the 15 haplotypes comprising Group B are predominantly concentrated in southwestern China, suggesting the formation of a unique subpopulation of Ca. C. ruddii in this region. By synthesizing insights from this study with previous research advancements, it is speculated that southwest China is one of the diffusion points of Ca. C. ruddii in China. The absence of common haplotypes C1 and C2 in Sichuan and Yunnan provinces suggests that the primary source of Ca. C. ruddii in these regions are neighboring areas, such as Guizhou and Guangxi, although artificial transmission cannot be ruled out [38]. Notably, all 30 individuals from ZJWZ belong to haplotype C66, unique to Zhejiang province, with only one base variation from C66 and C2. This indicates that the Zhejiang Ca. C. ruddii populations have evolved a unique haplotype adapted to the local environment [69]. In Fujian, Guangdong, Hunan, and Guangxi, the haplotypes are primarily C1 and C2, which suggests these regions are the origin of Ca. C. ruddii diffusion, consistent with the findings of Luo et al. [30]. Regarding the haplotype network structure of D. citri, H1 was the most widely distributed and the common haplotype. Except for the SCCP and SCLZ populations, the haplotype structure of the Sichuan and Yunnan provinces are similar to that of Ca. C. ruddii, where the number of ancestral haplotypes is small, and the dominant haplotypes are H63 and H65. These two haplotypes are found only in Sichuan and Yunnan. Geographical distribution is considered one of the most critical factors influencing the population genetics of species [70]. However, the GZQXN haplotypes are all H23, and apart from GZQXN, H23 is found only in Guangxi and SCLZ, suggesting that the D. citri in the GZQXN area originated from Guangxi.
Currently, HLB has been reported in 11 provinces (autonomous regions) and 365 counties (cities and districts) in China (moa.gov.cn). Notably, data from 2022 reveal that HLB had already been detected in Xinning County, Shaoyang City, Hunan Province, as early as 2021 [31]. This suggests that the distribution of D. citri is gradually shifting northward, leading to the northward spread of both HLB and D. citri [71,72,73,74]. This study identifies specific areas as HLB diffusion frontier areas, defined as the northernmost regions of provinces where HLB has been reported, according to the Ministry of Agriculture and Rural Affairs of China. Additionally, these areas also include regions where D. citri were detected during the study period. The primary strategy for controlling the spread of HLB is to prevent and manage D. citri, the transmission vector. In this study, D. citri samples were collected from both HLB-affected areas and diffusion frontiers. Their mitochondrial DNA and the diversity of primary endosymbionts were analyzed to provide valuable data.
The results showed that the genetic diversity of D. citri and Ca. C. ruddii in the HLB diffusion frontier areas was lower than in the HLB epidemic areas. This is attributed to the shorter colonization time and lower evolutionary degree of populations in the HLB diffusion frontier areas. The population variation of Ca. C. ruddii in these areas were primarily within the populations, indicating a direct correlation to its single origin. Notably, 10 common haplotypes (H1, H15, H16, H17, H23, H30, H42, H47, H54, and H63) were shared between D. citri in the HLB diffusion frontier and epidemic areas, providing key evidence of the genetic relationship between the two regions. Additionally, D. citri in the HLB diffusion frontier areas of Zhejiang Province may be transmitted by GDQY via JXNF, while D. citri in Hunan Province may be transmitted by Guangxi via HNYZ and HNCZ. Similarly, D. citri in the HLB diffusion frontier areas of Jiangxi Province may be transmitted by Guangdong via JXAY, JXND, and JXNF. Additionally, SCXZ D. citri may be transmitted by SCPZH via SCLS. The study also indicated that the evolution of Ca. C. ruddii is more conservative than that of D. citri. Eight common haplotypes (C1, C2, C14, C18, C20, C31, C48, and C66) were shared between D. citri in the HLB diffusion frontier and Ca. C. ruddii in the HLB epidemic areas. Based on these findings, it is speculated that Ca. C. ruddii in the HLB diffusion frontier areas of Zhejiang Province spread from Guangxi through Jiangxi, with some spread occurring through the ZJWZ and ZJTZ epidemic areas. Similarly, Ca. C. ruddii in the HLB diffusion frontier areas of Sichuan Province may be transmitted by SCPZH and SCLS in Guangxi.
It is generally hypothesized that there are three invasion routes for D. citri in China. The first route involves an eastward spread from Yunnan Province to Sichuan, Guizhou, and Guangxi. The second route entails a northeastward expansion from Guangdong Province to Fujian, Jiangxi, and Zhejiang. The third route is a northwestward spread from Guangdong Province to Guangxi, Guizhou, and Hunan. This aligns with the route predicted by Luo et al. [30]. Therefore, these data suggest multiple introduction events in China [75].
The neutral test and single-peak mismatch distributions yielded significantly negative results for both D. citri and Ca. C. ruddii populations, as well as for both the HLB diffusion frontier and epidemic areas. These findings indicate historical population expansion. The two key factors that may have influenced this expansion are the growth of citrus plantation areas [69] and environmental changes [76,77,78].
In assessing potential suitable areas for HLB and D. citri, it was found that the Chongqing and Hubei provinces offer suitable habitats for D. citri [71,72,73,74], posing a serious threat to China’s citrus industry. Effective HLB management should not only focus on prevention and control within epidemic areas but also include comprehensive surveillance of D. citri. This involves determining their annual distribution and eradicating D. citri from areas where HLB has not yet occurred, in order to prevent further northward expansion of the disease.
5. Conclusions
We investigated the genetic diversity of D. citri and Ca. C. ruddii in both the frontier and epidemic areas of HLB in China. The analysis revealed that both species exhibited high Hd, but low π in China. Interestingly, similar genetic structures were observed across diverse regions, including both the frontier and epidemic areas of HLB. Based on the haplotype distribution across regions, we propose three potential invasion routes: (1) Guangdong spreading northeast, (2) Guangdong spreading west and northwest, and (3) Yunnan spreading east. Additionally, we found that D. citri populations in the frontier areas of HLB primarily originate from nearby epidemic areas, although the possibility of artificial transmission cannot be ruled out. Therefore, this study aims to provide valuable insights into the potential northward expansion of D. citri, facilitating better understanding and management of this devastating citrus pest.
Author Contributions
Conceptualization, J.Y., A.-J.H., J.Z. and L.Y.; methodology, J.Y., A.-J.H., J.Z. and L.Y.; software, J.Y., P.Y., X.L. and H.L.; investigation, J.Y., P.Y. and X.L.; formal analysis, J.Y., A.-J.H., J.Z. and L.Y.; data curation, J.Y., A.-J.H. and J.Z.; supervision and funding acquisition, L.Y.; writing—original draft preparation, J.Y.; writing—review and editing, J.Y. and L.Y. All authors have read and agreed to the published version of the manuscript.
Funding
This research was supported by the Science and Technology Project of Jiangxi Province (20225BCJ22005), and the National Natural Science Foundation of China (32160625).
Institutional Review Board Statement
Not applicable.
Data Availability Statement
The data presented in this study are available in an article.
Conflicts of Interest
The authors declare no conflicts of interest.
References
- Garnier, M.; Danel, N.; Bové, J.M. The Greening Organism is a Gram-Negative Bacterium. Proc. Conf. Int. Organ. Citrus Virol. 1984, 9, 115–124. [Google Scholar] [CrossRef]
- Jagoueix, S.; Bové, J.M.; Garnier, M. The phloem-limited bacterium of greening disease of citrus is a member of the alpha subdivision of the Proteobacteria. Int. J. Syst. Bacteriol. 1994, 44, 79–386. [Google Scholar] [CrossRef]
- Garnier, M.; Jagoueix-Eveillard, S.; Cronje, P.R.; Le-Roux, H.F.; Bové, J.M. Genomic characterization of a Liberibacter present in an ornamental rutaceous tree, Calodendrum capense, in the Western Cape Province of South Africa. Proposal of ‘Candidatus Liberibacter africanus subsp. capensis’. Int. J. Syst. Evol. Microbiol. 2000, 50, 19–2125. [Google Scholar] [CrossRef]
- Coletta-Filho, H.D.; Takita, M.A.; Targon, M.L.P.N.; Machado, M.A. Analysis of 16S rDNA Sequences from Citrus Huanglongbing Bacteria Reveal a Different “Candidatus Liberibacter” Strain Associated with Citrus Disease in São Paulo. Plant Dis. 2005, 89, 8–852. [Google Scholar] [CrossRef]
- Teixeira, D.C.; Ayres, J.; Kitajima, E.W.; Danet, L.; Jagoueix-Eveillard, S.; Saillard, C.; Bové, J.M. First Report of a Huanglongbing-Like Disease of Citrus in Sao Paulo State, Brazil and Association of a New Liberibacter Species, Candidatus Liberibacter americanus, with the Disease. Plant Dis. 2005, 89, 107. [Google Scholar] [CrossRef] [PubMed]
- Bové, J.M. Huanglongbing: A destructive, newly-emerging, century-old disease of citrus. J. Plant Pathol. 2006, 88, 7–37. [Google Scholar]
- Zetian, J. Citrus wilt disease (Yu Bao). Taiwan. Agric. News. 1913, 83, 903–914. [Google Scholar]
- Reinking, O.A. Diseases of economic plants in Southern China. Philipp. Agric. 1919, 8, 109–135. [Google Scholar]
- Hu, B.; Rao, M.J.; Deng, X.X.; Pandey, S.S.; Hendrich, C.; Ding, F.; Wang, N.; Xu, Q. Molecular signatures between citrus and Candidatus Liberibacter asiaticus. PLoS Pathog. 2021, 17, e1010071. [Google Scholar] [CrossRef]
- Zhou, C.Y. The status of citrus Huanglongbing in China. Trop. Plant Pathol. 2020, 45, 279–284. [Google Scholar] [CrossRef]
- Hodkinson, I.D.; White, I.M. The Neotropical Psylloidea (Homoptera: Insecta): An annotated check list. J. Nat. Hist. 1981, 15, 491–523. [Google Scholar] [CrossRef]
- Kuwayama, S. Transactions of the Sapporo Natural History Society. Die Psylliden Japans. 1908, 2, 149–189. [Google Scholar]
- Hoffmann, W.E. Diaphorina citri Kuw. (Homoptera: Chermidae), a Citrus Pest in Kwangtung. Lingnan Sci. J. 1936, 15, 127–132. [Google Scholar]
- Oxford University Press. Terceiro Catalogo Dos Insectos Que Vivem Nas Plantas Do Brasil. Univ. Complut. Madr. Serv. Publ. 1936, 37, 469–475. [Google Scholar]
- Yao, T.S.; Zhou, Y.; Zhou, C.Y. Research progress on occurrence and control of Asian citrus psyllid. J. Fruit Trees. 2018, 35, 1413–1421. [Google Scholar]
- Halbert, S.E.; Manjunath, K.L. Asian citrus psyllids (Sternorrhyncha: Psyllidae) and greening disease in citrus: A literature review and assessment of risk in Florida. Fla. Entomol. 2004, 87, 330–353. [Google Scholar] [CrossRef]
- Hall, G.D.; Richardson, L.M.; Ammar, E.; Halbert, S.E. Asian citrus psyllid, Diaphorina citri, vector of citrus huanglongbing disease. Entomol. Exp. Appl. 2013, 146, 207–223. [Google Scholar] [CrossRef]
- Halbert, S.E.; Nu-Nez, C.A. Distribution of the Asian citrus psyllid, Diaphorina citri kuwayama (Rhynchota: Psyllidae) in the Caribbean basin. Fla. Entomol. 2004, 87, 401–402. [Google Scholar] [CrossRef]
- Boykin, L.M.; Barro, P.D.; Hall, D.G.; Hunter, W.B.; Mckenzie, C.L.; Powell, C.A.; Shatters, R.G. Overview of worldwide diversity of Diaphorina citri Kuwayama mitochondrial cytochrome oxidase 1 haplotypes: Two Old World lineages and a New World invasion. Bull. Entomol. Res. 2012, 102, 573–582. [Google Scholar] [CrossRef]
- Richard, W.H.P.; Jawwad, A.Q.I.; Philip, A.S. Citrus flushing patterns, Diaphorina citri (Hemiptera: Psyllidae) populations and parasitism by Tamarixia Radiata (Hymenoptera: Eulophidae) in Puerto Rico. Fla. Entomol. 2008, 91, 36–42. [Google Scholar]
- Halbert, S.E.; Manjunath, K.L.; Ramadugu, C.; Brodie, M.W.; Webb, S.E.; Lee, R.F. Trailers Transporting Oranges to Processing Plants Move Asian Citrus Psyllids. Fla. Entomol. 2010, 93, 33–38. [Google Scholar] [CrossRef]
- Garnier, M.; Jagoueix, S.; Toorawa, P.; Grisoni, M.; Mallessard, R.; Dookun, A.; Saumtally, S.; Autrey, J.C.; Bobe, J.J. Both Huanglongbing (Greening) Liberobacter Species Are Present in Mauritius and Reunion. Proc. Conf. Int. Organ. Citrus Virol. 1996, 13, 392–394. [Google Scholar] [CrossRef]
- Guillemaud, T.; Ciosi, M.; Lombaert, E.; Estoup, A. Biological invasions in agricultural settings: Insights from evolutionary biology and population genetics. C. R. Biol. 2010, 334, 237–246. [Google Scholar] [CrossRef]
- De-León, J.S.; Setamou, M.; Gastaminza, G.A.; Buenahora, J.; Cáceres, S.; Yamamoto, P.T.; Bouvet, J.P.; Logarzo, G.A. Two separate introductions of Asian citrus psyllid populations found in the American continents. Ann. Entomol. Soc. Am. 2011, 104, 1392–1398. [Google Scholar] [CrossRef]
- Fuentes, A.; Braswell, W.E.; Ruiz-Arce, R.; Racelis, A. Genetic variation and population structure of Diaphorina citri using cytochrome oxidase I sequencing. PLoS ONE 2018, 13, e0198399. [Google Scholar] [CrossRef]
- Lashkari, M.; Manzari, S.; Sahragard, A.; Malagnini, V.; Boykin, L.M.; Hosseini, R. Global genetic variation in the Asian citrus psyllid, Diaphorina citri (Hemiptera: Liviidae) and the endosymbiont Wolbachia: Links between Iran and the USA detected. Pest Manage. Sci. 2014, 70, 1033–1040. [Google Scholar] [CrossRef] [PubMed]
- Guidolin, A.S.; Fresia, P.; Cônsoli, F.L. The genetic structure of an invasive pest, the Asian citrus psyllid Diaphorina citri (Hemiptera: Liviidae). PLoS ONE 2014, 9, e115749. [Google Scholar] [CrossRef]
- Simon, C.; Frati, F.; Beckenbach, A.; Crespi, B.; Liu, H.; Flook, P. Evolution, weighting, and phylogenetic utility of mitochondrial gene sequences and a compilation of conserved polymerase chain reaction primers. Ann. Entomol. Soc. Am. 1994, 87, 651–701. [Google Scholar] [CrossRef]
- Zhang, C.; Xiong, X.; Liu, X.; Zou, Z.; Xin, T.; Wang, J.; Xia, B. Diaphorina citri (Hemiptera: Psylloidea) in China: Two invasion routes and three transmission paths. J. Econ. Entomol. 2019, 112, 1418–1427. [Google Scholar] [CrossRef]
- Luo, Y.; Agnarsson, I. Global mtDNA genetic structure and hypothesized invasion history of a major pest of citrus, Diaphorina citri (Hemiptera: Liviidae). Ecol. Evol. 2018, 8, 257–265. [Google Scholar] [CrossRef]
- Huang, A.J.; Ma, J.Y.; Yang, J.; Chen, B.; Zhou, J.; Yi, L. Genetic diversity and population structure of the Asian citrus psyllid in China. J. Insect Sci. 2024, 24, 2. [Google Scholar] [CrossRef]
- Cui, X.J.; Liu, K.H.; Huang, J.; Fu, S.M.; Chen, Q.D.; Liu, X.; Zhou, C.Y.; Wang, X.F. Population diversity of “Candidatus Liberibacter asiaticus” and Diaphorina citri in Sichuan: A case study for Huanglongbing monitoring and interception. Plant Dis. 2021, 106, 1632–1638. [Google Scholar] [CrossRef] [PubMed]
- Santiago-Rosario, L.Y.; Faldyn, M.J.; Martínez-Cález, E.L.; Rivera-Marchand, B. The Invasion History of Diaphorina citri (Hemiptera: Liviidae) in Puerto Rico: Past, Present, and Future Perspectives. Environ. Entomol. 2023, 52, 259–269. [Google Scholar] [CrossRef] [PubMed]
- Zhang, N.; Zhao, M.; Wang, G.H. Research progress on insect symbiotic microorganisms in disease and pest control. J. Plant Prot. 2022, 49, 220–230. [Google Scholar]
- Baumann, P. Biology of bacteriocyte-associated endosymbionts of plant sapsucking insects. Annu. Rev. Microbiol. 2005, 59, 155–189. [Google Scholar] [CrossRef]
- Nachappa, P.; Levy, J.; Pierson, E.; Tamborindeguy, C. Diversity of endosymbionts in the potato psyllid, Bactericera cockerelli (Triozidae), vector of zebra chip disease of potato. Curr. Microbiol. 2011, 62, 1510–1520. [Google Scholar] [CrossRef] [PubMed]
- Nakabachi, A.; Yamashita, A.; Toh, H.; Ishikawa, H.; Dunbar, H.E.; Moran, N.A.; Hattori, M. The 160-Kilobase Genome of the Bacterial Endosymbiont Carsonella. Science 2006, 314, 267. [Google Scholar] [CrossRef]
- Wang, Y.; Xu, C.; Tian, M.; Deng, X.; Cen, Y.; He, Y. Genetic diversity of Diaphorina citri and its endosymbionts across east and southeast Asia. Pest Manage. Sci. 2017, 73, 2090–2099. [Google Scholar] [CrossRef] [PubMed]
- Wu, F.N.; Dai, Z.H.; Shi, M.; Huang, J.J.; Zhu, H.; Zheng, Y.Z.; Chen, Z.K.; Li, X.H.; Deng, X.L.; Fox, E.G.P. Tracking the geographical distribution of the Asian citrus psyllid Diaphorina citri throughout China using mitogenomes and endosymbionts. J. Pest Sci. 2024, 1–13. [Google Scholar] [CrossRef]
- Zhang, J.H.; Liu, Q.; Dai, L.Y.; Zhang, Z.J.; Wang, Y.S. Pan-Genome Analysis of Wolbachia, Endosymbiont of Diaphorina citri, Reveals Independent Origin in Asia and North America. Int. J. Mol. Sci. 2024, 25, 4851. [Google Scholar] [CrossRef] [PubMed]
- Ajene, I.J.; Khamis, F.; Ballo, S.; Pietersen, G.; Asch, B.V.; Seid, N.; Azerefegne, F.; Ekesi, S.; Mohamed, S. Detection of Asian Citrus Psyllid (Hemiptera: Psyllidae) in Ethiopia: A New Haplotype and its Implication to the Proliferation of Huanglongbing. J. Econ. Entomol. 2020, 113, 1640–1647. [Google Scholar] [CrossRef] [PubMed]
- Oke, A.O.; Oladigbolu, A.A.; Kunta, M.; Alabi, O.J.; Sétamou, M. First report of the occurrence of Asian citrus psyllid Diaphorina citri (Hemiptera: Liviidae), an invasive species in Nigeria, West Africa. Sci. Rep. 2020, 10, 9418. [Google Scholar] [CrossRef]
- Swindell, S.R.; Plasterer, T.N. Seqman. Contig assembly. Methods Mol. Biol. 1997, 70, 75–89. [Google Scholar] [PubMed]
- Kumar, S.; Stecher, G.; Li, M.; Knyaz, C.; Tamura, K. MEGA X: Molecular Evolutionary Genetics Analysis across Computing Platforms. Mol. Biol. Evol. 2018, 35, 1547–1549. [Google Scholar] [CrossRef]
- Librado, P.; Rozas, J. DnaSP v5: A software for comprehensive analysis of DNA polymorphism data. Bioinformatics 2009, 25, 1451–1452. [Google Scholar] [CrossRef] [PubMed]
- Excoffier, L.; Lischer, H.E. Arlequin suite ver 3.5: A new series of programs to perform population genetics analyses under Linux and Windows. Mol. Ecol. Resour. 2010, 10, 564–567. [Google Scholar] [CrossRef] [PubMed]
- Leigh, J.W.; Bryant, D. PopART: Full-Feature Software for Haplotype Network Construction. Methods Ecol. Evol. 2015, 6, 1110–1116. [Google Scholar] [CrossRef]
- Clement, M.; Posada, D.; Crandall, K.A. TCS: A computer program to estimate gene genealogies. Mol. Ecol. 2000, 9, 1657–1659. [Google Scholar] [CrossRef] [PubMed]
- Mantel, N. The detection of disease clustering and a generalized regression approach. Cancer Res. 1967, 27, 209–220. [Google Scholar]
- Peakall, R.; Smouse, P.E. GenAIEx 6.5: Genetic analysis in Excel. Population genetic software for teaching and research--an update. Bioinformatics 2012, 28, 2537–2539. [Google Scholar] [CrossRef] [PubMed]
- Dalmon, A.; Halkett, F.; Granier, M.; Delatte, H.; Peterschmitt, M. Genetic structure of the invasive pest Bemisia tabaci: Evidence of limited but persistent genetic differentiation in glasshouse populations. Heredity 2008, 100, 316–325. [Google Scholar] [CrossRef]
- Nei, M.; Maruyama, T.; Chakraborty, R. The Bottleneck effect and genetic variability in populations. Evolution 1975, 29, 1–10. [Google Scholar] [CrossRef] [PubMed]
- Searle, J.B. Phylogeography—The History and Formation of Species. Heredity 2000, 85, 201–202. [Google Scholar] [CrossRef]
- Barbosa, N.C.C.P.; De, F.S.; Morales, A.C. Distinct genetic structure in populations of Chrysoperla externa (Hagen) (Neuroptera, Chrysopidae) shown by genetic markers ISSR and COI gene. Rev. Bras. Entomol. 2014, 58, 203–211. [Google Scholar] [CrossRef]
- Tajima, F. Statistical method for testing the neutral mutation hypothesis by DNA polymorphism. Genetics 1989, 123, 585–595. [Google Scholar] [CrossRef]
- Fu, Y.X. Statistical tests of neutrality of mutations against population growth, hitchhiking and background selection. Genetics 1997, 147, 915–925. [Google Scholar] [CrossRef]
- Whiteman, N.K.; Parker, P.G. Using parasites to infer host population history: A new rationale for parasite conservation. Anim. Conserv. 2005, 8, 175–181. [Google Scholar] [CrossRef]
- Clay, T. Some problems in the evolution of a group of ectoparasites. Evolution 1949, 3, 279–299. [Google Scholar] [CrossRef] [PubMed]
- Thierry, W.; Axel, M.; Mark, A. Deciphering host migrations and origins by means of their microbes. Mol. Ecol. 2005, 14, 3289–3306. [Google Scholar]
- Bennett, G.M.; Moran, N.A. The advantages and perils of an evolutionary rabbit hole. Proc. Natl. Acad. Sci. USA 2015, 112, 10169–10176. [Google Scholar] [CrossRef]
- Thao, M.L.; Moran, N.A.; Abbot, P.; Brennan, E.B.; Burckhardt, D.H.; Baumann, P. Cospeciation of psyllids and their primary prokaryotic endosymbionts. Appl. Environ. Microbiol. 2000, 66, 2898–2905. [Google Scholar] [CrossRef]
- Hall, A.A.G.; Morrow, J.L.; Fromont, C.; Steinbauer, M.J.; Taylor, G.S.; Johnson, S.N.; Cook, J.M.; Riegler, M. Codivergence of the primary bacterial endosymbiont of psyllids versus host switches and replacement of their secondary bacterial endosymbionts. Environ. Microbiol. 2016, 18, 2591–2603. [Google Scholar] [CrossRef] [PubMed]
- Spaulding, A.W.; Von-Dohlen, C.D. Psyllid endosymbionts exhibit patterns of co-speciation with hosts and destabilizing substitutions in ribosomal RNA. Insect Mol. Biol. 2001, 10, 57–67. [Google Scholar] [CrossRef] [PubMed]
- Moeller, A.H.; Caro–Quintero, A.; Mjungu, D.; Georgiev, A.V.; Lonsdorf, E.V.; Muller, M.N.; Pusey, A.E.; Peeters, M.; Hahn, B.H.; Ochman, H. Cospeciation of gut microbiota with hominids. Science 2016, 353, 380–382. [Google Scholar] [CrossRef] [PubMed]
- Moran, N.A.; Dohlen, C.D.; Baumann, P. Faster evolutionary rates in endosymbiotic bacteria than in cospeciating insect hosts. J. Mol. Evol. 1995, 41, 727–731. [Google Scholar] [CrossRef]
- Bergstrom, C.T.; Lachmann, M. The Red King effect: When the slowest runner wins the coevolutionary race. Proc. Natl. Acad. Sci. USA 2003, 100, 593–598. [Google Scholar] [CrossRef]
- Blouin, M.S.; Yowell, C.A.; Courtney, C.H.; Dame, J.B. Host movement and the genetic structure of populations of parasitic nematodes. Genetics 1995, 141, 1007–1014. [Google Scholar] [CrossRef]
- Criscione, C.D.; Poulin, R.; Blouin, M.S. Molecular ecology of parasites: Elucidating ecological and microevolutionary processes. Mol. Ecol. 2005, 14, 2247–2257. [Google Scholar] [CrossRef]
- Meng, L.X.; Wang, Y.M.; Wei, W.H.; Zhang, H.Y. Population genetic structure of Diaphorina citri Kuwayama (Hemiptera: Liviidae): Host-driven genetic differentiation in China. Sci. Rep. 2018, 8, 1473. [Google Scholar] [CrossRef]
- Yang, X.Q.; Ye, Q.T.; Xin, T.R.; Zou, Z.W.; Xia, B. Population genetic structure of Cheyletus malaccensis (Acari: Cheyletidae) in China based on mitochondrial COI and 12S rRNA genes. Exp. Appl. Acarol. 2016, 69, 117–128. [Google Scholar] [CrossRef] [PubMed]
- Wang, R.L.; Yang, H.; Luo, W.; Wang, M.T.; Lu, X.L.; Huang, T.T.; Zhao, J.P.; Li, Q. Predicting the potential distribution of the Asian citrus psyllid, Diaphorina citri (Kuwayama), in China using the MaxEnt model. PeerJ 2019, 7, e7323. [Google Scholar] [CrossRef] [PubMed]
- Yao, J.M.; Liu, D.; Duan, L.C.; Cai, Z. Estimation of the potential impact range of citrus psylla in China under the CMIP6 climate change scenario. Chin. J. Agrometeorol. 2021, 42, 1031–1041. [Google Scholar]
- Zhao, Y.; Wang, J.G.; Chen, C.; Mao, Q.Y.; Huang, H.C.; Cai, H.; He, X.H. Study on the Potential Suitable Area of Citrus psyllid in Yunnan Based on MaxEnt Niche Model. Yunnan Nongye Daxue Xuebao Ziran Kexue 2022, 37, 61–68. [Google Scholar]
- Liu, D.; Yao, J.M.; Yu, Y.W.; Duan, L.C.; Cai, Z. Changes of suitable areas of citrus psyllid in China under the background of climate warming. J. Plant Prot. 2021, 48, 872–881. [Google Scholar]
- Chen, S.Y.; Su, Y.H.; Wu, S.F.; Sha, T.; Zhang, Y.P. Mitochondrial diversity and phylogeographic structure of Chinese domestic goats. Mol. Phylogenet. Evol. 2005, 37, 804–814. [Google Scholar] [CrossRef] [PubMed]
- Yang, Y.P.; Huang, M.D.; Beattie, G.A.C.; Xia, Y.L.; Ouyang, G.C.; Xiong, J.J. Distribution, biology, ecology and control of the psyllid Diaphorina citri Kuwayama, a major pest of citrus: A status report for China. Int. J. Pest Manag. 2006, 52, 343–352. [Google Scholar] [CrossRef]
- Russell, D.N.; Qureshi, J.A.; Halbert, S.E.; Stansly, P.A. Host Suitability of Citrus and Zanthoxylum Spp. for Leuronota fagarae Burckhardt and Diaphorina citri Kuwayama (Hemiptera: Psylloidea). Fla. Entomol. 2014, 97, 1481–1492. [Google Scholar] [CrossRef]
- Boina, D.R.; Bloomquist, J.R. Chemical control of the Asian citrus psyllid and of huanglongbing disease in citrus. Pest Manag. Sci. 2015, 71, 808–823. [Google Scholar] [CrossRef] [PubMed]
Disclaimer/Publisher’s Note: The statements, opinions and data contained in all publications are solely those of the individual author(s) and contributor(s) and not of MDPI and/or the editor(s). MDPI and/or the editor(s) disclaim responsibility for any injury to people or property resulting from any ideas, methods, instructions or products referred to in the content. |
© 2025 by the authors. Licensee MDPI, Basel, Switzerland. This article is an open access article distributed under the terms and conditions of the Creative Commons Attribution (CC BY) license (https://creativecommons.org/licenses/by/4.0/).