Article

Multidimensional Environmental Drivers of Bamboo Species Richness on Subtropical Islands

College of Landscape Architecture and Art, Fujian Agriculture and Forestry University, Fuzhou 350100, China
*
Authors to whom correspondence should be addressed.
Diversity 2025, 17(1), 46; https://doi.org/10.3390/d17010046
Submission received: 20 December 2024 / Revised: 5 January 2025 / Accepted: 6 January 2025 / Published: 13 January 2025

Abstract

:
Understanding the distribution patterns and driving mechanisms of bamboo species diversity on islands is essential for advancing knowledge of island ecosystem processes and informing strategies for bamboo resource conservation and management. This study utilized standardized major axis regression (SMA) to assess the effects of island area and isolation on bamboo species across 30 islands in Fujian, China. Furthermore, a partial least squares structural equation model (PLS-SEM) was constructed to explore the driving mechanisms underlying bamboo species richness. This analysis incorporated six key environmental factors—island size, isolation, shape, climate, development intensity, and habitat heterogeneity—spanning a total of 12 variables. The primary findings were as follows: (1) Eight genera and twenty-nine bamboo species were identified on Fujian islands. Species richness increased significantly with island area, consistent with the theory of area effects, while isolation had no significant impact on richness. (2) Different reproductive types exhibited distinct responses to environmental conditions. This was evident in the species–area relationship slopes (z-values): SR = 2.07; monopodial = 0.94; sympodial = 0.82; and polycyclic = 0.44. These variations highlight the ecological adaptability and functional traits of different reproductive strategies within island ecosystems. (3) Among the six environmental factors, island area exerted the greatest influence on species richness, underscoring its role as the primary driver of bamboo diversity and reproductive strategies. (4) Island area and isolation also impacted species richness indirectly through their effects on development intensity. In conclusion, the bamboo species richness and reproductive types on Fujian islands are primarily shaped by island area, followed by development intensity and habitat heterogeneity. In contrast, climate, island shape, and isolation play relatively minor roles. This study provides critical insights into the interplay of island area, isolation, shape, climate, development intensity, and habitat heterogeneity in shaping bamboo diversity. The findings offer a valuable foundation for bamboo resource conservation, island ecosystem management, and sustainable development.

1. Introduction

Although islands comprise only 3–5% of the Earth’s land area, they support 15–20% of the planet’s terrestrial species [1]. Due to their isolation, islands are hotspots for species with restricted ranges [2]. This makes islands ideal regions for studying biodiversity and ecological conservation, providing a model system for addressing key questions in biodiversity conservation [3]. The unique characteristics of island ecosystems—geographic isolation, environmental heterogeneity, and limited resources—result in distinctive patterns of plant distribution and adaptation. With their small size and relative geographic isolation, island plants are highly vulnerable to environmental changes. Consequently, studying the distribution patterns of island plants is critical for understanding their mechanisms of response to environmental factors.
The exploration of factors driving island species richness has its roots in the traditional island biogeography theory [4]. The equilibrium theory, introduced by MacArthur and Wilson, suggests that island species richness results from a dynamic balance between immigration and extinction rates [4,5,6]. This theory highlights island area and isolation from the mainland as the primary determinants of species richness, commonly referred to as the “area effect” and “isolation effect” [7,8,9,10,11].
In addition to the area and isolation effects, environmental factors such as elevation [12,13], temperature [10,14,15], rainfall [16,17,18], and wind speed [19] play critical roles in shaping island species richness and distribution patterns. Habitat heterogeneity [20,21] is also a key driver of species richness on islands [14,22,23,24]. However, intensive human activities, including urbanization, unsustainable tourism, and overgrazing, directly threaten the limited habitats of island species [25] Anthropogenic disturbances can significantly alter the species distribution patterns predicted by traditional island biogeography theory [26]. In general, island species richness distribution patterns are determined by the interplay of multiple environmental gradients, and the predictive power of these factors for plant species richness varies depending on spatial scale and geographic location [27]. Consequently, in-depth exploration of the distribution patterns and mechanisms of species richness in specific island ecosystems is of considerable importance.
Species on islands are influenced by environmental factors, and their functional strategies evolve continuously over long periods [28]. Functional traits provide a clear indication of how plants adapt to environmental heterogeneity during their evolutionary history, reflecting strategies for growth, reproduction, and resource utilization [29]. Moreover, these traits reveal the relationships between plants and environmental factors at various spatial scales [30].
Bamboo, as a key component of global terrestrial forest ecosystems, provides significant economic, ecological, and social benefits due to its extensive distribution, rapid growth, high productivity, strong regeneration capacity, and diverse applications with considerable economic value [31,32,33]. China is the world’s leading country in bamboo resources, ranking first globally in species diversity, distribution range, and biomass. According to The Flora of China [34], China is home to 34 genera and 534 species of bamboo. Bamboo plays a crucial role in maintaining ecological balance, driving economic development, conserving soil and water, preventing soil erosion, and serving as a carbon sink. Bamboo exhibits distinctive reproductive traits, which can be divided into three main types: sympodial, monopodial, and polyclinic. Bamboo exhibit unique reproductive characteristics and can be divided into three main types based on their reproductive strategies: sympodial, monopodial, and polycyclic. Sympodial bamboo rhizomes cannot spread long distances underground, and new shoots are connected to the parent bamboo by short stalks, resulting in a clustered distribution. Monopodial bamboo rhizomes can extend long distances underground, facilitating a more dispersed growth pattern. Polycyclic bamboo combines the rhizome characteristics of both sympodial and monopodial types, exhibiting traits from both growth strategies [35]. The evolutionary progression of bamboo, from sympodial clumping to polycyclic and finally to monopodial types, reflects its adaptation to complex and changing environments through structural evolution to optimize resource acquisition [36]. On islands, with their geographical isolation, limited area, and habitat heterogeneity, bamboo reproductive types exhibit distinct adaptive strategies. Thus, investigating how environmental factors affect the species richness of bamboo with different reproductive types on islands is essential for understanding the influence of island scale, isolation, shape, climate, development intensity, and habitat heterogeneity on bamboo diversity and spatial heterogeneity.
Fujian Province is home to numerous islands with wide variations in area and isolation distances. The islands exhibit diverse landscape features, including topography, coastline length, and elevation, making them ideal for studying plant distribution and the environmental factors driving it. Fujian’s subtropical maritime monsoon climate reflects the characteristics of subtropical island plant diversity in China. However, in recent years, increasing development and human activities in island areas have exerted growing pressure on the ecosystems of Fujian’s islands. The expansion of coastal development and tourism has led to habitat fragmentation and degradation of bamboo species, posing potential threats to the biodiversity and ecosystems of Fujian’s islands. Understanding the relationship between bamboo species richness and environmental factors can provide a scientific basis for relevant authorities in conserving and rationally utilizing bamboo resources on islands. Therefore, this study selected 30 islands in Fujian as research objects to investigate the species richness of bamboo on these islands. Our research aimed to reveal the species–area relationship, area effect, and isolation effect on the species richness of bamboo and its different reproductive types. Furthermore, this study analyzed the roles of environmental factors such as island scale, isolation, shape, climate, development intensity, and habitat heterogeneity in driving the species richness of bamboo and its reproductive types. This investigation seeks to uncover the spatial heterogeneity and distribution patterns of bamboo and its reproductive types on islands. The findings not only enhance understanding of bamboo diversity in island ecosystems but also provide theoretical guidance for the conservation and sustainable development of bamboo resources in the future.

2. Materials and Methods
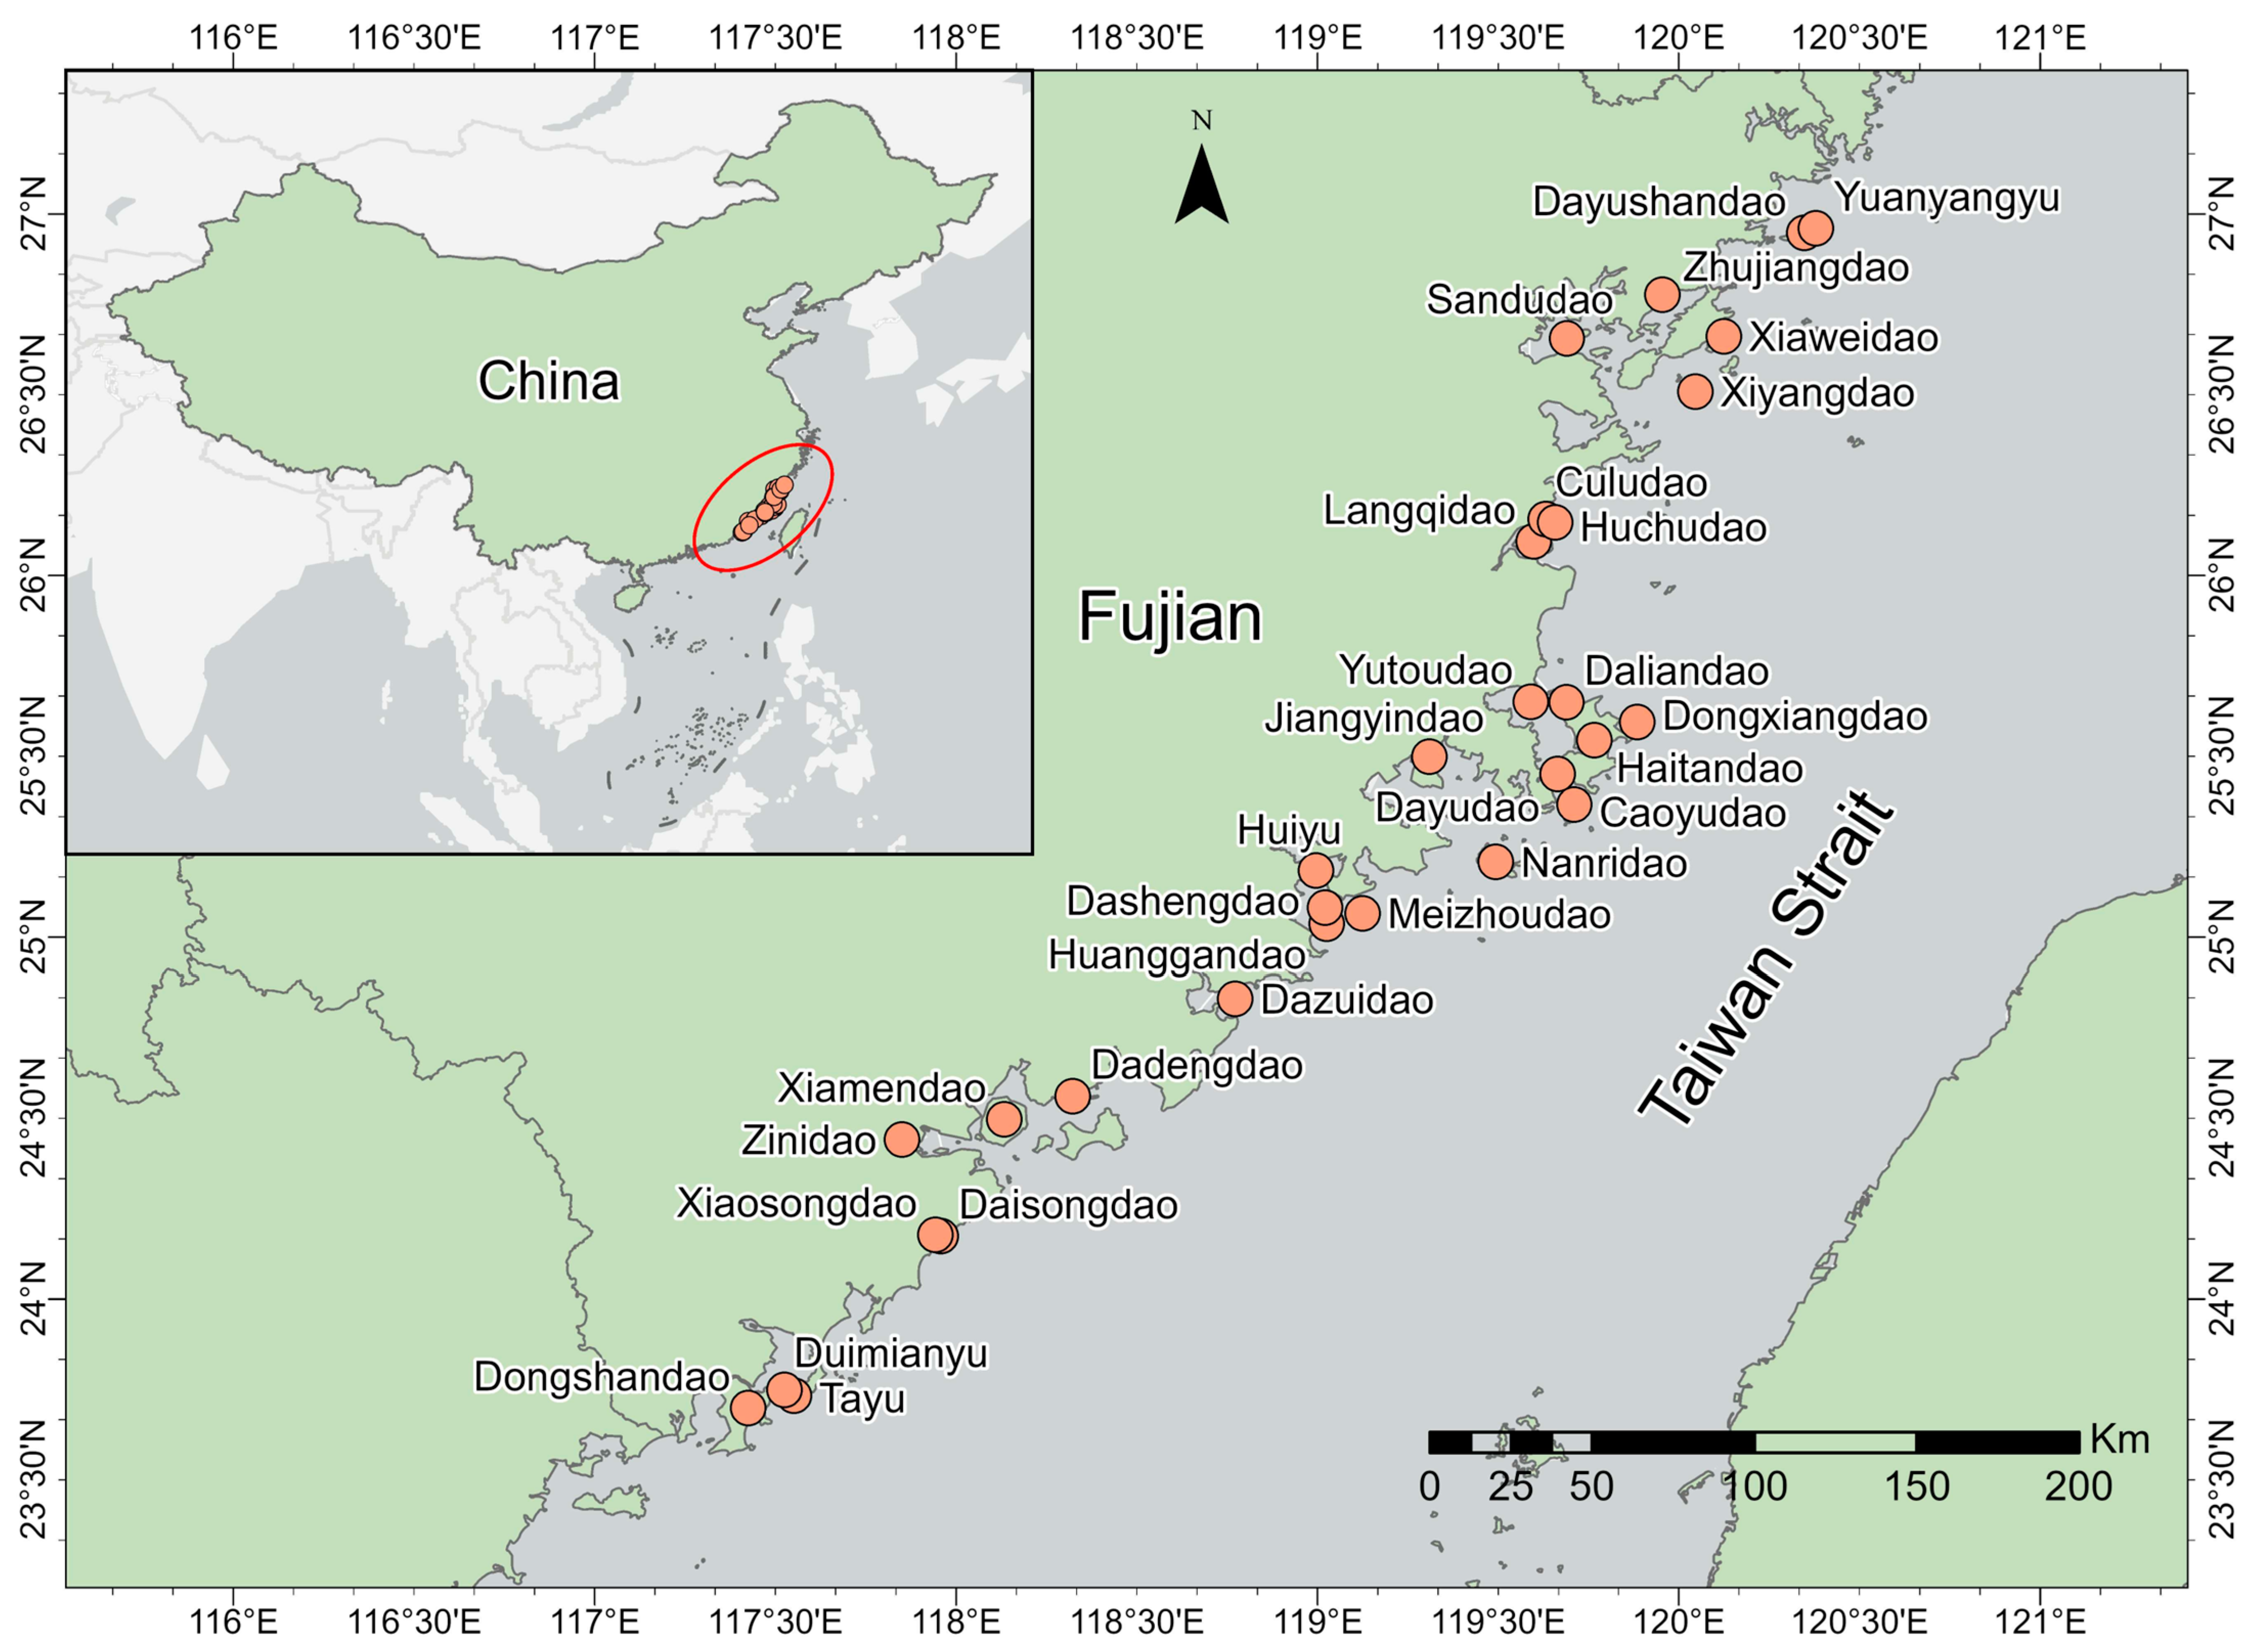
2.1. Study Area

Fujian Province is situated on the southeastern coast of China, bordering the Taiwan Strait. The region experiences a subtropical maritime monsoon climate, with an annual average temperature ranging from 15.2 to 21.0 °C and average annual precipitation between 1000 and 1600 mm. The dominant vegetation types on the islands include evergreen coniferous forests, evergreen broad-leaved forests, and shrub-grass communities. This study focused on islands that were accessible and covered with vegetation. The selected study area encompasses the entire maritime region of Fujian Province, representing variations in island attributes such as area, isolation, climate, and human disturbances. Island selection was based on differences in area, elevation, isolation, human activity impacts, and climatic conditions, ensuring coverage of islands with distinct environmental gradients. This study examined 30 islands located in the maritime region of Fujian Province (117°31′61″–120°68′66″ E, 23°60′90″–26°93′08″ N) (Figure 1).

2.2. Species Data Collection

During the growing seasons of 2018 and 2022 (May to July and September to November), comprehensive surveys were conducted on 30 islands in Fujian to systematically document all plant species. Transect surveys served as the primary method, supplemented by quadrat surveys. Drone aerial photography was employed to investigate inaccessible areas such as island edges and cliffs. For small islands with an area of less than 1 km2, the entire island was surveyed. Each island featured 3 to 10 transects, with each transect surveyed at least twice [37]. For islands ranging from 1 to 10 km2, 6 to 20 transects were established, with a combined total length exceeding 12 km. On islands larger than 10 km2, in addition to the aforementioned methods, transects were concentrated around prominent mountain features [38], and detailed species information within these transects was recorded.
To ensure comprehensive species documentation, typical bamboo plant community types were identified following the transect surveys, and standard quadrats measuring 20 m × 20 m were established. All plant species within the quadrats were meticulously documented. Geographic information for each quadrat, including latitude, longitude, elevation, slope, and terrain, was carefully recorded [39]. Fieldwork also included photographic documentation and specimen collection, with all voucher specimens deposited in the herbarium of the College of Landscape Architecture and Art, Fujian Agriculture and Forestry University. Bamboo species were identified according to The Flora of China [40] and classified into three reproductive types: monopodial, sympodial, and polycyclic. Ultimately, data on the distribution of bamboo species across the 30 islands in Fujian were compiled.

2.3. Environmental Variables of Islands

To investigate how environmental factors influence bamboo species richness and the richness of different reproductive types on islands, this study initially identified 30 variables spanning 6 categories: climate, island scale, shape, isolation, development intensity, and habitat heterogeneity.

2.3.1. Climate

The climate factors encompass 20 variables, including Bio 1–Bio 19 bioclimatic variables and annual mean wind (AMW). The 19 bioclimatic variables consist of annual mean temperature (Bio 1), mean diurnal range (Bio 2), isothermality (Bio 3), temperature seasonality (Bio 4), max temperature of warmest month (Bio 5), min temperature of coldest month (Bio 6), temperature annual range (Bio 7), mean temperature of wettest quarter (Bio 8), mean temperature of driest quarter (Bio 9), mean temperature of warmest quarter (Bio 10), mean temperature of coldest quarter (Bio11), annual precipitation (Bio 12), precipitation of wettest month (Bio 13), precipitation of driest month (Bio 14), precipitation seasonality (Bio 15), precipitation of wettest quarter (Bio 16), precipitation of driest quarter (Bio 17), precipitation of warmest quarter (Bio 18), and precipitation of coldest quarter (Bio 19).
The Bio 1–Bio 19 bioclimatic data were sourced from the WorldClim database, which provides global bioclimatic variables (http://www.worldclim.org, accessed on 1 March 2024). Annual mean wind data were obtained from NOAA’s 10 m resolution wind vector map (https://www.noaa.gov, accessed on 5 February 2024). Climate data for the 30 islands in Fujian were derived using the Kriging interpolation method, based on the geographic coordinates of each island. All datasets were extracted and analyzed using ArcGIS 10.8 software.

2.3.2. Island Scale

Island scale factors consist of two variables: area (A) and maximum elevation (ELE).

2.3.3. Shape

Island shape is characterized by two variables: the perimeter area ratio (PAR) and the fractal dimension (FD).
PAR is defined as the ratio of perimeter to area (PAR = perimeter/area) and is used to measure the proportion of edge habitats (e.g., coastlines) relative to interior habitats. A higher PAR value indicates a longer perimeter relative to the area, suggesting a higher proportion of edge habitats [41].
The fractal dimension (FD) is used to quantify the complexity of island shapes and is computed using the following formula. In this formula, Hd(S) represents the Hausdorff measure of a set S in dimension d; limδ→0 denotes the limit as the diameter of the covering subsets (δ) approaches zero; inf signifies the infimum, or the smallest value, over all possible coverings; and diam Si < δ specifies that the diameter of each subset Si must be smaller than δ. A higher FD value indicates a more irregular island shape.
H d S = l i m δ 0 i n f i = 1 d i a m   S i d : S i = 1 S i , d i a m   S i < δ

2.3.4. Isolation

We measured the accessibility of islands using the distance from the nearest continent (DNC). DNC is a common factor affecting the frequency of visits by residents and tourists and is a quantitative indicator of island isolation used to measure the degree of isolation of islands [37]. It represents the isolation effect in the theory of island biogeography.
Additionally, to more accurately reflect the remoteness of islands, we referred to the method proposed by Weigelt and Kreft [42] to calculate the stepping stone distance (SSD), which describes the connection points or “stepping stones” for species during migration, dispersion, or between populations. “Stepping stones” enable species to move between their habitats. This distance considers the proximity to both the nearest continent and the nearest large island.

2.3.5. Development Intensity and Anthropogenic Disturbance

The proportion of buildings and farmland area (BFA) was used to represent human activities on the islands. To better capture the development intensity and anthropogenic disturbance of the islands, the number of docks (ND) and the number of land bridges (NLB) were included as additional environmental factors for analysis.
Data on island area, perimeter, DNC, DNI, SSD, NLB, and BFA were obtained from the 2020 global 30 m resolution land cover vector map released by the Aerospace Information Research Institute, Chinese Academy of Sciences (https://data.casearth.cn, accessed on 7 March 2024). These data were extracted using the “mask extraction” technique. Elevation data were derived from the 30-m resolution DEM dataset provided by the Geospatial Data Cloud (http://www.gscloud.cn, accessed on 20 March 2024), from which the highest elevation point was extracted. All data were processed and analyzed using ArcGIS 10.8 software.

2.3.6. Habitat Heterogeneity

The Area-Based Rao’s Index (Q) was utilized to assess the habitat heterogeneity and spatial distribution characteristics of 30 islands in Fujian. This index is a diversity metric that incorporates species relative abundance, interspecies similarity, and spatial distribution features [43]. Compared to conventional diversity indices, such as the Shannon–Wiener Index and the Simpson Index, the Area-Based Rao’s Index integrates spatial structural information, offering a more comprehensive and accurate assessment of habitat heterogeneity across islands.
In this study, the Area-Based Rao’s Index was implemented using the rasterdiv [44] R package and calculated following specific steps. The primary data source was the S2A data product from Copernicus Sentinel-2 (https://www.copernicus.eu/en, accessed on 9 November 2024). Normalized Difference Vegetation Index (NDVI) data were acquired from satellite images taken within 15 days before and after the survey dates. NDVI was processed to capture the spatial heterogeneity and vegetation coverage of island ecosystems, serving as the baseline input for diversity calculations.
Subsequently, the Area-Based Rao’s Index (Q) for each island was computed using NDVI raster data. The formula for the Rao’s index is presented as follows:
Q = i = 1 S j = 1 S P i P j d i j A i A j
Q, the Area-Based Rao’s Index, quantifies community diversity and heterogeneity; P i and P j denote the relative abundances of species i and j, respectively, indicating their frequencies of occurrence in the sample; d i j signifies the similarity or dissimilarity between species ii and j, which can be measured as functional distance, genetic distance, or other related metrics; and Ai and Aj are the area weights of the regions inhabited by species i and j, respectively, incorporated to account for the effects of spatial distribution differences.

2.4. Data Analysis

Before constructing the model, collinearity among environmental factors was assessed using the variance inflation factor (VIF) [45]. The results indicated that all 12 environmental factors (Table A1)—Bio 6 (min temperature of coldest month) and Bio 14 (precipitation of driest month) from the climate factors; area, elevation, PAR, FD from the island attribute factors; and DNC, SSD, ND, NLB, BFA, and Area-Based Rao’s Index from the anthropogenic disturbance factors—had VIF values below 6, well below the maximum threshold of 10, suggesting weak collinearity effects.
To mitigate potential bias caused by collinearity among variables, we employed the variance inflation factor (VIF) [45] to assess collinearity among environmental factors and identified variables with minimal collinearity. Ultimately, 12 environmental factors with low collinearity were selected (Table A1). These included Bio 6 (minimum temperature of the coldest month) and Bio 14 (precipitation of the driest month) from climate factors; area, elevation, PAR, and FD from island attributes; and DNC, SSD, ND, NLB, BFA, and the Area-Based Rao’s Index from anthropogenic disturbance factors. All these variables had VIF values below 6, well below the maximum threshold of 10 [46], indicating weak collinearity and their appropriateness as core variables for subsequent analysis. To further confirm that the spatial distribution of the selected environmental factors was dominated by random processes and that spatial location had no significant effect on data distribution, spatial autocorrelation was assessed using Global Moran’s I [47]. The results revealed no significant spatial autocorrelation among the 12 environmental factors (p > 0.05), indicating that the distribution of environmental factors was random and that spatial factors could be disregarded.
Species accumulation curves were employed to assess the adequacy of bamboo species surveys conducted on Fujian islands [48]. To investigate the relationship between species richness, island area, and isolation, the Standardized Major Axis Tests and Routines (SMATR) [49] package in R was utilized, applying the standardised major axis (SMA) regression method for analysis.
The Pearson correlation coefficient was applied to examine the relationships among island environmental factors, with Bonferroni correction used to adjust significance levels. Subsequently, the Mantel test [49], calculated using Euclidean distance, was conducted to assess the correlations between the matrix of island environmental factors and the matrices of bamboo species and species with different reproductive strategies on the islands.
To explore the combined effects of multiple environmental factors on bamboo species richness and different reproductive types, this study employed partial least squares structural equation modeling (PLS-SEM) for analysis. PLS-SEM is well-suited for analyzing complex causal pathways by maximizing the explained variance (R2) of dependent variables without requiring a normal distribution assumption [50]. First, all independent and dependent variables were standardized to eliminate the influence of variable scale differences. Subsequently, a structural equation model was constructed using the SEMinR package in R, incorporating bamboo species richness, different reproductive types, and 12 environmental factors. Latent variables were defined by their observed indicators, and path coefficients were used to represent the direct effects between variables. To ensure the predictive power of the model, it was optimized based on R2 values and the significance of path coefficients (p-values). Additionally, to assess the relative contributions of different environmental factors, the direct and indirect effects in the model were decomposed to quantify each factor’s total impact on species richness. The reliability and validity of the model were evaluated using composite reliability (CR) and average variance extracted (AVE) to ensure the measurement model’s robustness [51]. All analyses were performed in the R 4.2.2 software environment.

3. Results and Analysis

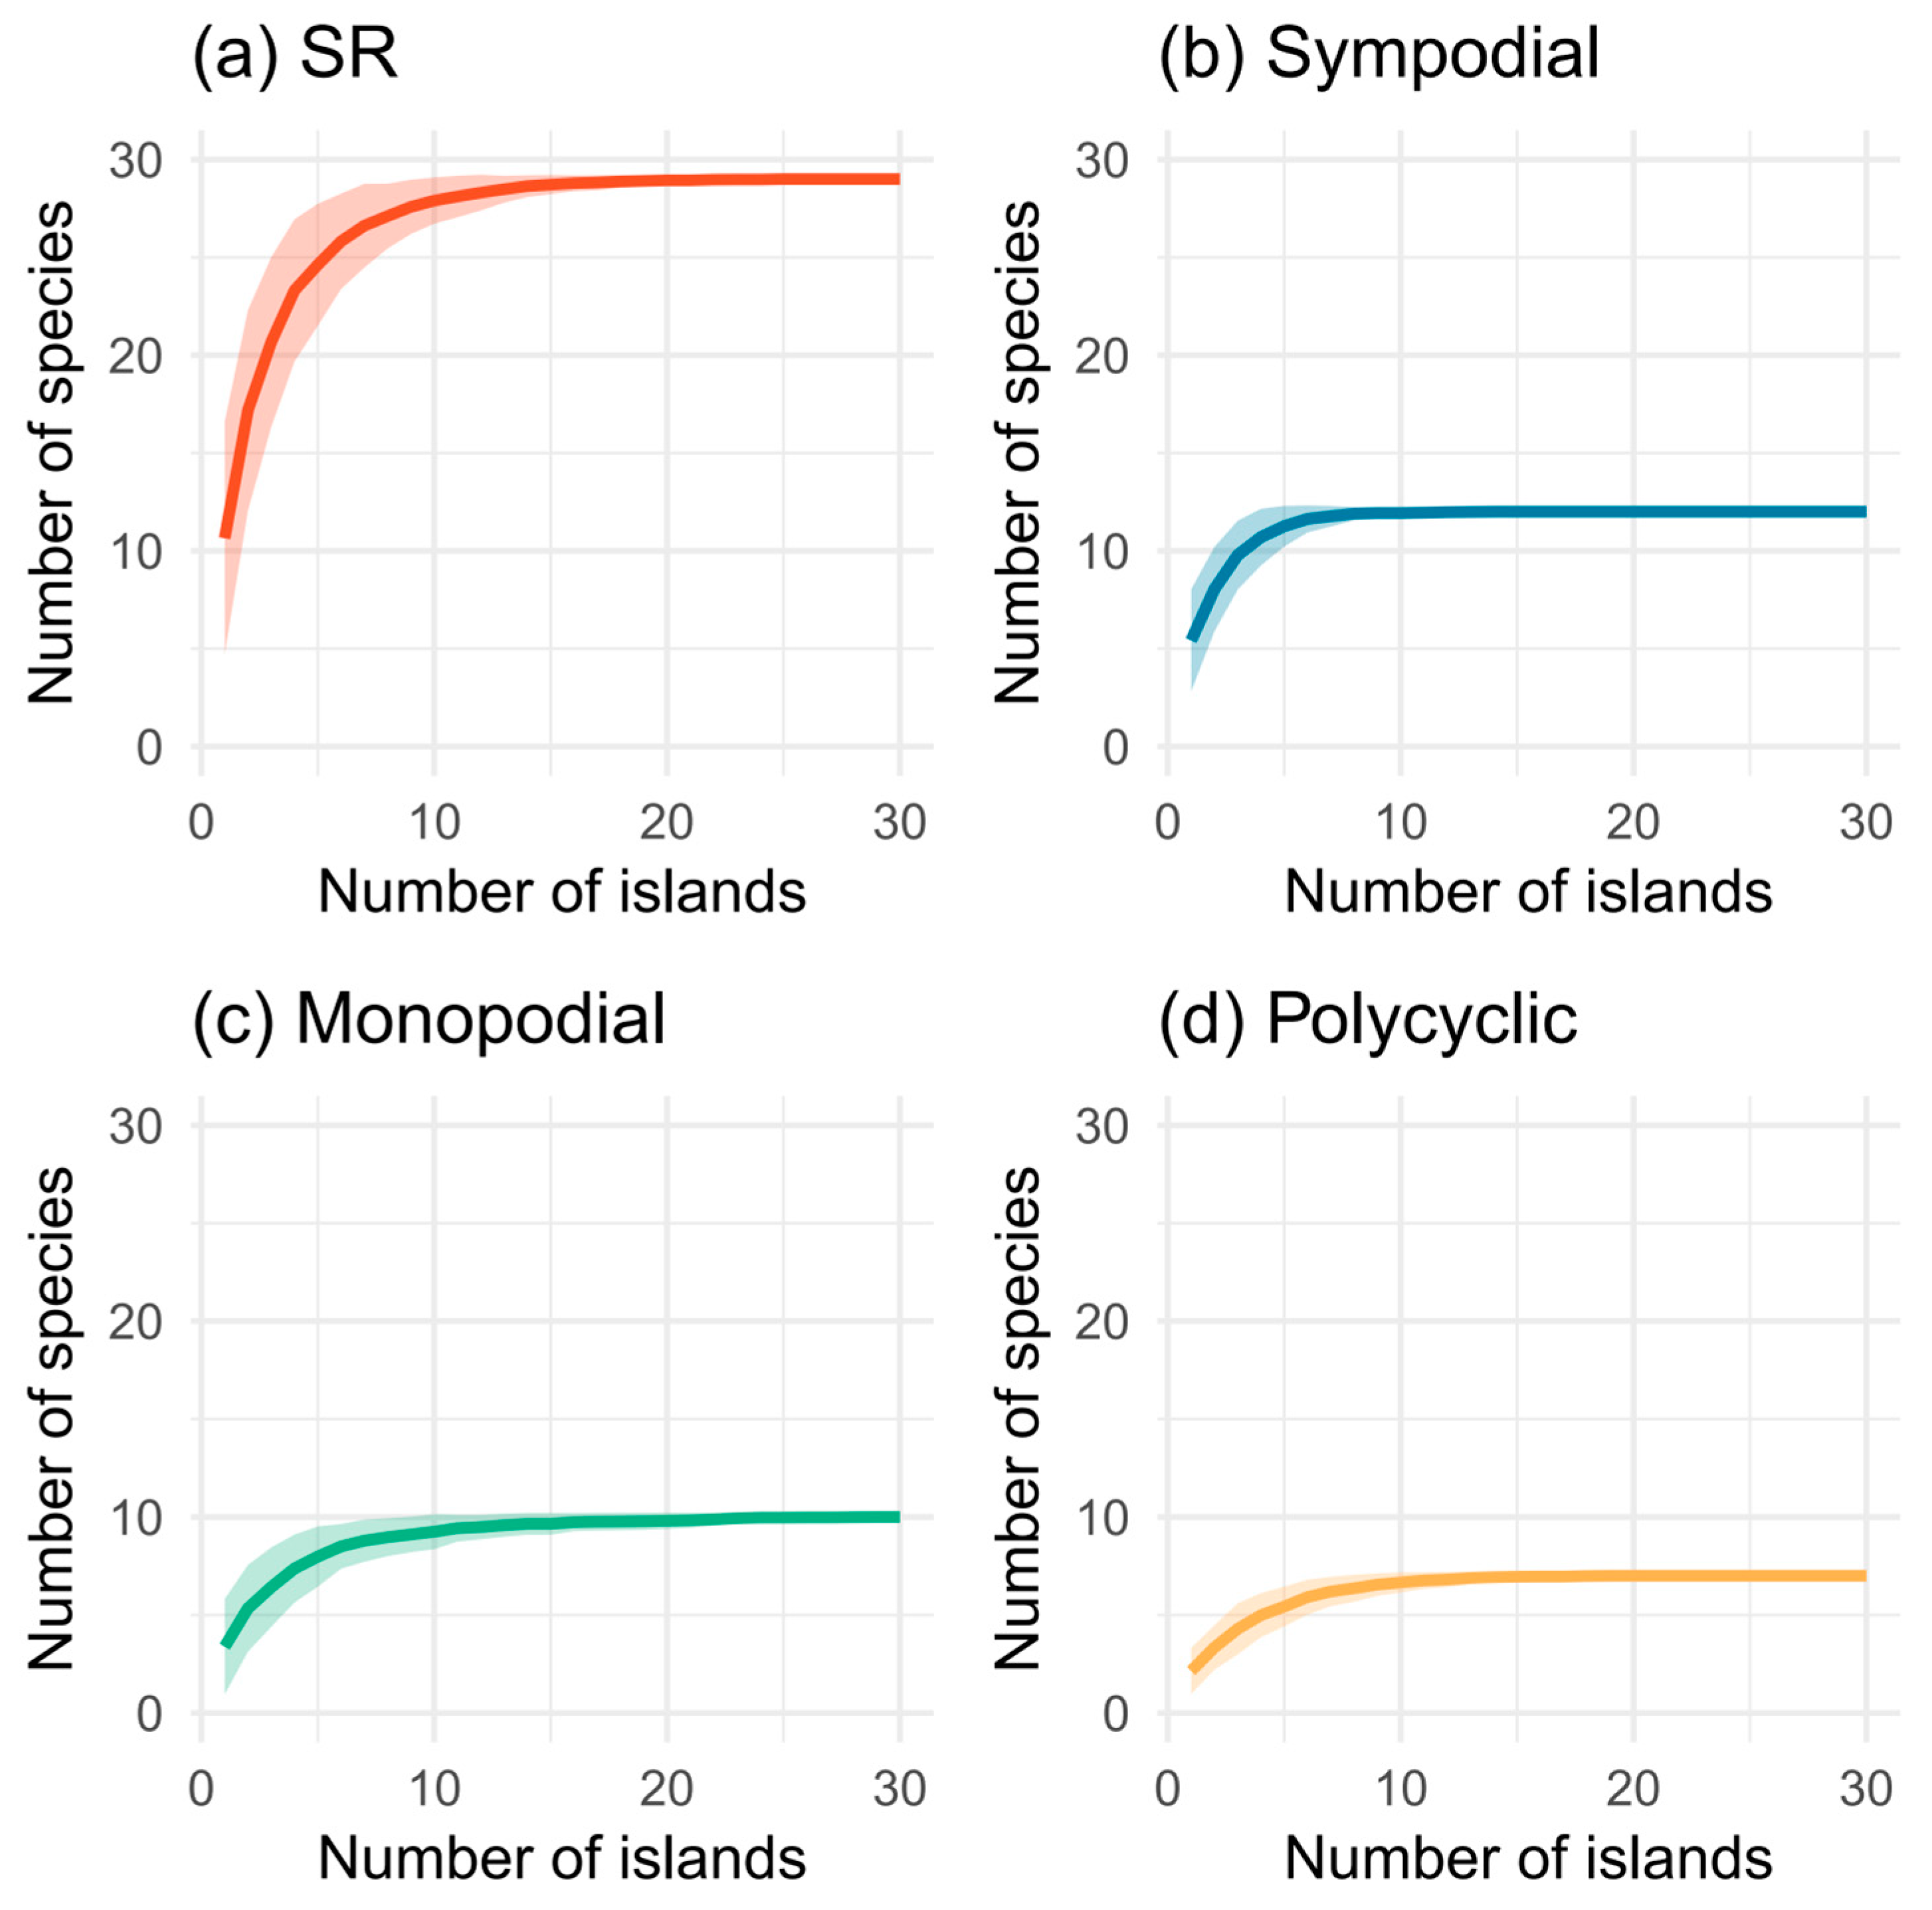
3.1. Composition of Bamboo Species on Islands

A total of 8 genera and 29 bamboo species were identified across 30 islands in Fujian Province (Table A2). Of these, 12 species were Sympodial, representing 41.38% of the total; 10 species were monopodial, accounting for 34.48%; and 7 species were polycyclic, comprising 24.14%. Phyllostachys edulis exhibited the highest distribution frequency, occurring on 25 islands (86.21%), followed by Dendrocalamus latiflorus, recorded on 24 islands (82.75%). Species with the lowest distribution frequency included Phyllostachys nigra, found on only two islands. Furthermore, the islands also hosted bamboo species endemic to China, such as Phyllostachys sulphurea, Indocalamus tessellatus, and Phyllostachys heteroclada.
The species accumulation curve (Figure 2) illustrates that as the number of sampled islands increases, SR and the species counts of bamboo plants with different reproductive types initially rise rapidly, followed by a gradual slowdown in growth. The cumulative curve for polycyclic is relatively flat due to their lower abundance on Fujian islands. Nevertheless, the overall bamboo species data appear consistent, indicating that the survey of bamboo species across the 30 islands was comprehensive and sufficient.

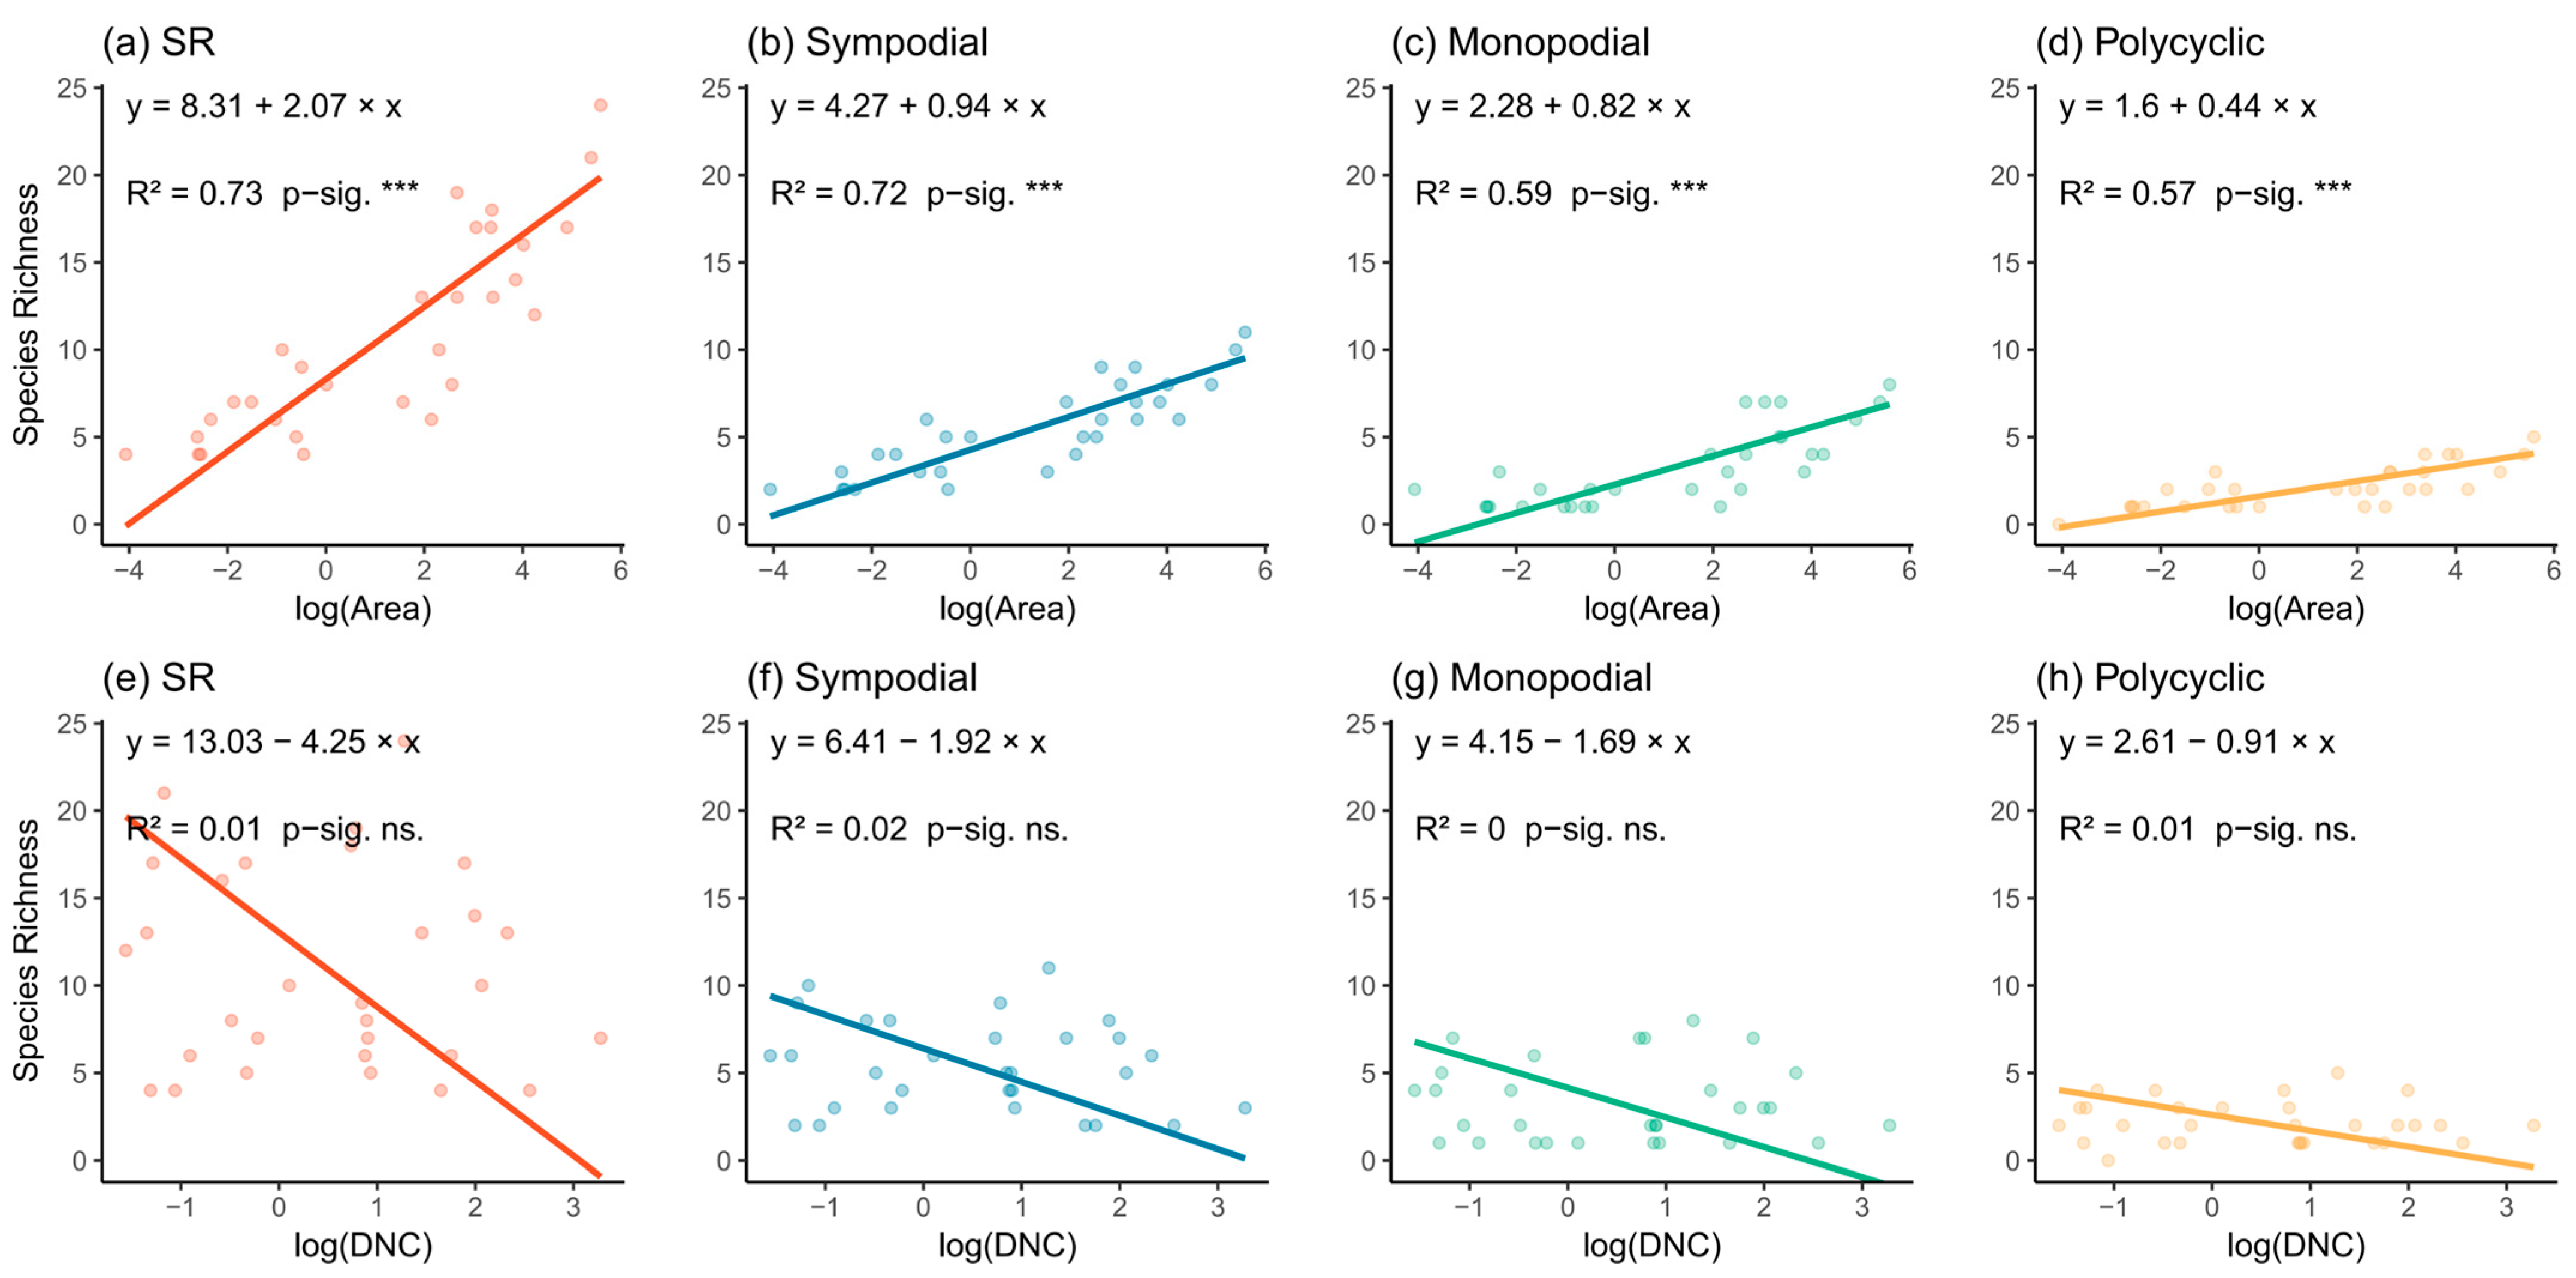
3.2. Relationship Between Species Richness, Island Area, and Isolation

The species richness (SR) of bamboo plants, as well as different reproductive types, demonstrated a positive correlation with increasing island area. The proportion of variance explained by area (R2) for each richness category was as follows: SR (R2 = 73%), sympodial (R2 = 72%); monopodial (R2 = 59%); and polycyclic (R2 = 57%) (Figure 3). The slopes (z-values) of the species–area relationship were as follows: SR = 2.07; sympodial = 0.94; monopodial = 0.82; and polycyclic = 0.44. Furthermore, as illustrated in Figure 3, the distance to the nearest continent, an indicator of isolation effects, exhibited no significant relationship with SR or any reproductive types (p > 0.05). This suggests that the SR and reproductive types of bamboo species on islands are only marginally affected by isolation effects.

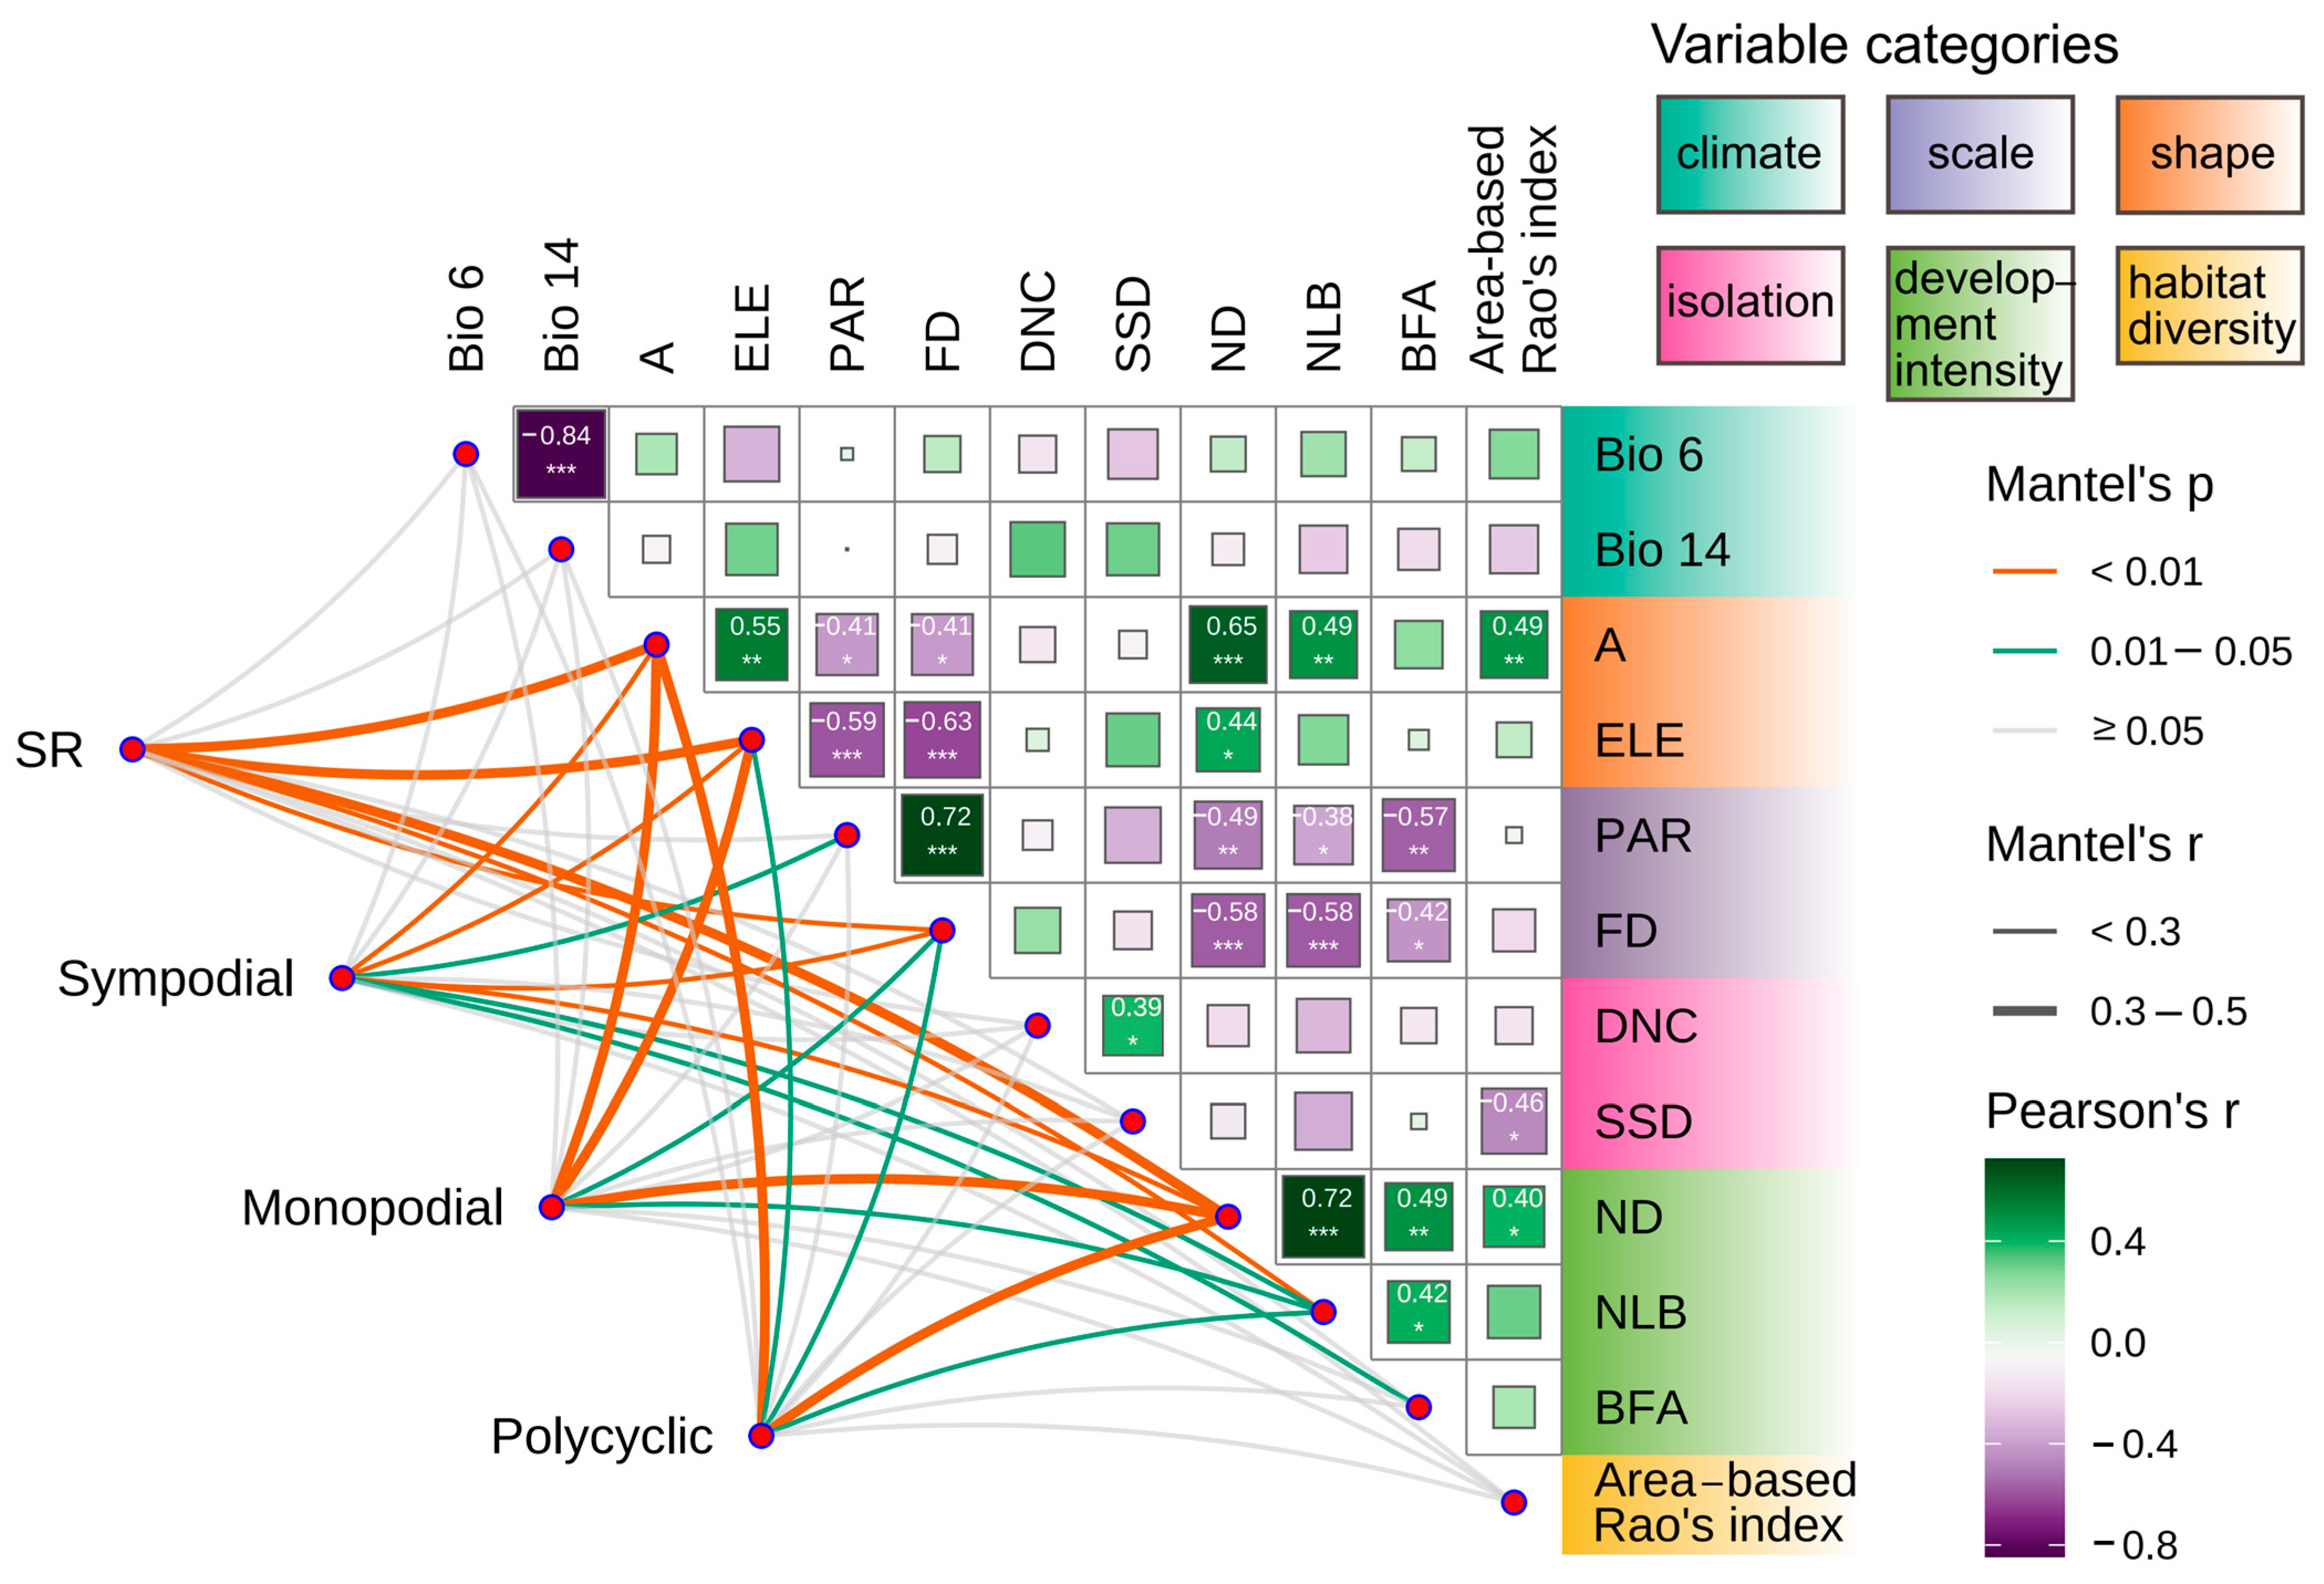
3.3. Bamboo Species and Island Environmental Factors

The Pearson correlation analysis and Mantel test results (Figure 4) revealed that island area was significantly positively correlated with elevation (r = 0.55, p < 0.01), ND (r = 0.65, p < 0.001), NLB (r = 0.49, p < 0.01), and the Area-Based Rao’s Index (r = 0.49, p < 0.01). Conversely, island area exhibited significant negative correlations with PAR (r = −0.41, p < 0.05) and FD (r = −0.41, p < 0.05). These findings indicate that elevation, ND, NLB, and the Area-Based Rao’s Index increase with larger island areas, while PAR and FD decrease as island area expands.
Moreover, PAR and FD, which reflect island shape, showed a significant positive correlation (r = 0.70, p < 0.001), implying that an increase in PAR is accompanied by a rise in FD. Bio 14 demonstrated the weakest correlations with other environmental factors, exhibiting a significant negative correlation only with Bio 6 (r = −0.84, p < 0.001), another climatic variable.
Furthermore, as shown in Figure 4, area (A), elevation (ELE), FD, ND, NLB, BFA, and PAR are key environmental factors influencing bamboo species with different reproductive types. Area (r = 0.459, p < 0.001), elevation (r = 0.428, p < 0.001), FD, NLB, and ND (r = 0.414, p < 0.001) are significant contributors to SR on islands. Islands with larger areas, higher elevations, more complex shapes, and greater numbers of land bridges and docks tend to exhibit higher species richness.
The effect of environmental factors varies across different reproductive types. Specifically, sympodial species richness is primarily influenced by A, ELE, PAR, FD, ND, NLB, and BFA. Monopodial species richness is mainly affected by A, ELE, FD, ND, and NLB. Similarly, polycyclic species richness is primarily influenced by A, ELE, FD, ND, and NLB.

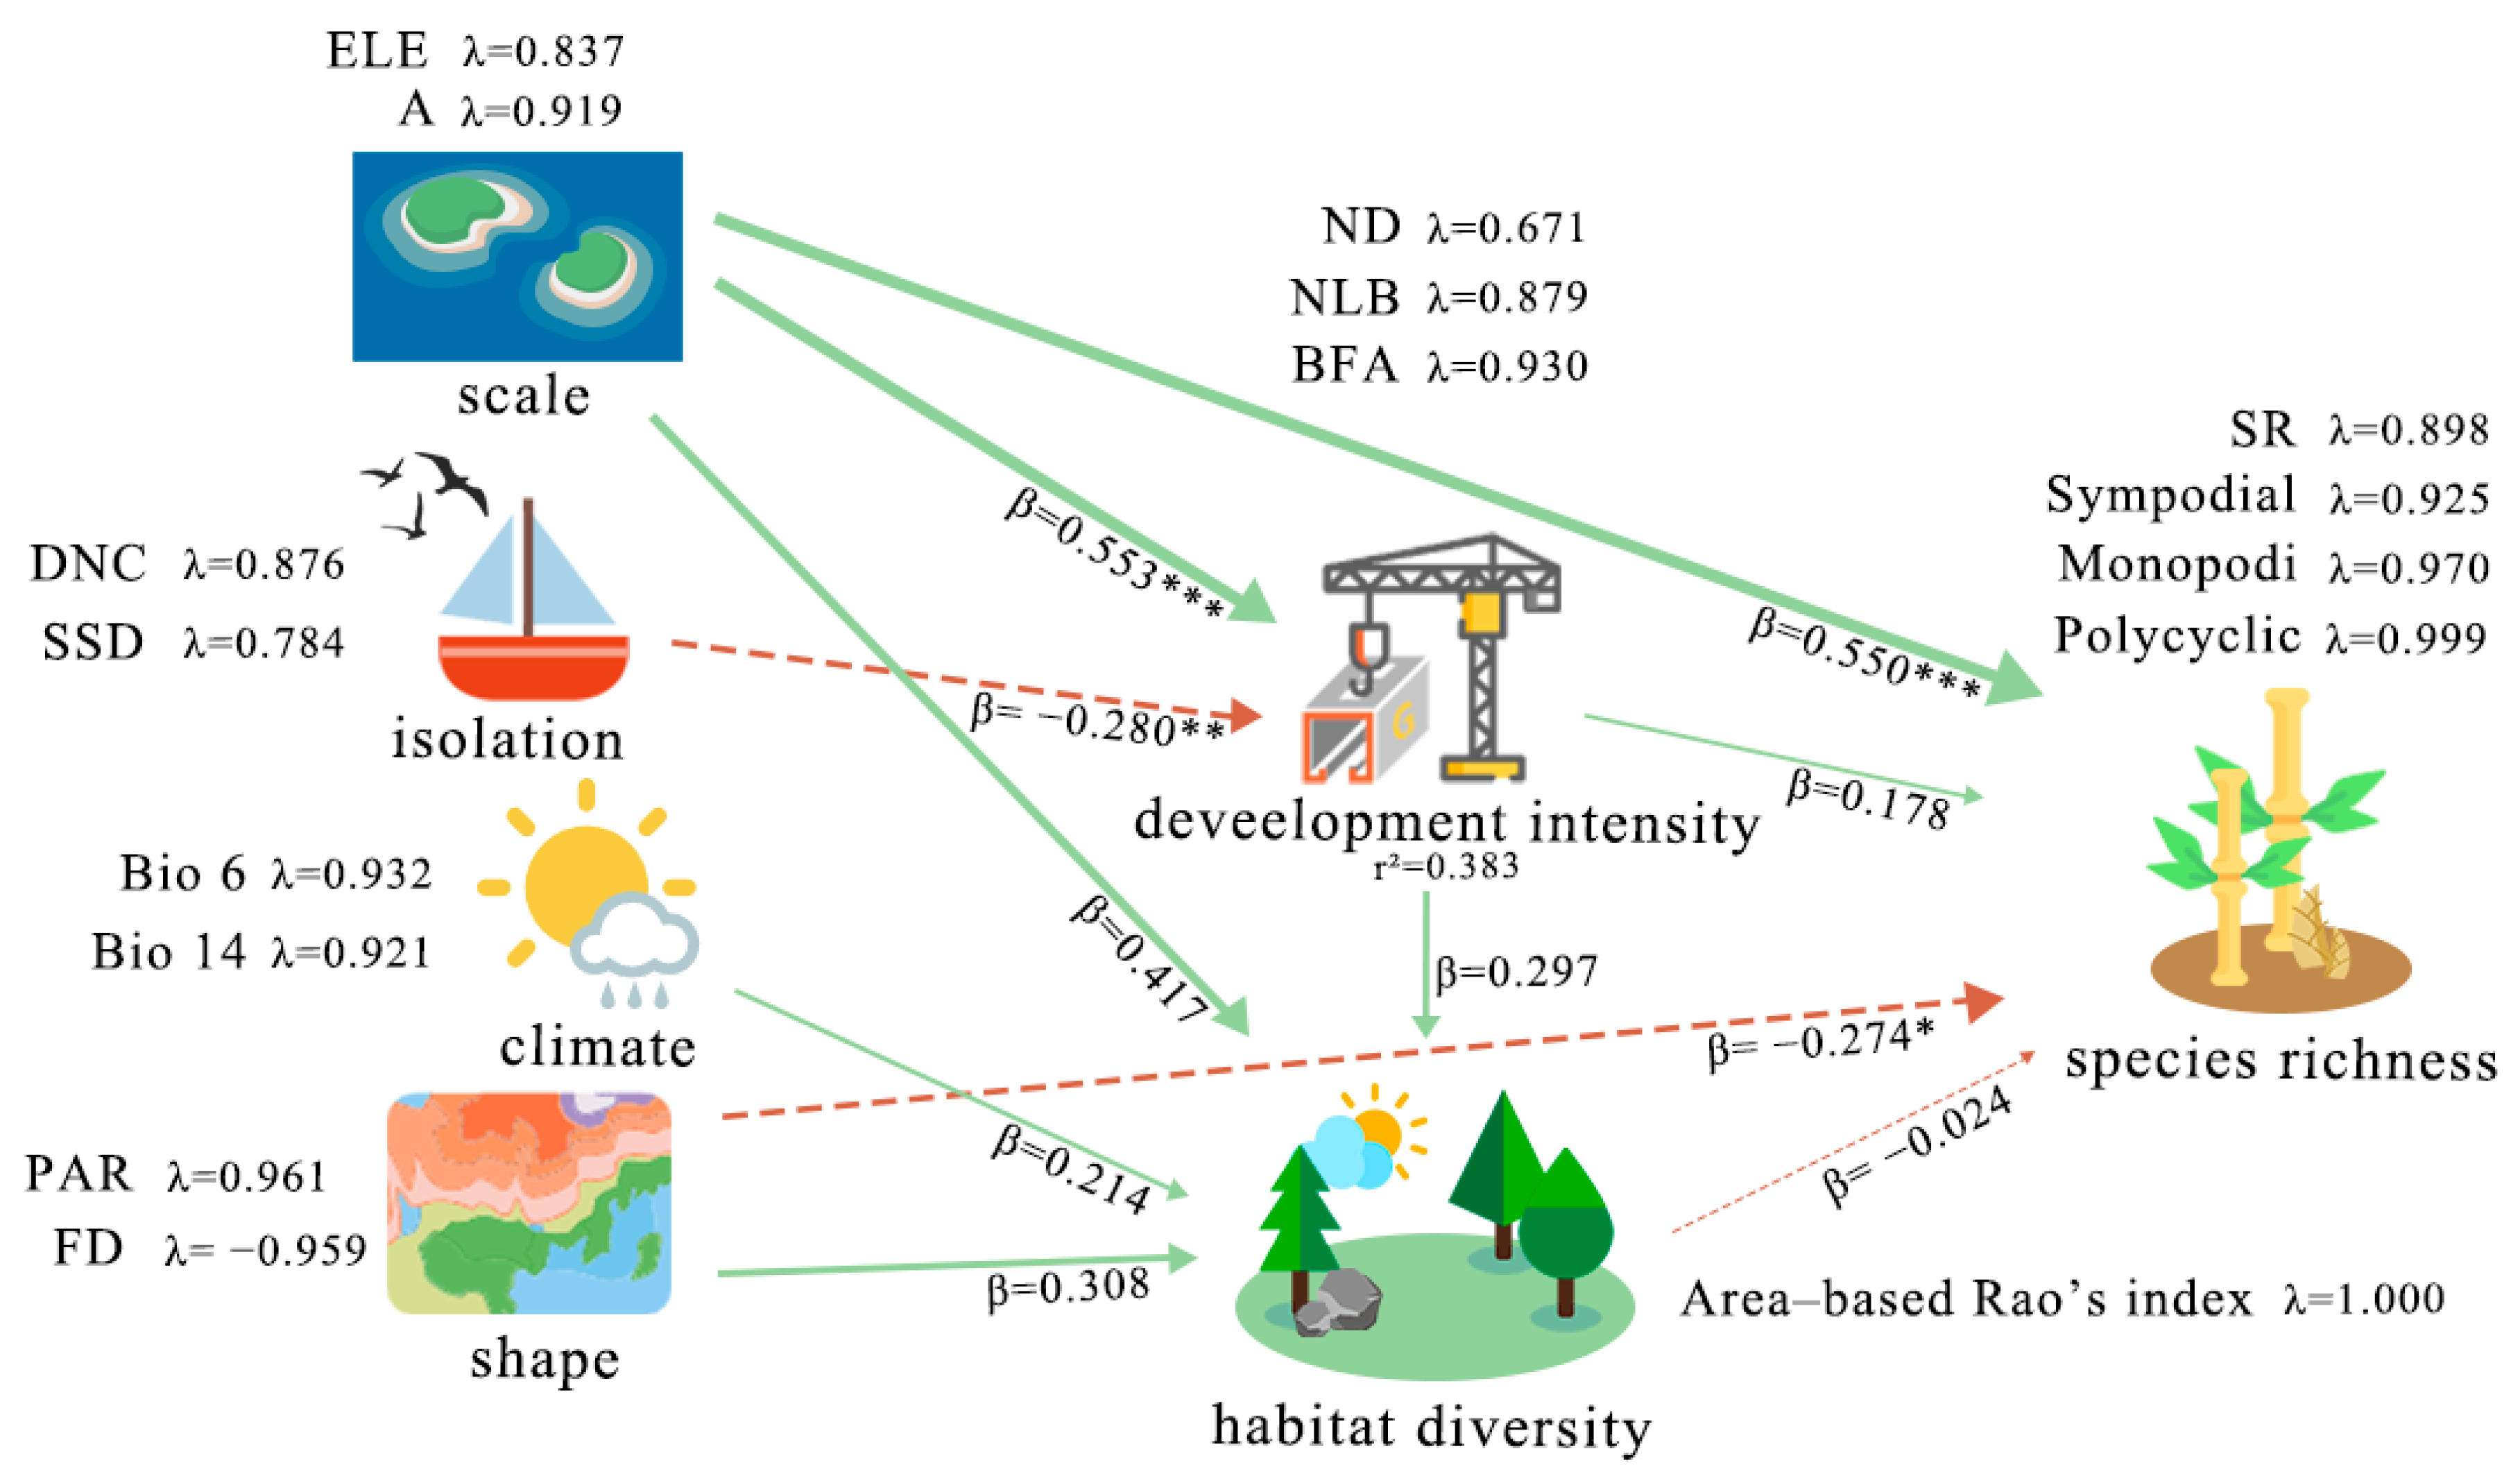
3.4. Multidimensional Driving Factors of Island Bamboo Species

The structural equation model was evaluated for reliability and convergent validity. As shown in Table 1, all factor loadings exceeded 0.5, the average variance extracted (AVE) values were greater than 0.5, and the composite reliability (CR) values surpassed 0.7. These results satisfy or exceed the minimum thresholds of 0.5 for factor loadings, 0.7 for composite reliability (CR), and 0.5 for average variance extracted (AVE) [46], confirming that the reliability and convergent validity of the 12 environmental factors were adequate.
The total effects of each environmental factor, calculated as the sum of direct and indirect effects (Figure 5), revealed that island scale, development intensity, and climate exert positive overall effects on SR. In contrast, isolation, habitat heterogeneity, and shape demonstrated negative overall effects.
Specifically, island scale and development intensity were identified as the primary drivers of species richness, with total effects of 0.55 and 0.178, respectively. Development intensity and habitat heterogeneity acted as mediators across multiple pathways. Climate, scale, and island shape influenced species richness indirectly by affecting habitat heterogeneity, with total effects of 0.19, 0.398, and 0.284, respectively. Furthermore, scale and isolation indirectly impacted species richness through development intensity, with total effects of 0.731 and −0.102, respectively.
Additionally, as illustrated in Figure 5, island scale exerts a significant positive effect on species richness (β = 0.550), primarily through area, which accounts for 91.9% of the variance in scale. This finding suggests that larger islands provide more extensive habitats for bamboo species, thereby supporting higher species richness.
Furthermore, island scale significantly positively influences both development intensity and habitat heterogeneity, indicating that larger islands with higher elevations are generally more developed and exhibit greater habitat heterogeneity. While isolation does not have a direct significant effect on species richness, it indirectly impacts species richness through its effect on development intensity (β = −0.280). This implies that regions farther from the mainland or other islands tend to have lower development intensity, which may further restrict resource availability, ultimately suppressing species richness.

4. Discussion

4.1. Area Effect

The species richness (SR) of island bamboo species, as well as different reproductive types, increased with the expanding area (Figure 3), aligning with the species–area relationship theory [4]. The species–area relationship is a well-established ecological principle that describes the positive correlation between species richness and habitat area, whereby species richness increases as habitat area expands [52]. The z-value, commonly used to represent the growth rate of species richness in relation to area, ranged from 0.44 to 2.07 in this study, deviating significantly from the typical z-value range [53,54].
Notably, the z-values for bamboo species richness (SR) and sympodial types were significantly higher than typical ranges, while those for monopodial and polycyclic types were comparatively lower. This variation is closely linked to the ecological adaptability and functional traits of different reproductive types in island environments [55]. Sympodial bamboo species exhibit strong ecological advantages, including greater culm height, diameter, internode length, and culm wall thickness, which enable efficient utilization of vertical space resources [35]. In the context of limited island area, these traits allow sympodial bamboo to rapidly increase biomass per unit area without relying on extensive horizontal expansion. Additionally, the short rhizomes of sympodial species result in dense culm distribution [56], forming bamboo forests that actively enhance soil structure, conserve water and soil, and create favorable microhabitats for their growth. These ecological characteristics further reinforce their growth and reproductive advantages in space-constrained environments.
In contrast, monopodial bamboo species rely primarily on long rhizomes for horizontal expansion, which can extend 2–5 m annually [57]. However, this horizontal growth strategy is restricted by the limited space available on islands. Furthermore, monopodial bamboo species generally have smaller culm height and diameter compared to sympodial species [35], reducing their competitive advantage in vertical resource utilization. As a result, monopodial bamboo species exhibit less significant responses to area expansion, and their dispersed growth pattern makes it challenging to form high-density communities in resource-limited island environments. Polycyclic bamboo species, which possess characteristics of both sympodial and monopodial types, are sparsely represented on Fujian islands and exhibit limited responses to area expansion. This could be attributed to their lower competitive ability or ecological traits adapted to specific environments, which warrants further investigation.
The structural equation model (PLS-SEM) was used to analyze the effects of environmental factors on SR and different reproductive types, revealing that island scale had the most significant contribution to SR and reproductive types. Among the components of island scale, area was identified as the key driver influencing SR and reproductive types. This result aligns with island biogeography theory [10], highlighting the sensitivity and dependence of bamboo species on habitat area.
The area effect suggests that larger islands provide a greater diversity of habitat types and resources [58], including varied soil conditions, humidity levels, and light availability, creating suitable environments for bamboo species with different adaptive traits. Moreover, larger islands typically support larger population sizes, promoting long-term population stability and reducing the risk of species extinction [59].
Furthermore, different reproductive types exhibit varying environmental requirements. Increased space and resource availability on larger islands reduce interspecific competition, facilitating greater niche differentiation [60,61]. This promotes coexistence among species, particularly those with unique ecological needs that might otherwise be competitively excluded on smaller islands [62].

4.2. Isolation Effect

In island biogeography, isolation is widely regarded as one of the critical factors influencing species richness [23,63]. According to MacArthur and Wilson’s island biogeography theory, greater distances between islands and the mainland (or other species sources) result in lower immigration rates, leading to decreased species richness [59,64,65,66]. However, this study revealed no significant relationship between bamboo species richness and isolation (Figure 3 and Figure 5).
This lack of significance may be attributed to the reproductive strategies of bamboo. Bamboo primarily propagates asexually through rhizomes [61], while its sexual reproduction cycle is prolonged, and seed dispersal depends largely on gravity, short-distance water flow, or animals, with limited capacity for long-distance dispersal across barriers such as oceans. Additionally, bamboo’s considerable economic and cultural value has led to frequent human-mediated introductions to various islands or regions for uses such as construction, handicrafts, and food [67], further mitigating the effects of isolation on species richness.
Furthermore, the Fujian islands were historically connected to the mainland [68]. Over extended geological timescales, bamboo species may have gradually dispersed and established populations on these islands, rendering the current degree of isolation less impactful on species richness.

4.3. Development Intensity and Habitat Heterogeneity on Islands

In addition to island scale, development intensity is one of the most significant drivers of species richness. While development intensity has a relatively small direct effect on the species richness of island bamboo plants (Figure 5), it plays a mediating role in multiple pathways, bridging the complex relationships among island scale, isolation, and species richness.
Larger islands (with greater area and higher elevation) possess higher resource-carrying capacities and more diverse habitat features, making them more attractive for human activities such as agricultural development, tourism, and infrastructure expansion [69]. These activities often involve the introduction of artificial structures and the redistribution of vegetation, providing additional space for bamboo growth and expansion. Moreover, the boundary effects created by artificial structures may further facilitate species dispersal and reproduction [70,71].
Islands with low isolation, being closer to the mainland or other islands, benefit from convenient transportation and lower resource input costs, making them more prone to human disturbances [72,73]. These disturbances often manifest as higher development intensity, such as increased building density and expanded non-forest areas. While such development alters original natural habitats, it may also enhance resource availability, creating opportunities for certain highly adaptable bamboo species to expand their populations. However, intensive development activities could have negative impacts on certain bamboo species, especially those with limited adaptability or restricted distribution ranges. Such species may be at risk of local extinction due to habitat fragmentation or reduced habitat quality. While no bamboo extinctions have been recorded in the study area, similar island ecosystems worldwide have frequently experienced local extinctions caused by human activities. This pattern may also be present in island bamboo communities.
The Area-Based Rao’s Index serves as a critical indicator of island habitat heterogeneity. Correlation analysis of island environmental factors (Figure 4) revealed a positive relationship between island area and the Area-Based Rao’s Index, suggesting that larger islands tend to exhibit greater habitat heterogeneity.
However, as illustrated in Figure 5, although development intensity positively influences habitat heterogeneity, increased habitat heterogeneity is associated with reduced bamboo species richness and richness across reproductive types. This paradox can be explained through the following mechanisms: High-intensity human activities fragment continuous habitats into isolated patches, causing habitat fragmentation and disrupting ecosystem continuity [74]. Such development divides island habitats into smaller, disconnected fragments [75,76], which can hinder the dispersal and population persistence of bamboo species, particularly those reliant on contiguous habitats.
Moreover, habitat fragmentation often limits population sizes and reduces genetic flow between populations [77], ultimately contributing to a decline in species richness. While high-intensity development enhances habitat heterogeneity, it frequently diminishes habitat quality. For instance, the expansion of farmland and landscaping vegetation may lead to soil compaction and pollution, degrading habitat quality and adversely affecting bamboo species growth and reproduction. Additionally, invasive plant species introduced through human activities may compete with and even suppress native plants [78].
Therefore, although moderate development intensity may indirectly enhance bamboo species richness by modifying existing habitats, excessive development disrupts habitat connectivity and quality, resulting in negative impacts on species richness [79].

4.4. Climatic Factors

Climate is typically a key determinant of plant distribution and species richness [80,81]. However, in this study, the influence of climate on bamboo species richness and the richness of different rhizome types was limited, affecting island bamboo species richness only indirectly through habitat heterogeneity. This could be attributed to the broad climatic adaptability of bamboo, which allows it to thrive under diverse climatic conditions and reduces its sensitivity to climatic changes. Additionally, the islands in the study area exhibit relatively uniform climatic conditions (e.g., temperature, precipitation, humidity).
Future research should consider integrating additional environmental factors, such as soil, into models to assess their relative importance alongside climatic variables. Long-term ecological monitoring and more granular climatic data could also be employed to evaluate the dynamic impacts of climatic changes on bamboo species richness. Such efforts would provide a deeper and more comprehensive understanding of the distribution patterns of bamboo species richness across the Fujian islands and other subtropical islands.

4.5. Implications for the Conservation and Management of Island Bamboo Species

Based on the species richness of bamboo and its reproductive types on Fujian islands and the driving mechanisms of their environmental factors, this study recommends the following strategies for future island management and bamboo conservation: 1. Regulate development intensity: Ensure that development activities remain moderate to avoid excessive destruction of contiguous habitats. 2. Establish ecological corridors: Connect developed areas to maintain habitat connectivity and reduce fragmentation effects. Enhanced habitat connectivity can mitigate the isolation of bamboo populations, facilitate gene flow among species, and improve species adaptability. 3. Protect key resources and habitats: Prioritize the conservation of critical resources and specific habitats based on the ecological requirements of bamboo species with different reproductive types. 4. Monitor invasive species: Pay special attention to areas with intensive development to prevent invasive species from entering islands via development activities, thereby reducing competitive pressure on native bamboo species.
By scientifically managing the relationships between island attributes, development intensity, habitat heterogeneity, and species richness, it is possible to conserve bamboo species diversity while supporting the sustainable development of ecosystem functions.

5. Conclusions

This study explored the driving effects of six major categories of environmental factors—island scale, isolation, shape, climate, development intensity, and habitat heterogeneity—on the species richness of bamboo plants and their different reproductive types on islands. It provided a deeper understanding of the spatial distribution patterns of bamboo species richness and their reproductive types across island ecosystems. The findings indicated that bamboo species richness and reproductive types on Fujian islands align with the species–area relationship, supporting the assumptions of island biogeography theory. However, while species richness was significantly influenced by the area effect, it did not support the isolation effect. Among the 12 environmental factors examined across six categories, island scale emerged as the dominant factor influencing bamboo species richness and the richness of different reproductive types. Specifically, area was identified as the key driver. As well as area, development intensity and habitat heterogeneity also had significant impacts, while isolation and climate had relatively minor effects. Development intensity enhanced bamboo diversity but could simultaneously decrease species richness by altering habitat heterogeneity, with the intensity of development being a critical determinant. This study advances theoretical insights into island biogeography and bamboo ecology by uncovering the mechanisms through which factors such as island scale, isolation, shape, climate, development intensity, and habitat heterogeneity affect bamboo species richness. Practically, it offers vital scientific support for the conservation of bamboo plants, the management of island ecosystems, and the design of sustainable development strategies. By understanding these influencing factors, we can better protect bamboo diversity, maintain the ecological health of island systems, and contribute to the sustainable development of regional ecosystems.

Author Contributions

Conceptualization: W.Z., Y.X., C.D. and H.H.; Methodology: W.Z., Y.X. and H.H.; Software: W.Z., X.X., Z.C. and H.H.; Validation: Y.X. and H.H.; Formal Analysis: W.Z. and H.H.; Investigation: W.Z., Y.X., X-R.X, Z.C. and H.H.; Resources: W.Z., Y.X., X.X. and Z.C.; Data Curation: W.Z., Y.X., X.X. and Z.C.; Writing—Original Draft Preparation: W.Z.; Writing—Review and Editing: Y.X. and C.D.; Visualization: C.D.; Supervision: C.D.; Project Administration: Y.X. and H.H.; Funding Acquisition: Y.X. and. H.H. All authors have read and agreed to the published version of the manuscript.

Funding

This research was funded by the Fujian Province Industry–University Cooperation Project: Construction and Application of Color Map of Traditional Dwellings in Minjiang River Basin Based on Color Preference of Indigenous Residents, Fujian Provincial Department of Science and Technology (Grant No. 2023Y4003); and the Fujian Province Regional Development Science and Technology Plan, Fujian Provincial Department of Science and Technology (Grant No.2018Y3006).

Institutional Review Board Statement

This study did not require ethical review and approval due to its nature, which does not involve humans or animals.

Data Availability Statement

Data are contained within the article.

Acknowledgments

We sincerely thank the Fujian Provincial Department of Science and Technology for supporting this project (Grant Nos. 2023Y4003 and 2018Y3006), which was crucial to the successful execution of this research. Special thanks go to Chunxiao Wang, Qun Zhang, and Yushan Zheng for their dedicated efforts and exceptional contributions throughout the research process. We are also deeply grateful to the reviewers and editors for their insightful feedback and professional guidance, which significantly improved the quality of this paper. Lastly, we extend our heartfelt appreciation to all colleagues, collaborators, and institutions who offered their support and assistance during the completion of this study.

Conflicts of Interest

The authors declare no conflicts of interest.

Appendix A

Table A1. Environmental factors and species distribution data of 30 islands.
ClimateIsland CharacteristicAnthropogenic DisturbanceQ index
IslandBio 6
(°C)
Bio 14 (mm)A
(km2)
ELE
(m)
PARFDDNC
(km)
SSD
(km)
NDNLBBFA
(%)
Alpha 1Alpha
2
SRSympodialMonopodialPolycyclic
Caoyudao9.06307.05212.302.291.254.293.631000.370.090.1713742
Culudao7.423714.40232.601.421.190.260.26910.490.170.2313643
Dadengdao8.892312.9941.801.451.180.625.74820.700.210.278521
Daisongdao9.09250.3627.307.711.280.400.40610.790.160.226312
Daliandao8.77329.96238.502.031.247.881.18610.170.090.1710532
Dashengdao9.28230.0744.2017.781.262.541.28000.000.150.215311
Dayudao8.88260.2245.1012.381.252.471.04100.130.150.217421
Dayushandao5.134021.22541.401.411.186.625.27600.220.130.187872
Dazuidao9.48240.61103.108.391.272.332.33200.040.150.219522
Dongshandao10.3526220.18274.300.511.200.310.313550.240.190.2611074
Dogxiangdao8.96364.80134.604.101.2826.502.30800.460.200.267322
Duimianyu10.74270.1025.8020.711.305.780.49200.010.100.166231
Haitandao8.7732267.13438.200.481.243.591.205120.620.240.3141185
Huanggandao9.28230.5572.408.271.260.720.72000.000.150.235311
Huchudao7.42370.0733.7222.561.325.200.38000.000.150.204211
Huiyu8.37240.4159.9013.141.311.111.11200.550.160.2210613
Jiangyindao8.672569.75429.100.721.190.210.211470.410.150.212642
Langqidao7.423755.50275.000.591.160.560.562150.600.170.2316844
Meizhoudao9.282314.3595.202.321.272.192.19300.670.150.229973
Nanridao9.102747.24116.302.241.217.343.371000.850.150.214734
Sandudao5.844229.17460.601.051.182.081.93300.220.180.248774
Tayu10.74271.0191.306.821.242.441.16300.260.190.268521
Xiamendao9.2425134.84339.600.491.140.710.719070.800.210.2717863
Xiaosongdao9.09250.0226.0030.371.290.350.35010.000.200.274220
Xiaweidao6.23460.0835.5122.421.290.270.27000.000.160.224211
Xiyangdao6.234629.80221.000.721.2110.236.99500.250.070.1113652
Yuanyangyu5.13400.64149.819.011.2812.850.25000.000.120.184211
Yutoudao8.76288.5677.902.571.262.400.251700.860.090.156411
Zhujiangdao5.68450.1547.3012.821.230.810.81200.660.130.197412
Zinidao9.232628.565.001.261.200.280.286590.910.150.2117953
Table A2. List of bamboo species found on 30 islands in Fujian, China.
NumberNumberGenusSpecies
1PoaceaeDendrocalamusDendrocalamus latiflorus Munro
2PoaceaeBambusaBambusa vulgaris Schrad. ex J. C. Wendland
3PoaceaeBambusaBambusa oldhamii Munro
4PoaceaeBambusaBambusa ventricosa McClure
5PoaceaeBambusaBambusa blumeana Schult. and Schult. f.
6PoaceaeBambusaBambusa multiplex (Lour.) Raeusch. ex Schult. and Schult. f.
7PoaceaeBambusaBambusa albolineata (McClure) L. C. Chia
8PoaceaeBambusaBambusa emeiensis L. C. Chia and H. L. Fung
9PoaceaeSchizostachyumSchizostachyum funghomii McClure
10PoaceaeDendrocalamusDendrocalamus pulverulentus L. C. Chia and But
11PoaceaeBambusaBambusa textilis McClure
12PoaceaeBambusaBambusa multiplex (Lour.) Raeusch. ex Schult. and Schult. f.
13PoaceaePhyllostachysPhyllostachys edulis (Carrière) J. Houz.
14PoaceaePhyllostachysPhyllostachys sulphurea var. viridis R. A. Young
15PoaceaePhyllostachysPhyllostachys rivalis H. R. Zhao and A. T. Liu
16PoaceaePhyllostachysPhyllostachys iridescens C. Y. Yao and S. Y. Chen
17PoaceaePhyllostachysPhyllostachys vivax McClure
18PoaceaePhyllostachysPhyllostachys rubicunda T. W. Wen
19PoaceaePhyllostachysPhyllostachys makinoi Hayata
20PoaceaePhyllostachysPhyllostachys nigra (Lodd. ex Lindl.) Munro
21PoaceaeBambusaBambusa cerosissima McClure
22PoaceaePhyllostachysPhyllostachys heteroclada Oliv.
23PoaceaeIndocalamusIndocalamus tessellatus (Munro) P. C. Keng
24PoaceaeIndocalamusIndocalamus latifolius (Keng) McClure
25PoaceaeIndocalamusIndocalamus longiauritus Hand.-Mazz.
26PoaceaePseudosasaPseudosasa amabilis (McClure) P. C. Keng ex S. L. Chen and al.
27PoaceaePleioblastusPleioblastus maculatus (McClure) C. D. Chu and C. S. Chao
28PoaceaePleioblastusPleioblastus chino var. hisauchii Makino
29PoaceaeShibataeaShibataea nanpingensis var. fujianica (Z. D. Zhu and H. Y. Zhou) C. H. Hu

References

  1. Patiño, J.; Whittaker, R.J.; Borges, P.A.; Fernández-Palacios, J.M.; Ah-Peng, C.; Araújo, M.B.; Ávila, S.P.; Cardoso, P.; Cornuault, J.; de Boer, E.J.; et al. A Roadmap for Island Biology: 50 Fundamental Questions after 50 Years of the Theory of Island Biogeography. J. Biogeogr. 2017, 44, 963–983. [Google Scholar] [CrossRef]
  2. Myers, N.; Mittermeier, R.A.; Mittermeier, C.G.; da Fonseca, G.A.B.; Kent, J. Biodiversity Hotspots for Conservation Priorities. Nature 2000, 403, 853–858. [Google Scholar] [CrossRef] [PubMed]
  3. Paulay, G. Biodiversity on Oceanic Islands: Its Origin and Extinction1. Am. Zool. 1994, 34, 134–144. [Google Scholar] [CrossRef]
  4. MacArthur, R.H.; Wilson, E.O. The Theory of Island Biogeography; Princeton University Press: Princeton, NJ, USA, 1967. [Google Scholar]
  5. Whittaker, R.J.; Triantis, K.A.; Ladle, R.J. A General Dynamic Theory of Oceanic Island Biogeography. J. Biogeogr. 2008, 35, 977–994. [Google Scholar] [CrossRef]
  6. Pinheiro, H.T.; Bernardi, G.; Simon, T.; Joyeux, J.-C.; Macieira, R.M.; Gasparini, J.L.; Rocha, C.; Rocha, L.A. Island Biogeography of Marine Organisms. Nature 2017, 549, 82–85. [Google Scholar] [CrossRef]
  7. MacArthur, R.H.; Wilson, E.O. An Equilibrium Theory of Insular Zoogeography. Evolution 1963, 17, 373–387. [Google Scholar] [CrossRef]
  8. Heaney, L. Dynamic Disequilibrium: A Long-Term, Large-Scale Perspective on the Equilibrium Model of Island Biogeography. Glob. Ecol. Biogeogr. 2000, 9, 59–74. [Google Scholar] [CrossRef]
  9. Lomolino, M.V. A Call for a New Paradigm of Island Biogeography: Island Paradigms. Glob. Ecol. Biogeogr. 2000, 9, 1–6. [Google Scholar] [CrossRef]
  10. Kalmar, A.; Currie, D.J. A Global Model of Island Biogeography. Glob. Ecol. Biogeogr. 2006, 15, 72–81. [Google Scholar] [CrossRef]
  11. Whittaker, R.J. Scale, succession and complexity in island biogeography: Are we asking the right questions?: Scale, succession and complexity in island biogeography. Glob. Ecol. Biogeogr. 2000, 9, 75–85. [Google Scholar] [CrossRef]
  12. Triantis, K.A.; Mylonas, M.; Lika, K.; Vardinoyannis, K. A Model for the Species–Area–Habitat Relationship. J. Biogeogr. 2003, 30, 19–27. [Google Scholar] [CrossRef]
  13. Rojas-Sandoval, J.; Ackerman, J.D. Tremblay Island Biogeography of Native and Alien Plant Species: Contrasting Drivers of Diversity across the Lesser Antilles. Divers. Distrib. 2020, 26, 1539–1550. [Google Scholar] [CrossRef]
  14. Kubota, Y.; Shiono, T.; Kusumoto, B. Role of Climate and Geohistorical Factors in Driving Plant Richness Patterns and Endemicity on the East Asian Continental Islands. Ecography 2015, 38, 639–648. [Google Scholar] [CrossRef]
  15. Yu, J.; Shen, L.; Li, D.D.; Guo, S.L. Determinants of Bryophyte Species Richness on the Zhoushan Archipelago, China. Basic Appl. Ecol. 2019, 37, 38–50. [Google Scholar] [CrossRef]
  16. Heatwole, H. Factors Affecting the Number of Species of Plants on Islands of the Great Barrier Reef, Australia. J. Biogeogr. 1991, 18, 213. [Google Scholar] [CrossRef]
  17. Valli, A.-T.; Kougioumoutzis, K.; Iliadou, E.; Panitsa, M.; Trigas, P. Determinants of Alpha and Beta Vascular Plant Diversity in Mediterranean Island Systems: The Ionian Islands, Greece. Nord. J. Bot. 2019, 37, e02156. [Google Scholar] [CrossRef]
  18. Wang, Z.-M.; Ye, W.; Xing, F.-W. Bryophyte Diversity on a Tropical Continental Island (Hainan, China): Potential Vulnerable Species and Environmental Indicators. J. Bryol. 2019, 41, 350–360. [Google Scholar] [CrossRef]
  19. Irl, S.D.H.; Schweiger, A.H.; Steinbauer, M.J.; Ah-Peng, C.; Arevalo, J.R.; Beierkuhnlein, C.; Chiarucci, A.; Daehler, C.C.; Fernandez-Palacios, J.M.; Flores, O.; et al. Human Impact, Climate and Dispersal Strategies Determine Plant Invasion on Islands. J. Biogeogr. 2021, 48, 1889–1903. [Google Scholar] [CrossRef]
  20. Honnay, O.; Piessens, K.; Van Landuyt, W.; Hermy, M.; Gulinck, H. Satellite Based Land Use and Landscape Complexity Indices as Predictors for Regional Plant Species Diversity. Landsc. Urban Plan. 2003, 63, 241–250. [Google Scholar] [CrossRef]
  21. Sfenthourakis, S.; Triantis, K.A. Habitat Diversity, Ecological Requirements of Species and the Small Island Effect. Divers. Distrib. 2009, 15, 131–140. [Google Scholar] [CrossRef]
  22. Borges, P.A.V.; Hortal, J. Time, Area and Isolation: Factors Driving the Diversification of Azorean Arthropods. J. Biogeogr. 2009, 36, 178–191. [Google Scholar] [CrossRef]
  23. Cabral, J.S.; Weigelt, P.; Kissling, W.D.; Kreft, H. Biogeographic, Climatic and Spatial Drivers Differentially Affect Alpha-, Beta- and Gamma-Diversities on Oceanic Archipelagos. Proc. R. Soc. B Biol. Sci. 2014, 281, 20133246. [Google Scholar] [CrossRef]
  24. Liu, J.L.; Vellend, M.; Wang, Z.; Yu, M.J. High Beta Diversity among Small Islands Is Due to Environmental Heterogeneity Rather than Ecological Drift. J. Biogeogr. 2018, 45, 2252–2261. [Google Scholar] [CrossRef]
  25. Chi, Y.; Zhang, Z.; Gao, J.; Xie, Z.; Zhao, M.; Wang, E. Evaluating Landscape Ecological Sensitivity of an Estuarine Island Based on Landscape Pattern across Temporal and Spatial Scales. Ecol. Indic. 2019, 101, 221–237. [Google Scholar] [CrossRef]
  26. Jesse, W.A.M.; Behm, J.E.; Helmus, M.R.; Ellers, J. Human Land Use Promotes the Abundance and Diversity of Exotic Species on Caribbean Islands. Glob. Change Biol. 2018, 24, 4784–4796. [Google Scholar] [CrossRef]
  27. Ibanez, T.; Keppel, G.; Baider, C.; Birkinshaw, C.; Culmsee, H.; Cordell, S.; Florens, F.B.V.; Franklin, J.; Giardina, C.P.; Gillespie, T.W.; et al. Regional Forcing Explains Local Species Diversity and Turnover on Tropical Islands. Glob. Ecol. Biogeogr. 2018, 27, 474–486. [Google Scholar] [CrossRef]
  28. Ewers, R.M.; Didham, R.K. Confounding Factors in the Detection of Species Responses to Habitat Fragmentation. Biol. Rev. 2005, 81, 117. [Google Scholar] [CrossRef]
  29. Garnier, E.; Cortez, J.; Billès, G.; Navas, M.-L.; Roumet, C.; Debussche, M.; Laurent, G.; Blanchard, A.; Aubry, D.; Bellmann, A.; et al. Plant Functional Markers Capture Ecosystem Properties during Secondary Succession. Ecology 2004, 85, 2630–2637. [Google Scholar] [CrossRef]
  30. McIntyre, S.; Lavorel, S.; Landsberg, J.; Forbes, T.D.A. Disturbance Response in Vegetation–towards a Global Perspective on Functional Traits. J. Veg. Sci. 1999, 10, 621–630. [Google Scholar] [CrossRef]
  31. Li, X.; Mao, F.; Du, H.; Zhou, G.; Xing, L.; Liu, T.; Han, N.; Liu, Y.; Zhu, D.; Zheng, J.; et al. Spatiotemporal Evolution and Impacts of Climate Change on Bamboo Distribution in China. J. Environ. Manag. 2019, 248, 109265. [Google Scholar] [CrossRef] [PubMed]
  32. Cupertino-Eisenlohr, M.A.; Vinicius-Silva, R.; Meireles, L.D.; Eisenlohr, P.V.; Meira-Neto, J.A.A.; Santos-Goncalves, A.P. Stability or Breakdown under Climate Change? A Key Group of Woody Bamboos Will Find Suitable Areas in Its Richness Center. Biodivers. Conserv. 2017, 26, 1845–1861. [Google Scholar] [CrossRef]
  33. Bhandawat, A.; Sharma, V.; Sharma, H.; Sood, A.; Sharma, R.K. Development and Crosstransferability of Functionally Relevant Microsatellite Markers in Dendrocalamus Latiflorus and Related Bamboo Species. J. Genet. 2015, 94, 48–55. [Google Scholar] [CrossRef]
  34. Wu, Z.Y.; Raven, P.; Hong, D.Y. Flora of China; Botanical Garden Press: St. Louis, MO, USA, 2013. [Google Scholar]
  35. Hanjiao, G.; Cancan, Z.; Jinsong, W.; Xuewen, S.; Ruixue, X.; Bin, L.; Fusheng, C.; Wensheng, B. Variation in basic morphological and functional traits of Chinese bamboo. Biodivers. Sci. 2019, 27, 585–594. [Google Scholar] [CrossRef]
  36. Li, R.; Zhang, J.; Zhang, Z.E. The Value and Conservation Progress of Bamboo Biodiversity in China. Bamboo Res. J. 2003, 17, 7–12. [Google Scholar]
  37. Yu, M.J.; Hu, G.; Feeley, K.J.; Wu, J.G.; Ding, P. Richness and Composition of Plants and Birds on Land-Bridge Islands: Effects of Island Attributes and Differential Responses of Species Groups. J. Biogeogr. 2012, 39, 1124–1133. [Google Scholar] [CrossRef]
  38. Hu, G.; Feeley, K.J.; Wu, J.; Xu, G.; Yu, M. Determinants of Plant Species Richness and Patterns of Nestedness in Fragmented Landscapes: Evidence from Land-Bridge Islands. Landsc. Ecol. 2011, 26, 1405–1417. [Google Scholar] [CrossRef]
  39. Fang, J.; Wang, X.; Tang, Z. Local and Regional Processes Jointly Control Community Species Diversity: The Species Pool Hypothesis. Biodiversity 2009, 17, 605–612. [Google Scholar]
  40. Editorial Committee of the Flora of China, Chinese Academy of Sciences. Flora of China; Science Press: Beijing, China, 2004. [Google Scholar]
  41. Wu, J.G. Effects of Changing Scale on Landscape Pattern Analysis: Scaling Relations. Landsc. Ecol. 2004, 19, 125–138. [Google Scholar] [CrossRef]
  42. Weigelt, P.; Kreft, H. Quantifying Island Isolation–Insights from Global Patterns of Insular Plant Species Richness. Ecography 2013, 36, 417–429. [Google Scholar] [CrossRef]
  43. Rocchini, D.; Marcantonio, M.; Ricotta, C. Measuring Rao’s Q Diversity Index from Remote Sensing: An Open Source Solution. Ecol. Indic. 2017, 72, 234–238. [Google Scholar] [CrossRef]
  44. Rocchini, D.; Thouverai, E.; Marcantonio, M.; Iannacito, M.; Da Re, D.; Torresani, M.; Bacaro, G.; Bazzichetto, M.; Bernardi, A.; Foody, G.M.; et al. Rasterdiv—An Information Theory Tailored R Package for Measuring Ecosystem Heterogeneity from Space: To the Origin and Back. Methods Ecol. Evol. 2021, 12, 1093–1102. [Google Scholar] [CrossRef]
  45. Fox, J.; Weisberg, S. An R Companion to Applied Regression, 3rd ed.; Sage: Thousand Oaks, CA, USA, 2019. [Google Scholar]
  46. Neter, J.; Kutner, M.; Wasserman, W.; Nachtsheim, C. Applied Linear Statistical Models; Irwin Professional Publishing: Chicago, IL, USA, 1996; ISBN 978-0-256-11736-3. [Google Scholar]
  47. Bivand, R.S.; Wong, D.W.S. Comparing Implementations of Global and Local Indicators of Spatial Association. Test 2018, 27, 716–748. [Google Scholar] [CrossRef]
  48. Oksanen, J.; Blanchet, F.G.; Friendly, M.; Kindt, R.; Legendre, P.; McGlinn, D.; Minchin, P.R.; O’Hara, R.B.; Simpson, G.L.; Solymos, P.; et al. Vegan: Community Ecology Package. J. Veg. Sci. 2020, 14, 6. [Google Scholar]
  49. Warton, D.I.; Duursma, R.A.; Falster, D.S.; Taskinen, S. Smatr 3—An R Package for Estimation and Inference about Allometric Lines. Methods Ecol. Evol. 2012, 3, 257–259. [Google Scholar] [CrossRef]
  50. Henseler, J.; Ringle, C.M.; Sinkovics, R.R. The Use of Partial Least Squares Path Modeling in International Marketing. In New Challenges to International Marketing; Emerald Group Publishing Limited: Leeds, UK, 2009; Volume 20, pp. 277–319. ISBN 978-1-84855-468-9. [Google Scholar]
  51. Šegota, T.; Chen, N.; Golja, T. The Impact of Self-Congruity and Evaluation of the Place on WOM: Perspectives of Tourism Destination Residents. J. Travel Res. 2022, 61, 800–817. [Google Scholar] [CrossRef]
  52. Lomolino, M.V. The species-area relationship: New challenges for an old pattern. Prog. Phys. Geogr.: Earth Environ. 2001, 25, 1–21. [Google Scholar] [CrossRef]
  53. Panitsa, M.; Tzanoudakis, D.; Triantis, K.A.; Sfenthourakis, S. Patterns of Species Richness on Very Small Islands: The Plants of the Aegean Archipelago. J. Biogeogr. 2006, 33, 1223–1234. [Google Scholar] [CrossRef]
  54. Santos, A.M.C.; Whittaker, R.J.; Triantis, K.A.; Borges, P.A.V.; Jones, O.R.; Quicke, D.L.J.; Hortal, J. Are Species–Area Relationships from Entire Archipelagos Congruent with Those of Their Constituent Islands? Glob. Ecol. Biogeogr. 2010, 19, 527–540. [Google Scholar] [CrossRef]
  55. Wang, W.; Tao, J.P.; Song, L.X.; Ran, C.Y. Progress and Prospects in the Population Ecology of Bamboo Species. Guihaia 2006, 4, 412–417. [Google Scholar]
  56. Chen, Q.B.; Gao, S.P.; Liu, L. Selection of Superior Bamboo Species for Pulp Production and the Industrial Development of Bamboo-Based Paper in Sichuan Province. Bamboo Res. J. 2002, 47–51. [Google Scholar]
  57. Gu, D.X.; Chen, S.L.; Zheng, W.M.; Mao, X.Q. A Review of Research on the Ecological Adaptability of Bamboo. Bamboo Res. J. 2010, 29, 17–23. [Google Scholar]
  58. Henneron, L.; Sarthou, C.; de Massary, J.; Ponge, J. Habitat diversity associated to island size and environmental filtering control the species richness of rock-savanna plants in neotropical inselbergs. Ecography 2019, 42, 1536–1547. [Google Scholar] [CrossRef]
  59. Brown, J.H.; Kodric-Brown, A. Turnover Rates in Insular Biogeography: Effect of Immigration on Extinction. Ecology 1977, 58, 445–449. [Google Scholar] [CrossRef]
  60. Wang, Z.; Chase, J.M.; Xu, W.; Liu, J.; Wu, D.; Zhang, A.; Wang, J.; Luo, Y.; Yu, M. Higher Trophic Levels and Species with Poorer Dispersal Traits Are More Susceptible to Habitat Loss on Island Fragments. Ecology 2024, 105, e4300. [Google Scholar] [CrossRef]
  61. Gu, H.-J.; Zhang, C.-C.; Chen, F.-S.; Huang, J.-H.; Wang, J.-S.; Bruelheide, H.; Trogisch, S.; Fang, X.-M.; Li, J.-J.; Bu, W.-S. The Bamboo Rhizome Evolution in China Is Driven by Geographical Isolation and Trait Differentiation. Forests 2021, 12, 1280. [Google Scholar] [CrossRef]
  62. Chen, C.; Yang, X.; Tan, X.; Wang, W. The Role of Habitat Diversity in Generating the Small-island Effect. Ecography 2020, 43, 1241–1249. [Google Scholar] [CrossRef]
  63. Chiarucci, A.; Bacaro, G.; Triantis, K.A.; Fernandez-Palacios, J.M. Biogeographical Determinants of Pteridophytes and Spermatophytes on Oceanic Archipelagos. Syst. Biodivers. 2011, 9, 191–201. [Google Scholar] [CrossRef]
  64. Jonsson, M.; Yeates, G.W.; Wardle, D.A. Patterns of Invertebrate Density and Taxonomic Richness across Gradients of Area, Isolation, and Vegetation Diversity in a Lake-Island System. Ecography 2009, 32, 963–972. [Google Scholar] [CrossRef]
  65. Negoita, L.; Fridley, J.; Lomolino, M.; Mittelhauser, G.; Craine, J.; Weiher, E. Isolation-driven functional assembly of plant communities on islands. Ecography 2015, 39, 1066–1077. [Google Scholar] [CrossRef]
  66. Swapna, M.; Dev, B.M. Understanding the Indian mainland–island biogeography through plant dispersal mechanism. Biodivers. Conserv. 2019, 28, 2063–2084. [Google Scholar] [CrossRef]
  67. Hamid, N.H.; Jawaid, M.; Abdullah, U.H.; Alomar, T.S. Monopodial and Sympodial Bamboos Grown in Tropic and Sub-Tropic Countries—A Review. Bioresources 2023, 18, 6499–6560. [Google Scholar] [CrossRef]
  68. Editorial Committee of China. Island Chronicles, The Island Chronicles of China, 1st ed.; China Ocean Press: Beijing, China, 2014. [Google Scholar]
  69. Xie, Y.; Huang, H.; Xie, X.; Ou, J.; Chen, Z.; Lu, X.; Kong, D.; Nong, L.; Lin, M.; Qian, Z.; et al. Landscape, Human Disturbance, and Climate Factors Drive the Species Richness of Alien Invasive Plants on Subtropical Islands. Plants 2024, 13, 2437. [Google Scholar] [CrossRef]
  70. Petit, S.; Griffiths, L.; Smart, S.S.; Smith, G.M.; Stuart, R.C.; Wright, S.M. Effects of area and isolation of woodland patches on herbaceous plant species richness across great britain. Landsc. Ecol. 2004, 19, 463–472. [Google Scholar] [CrossRef]
  71. Murakami, K.; Maenaka, H.; Morimoto, Y. Factors Influencing Species Diversity of Ferns and Fern Allies in Fragmented Forest Patches in the Kyoto City Area. Landsc. Urban Plan. 2005, 70, 221–229. [Google Scholar] [CrossRef]
  72. Tsiftsis, S. The complex effect of heterogeneity and isolation in determining alpha and beta orchid diversity on islands in the aegean archipelago. Syst. Biodivers. 2020, 18, 281–294. [Google Scholar] [CrossRef]
  73. Jones, G.P.; Barone, G.; Sambrook, K.; Bonin, M.C. Isolation promotes abundance and species richness of fishes recruiting to coral reef patches. Mar. Biol. 2020, 167, 167. [Google Scholar] [CrossRef]
  74. Arianoutsou, M.; Delipetrou, P.; Celesti-Grapow, L.; Basnou, C.; Bazos, I.; Kokkoris, Y.; Blasi, C.; Vilà, M. Comparing naturalized alien plants and recipient habitats across an east–west gradient in the mediterranean basin. J. Biogeogr. 2010, 37, 1811–1823. [Google Scholar] [CrossRef]
  75. Dale, S. Islands in the forest: Effects of patch size and isolation on farmland bird species richness and community composition of farmland patches in forest landscapes. Landsc. Ecol. 2019, 34, 2823–2836. [Google Scholar] [CrossRef]
  76. Watling, J.I.; Donnelly, M.A. Fragments as Islands: A Synthesis of Faunal Responses to Habitat Patchiness. Conserv. Biol. 2006, 20, 1016–1025. [Google Scholar] [CrossRef] [PubMed]
  77. Zhao, Y.; Sanders, N.J.; Liu, J.; Jin, T.; Zhou, H.; Lu, R.; Ding, P.; Si, X. β Diversity among Ant Communities on Fragmented Habitat Islands: The Roles of Species Trait, Phylogeny and Abundance. Ecography 2021, 44, 1568–1578. [Google Scholar] [CrossRef]
  78. Vilà, M.; Espinar, J.L.; Hejda, M.; Hulme, P.E.; Jarošík, V.; Maron, J.L.; Pergl, J.; Schaffner, U.; Sun, Y.; Pyšek, P. Ecological Impacts of Invasive Alien Plants: A Meta-Analysis of Their Effects on Species, Communities and Ecosystems: Ecological Impacts of Invasive Alien Plants. Ecol. Lett. 2011, 14, 702–708. [Google Scholar] [CrossRef]
  79. Arévalo, J.R.; Otto, R.; Escudero, C.; Fernández-Lugo, S.; Arteaga, M.; Delgado, J.D.; Fernández-Palacios, J.M. Do anthropogenic corridors homogenize plant communities at a local scale? A case studied in tenerife (canary islands). Plant Ecol. 2010, 209, 23–35. [Google Scholar] [CrossRef]
  80. García-Palacios, P.; Gross, N.; Gaitán, J.; Maestre, F.T. Climate Mediates the Biodiversity–Ecosystem Stability Relationship Globally. Proc. Natl. Acad. Sci. USA 2018, 115, 8400–8405. [Google Scholar] [CrossRef] [PubMed]
  81. Irl, S.D.H.; Obermeier, A.; Beierkuhnlein, C.; Steinbauer, M.J. Climate Controls Plant Life-Form Patterns on a High-Elevation Oceanic Island. J. Biogeogr. 2020, 47, 2261–2273. [Google Scholar] [CrossRef]
Figure 1. Geographic distribution map of 30 islands in Fujian, China.
Diversity 17 00046 g001
Figure 2. Species accumulation curves for bamboo species richness and different reproductive types.
Diversity 17 00046 g002
Figure 3. Effects of area and isolation on bamboo species richness and reproductive types. The relationship between bamboo species richness—including different reproductive types—and island area (log(Area)) and isolation (log(DNC, Isolation)). *** p < 0.001.
Diversity 17 00046 g003
Figure 4. Pearson correlation analysis and Mantel test of bamboo species and island environmental factor. The heatmap depicts Pearson correlation coefficients between environmental factors. The Mantel test was employed to assess the spatial correlations among environmental factors for statistical significance. Significance levels are represented by different colors, with deeper hues indicating stronger correlations. The figure includes the following English abbreviations: Bio 6 (min temperature of coldest month); Bio 14 (precipitation of driest month); A (area); ELE (elevation); PAR (perimeter area ratio); FD (fractal dimension); DNC (distance from the nearest continent); SSD (stepping stone distance); ND (number of docks); NLB (number of land bridges); BFA (proportion of buildings and farmland area); and Area-Based Rao’s Index. * p < 0.05, ** p < 0.01, *** p < 0.001.
Diversity 17 00046 g004
Figure 5. PLS-SEM construction of bamboo species richness and reproductive types. Figure 5 illustrates the path relationships among latent variables derived from the PLS-SEM analysis. Latent variables are connected by paths, with the path coefficient (β) representing the strength and direction of the relationships. Positive coefficients indicate positive correlations, while negative coefficients represent negative correlations. Lambda reflects the explanatory power of variables on the theory, while beta indicates the explanatory power of the theory on itself. The model includes latent variables and their corresponding abbreviations: scale—ELE (elevation), A (area); isolation—DNC (distance from the nearest continent), SSD (stepping stone distance); climate—Bio 6 (min temperature of coldest month), Bio 14 (precipitation of driest month); shape—PAR (perimeter area ratio), FD (fractal dimension); development intensity—BFA (proportion of buildings and farmland area); habitat diversity—Area-Based Rao’s Index. * p < 0.05, ** p < 0.01, *** p < 0.001.
Diversity 17 00046 g005
Table 1. Measurement model results.
ConstructTypeItemsLoadingsCRAVE
IsolationReflectiveDNC0.8760.8170.691
SSD0.784
ScaleReflectiveA0.9190.8720.773
ELE0.837
ShapeReflectivePAR0.9320.9240.858
FD0.921
ClimateReflectiveBio60.9610.9160.922
Bio14−0.959
Development intensityReflectiveND0.930.8710.696
NLB0.879
BFA0.671
Habitat diversityReflectiveArea-Based Rao’s Index1.0001.0001.000
Species richnessReflectiveSR0.9990.9730.9
Sympodial0.97
Monopodial0.925
Polycyclic0.898
Disclaimer/Publisher’s Note: The statements, opinions and data contained in all publications are solely those of the individual author(s) and contributor(s) and not of MDPI and/or the editor(s). MDPI and/or the editor(s) disclaim responsibility for any injury to people or property resulting from any ideas, methods, instructions or products referred to in the content.

