Brief Report

Genetic Diversity, Kinship, and Polychromatism in the Spotted Eagle Ray Aetobatus ocellatus of Fiji

by
Kerstin Glaus
1,* and
Sharon A. Appleyard
2
1
School of Agriculture, Geography, Environment, Ocean and Natural Sciences, SAGEONS, The University of the South Pacific, Laucala Campus, Suva, Fiji
2
CSIRO Australian National Fish Collection, National Research Collections Australia, Hobart, TAS 7004, Australia
*
Author to whom correspondence should be addressed.
Diversity 2024, 16(9), 588; https://doi.org/10.3390/d16090588
Submission received: 17 June 2024 / Revised: 18 August 2024 / Accepted: 19 August 2024 / Published: 18 September 2024

Abstract

:
The spotted eagle ray Aetobatus ocellatus (Kuhl, 1923) has a widespread Indo-West Pacific distribution and displays substantial population genetic structuring. Genetic data are crucial for understanding the species’ diversity, connectivity, and adaptation. However, molecular genetic information on A. ocellatus from Melanesia is lacking, which impedes our understanding of gene flow among geographic regions. In this study, we sampled 45 A. ocellatus, primarily from Fiji’s largest fish market in the capital, Suva. Mitochondrial DNA Cytochrome C Oxidase subunit I (COI) barcoding was used for species identification, and DArT-seqTM technology was applied to assess the nuclear genetic diversity. Barcoding of the COI gene showed a 98.6% to 99.8% similarity to A. ocellatus reference sequences in the Barcode of Life Data System, and the 45 individuals were represented by three major evolutionary haplotype clusters. Genotyping resulted in 24,313 Single-Nucleotide Polymorphisms (SNPs) which were quality-filtered to 7094 SNPs per individual. The observed heterozygosity level was 0.310. The inbreeding coefficient was positive, and genotyping identified one full-sibling pair and one half-sibling pair from the 45 individuals. Additionally, eagle rays exhibit polychromatic patterns, and at least three ventral pattern variations were recorded in specimens from the market. Collectively, our main findings characterize the genetic profile of A. ocellatus in Fiji and can help to understand the diversification of this species within the region.

1. Introduction

Elasmobranchs (sharks and batoids) are of high conservation concern, as direct and indirect harvest has led to steep population declines [1,2,3], diversity deficits, and community shifts [4,5]. Geographical fragmentation, small population sizes, and low reproductive output can exacerbate the detrimental effects on genetic diversity in endangered populations [6,7,8]. Therefore, preserving genetic diversity, including remnant variations, is critical, as reduced diversity compromises a species’ adaptive capacity to environmental changes, evolution, and overall fitness [9,10,11,12]. In elasmobranchs, research on genetic structure and diversity has focused more on sharks, leaving batoids relatively less understood and data-deficient [13,14].
Batoids comprise four orders, 23 families, and approximately 663 species [15]. Pelagic eagle rays (Aetobatidae, Agassiz, 1858) include large to very large rays with disc widths (DW) in adults ranging from 90 cm to over three meters [15]. Members of this family have either plain dorsal colors or various patterns of white spots and rings, with chromatic structures reflecting distinct geographic subdivisions [16]. Pelagic eagle rays encompass five extant species, all belonging to the genus Aetobatus. The white-spotted eagle ray, Aetobatus narinari (Euphrasen, 1790), was considered a circumtropical species. However, variations in geographic morphology, parasitological data [17], and molecular diversity [18,19] suggested that it represents a species complex. The nomenclature of the whitespotted eagle ray complex was clarified by White et al. (2010) with three species currently recognized: A. narinari from the Atlantic Ocean; the Pacific eagle ray A. laticeps (Gill, 1865) from the Eastern Pacific, and the spotted eagle ray A. ocellatus (Kuhl, 1823) from the Indo-West Pacific [20].
The benthopelagic A. ocellatus is found in shallow inshore tropical and warm-temperate waters, where it frequents lagoons, estuaries, and coral reefs [15,21,22]. Population declines, primarily due to unregulated fishing activities and habitat degradation [23,24,25], have resulted in an Endangered status globally, according to the International Union for Conservation of Nature (IUCN) [26]. Molecular studies revealed substantial haplotype diversity, phylogeographic patterns, and genetic structuring, indicating limited gene flow [19]. Moreover, distinct A. ocellatus clades across the Indo-Pacific Ocean were inferred in phylogenetic reconstructions, with one shared between India and Hawaii and a second clade from French Polynesia, Japan, Hawaii, and Indonesia [27].
In Fiji, A. ocellatus is widely distributed across the archipelago [28] and is among the most commonly captured and traded batoid species in the country’s small-scale fishery. Batoids are considered a moderately important food resource but are relevant to food security as substitutes for bony fish [29]. Despite significant population genetic structuring in the Indo-West Pacific, molecular genetic information on A. ocellatus from Melanesian locations such as Fiji is lacking, impeding our understanding of gene flow among geographic regions. Herein, molecular markers, such as co-dominant, genome-wide Single-Nucleotide Polymorphism (SNP) loci, are useful for studying genetic diversity, population structure, and evolutionary relationships among different species or populations [30,31,32,33]. The present study investigates the molecular genetic diversity of A. ocellatus in Fiji. The primary goal was to characterize the genetic profile of the species by examining parameters such as heterozygosity levels, inbreeding coefficients, and kinship parameters. The study specifically aimed to (1) identify the species using COI barcoding; (2) assess COI mtDNA diversity within the sampled specimens; and (3) determine genomic diversity using SNPs, including kinship analysis as outlined by [34]. Collectively, these findings help identify potential genetic risks for A. ocellatus in Fiji and contribute to understanding diversification within this batoid in the region.

2. Materials and Methods

2.1. Sample Collection

To obtain samples for species identification, genetic diversity, and kinship analysis, the Suva fish market in eastern Viti Levu was visited one to three times per week from January 2022 to March 2023. Tissue sampling was only conducted with the verbal permission of each respective vendor, who was informed about the purpose of this survey. Forty-three samples from Suva were collected by one of the authors (KG, samples labeled with SV) or provided by a research colleague (see Acknowledgement, samples labeled with AO, AN). Two additional samples were obtained opportunistically: one from the Sigatoka fish market (SG_191122_1) in western Viti Levu, and one from a village in Tavua (TA_060723_1) in northern Viti Levu (Figure 1). Fin clips of approximately 1 cm2 were collected from each of the 45 specimens analyzed in this study. All samples were stored in Eppendorf tubes containing 95% ethanol and kept in a freezer at −4 °C until shipment and further processing (see below). Vendors were also asked to specify where each A. ocellatus was captured, if known. However, while vendors can indicate broader catch areas [29], they do not keep track of the exact locations where the fishers catch the fish; therefore, GPS coordinates are unavailable. Where agreed upon, images of specimens were taken to document color variations. Ray measurements were recorded for DW and disc length (DL) to the nearest centimeter [35], and see [29] for detailed size distribution data. No rays were purchased for this study.

2.2. DNA COI Barcoding for Species Identification
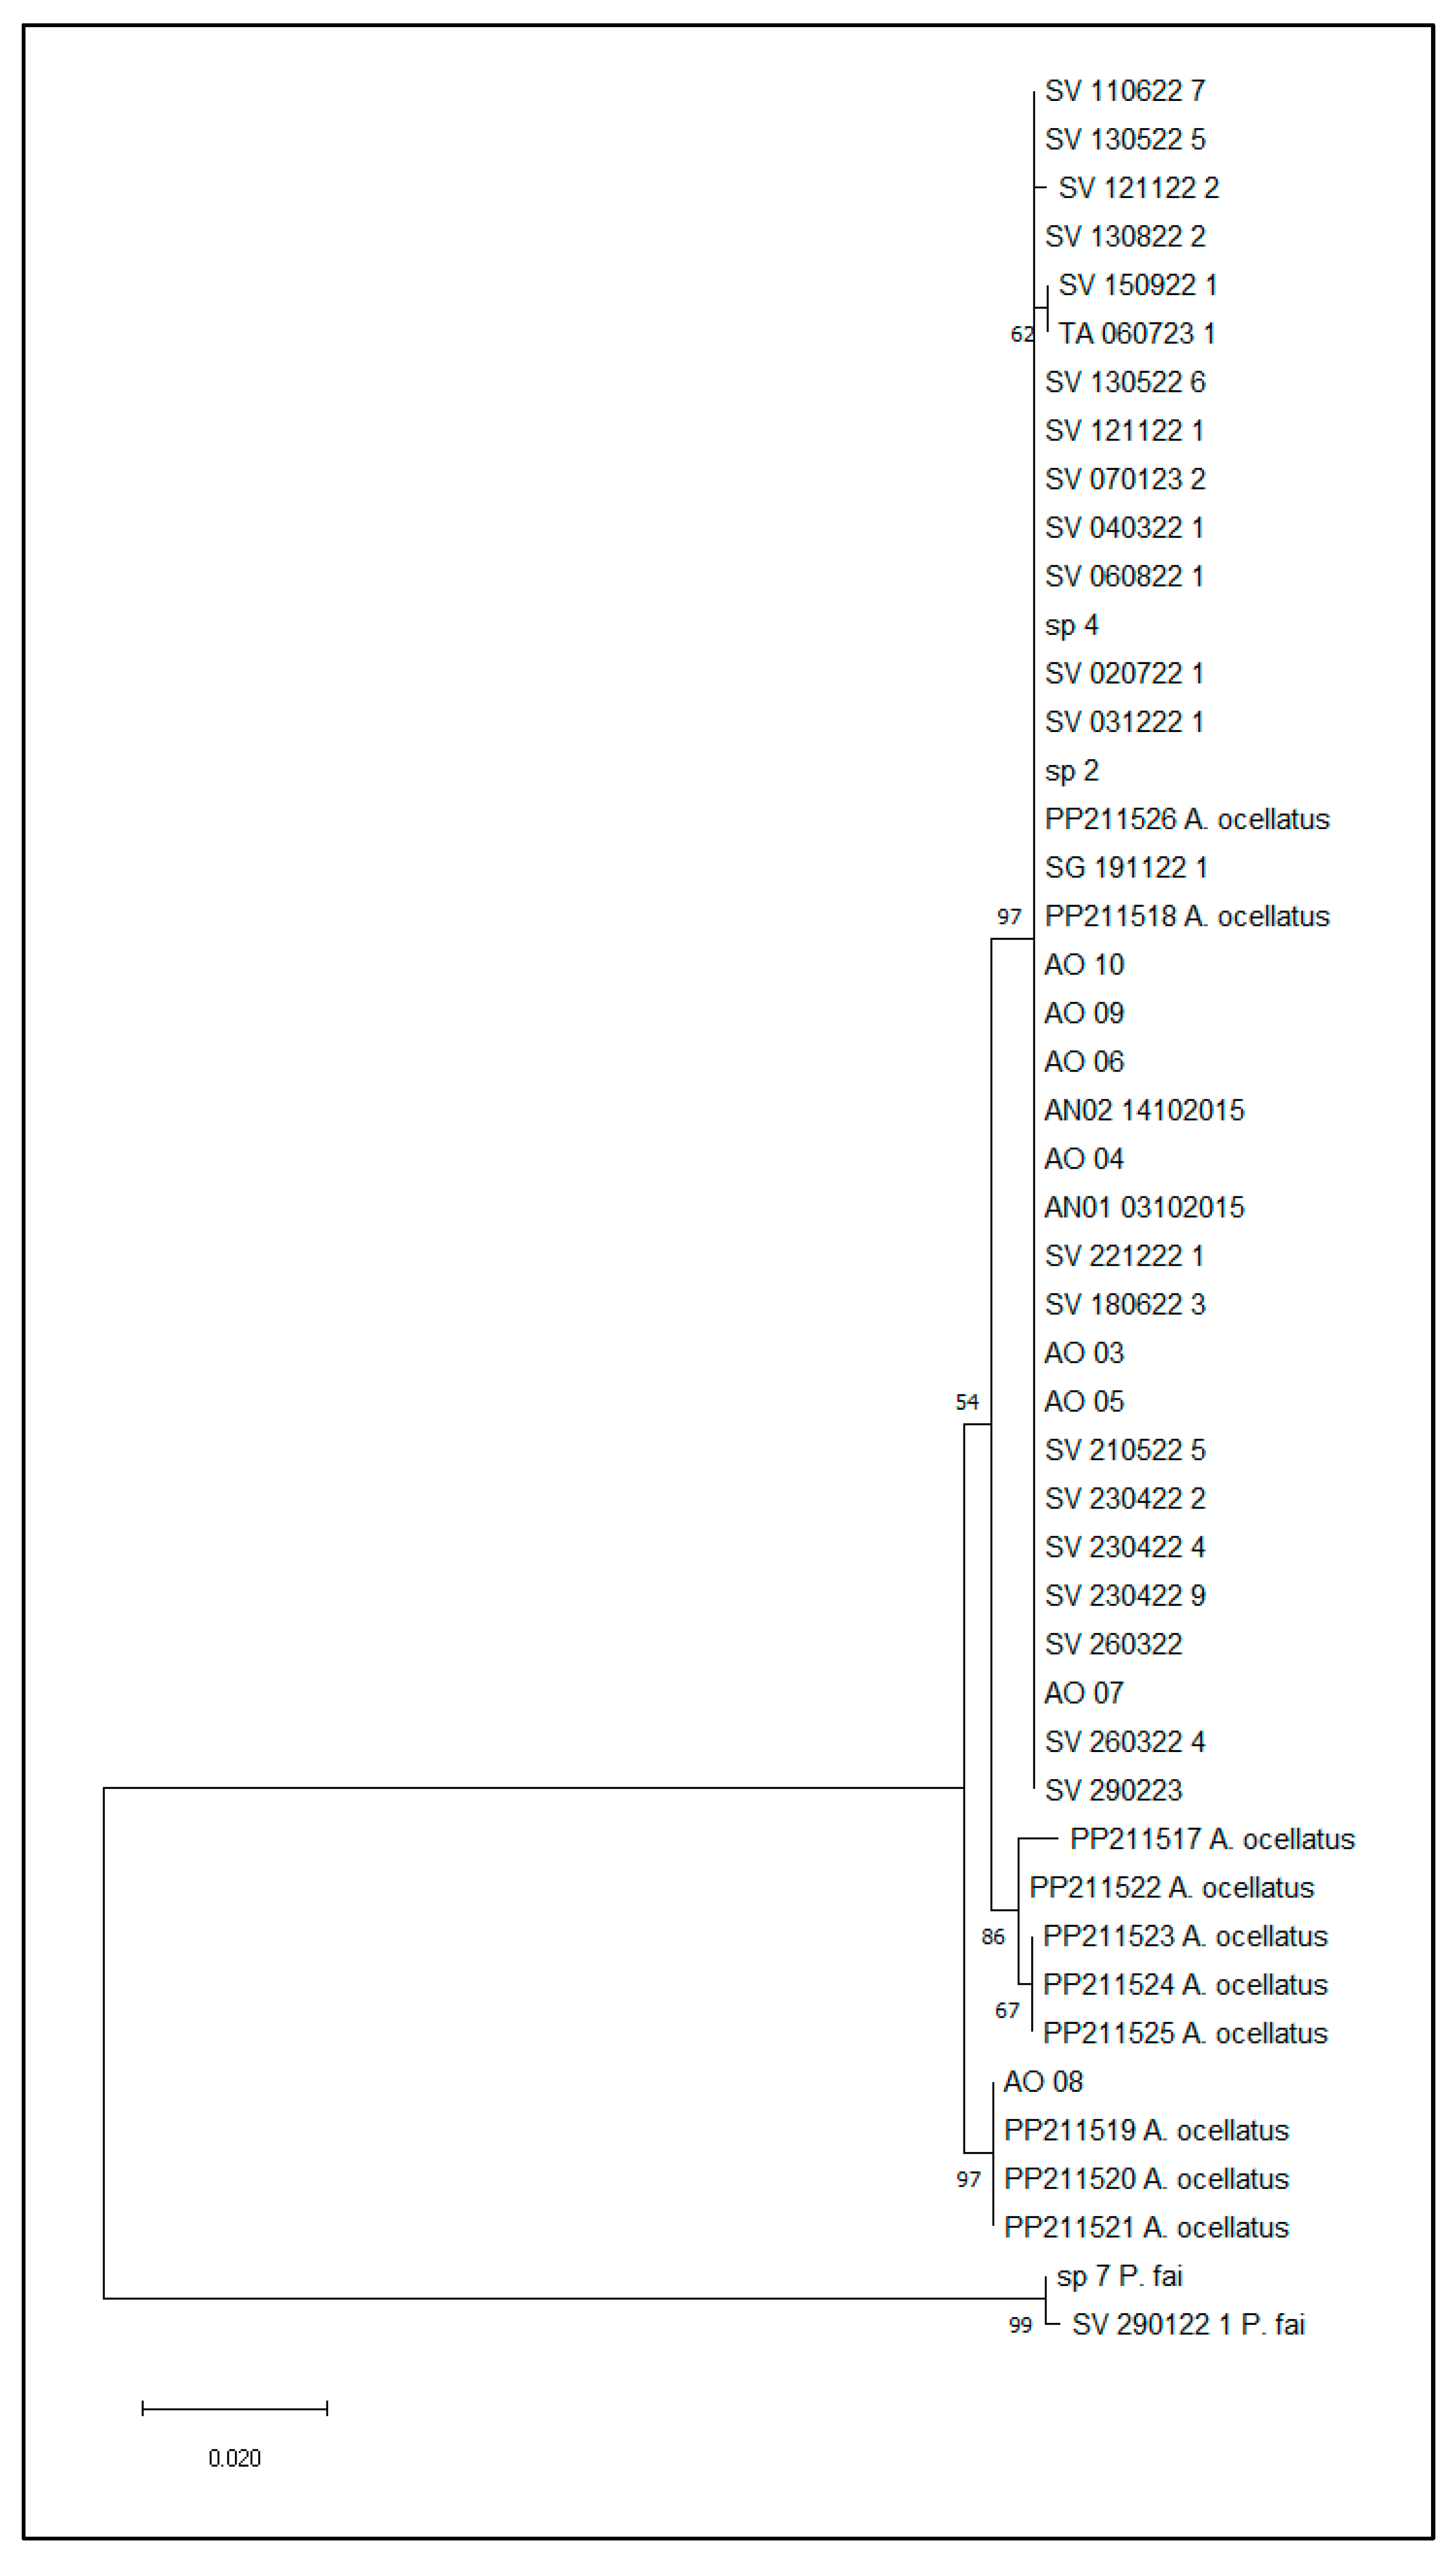
The mitochondrial DNA COI gene is one of the most widely used gene markers for species identification [36]. All tissue samples used for the genetic diversity analyses underwent COI barcoding. Genomic DNA was extracted from tissue sub-samples using standard robotic methods, followed by polymerase chain reactions (PCR) at Diversity Arrays Technology, Australia, using DArT-MP proprietary processes. A 652 bp fragment from the 5′ region of the COI was PCR amplified using FishF2 (5′TCGACTAATCATAAAGATATCGGCAC3′), FishR2 (5′ACTTCAGGGTGACCGAAGAAGAATCAGAA3′) [37], and FishF2N (5′ATCTTTGGTGCATGAGCAGGAATAGT3′) primers. Sequences were obtained through nanopore sequencing [38] undertaken at DArT, and species were identified using the Identification Engine at the Barcode of Life Data System (BOLD) [39] and by BLAST [40]. See Supplementary S1 for GenBank accession numbers for representative COI sequences from 10 of the 45 A. ocellatus individuals from Fiji. Figure 2 shows the COI haplotype Maximum Likelihood tree (from MEGA X; [41]) for the 45 A. ocellatus individuals with the pink whipray Pateobatis fai (Jordan and Seale, 1906) as an outgroup, based on 10,000 bootstrap replications and following determination of the best fit nucleotide model being the Kimura 2-parameter (K2P) [42].

2.3. DArT-SeqTM: Extraction and SNP Sequencing

SNP genotyping was performed at DArT using DArT-SeqTM. DNA was processed for reduced representation library construction, sequenced, and genotyped following previously developed and tested complexity reduction protocols [43] using a double restriction digest with PstI and SphI methylation-sensitive restriction enzymes. Libraries were sequenced on an Illumina HiSeq 2500 platform, and raw reads were processed using Illumina CASAVA v.1.8.2 software for an initial assessment of read quality and sequence representation. The DArT-PL proprietary software pipeline, DArTtoolbox, was implemented for further filtering and variant calling to generate the final genotype set.

2.4. SNP Quality Control Filtering

Quality control filtering steps were performed on the dataset; excluding duplicate SNPs possessing identical Clone IDs; removing loci with a call rate (proportion of individuals scored for a locus) < 95%; maintaining SNPs with a read depth > seven and minor allele frequencies (MAF) < 5%. Detection of loci under selection was not conducted because the limited number of samples collected outside of Suva and the lack of precise geographic locations hindered the establishment of reliable FST values for different locations [44].

2.5. Allelic Diversity, Relatedness, and Structure

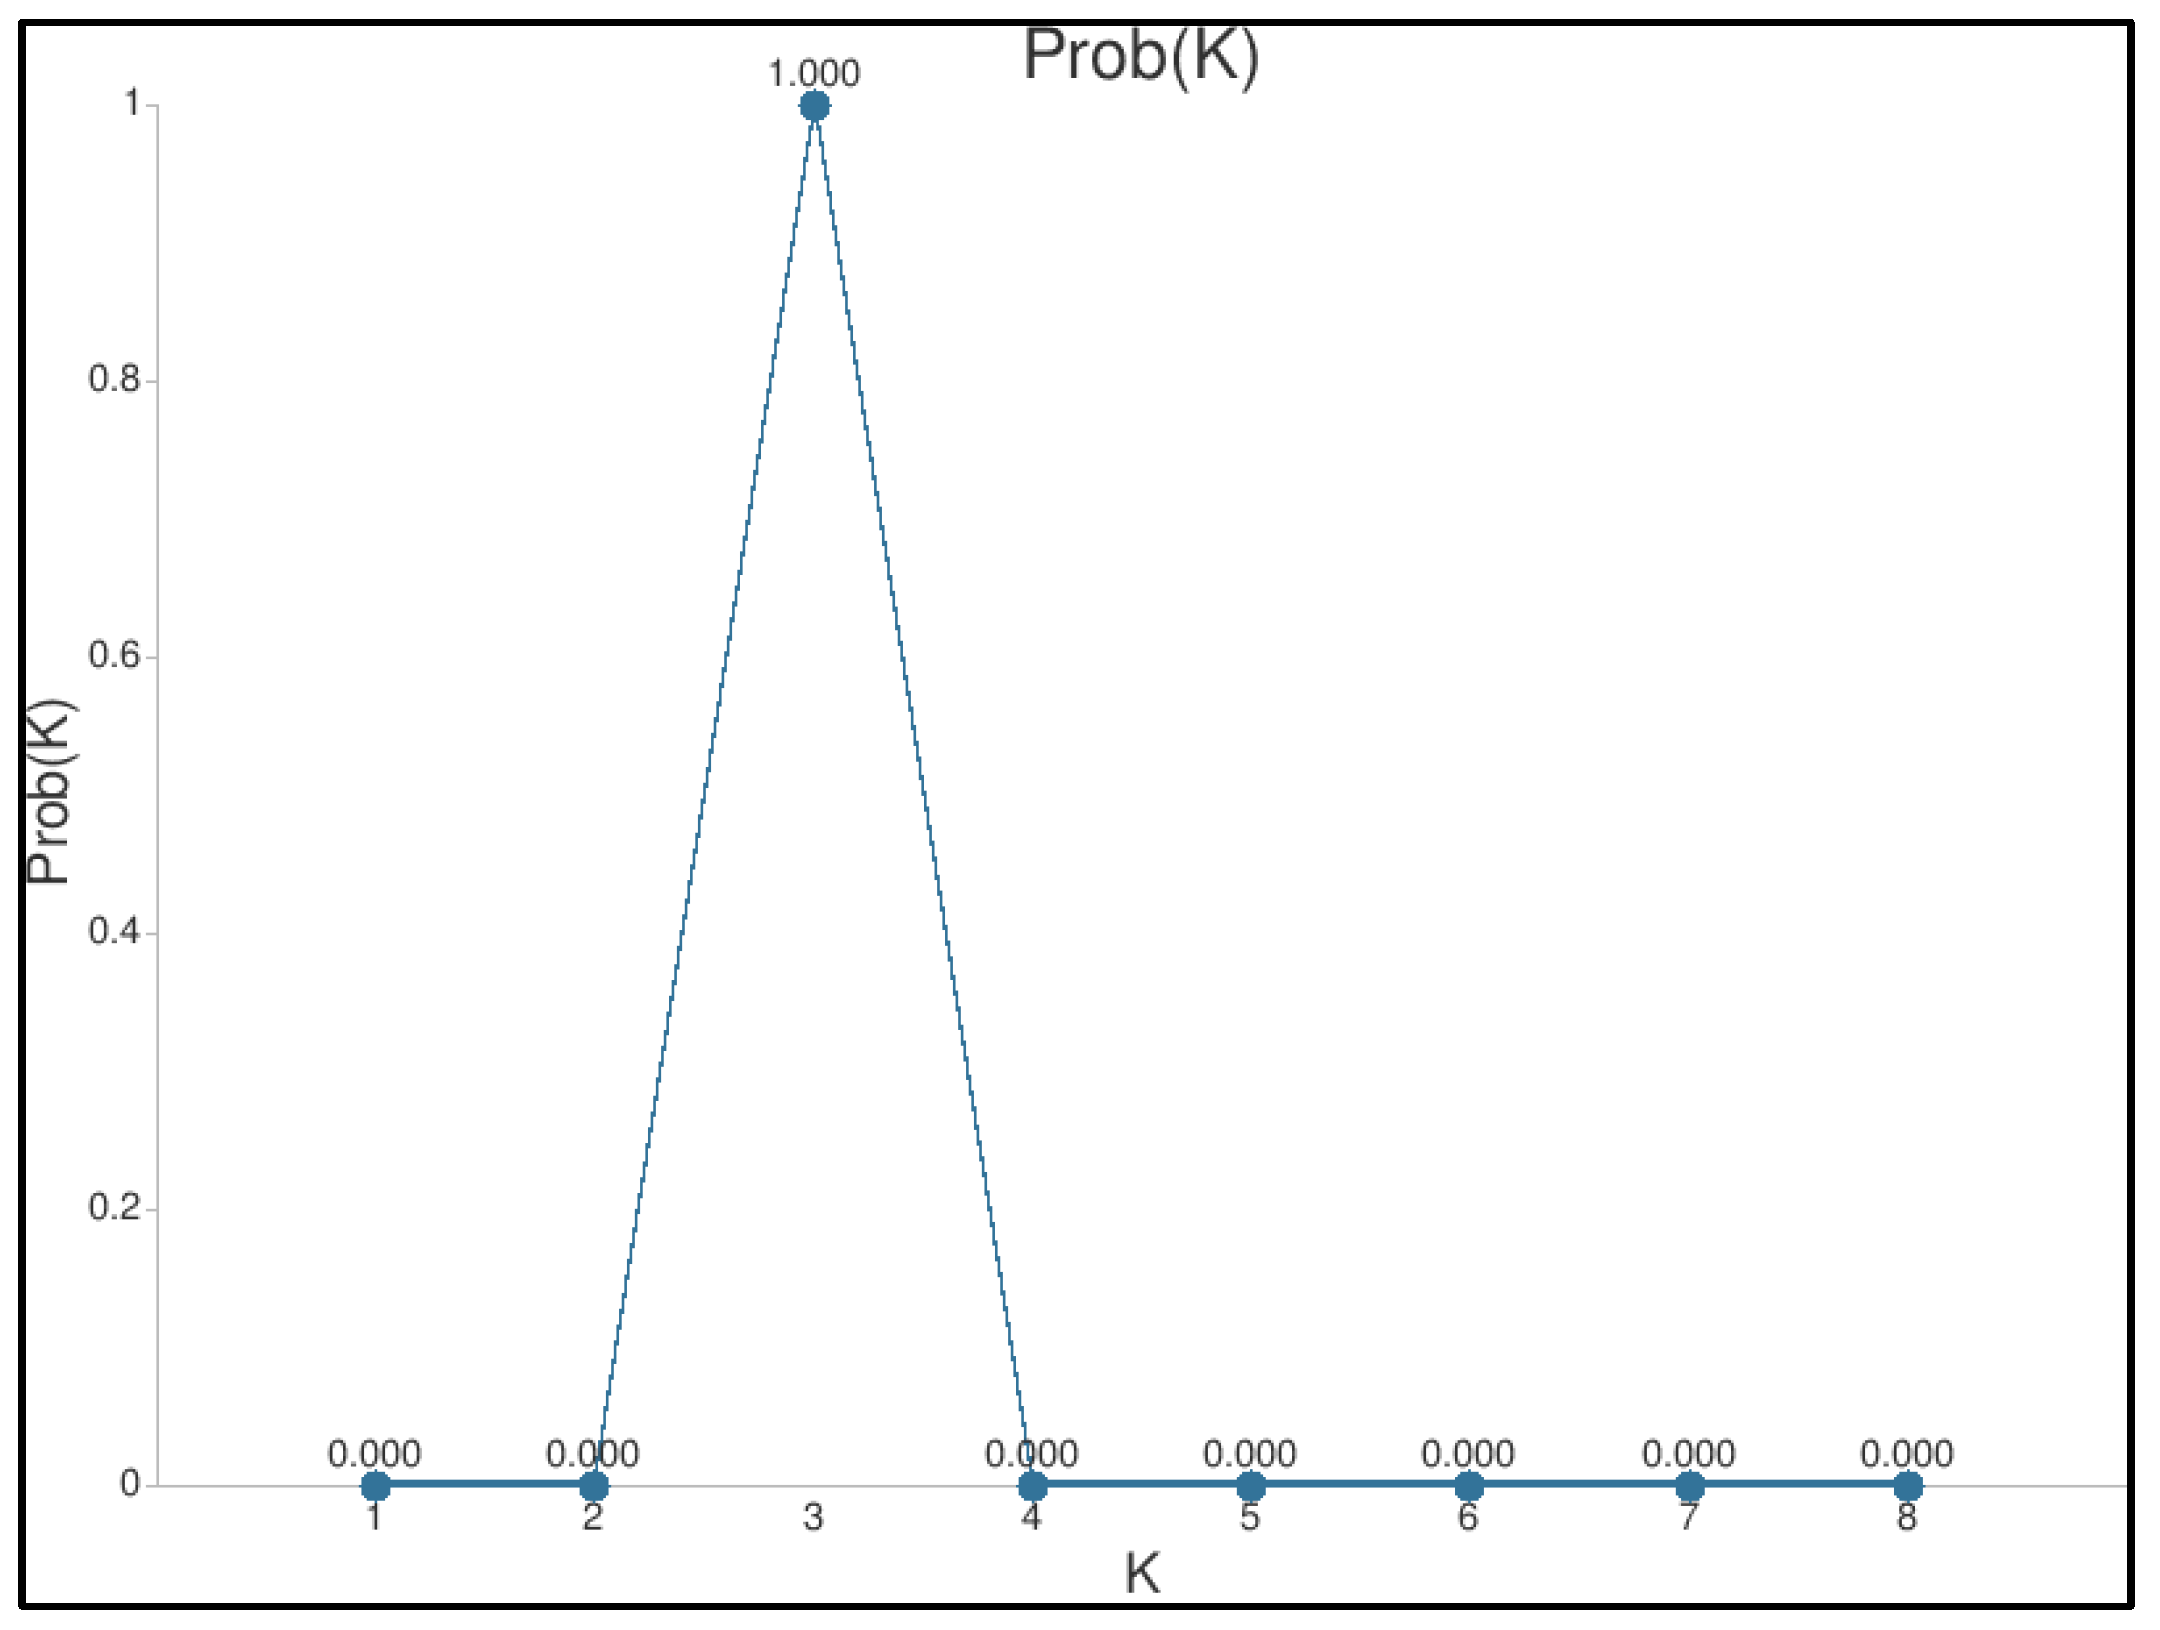
Allelic diversity indices, including average observed (Ho) and expected (He), were computed in Genetix v.4.05.2 [45], together with the inbreeding coefficient (FIS). COLONY [34] was used for relatedness analysis within the dataset. The number of likely genetic groups in the A. ocellatus SNP dataset for the 45 genotyped individuals (as sampled from the Suva fish market, Sigatoka fish market, and Tavua) was estimated using the Bayesian model-based clustering algorithm implemented in Structure (ver. 2.3.4) [46,47,48] run using an admixture model (without a priori knowledge of location) with correlated allele frequencies. Structure was run with K (number of clusters) set between one and eight, and five independent runs per K were undertaken. Each independent run had a burn-in of 50,000, followed by 100,000 Markov chain Monte Carlo (MCMC) iterations. The eight Structure runs were then processed using the Greedy algorithm on the CLUMPAK (Clustering Markov Packager Across K) server [49] to find the preferred value of K (based on ΔK and Best Prob(K)) as per [46,50], which demonstrated the uppermost level of structure in the SNP dataset.

3. Results

3.1. DNA COI Barcoding for Species Identification

All 45 samples were barcoded. The closest match for all samples was identified as A. ocellatus, with a similarity of 98.6% to 99.8%. The ML tree shows three major evolutionary haplotype clusters (Figure 2). The first cluster, with 97% bootstrap support, includes most specimens and two haplotypes. The second cluster, with 86% support, comprises five specimens and three haplotypes. The third cluster, also with 97% support, contains a single haplotype observed in four specimens. Examination of the genetic distance scale in the ML-tree suggests that the genetic differences between the A. ocellatus haplotypes are minimal, especially when compared to the genetic distance between all A. ocellatus haplotypes and P. fai. Despite this, there are nucleotide differences and base pair changes among the haplotypes (Figure 2). Representative haplotype examples have been submitted to GenBank.
Figure 2. Maximum likelihood tree (based on Kimura-2-parameter distance) generated in MEGA version X [41] for the 45 Aetobatus ocellatus individuals (including the representative GenBank accession individuals), with Pateobatis fai, sampled at the Suva fish market, included as an outgroup. The tree shown here has the highest log likelihood following 10,000 bootstrap replications. Each specimen is identified by either a GenBank accession or field identification number. Numbers on nodes indicate bootstrap values.
Diversity 16 00588 g002

3.2. SNP Filtering

Genotyping by sequencing resulted in 24,313 SNPs prior to quality control filtering [51], and 7094 filtered SNP loci.

3.3. Genomic Diversity, Relatedness, and Structure

Based on the 7094 SNPs screened, the observed heterozygosity level was 0.310, and the expected heterozygosity was 0.320. A positive FIS value (0.030) was found with one full-sib pair (FS) and one half-sib pair (HS) identified through COLONY in the cohort. The full-sibling pair, both females, were reportedly captured in the Rewa Delta with tissue samples collected on the same day. The half-sibling pair, both females, had disc widths of 53 cm and 66 cm, respectively. They were collected one month apart and also captured within the Rewa area (Figure 1). Based on the Structure analyses, the best number of Ks in the dataset was found to be K = 3 (Figure 3, Supplementary S2); however, without additional information as to where the 45 individuals were captured from and given that a full sib and half sib pair were detected, it is difficult to confirm the genetic groups in A. ocellatus sampled from the fish market. The 45 individuals also likely come from several age classes [29]. The best K, as per Evanno et al. (2005) [50], is less clear, with peaks observed at both K = 2 and K = 5. The highest ΔK value corresponds to K = 5 (Supplementary S3).

3.4. Intraspecific Polychromatism

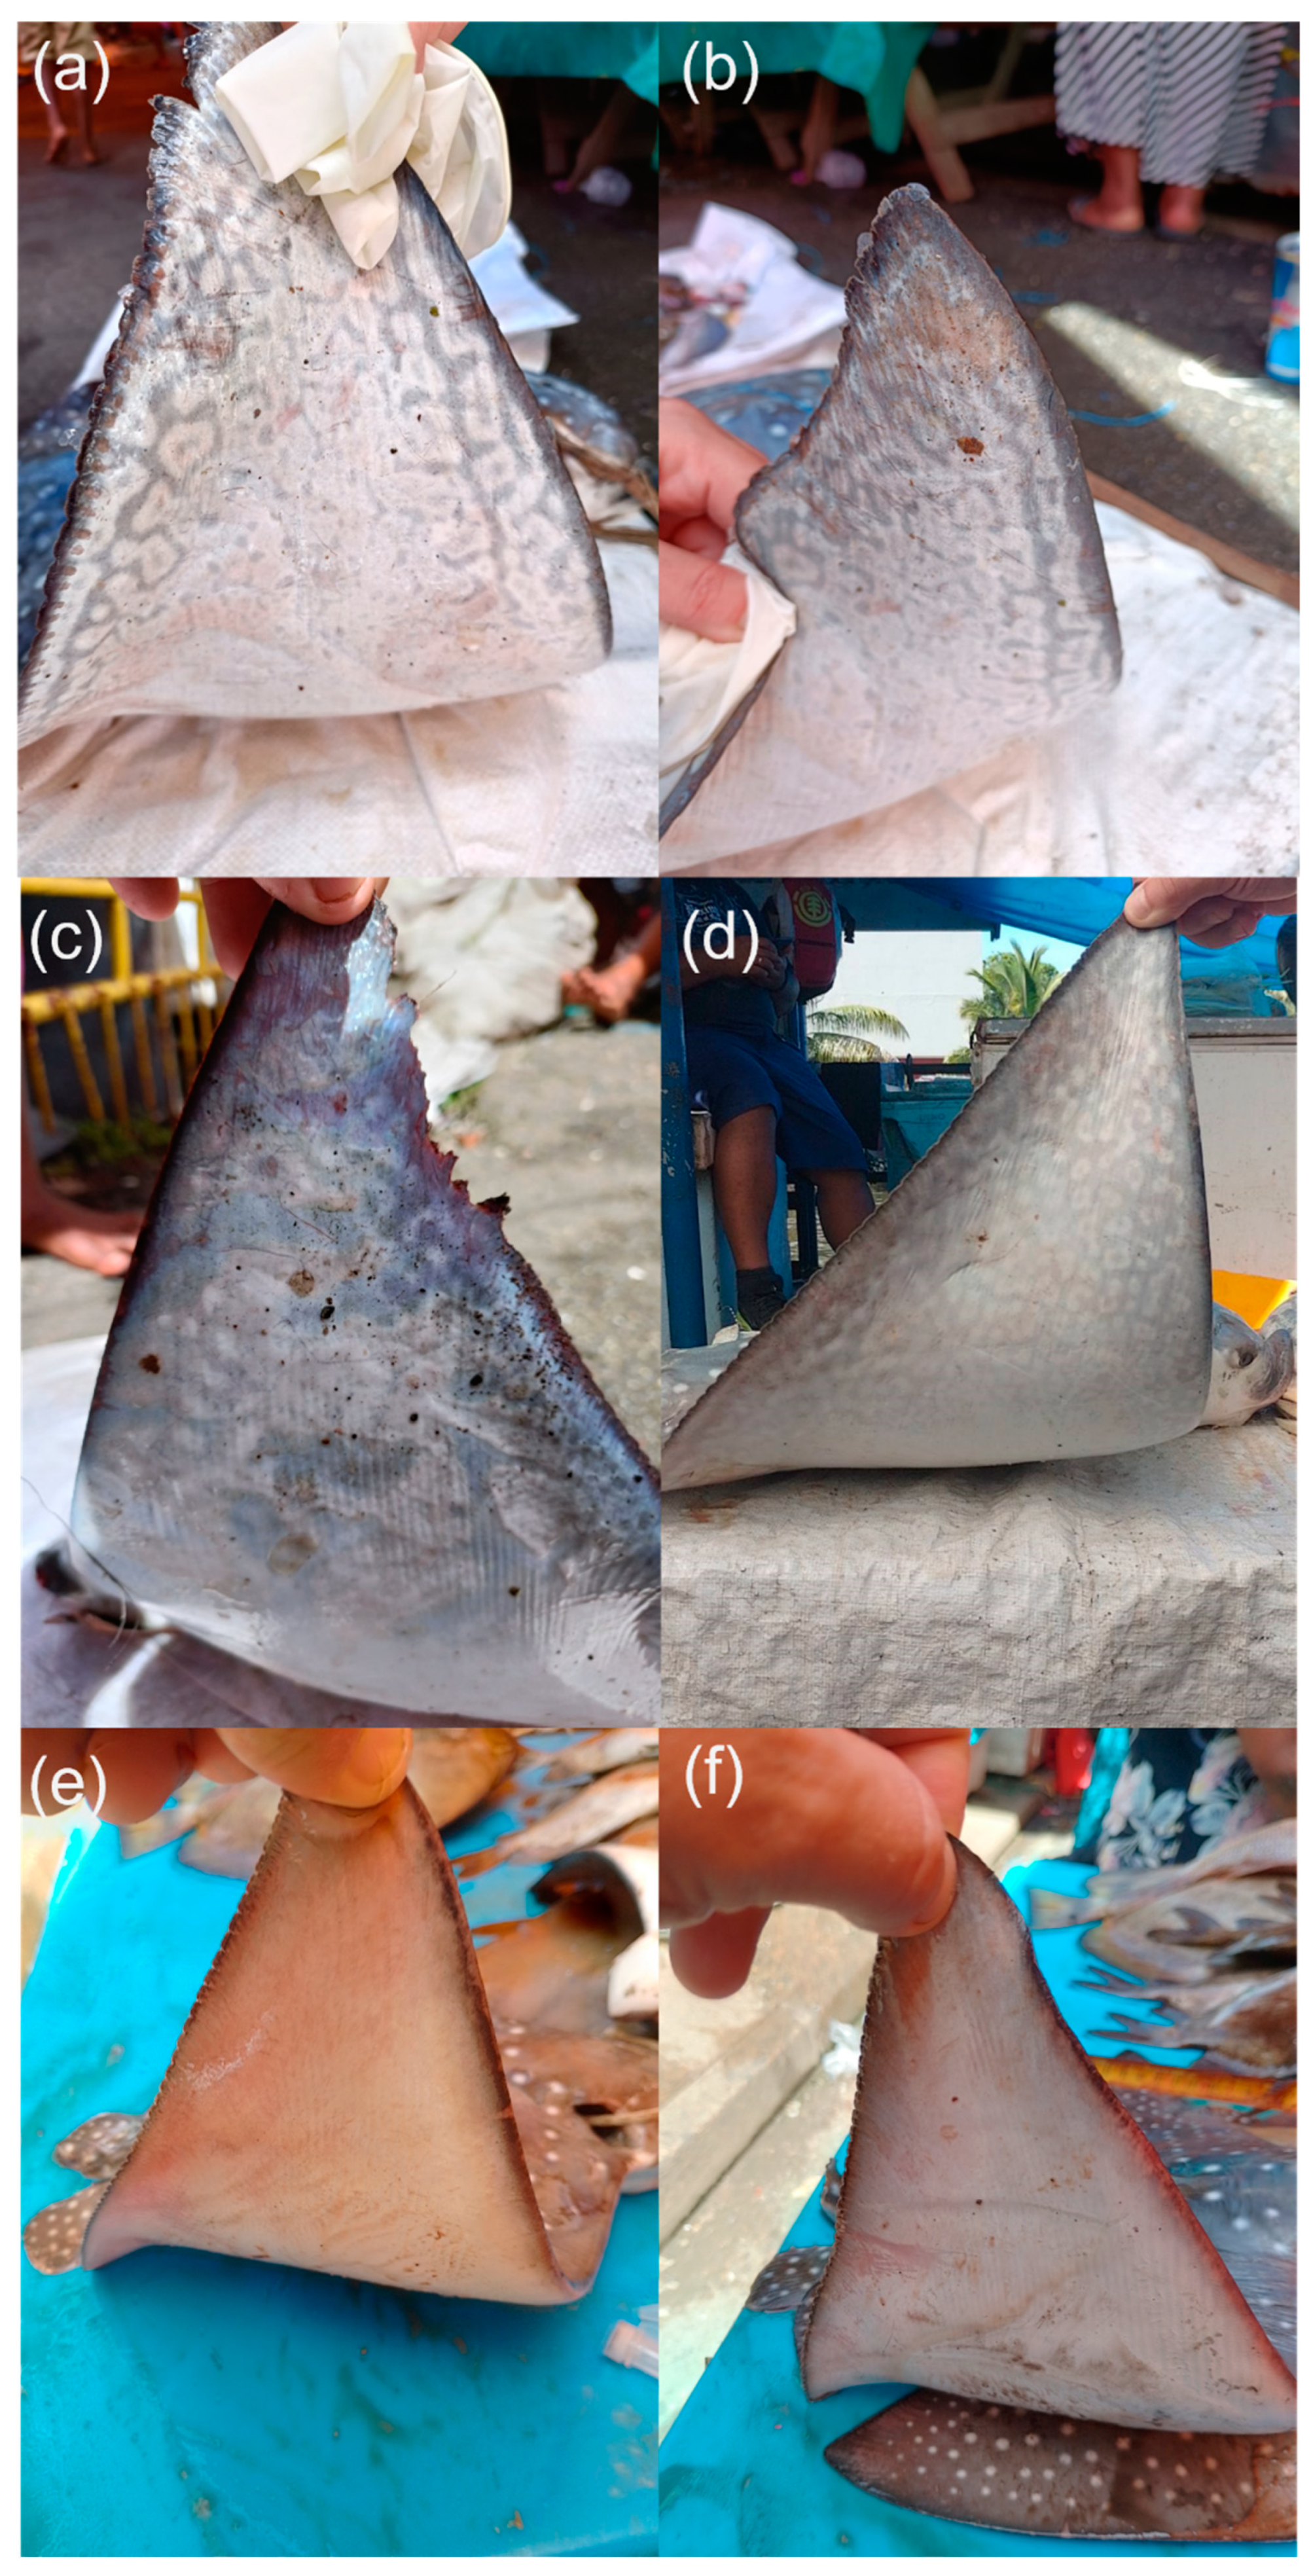
Aetobatus ocellatus specimens at the Suva fish market showed conspicuous variations in ventral chromatic patterns. Some individuals displayed a mosaic-like spot pattern along the edges, extending to the broader area of the ventral side of the pectoral fin (Figure 4a,b). Others had darker patterns (Figure 4c) or patterns covering almost the entire ventral side of the pectoral fin (Figure 4d). Conversely, certain specimens showed no patterns or coloration on the ventral side of the pectoral fins (Figure 4e,f).

4. Discussion

This study represents the first examination of genetic diversity in A. ocellatus in Fiji, focusing on heterozygosity levels, inbreeding coefficients, and kinship parameters. We also documented at least three different ventral color variations.

4.1. COI Barcoding and Genetic Diversity Estimates

The mtDNA barcoding identified the individuals as A. ocellatus, showing 98.6% to 99.8% pairwise matches to reference sequences in BOLD, with individuals displaying only minor intraspecific mtDNA genetic variation (Figure 2). The lack of precise GPS data and limited samples from regions outside Suva hindered further regional analysis within Fiji. Previous molecular analyses have suggested greater levels of speciation within the Aetobatus genus [19,20], and these results can help identify the genetic lineages and support further efforts to delineate species boundaries. The observed SNP-based heterozygosity was 0.310, which was similar to diversity values (obtained through SNP marker genotyping) for the maskray (Neotrygon sp.) in Fiji [52]. In contrast to our COI and nuclear SNP findings in Fijian A. ocellatus, previous nucleotide diversity estimates for nuclear microsatellites and mtDNA (cytb and ND4) in A. ocellatus populations across the Indo-Pacific were reported as 0.013 and 0.009, respectively [19]. Additionally, observed heterozygosity levels based on microsatellites in A. narinari exhibited minor variation across different locations: 0.713 in Florida, 0.718 in Mexico, and 0.747 in Cuba [53].
In this study, we primarily used the mtDNA COI gene for species identification of the A. ocellatus specimens. Including samples from Fiji in regional-scale genetic connectivity studies is recommended to improve our understanding of population dynamics, structure, and evolutionary processes in this ray within the Melanesian region. Considering the impact of marine barriers and large open-ocean distances on the genetic structure of elasmobranchs at multiple spatial scales [32,54,55,56], examining population genetic connectivity on a broader geographic scale could also elucidate whether samples from Fiji are distinct from the wider Indo-Pacific region. However, the ability to detect genetic structure varies across studies due to diverse molecular and analytical approaches. Mitochondrial DNA markers, evolving at slower rates, differ from highly polymorphic microsatellites and genomic markers [57,58]. Additionally, comparing SNP markers between studies is challenging due to random sampling across the genome. To overcome this, future studies should co-analyze samples of A. ocellatus (tissue sub-samples from the current study are maintained at −20 °C at the University of South Pacific and would be available for future use) rather than generate distinct marker sets for each sampled collection.

4.2. Kinship

In Suva, most marketed rays are reportedly captured around the Rewa Delta [29], where the full and half-sib pairs were also caught. The full-sib pair likely consisted of immature individuals, although size measurements were not taken on the sampling day so as to not interrupt sales activities. The Rewa River and Delta are known pupping grounds for at least two shark species [59,60], while oceanic manta rays Mobula birostris (Walbaum, 1792) aggregate at the adjacent Laucala Bay [61]. To determine the presence and habitat use patterns of A. ocellatus in the greater Rewa area, long-term fishery-independent tagging studies or aerial surveys are needed to document the temporal and spatial distribution and age class composition [62]. The presence of full-sib pairs may suggest a small or fragmented population, or hypothetically indicate individuals were captured in a pupping ground or nursery area. However, without long-term studies to quantify and accurately describe habitat use that aligns with the definition of a batoid nursery [62] and lacking definitive catch location data (i.e., GPS coordinates), this cannot be confirmed. Additionally, siblingship might also suggest a population where a smaller number of parents contributed to the offspring generation. The half-sib pair had a size difference of 13 cm in DW, with the larger specimen measuring 66 cm. A female A. narinari with a 100 cm DW was projected to grow 20 cm in 1.7 years [63], while Boggio-Pasqua et al. (2022) proposed this growth to occur within seven to 11 months on average [64]. However, A. narinari growth rates do not reflect rates for the larger and slower-growing A. ocellatus. The half-sib pair might belong to the same cohort or be paternal half-sibs, considering that gestation has been reported at 12 months and reproductive periodicity may not be annual [65]. Sourcing accurate biological data for A. ocellatus in Fiji is therefore necessary to understand the life history of the species.

4.3. Intraspecific Polychromatism

Male A. narinari tend to exhibit distinct spots in the dorsal region, often forming rings, whereas females appear to have less defined spots or annular marks [27]. In the present study, the sample size, however, is too small to infer sex-specific differences. In the Xingu freshwater stingray, Potamotrygon leopoldi, four distinct dorsal color patterns were identified, with statistically significant size differences indicating a link to ontogenetic changes [66]. Similarly, ventral polychromatism was observed in immature A. ocellatus of both sexes. However, due to the insufficient number of mature and immature specimens, we cannot confirm or rule out if these variations in A. ocellatus are also associated with ontogenetic color changes. Phenotypes often vary spatially in association with abiotic or biotic factors such as temperature, salinity, predators, or competitors [67], with phenotypic variation occurring over temporal and spatial scales in response to selection or reproductive success. The dichotomy in chromatic patterns on the ventral surface of A. ocellatus pectoral fins prompts the question of whether the phenotypic variation is environmental, genetic, or both. We did not attempt to investigate this in the current study; however, we propose that Quantitative Trait Locus (QTL) analysis could be useful to unravel the genetic basis of complex traits, such as the observed mosaic-like chromatic patterns in eagle rays. Through genetic mapping, QTL analysis could pinpoint specific genomic regions associated with polychromatism. By comparing the genetic makeup, for example, of individuals with mosaic patterns to those with plain white patterns, potential loci influencing these traits could be identified [68]. Given analogous observations in eagle rays from Australia, comparing candidate genes and habitat utilization along environmental gradients of different phenotypes may reveal the molecular mechanisms influencing pigmentation and pattern formation in A. ocellatus. Lastly, although the data are currently limited, the photographs (Figure 4) may still be useful for comparing whether A. ocellatus in the Melanesian region exhibits similar ventral polychromatism.

5. Conclusions

Our preliminary study on A. ocellatus in Fiji enhances the understanding of the species’ genetic composition and emphasizes the importance of ongoing monitoring efforts to gain deeper insights into its population dynamics. Multiple key knowledge gaps were identified and should be addressed in future studies: (1) further examination to delineate species boundaries and confirm genetic lineages; (2) population connectivity studies and demographic history, including effective population sizes across the Indo-Pacific, encompassing samples from Fiji; (3) time-series of biological data to assess size-at-maturity levels and growth estimates; (4) determining how A. ocellatus uses the Rewa Delta and surrounding areas (e.g., putative pupping grounds); and (5) QTL analyses to identify potential molecular mechanisms influencing polychromatism in A. ocellatus.

Supplementary Materials

The following supporting information can be downloaded at: https://www.mdpi.com/article/10.3390/d16090588/s1, File S1: GenBank accession numbers for representative COI haplotypes in Aetobatus ocellatus from Fiji; File S2: CLUMPAK Pipeline output; File S3: Best K by Evanno.

Author Contributions

K.G. and S.A.A. designed the study. K.G. collected the tissue samples. Both authors analyzed the data and created the figures. The manuscript was jointly authored by K.G. and S.A.A. All authors have read and agreed to the published version of the manuscript.

Funding

This work was funded by the Pacific European Union Marine Partnership (PEUMP) program within the PAGoDA Grant Agreement, key result area 6: “Capacity built through education, training and research and development for key stakeholder groups in fisheries and marine resource management”, led by the University of the South Pacific (USP) under the Institute of Marine Resources (IMR).

Institutional Review Board Statement

This research was approved by the PEUMP Project Management and the Head of the School of Agriculture, Geography, Environment, Ocean and Natural Sciences at the University of the South Pacific, Suva, Fiji. All tissue samples were shipped with the necessary export permit issued by the Ministry of Fisheries, Fiji, and import permit, provided by Diversity Arrays, Australia.

Data Availability Statement

An unfiltered SNP report will be made available on the data Dryad repository. Tissue sub-samples from the 45 A. ocellatus individuals are stored frozen at the USP and are available for future genomic studies on request.

Acknowledgments

Special thanks go to all market vendors at the Suva fish market. Gauthier Mescam and Sera Vaniqi are thanked for providing additional samples, and Rusila Savou for support during the sample collection. We acknowledge Will White and Helen O’Neill (CSIRO) for their evaluation and the PEUMP project team for their continuous support and advice during the study period. We also like to thank the two anonymous reviewers.

Conflicts of Interest

The authors declare no conflicts of interest.

References

  1. Dulvy, N.K.; Pacoureau, N.; Rigby, C.L.; Pollom, R.A.; Jabado, R.W.; Ebert, D.A.; Finucci, B.; Pollock, C.M.; Cheok, J.; Derrick, D.H. Overfishing drives over one-third of all sharks and rays toward a global extinction crisis. Curr. Biol. 2021, 31, 4773–4787.e8. [Google Scholar] [PubMed]
  2. Sherman, C.S.; Simpfendorfer, C.A.; Pacoureau, N.; Matsushiba, J.H.; Yan, H.F.; Walls, R.H.; Rigby, C.L.; VanderWright, W.J.; Jabado, R.W.; Pollom, R.A. Half a century of rising extinction risk of coral reef sharks and rays. Nat. Commun. 2023, 14, 15. [Google Scholar]
  3. Worm, B.; Orofino, S.; Burns, E.S.; D’Costa, N.G.; Manir Feitosa, L.; Palomares, M.L.; Schiller, L.; Bradley, D. Global shark fishing mortality still rising despite widespread regulatory change. Science 2024, 383, 225–230. [Google Scholar] [PubMed]
  4. Sherman, C.S.; Heupel, M.R.; Moore, S.K.; Chin, A.; Simpfendorfer, C.A. When sharks are away, rays will play: Effects of top predator removal in coral reef ecosystems. Mar. Ecol. Prog. Ser. 2020, 641, 145–157. [Google Scholar]
  5. Simpfendorfer, C.A.; Heithaus, M.R.; Heupel, M.R.; MacNeil, M.A.; Meekan, M.; Harvey, E.; Sherman, C.S.; Currey-Randall, L.M.; Goetze, J.S.; Kiszka, J.J. Widespread diversity deficits of coral reef sharks and rays. Science 2023, 380, 1155–1160. [Google Scholar]
  6. Allendorf, F.W.; Luikart, G.H.; Aitken, S.N. Conservation and the Genetics of Populations; John Wiley & Sons: Hoboken, NJ, USA, 2012. [Google Scholar]
  7. Dudgeon, C.L.; Blower, D.; Broderick, D.; Giles, J.; Holmes, B.J.; Kashiwagi, T.; Krück, N.; Morgan, J.; Tillett, B.; Ovenden, J. A review of the application of molecular genetics for fisheries management and conservation of sharks and rays. J. Fish Biol. 2012, 80, 1789–1843. [Google Scholar] [PubMed]
  8. Luikart, G.; Kardos, M.; Hand, B.K.; Rajora, O.P.; Aitken, S.N.; Hohenlohe, P.A. Population genomics: Advancing understanding of nature. In Population Genomics: Concepts, Approaches and Applications; Springer: Cham, Switzerland, 2019; pp. 3–79. [Google Scholar]
  9. Frankham, R. Genetics and conservation biology. Comptes Rendus Biol. 2003, 326, 22–29. [Google Scholar]
  10. DiBattista, J.D. Patterns of genetic variation in anthropogenically impacted populations. Conserv. Genet. 2008, 9, 141–156. [Google Scholar]
  11. Hernández, S.; Daley, R.; Walker, T.; Braccini, M.; Varela, A.; Francis, M.P.; Ritchie, P.A. Demographic history and the South Pacific dispersal barrier for school shark (Galeorhinus galeus) inferred by mitochondrial DNA and microsatellite DNA mark. Fish. Res. 2015, 167, 132–142. [Google Scholar]
  12. Vrijenhoek, R. Genetic diversity and fitness in small populations. In Conservation Genetics; Springer: Berlin/Heidelberg, Germany, 1994; pp. 37–53. [Google Scholar]
  13. Bräutigam, A.; Callow, M.; Campbell, I.R. Global Priorities for Conserving Sharks and Rays: A 2015–2025 Strategy. IUCN: International Union for Conservation of Nature. Global Sharks and Rays Initiative, IUCN Species Survival Commission (SSC), Shark Specialist Group, The Shark Trust, UK, TRAFFIC International, Wildlife Conservation Society (WCS), US, WWF. 2016. Available online: https://coilink.org/20.500.12592/s532n0 (accessed on 18 August 2024).
  14. Hirschfeld, M.; Dudgeon, C.; Sheaves, M.; Barnett, A. Barriers in a sea of elasmobranchs: From fishing for populations to testing hypotheses in population genetics. Glob. Ecol. Biogeogr. 2021, 30, 2147–2163. [Google Scholar]
  15. Last, P.; Naylor, G.; Séret, B.; White, W.; de Carvalho, M.; Stehmann, M. Rays of the World; CSIRO Publishing: Clayton, Australia, 2016. [Google Scholar]
  16. McEachran, J.D.M.R.C. Myliobatidae. The Living Marine Resources of the Western Central Atlantic. Volume 1: Introduction, Mollusks, Crustaceans, Hagfishes, Sharks, Batoid Fishes, and Chimaeras; Carpenter, K.E., Ed.; California Academy of Sciences: San Francisco, CA, USA; FAO: Rome, Italy, 2002; pp. 578–582. [Google Scholar]
  17. Marie, A.D.; Justine, J.-L. Monocotylids (Monogenea: Monopisthocotylea) from Aetobatus cf. narinari off New Caledonia, with a description of Decacotyle elpora n. sp. Syst. Parasitol. 2005, 60, 175–185. [Google Scholar] [PubMed]
  18. Richards, V.P.; Henning, M.; Witzell, W.; Shivji, M.S. Species delineation and evolutionary history of the globally distributed spotted eagle ray (Aetobatus narinari). J. Hered. 2009, 100, 273–283. [Google Scholar] [PubMed]
  19. Schluessel, V.; Broderick, D.; Collin, S.; Ovenden, J. Evidence for extensive population structure in the white-spotted eagle ray within the Indo-Pacific inferred from mitochondrial gene sequences. J. Zool. 2010, 281, 46–55. [Google Scholar]
  20. White, W.; Last, P.; Naylor, G.; Jensen, K.; Caira, J. Clarification of Aetobatus ocellatus (Kuhl, 1823) as a valid species, and a comparison with Aetobatus narinari (Euphrasen, 1790)(Rajiformes: Myliobatidae). CSIRO Mar. Atmos. Res. Pap. 2010, 32, 141. [Google Scholar]
  21. Berthe, C. First ecological, biological and behavioral insights of the ocellated eagle ray Aetobatus ocellatus in French Polynesia. Biodivers. Ecol. 2017. Available online: https://ephe.hal.science/hal-01690359/ (accessed on 18 August 2024).
  22. Berthe, C.; Waqalevu, V.P.; Latry, L.; Besson, M.; Lerouvreur, F.; Siu, G.; Lecellier, G.; Rummer, J.L.; Bertucci, F.; Iglésias, S. Distribution patterns of ocellated eagle rays, Aetobatus ocellatus, along two sites in Moorea Island, French Polynesia. Cybium 2018, 42, 313–320. [Google Scholar]
  23. White, W.T.; Last, P.R.; Stevens, J.D.; Yearsly, G. Economically Important Sharks and Rays of Indonesia; ACIAR Publishing: Canberra, Australia, 2006. [Google Scholar]
  24. Theivasigamani, M.; Subbiah, S. Elasmobranch fishery resources of Gulf of Mannar, southeast coast of India. World J. Fish Mar. Sci. 2014, 6, 24–29. [Google Scholar]
  25. Spaet, J.L.; Berumen, M.L. Fish market surveys indicate unsustainable elasmobranch fisheries in the Saudi Arabian Red Sea. Fish. Res. 2015, 161, 356–364. [Google Scholar]
  26. Kyne, P.M.; Dudgeon, C.L.; Ishihara, H.; Dudley, S.F.J.; White, W.T. Spotted Eagle Ray. 2016. Available online: https://www.iucnredlist.org/species/42566169/42566212 (accessed on 10 June 2024).
  27. Sales, J.B.L.; de Oliveira, C.N.; dos Santos, W.C.R.; Rotundo, M.M.; Ferreira, Y.; Ready, J.; Sampaio, I.; Oliveira, C.; Cruz, V.P.; Lara-Mendoza, R.E. Phylogeography of eagle rays of the genus Aetobatus: Aetobatus narinari is restricted to the continental western Atlantic Ocean. Hydrobiologia 2019, 836, 169–183. [Google Scholar]
  28. Glaus, K.; Gordon, L.; Vierus, T.; Marosi, N.D.; Sykes, H. Rays in the Shadows: Batoid Diversity, Occurrence, and Conservation Status in Fiji. Biology 2024, 13, 73. [Google Scholar] [CrossRef]
  29. Glaus, K.; Savou, R.; Brunnschweiler, J.M. Characteristics of Fiji’s small-scale ray fishery and its relevance to food security. Mar. Policy 2024, 163, 106082. [Google Scholar]
  30. Morin, P.A.; Luikart, G.; Wayne, R.K.; Group, S.W. SNPs in ecology, evolution and conservation. Trends Ecol. Evol. 2004, 19, 208–216. [Google Scholar]
  31. Pazmiño, D.A.; Maes, G.E.; Simpfendorfer, C.A.; Salinas-de-León, P.; van Herwerden, L. Genome-wide SNPs reveal low effective population size within confined management units of the highly vagile Galapagos shark (Carcharhinus galapagensis). Conserv. Genet. 2017, 18, 1151–1163. [Google Scholar]
  32. Devloo-Delva, F.; Burridge, C.; Kyne, P.; Brunnschweiler, J.; Chapman, D.; Charvet, P.; Chen, X.; Cliff, G.; Daly, R.; Drymon, M. From rivers to ocean basins: The role of ocean barriers and philopatry in the genetic structuring of a cosmopolitan coastal predator. Authorea Prepr. 2022. Available online: https://www.researchgate.net/publication/364575245_From_rivers_to_ocean_basins_the_role_of_ocean_barriers_and_philopatry_in_the_genetic_structuring_of_a_cosmopolitan_coastal_predator (accessed on 18 August 2024).
  33. Postaire, B.D.; Devloo-Delva, F.; Brunnschweiler, J.M.; Charvet, P.; Chen, X.; Cliff, G.; Daly, R.; Drymon, J.M.; Espinoza, M.; Fernando, D. Global genetic diversity and historical demography of the Bull Shark. J. Biogeogr. 2023, 51, 632–648. [Google Scholar]
  34. Jones, O.R.; Wang, J. COLONY: A program for parentage and sibship inference from multilocus genotype data. Mol. Ecol. Resour. 2010, 10, 551–555. [Google Scholar] [PubMed]
  35. Dale, J.; Holland, K. Age, growth and maturity of the brown stingray (Dasyatis lata) around Oahu, Hawai’i. Mar. Freshw. Res. 2012, 63, 475–484. [Google Scholar]
  36. Ward, R.D.; Holmes, B.H.; White, W.T.; Last, P.R. DNA barcoding Australasian chondrichthyans: Results and potential uses in conservation. Mar. Freshw. Res. 2008, 59, 57–71. [Google Scholar]
  37. Ward, R.D.; Zemlak, T.S.; Innes, B.H.; Last, P.R.; Hebert, P.D. DNA barcoding Australia's fish species. Philos. Trans. R. Soc. B Biol. Sci. 2005, 360, 1847–1857. [Google Scholar]
  38. Wang, Y.; Zhao, Y.; Bollas, A.; Wang, Y.; Au, K.F. Nanopore sequencing technology, bioinformatics and applications. Nat. Biotechnol. 2021, 39, 1348–1365. [Google Scholar]
  39. Ratnasingham, S.; Hebert, P.D. BOLD: The Barcode of Life Data System (http://www.barcodinglife.org). Mol. Ecol. Notes 2007, 7, 355–364. [Google Scholar] [PubMed]
  40. Madden, T. The BLAST sequence analysis tool. In The NCBl Handbook; National Center for Biotechnology Information (US): Bethesda, MD, USA, 2003. [Google Scholar]
  41. Kumar, S.; Stecher, G.; Li, M.; Knyaz, C.; Tamura, K. MEGA X: Molecular evolutionary genetics analysis across computing platforms. Mol. Biol. Evol. 2018, 35, 1547. [Google Scholar]
  42. Kimura, M. A simple method for estimating evolutionary rates of base substitutions through comparative studies of nucleotide sequences. J. Mol. Evol. 1980, 16, 111–120. [Google Scholar]
  43. Marie, A.D.; Herbinger, C.; Fullsack, P.; Rico, C. First reconstruction of kinship in a scalloped hammerhead shark aggregation reveals the mating patterns and breeding sex ratio. Front. Mar. Sci. 2019, 6, 676. [Google Scholar]
  44. Foll, M.; Gaggiotti, O. A genome-scan method to identify selected loci appropriate for both dominant and codominant markers: A Bayesian perspective. Genetics 2008, 180, 977–993. [Google Scholar]
  45. Belkhir, K. GENETIX, Logiciel Sous WindowsTM Pour la Génétique des Populations. 1999. Available online: https://kimura.univ-montp2.fr/genetix/ (accessed on 18 August 2024).
  46. Pritchard, J.K.; Stephens, M.; Donnelly, P. Inference of population structure using multilocus genotype data. Genetics 2000, 155, 945–959. [Google Scholar] [PubMed]
  47. Falush, D.; Stephens, M.; Pritchard, J.K. Inference of population structure using multilocus genotype data: Linked loci and correlated allele frequencies. Genetics 2003, 164, 1567–1587. [Google Scholar]
  48. Hubisz, M.J.; Falush, D.; Stephens, M.; Pritchard, J.K. Inferring weak population structure with the assistance of sample group information. Mol. Ecol. Resour. 2009, 9, 1322–1332. [Google Scholar]
  49. Kopelman, N.M.; Mayzel, J.; Jakobsson, M.; Rosenberg, N.A.; Mayrose, I. Clumpak: A program for identifying clustering modes and packaging population structure inferences across K. Mol. Ecol. Resour. 2015, 15, 1179–1191. [Google Scholar]
  50. Evanno, G.; Regnaut, S.; Goudet, J. Detecting the number of clusters of individuals using the software STRUCTURE: A simulation study. Mol. Ecol. 2005, 14, 2611–2620. [Google Scholar]
  51. Carson, A.R.; Smith, E.N.; Matsui, H.; Brækkan, S.K.; Jepsen, K.; Hansen, J.-B.; Frazer, K.A. Effective filtering strategies to improve data quality from population-based whole exome sequencing studies. BMC Bioinform. 2014, 15, 125. [Google Scholar]
  52. Glaus, K.; Loganimoce, E.; Mescam, G.; Appleyard, S.A. Genetic diversity of an undescribed cryptic maskray (Neotrygon sp.) species from Fiji. Pac. Conserv. Biol. 2024, in press. [Google Scholar]
  53. Sellas, A.B.; Bassos-Hull, K.; Pérez-Jiménez, J.C.; Angulo-Valdés, J.A.; Bernal, M.A.; Hueter, R.E. Population structure and seasonal migration of the spotted eagle ray, Aetobatus narinari. J. Hered. 2015, 106, 266–275. [Google Scholar] [PubMed]
  54. Glaus, K.B.; Appleyard, S.A.; Stockwell, B.; Brunnschweiler, J.M.; Shivji, M.; Clua, E.; Marie, A.D.; Rico, C. Insights Into Insular Isolation of the Bull Shark, Carcharhinus leucas (Müller and Henle, 1839), in Fijian Waters. Front. Mar. Sci. 2020, 7, 586015. [Google Scholar]
  55. Canfield, S.J.; Galván-Magaña, F.; Bowen, B.W. Little sharks in a big world: Mitochondrial DNA reveals small-scale population structure in the California horn shark (Heterodontus francisci). J. Hered. 2022, 113, 298–310. [Google Scholar]
  56. Swift, D.G.; O’Leary, S.J.; Grubbs, R.D.; Frazier, B.S.; Fields, A.T.; Gardiner, J.M.; Drymon, J.M.; Bethea, D.M.; Wiley, T.R.; Portnoy, D.S. Philopatry influences the genetic population structure of the blacktip shark (Carcharhinus limbatus) at multiple spatial scales. Mol. Ecol. 2023, 32, 4953–4970. [Google Scholar] [PubMed]
  57. Wang, I.J. Recognizing the Temporal Distinctions between Landscape Genetics and Phylogeography; Wiley Online Library: Hoboken, NJ, USA, 2010. [Google Scholar]
  58. Benestan, L. Population genomics applied to fishery management and conservation. In Population Genomics: Marine Organisms; Springer: Cham, Switzerland, 2020; pp. 399–421. [Google Scholar]
  59. Brown, K.T.; Seeto, J.; Lal, M.M.; Miller, C.E. Discovery of an important aggregation area for endangered scalloped hammerhead sharks, Sphyrna lewini, in the Rewa River estuary, Fiji Islands. Pac. Conserv. Biol. 2016, 22, 242–248. [Google Scholar]
  60. Glaus, K.B.; Brunnschweiler, J.M.; Piovano, S.; Mescam, G.; Genter, F.; Fluekiger, P.; Rico, C. Essential waters: Young bull sharks in Fiji's largest riverine system. Ecol. Evol. 2019, 9, 7574–7585. [Google Scholar]
  61. Gordon, L.; Vierus, T. First photographic evidence of oceanic manta rays (Mobula birostris) at two locations in the Fiji islands. PeerJ 2022, 10, e13883. [Google Scholar]
  62. Martins, A.; Heupel, M.; Chin, A.; Simpfendorfer, C. Batoid nurseries: Definition, use and importance. Mar. Ecol. Prog. Ser. 2018, 595, 253–267. [Google Scholar]
  63. Utrera-López, N. Estimación de la Edad y Crecimiento de la raya águila Aetobatus Narinari (Euphrasen, 1790) en el sur del Golfo de México; Universidad Autónoma de Baja California Sur: La Paz, Mexico, 2015. [Google Scholar]
  64. Boggio-Pasqua, A.; Bassos-Hull, K.; Aeberhard, W.H.; Hoopes, L.A.; Swider, D.A.; Wilkinson, K.A.; Dureuil, M. Whitespotted eagle ray (Aetobatus narinari) age and growth in wild (in situ) versus aquarium-housed (ex situ) individuals: Implications for conservation and management. Front. Mar. Sci. 2022, 9, 960822. [Google Scholar]
  65. Schluessel, V.; Bennett, M.; Collin, S. Diet and reproduction in the white-spotted eagle ray Aetobatus narinari from Queensland, Australia and the Penghu Islands, Taiwan. Mar. Freshw. Res. 2010, 61, 1278–1289. [Google Scholar]
  66. Torres, Y.; Charvet, M.; Faria, V.; Charvet, P. Dots in the dark: Dorsal polychromatism in the endemic Xingu Freshwater Stingray. J. Zool. 2023, 321, 165–174. [Google Scholar]
  67. Conover, D.; Clarke, L.; Munch, S.; Wagner, G. Spatial and temporal scales of adaptive divergence in marine fishes and the implications for conservation. J. Fish Biol. 2006, 69, 21–47. [Google Scholar]
  68. Erickson, D.L.; Fenster, C.B.; Stenøien, H.K.; Price, D. Quantitative trait locus analyses and the study of evolutionary process. Mol. Ecol. 2004, 13, 2505–2522. [Google Scholar] [PubMed]
Figure 1. Geographic overview of the Fiji Islands showing the locations of the Suva and Sigatoka fish markets (blue dots), where tissue samples of Aetobatus ocellatus were collected. The capture sites of the analyzed specimens, as identified by market vendors, are marked by red dots. A total of 43 samples were collected at the Suva fish market, with specimens caught in the Rewa–Tailevu area. One sample was collected at the Sigatoka fish market, with the catch site also being Sigatoka. Another sample was obtained from a village in Tavua, where it was caught. Brown areas denote reef structures.
Diversity 16 00588 g001
Figure 3. Probability of Best K value (from [46]) from eight sets of Structure runs, analyses based on SNPs in Aetobatus ocellatus sampled from the Suva fish market in 2022.
Diversity 16 00588 g003
Figure 4. Ventral polychromatism in immature Aetobatus ocellatus of both sexes, photographed at the Suva fish market. Disk widths ranged from a minimum of 43 cm to a maximum of 60 cm. Panels (ac), two males and one female photographed on 4 March 2023, panel (d), one male photographed on 3 December 2022, and panels (e,f), two females photographed on 7 January 2023.
Diversity 16 00588 g004
Disclaimer/Publisher’s Note: The statements, opinions and data contained in all publications are solely those of the individual author(s) and contributor(s) and not of MDPI and/or the editor(s). MDPI and/or the editor(s) disclaim responsibility for any injury to people or property resulting from any ideas, methods, instructions or products referred to in the content.