Article

Detection and Assessment of White Flowering Nectar Source Trees and Location of Bee Colonies in Rural and Suburban Environments Using Deep Learning

by
Atanas Z. Atanasov
1,*,
Boris I. Evstatiev
2,
Asparuh I. Atanasov
3 and
Ivaylo S. Hristakov
1
1
Department of Agricultural Machinery, Agrarian and Industrial Faculty, University of Ruse “Angel Kanchev”, 7017 Ruse, Bulgaria
2
Department of Automation and Electronics, Faculty of Electrical Engineering, Electronics, and Automation, University of Ruse “Angel Kanchev”, 7017 Ruse, Bulgaria
3
Department of Mechanics and Elements of Machines, Technical University of Varna, 9010 Varna, Bulgaria
*
Author to whom correspondence should be addressed.
Diversity 2024, 16(9), 578; https://doi.org/10.3390/d16090578
Submission received: 30 July 2024 / Revised: 8 September 2024 / Accepted: 11 September 2024 / Published: 13 September 2024
(This article belongs to the Special Issue Ecology and Diversity of Bees in Urban Environments)

Abstract

:
Environmental pollution with pesticides as a result of intensive agriculture harms the development of bee colonies. Bees are one of the most important pollinating insects on our planet. One of the ways to protect them is to relocate and build apiaries in populated areas. An important condition for the development of bee colonies is the rich species diversity of flowering plants and the size of the areas occupied by them. In this study, a methodology for detecting and distinguishing white flowering nectar source trees and counting bee colonies is developed and demonstrated, applicable in populated environments. It is based on UAV-obtained RGB imagery and two convolutional neural networks—a pixel-based one for identification of flowering areas and an object-based one for beehive identification, which achieved accuracies of 93.4% and 95.2%, respectively. Based on an experimental study near the village of Yuper (Bulgaria), the productive potential of black locust (Robinia pseudoacacia) areas in rural and suburban environments was determined. The obtained results showed that the identified blooming area corresponds to 3.654 m2, out of 89.725 m2 that were scanned with the drone, and the number of identified beehives was 149. The proposed methodology will facilitate beekeepers in choosing places for the placement of new apiaries and planning activities of an organizational nature.

1. Introduction

Honeybees, along with other pollinators such as bumblebees and butterflies, are part of our planet’s biodiversity and play a crucial role in the pollination of flowering plants. On the other hand, the rich species diversity of flowering plants and the size of the areas occupied by them is a prerequisite for the successful development of bee colonies. According to [1], the pollination efficiency is influenced by flowering phenology, floral characteristics, and resource collection modes of the worker bees. Increasing the area of cultivated flowering plants, such as oilseed rape, and overpopulating an area with bee colonies can affect the pollination of some wild plants, upsetting the nutritional balance of some insects, such as bumblebee species [2]. The influence of the nutritional environment of flowering plants on the dynamics of bee colony development was studied by [3]. The model describes the interaction of the food stock with the brood (immature bees), adult bees, and produced honey. Bearing in mind the biological needs of bee colonies in their nutrition, the places where apiaries are placed are of great importance. Very often, in their quest for higher honey yields, beekeepers place a large number of bee colonies in areas rich in flowering vegetation. They forget to consider the competition between individual colonies for food and the nutritional capacity of the areas with flowering vegetation. The calculation of the nutritional capacity of a given area is of great importance for the optimal feeding of bee colonies and obtaining high yields of honey [4]. Obtaining information about the flowering honey plants and calculating the nutritional capacity of the areas can be based on data, obtained from global satellite monitoring systems or the farmers themselves. Certain difficulties may arise in the detection and identification of flowering nectar source trees in mixed forest ecosystems. In such a case, precise spatial images from unmanned aerial vehicles (UAVs) equipped with high-resolution sensors could be used [5]. The data obtained can be used with different machine learning algorithms for the detection and recognition of honey plants [6,7,8,9,10,11].
In many cases, the nutritional environment is the leading criterion in choosing a location for bee colonies, while in other cases, the choice may be influenced by some factors, such as infrastructure and access to the apiary, availability of service personnel, storage warehouses, etc. To make sure there are no undernourished colonies due to overcrowding in the area, the apiaries’ location should be carefully chosen so that each colony has access to food resources. Possible solutions for the placement of bee colonies are given in [12,13,14,15,16,17]. Other researchers propose multi-criteria models for choosing a place to locate colonies, taking into account both the nutritional capacity of the areas with flowering honey plants and the subjective preferences of the beekeeper [18,19]. An interesting decision-making approach in choosing the best sites for apiaries using GIS-AHP techniques is proposed by [20,21].
Modern beekeeping is mainly divided into professional and amateur. The majority of apiaries are located outside of populated areas, close to sources of nectar and pollen. However, the development of intensive agriculture led to a decrease in natural sources of food for bees and to pollution of the environment with pesticides. This made urban beekeeping expand at a fast pace in various European and other countries [22]. An important factor in the development of urban beekeeping is the growing interest among honey consumers. There is still a lack of sufficient scientific research on the technological solutions for practicing beekeeping in urban and rural regions. The research work of many of the researchers is mostly related to determining the safety of bee products obtained in such areas. For example, in [23], a review of the physical, chemical, and biological parameters of honey is made. According to [24], urban foragers have higher levels of insecticides, pesticides, pharmaceuticals, and personal care products, compared to rural foragers; furthermore, metals are in greater concentrations. On the other hand, in [25], it was proven that urban honey meets the regulatory requirements for metals, polycyclic aromatic hydrocarbons, and pesticides and therefore is safe for consumption.
Different approaches exist for the identification of blooming trees and flowers, where the raw data are RGB and/or multispectral UAV or satellite-obtained images. In [26], the enhanced blooming index was proposed, which highlights the blooming areas in an orchard:
E B I = R + G + B G B × R B + 256
In another study [27], the authors tried to use the Brightness Index, together with reference panels colored in white, black, and grey. The threshold values for the identification of flowering pixels were chosen based on the color of the reference panels. A similar approach was used in [11], where the pixel-based blooming and non-blooming criteria for RGB images were chosen, respectively according to
p x W B = R > 170   a n d   G > 200   a n d   ( B > 150 )
p x N W B = R 170   o r   G 200   o r   ( B < 150 )
Thereafter, the pixels were classified and clustered, to obtain the areas with white blooming trees. The study reported Kappa coefficients within the range of 0.88–0.95.
While there is a limited number of studies trying to identify blooming plants, there are numerous other studies aimed at the identification of plants and/or different vegetation areas. In [9], the authors used a marker-controlled watershed segmentation algorithm to detect taxus trees with F1 scores ranging from 0.88 to 0.99. The study also reported that this approach did not return satisfactory results with olive trees, where the F1 score was below 0.61. In another study, the multi-scale segmentation approach was used, together with the Plant Pigment Ratio Index and the Brightness Index [28]. The authors were able to identify and monitor the blooming of Mikania micrantha, based on UAV-obtained RGB images with almost 89% accuracy.
Other studies rely on machine learning (ML) for plant identifications. In the proof-of-concept study [10], it was shown that the Random Forest algorithm is appropriate for the estimation of flower cover in grasslands. It relied on UAV-obtained RGB images and achieved a Kappa coefficient and an F1 score above 0.95. In [29], a Maxent machine learning model was created, based on UAV-obtained RGB images for monitoring the endangered plant Geum radiatum. The study reported that the obtained area under the curve (AUC) is 0.997. The study also tried to use the object-based You Only Look Once (YOLO) v3 model to identify the rare plants; however, the results were not satisfactory.
In another study, UAV-obtained RGB images were used, together with a five-layered convolutional neural network to identify nine plant species [30]. The images were preprocessed, which included their decorrelation and principal component analysis, aimed at creating a single-band image for further processing. The obtained accuracy was 97.8%, though no precision, recall, or F1 measures were reported. In [31], a combination of satellite-obtained images, high-resolution aerial images, and machine-learning algorithms was used for the classification of forest canopy cover. Random Forest, Support Vector Machine, Elastic Net, and Extreme Gradient Boosting were applied, together with the NDVI, NDVI-A, NDRE, and NDI45 vegetation indices. The RF model achieved the highest accuracy, reaching an R2 of 0.67. In another study, machine learning was used for the identification of cherry tree crowns in an orchard [32]. The Decatron 2 and YOLOv8 algorithms were applied, together with ResNet50, ResNet101, YOLOv8m-seg, and YOLOv8x-seg backbones. The highest F1 score was obtained for the Detectron2/ResNet101 combination, reaching 94.85%.
Different studies also exist for beehive monitoring; however, most of them are aimed at counting bees [33,34], their behavior monitoring [35], early detection of diseases [36,37], etc. To the best of our knowledge, no previous studies have reported algorithms and methodologies for counting beehives based on UAV or satellite-obtained images. Nevertheless, a wide range of studies exist, aimed at the identification/counting of other types of objects. For example, in [38], the YOLOv5 neural network was used to identify and count cars on a road. The achieved accuracy was more than 90% and the study showed that it depends on the quality of the images. In another study, YOLOv4, YOLOv5, and YOLOv7 were used to count apples on a tree [39]. The highest accuracy was 86.6% and was obtained for versions 5 and 7 of YOLO. Similarly, in [40], nine object detection models were investigated for detecting the number of maize seedlings. Four of them were selected for a more thorough investigation—YOLOv8n, YOLOv3-tiny, Deformable-DETR, and faster R-CNN. The v8n version of YOLO was the most accurate in terms of F1 score, reaching up to 94%, and the fast R-CNN was the least effective.
The performed analysis of previous studies shows a very limited number of papers proposing solutions for the recognition of blooming tree and plant areas. In addition, none of them was specifically designed for application in urban, suburban, or rural areas, which have their specifics. Furthermore, we were not able to identify any existing studies that have proposed a methodology for the recognition and counting of beehives. The above-mentioned indicates that a visible knowledge gap exists in this area.
When creating apiaries in populated areas, it is of great importance to determine, in addition to the sources of pollution, the presence of sufficient types and quantities of flowering plants near the apiary. The proposed algorithms for recognition of flowering nectar source trees have been tested above all in forest and meadow vegetation outside populated areas, where most of them give very good results. However, no such data are available for cases where bee colonies are located in urban, suburban, and rural regions.
The special thing in such areas is that flowering nectar source trees are not grouped into separate homogeneous areas, but consist of separate flowering species scattered in a wide area between residential and administrative buildings, playgrounds, etc. At the same time, suitable locations for bee colonies are limited by the spatial isolation between sites such as schools, hospitals, residential buildings, industrial areas, etc. All this necessitates the search for suitable algorithms for recognizing flowering plants and beehives in the conditions of rural and suburban environments.
This study aims to propose and test a methodology for determining the productive potential of black locust. It is based on UAV-obtained RGB imaging and machine learning algorithms for detecting and distinguishing white flowering nectar source trees and for counting bee colonies in rural and suburban environments.

2. Materials and Methods

2.1. Study Area

A study was conducted in the Yuper village, which is positioned at an elevation of 107 m above the sea surface with coordinates 43°54′28.59″ N, 26°23′49.02″ E (Figure 1).
The village is located in one of the most developed beekeeping regions of north-eastern Bulgaria. The prevailing topography is flat and hilly, including shallow ravines with flowing water and plains with leached chernozem suitable for growing crops. The climate is continental and is characterized by cold winters and hot summers. The area is characterized by the prevailing forest flowering vegetation of black locust (Robinia pseudoacacia), important for bees, as well as the honey crops of oilseed rape (Brassica napus) and sunflower (Helianthus annuus). Apart from the surroundings around the village, a large part of the flowering species of black locust is located inside the village. Additionally, inside the village, many spring fruit-flowering plants exist, such as plum, cherry, apricot, peach, and pear, which are a source of nectar and pollen and are important for the rapid development of bee colonies early in the spring.
The predominant part of the bee colonies is located inside the village, including both professional apiaries with more than 100 colonies and amateur apiaries with less than 10 colonies. One of the most important bee pastures for the area is black locust. One part of the black locust grows in single-species forest stands, and another part occurs as single trees in mixed oak and linden forest stands located at a distance up to 2000 m outside the village. A large part of black locust trees are found as single trees located in the village near the apiaries themselves and even inside them.
The large species diversity of flowering forest vegetation located in different places makes it difficult to accurately determine the area it occupies when calculating the honey balance in the area. In 2023, an algorithm for detecting white flowering nectar source trees in mixed forest ecosystems was developed, which is based on UAV-obtained RGB imaging [11]. The tested algorithm showed good results in detecting white flowering nectar source trees outside populated areas. However, the detection of white flowering nectar source trees in populated areas is a challenging task due to the presence of many different objects, such as asphalt roads, roofs of residential buildings, photovoltaic panels, dry vegetation, etc., which increase the risk of misidentifying the trees. In addition to detecting white flowering nectar source trees, the discovery and determination of the number of bee colonies in the settlement is also of interest in our research.
Based on phenological observations made in the period from 2021 to 2024, we found that the usual flowering period of black locust in the study area is between 15 May and 30 May. However, due to the warm spring in 2024, the black locust flowered on 10 April 2024 and the flowering continued until 18 May 2024. The exact date of the UAV flight was matched to the date of its full bloom and the weather conditions on the day of the flight.

2.2. UAV Data Collection

A P4 multispectral drone, created by DJI (Da-Jiang Innovations, Shenzhen, China), was used to take images of blooming black locust trees and honeybee colonies in the settlement. P4 multispectral is a quadcopter that can take off and land vertically and hover at low altitudes, with a flight time of up to 27 min.
The UAV is equipped with six 1/2.9″ CMOS sensors by Da-Jiang Innovations (Shenzhen, China), including one RGB sensor for capturing visible light images and five monochromatic sensors for multispectral imaging. Each sensor has an effective resolution of 2.08 MPx (a total of 2.12 MPx). The filters for the five monochromatic sensors for multispectral imaging are as follows: Blue (B): 450 nm ± 16 nm; Green (G): 560 nm ± 16 nm; Red (R): 650 nm ± 16 nm; Red edge (RE): 730 nm ± 16 nm; Near-infrared (NIR): 840 nm ± 26 nm. Their resolution is 1600 × 1300 px (4:3.25), the controllable tilt range is from −90° to +30° and the ground sample distance (GDS) is H/18.9 cm/pixel. It supports two image formats: JPEG (visible light images) and TIFF (multispectral images) [41].
Flight routes were designed using the DJI Pilot software (version v2.5.1.17), with operations conducted between 12 p.m. and 2 p.m. to reduce the shading effect. The drone flew at an altitude of 80 m, with a course angle of 90°, and front and side overlap ratios of 70%.
During the flight, the average wind speed was measured at 1.4 m s−1, the average atmospheric humidity at 57.70%, and the average solar radiation at 629.23 W m−2. The measured data were obtained from a Meteobot® portable agrometeorological station by Prointegra Ltd. (Varna, Bulgaria).

2.3. Data Processing

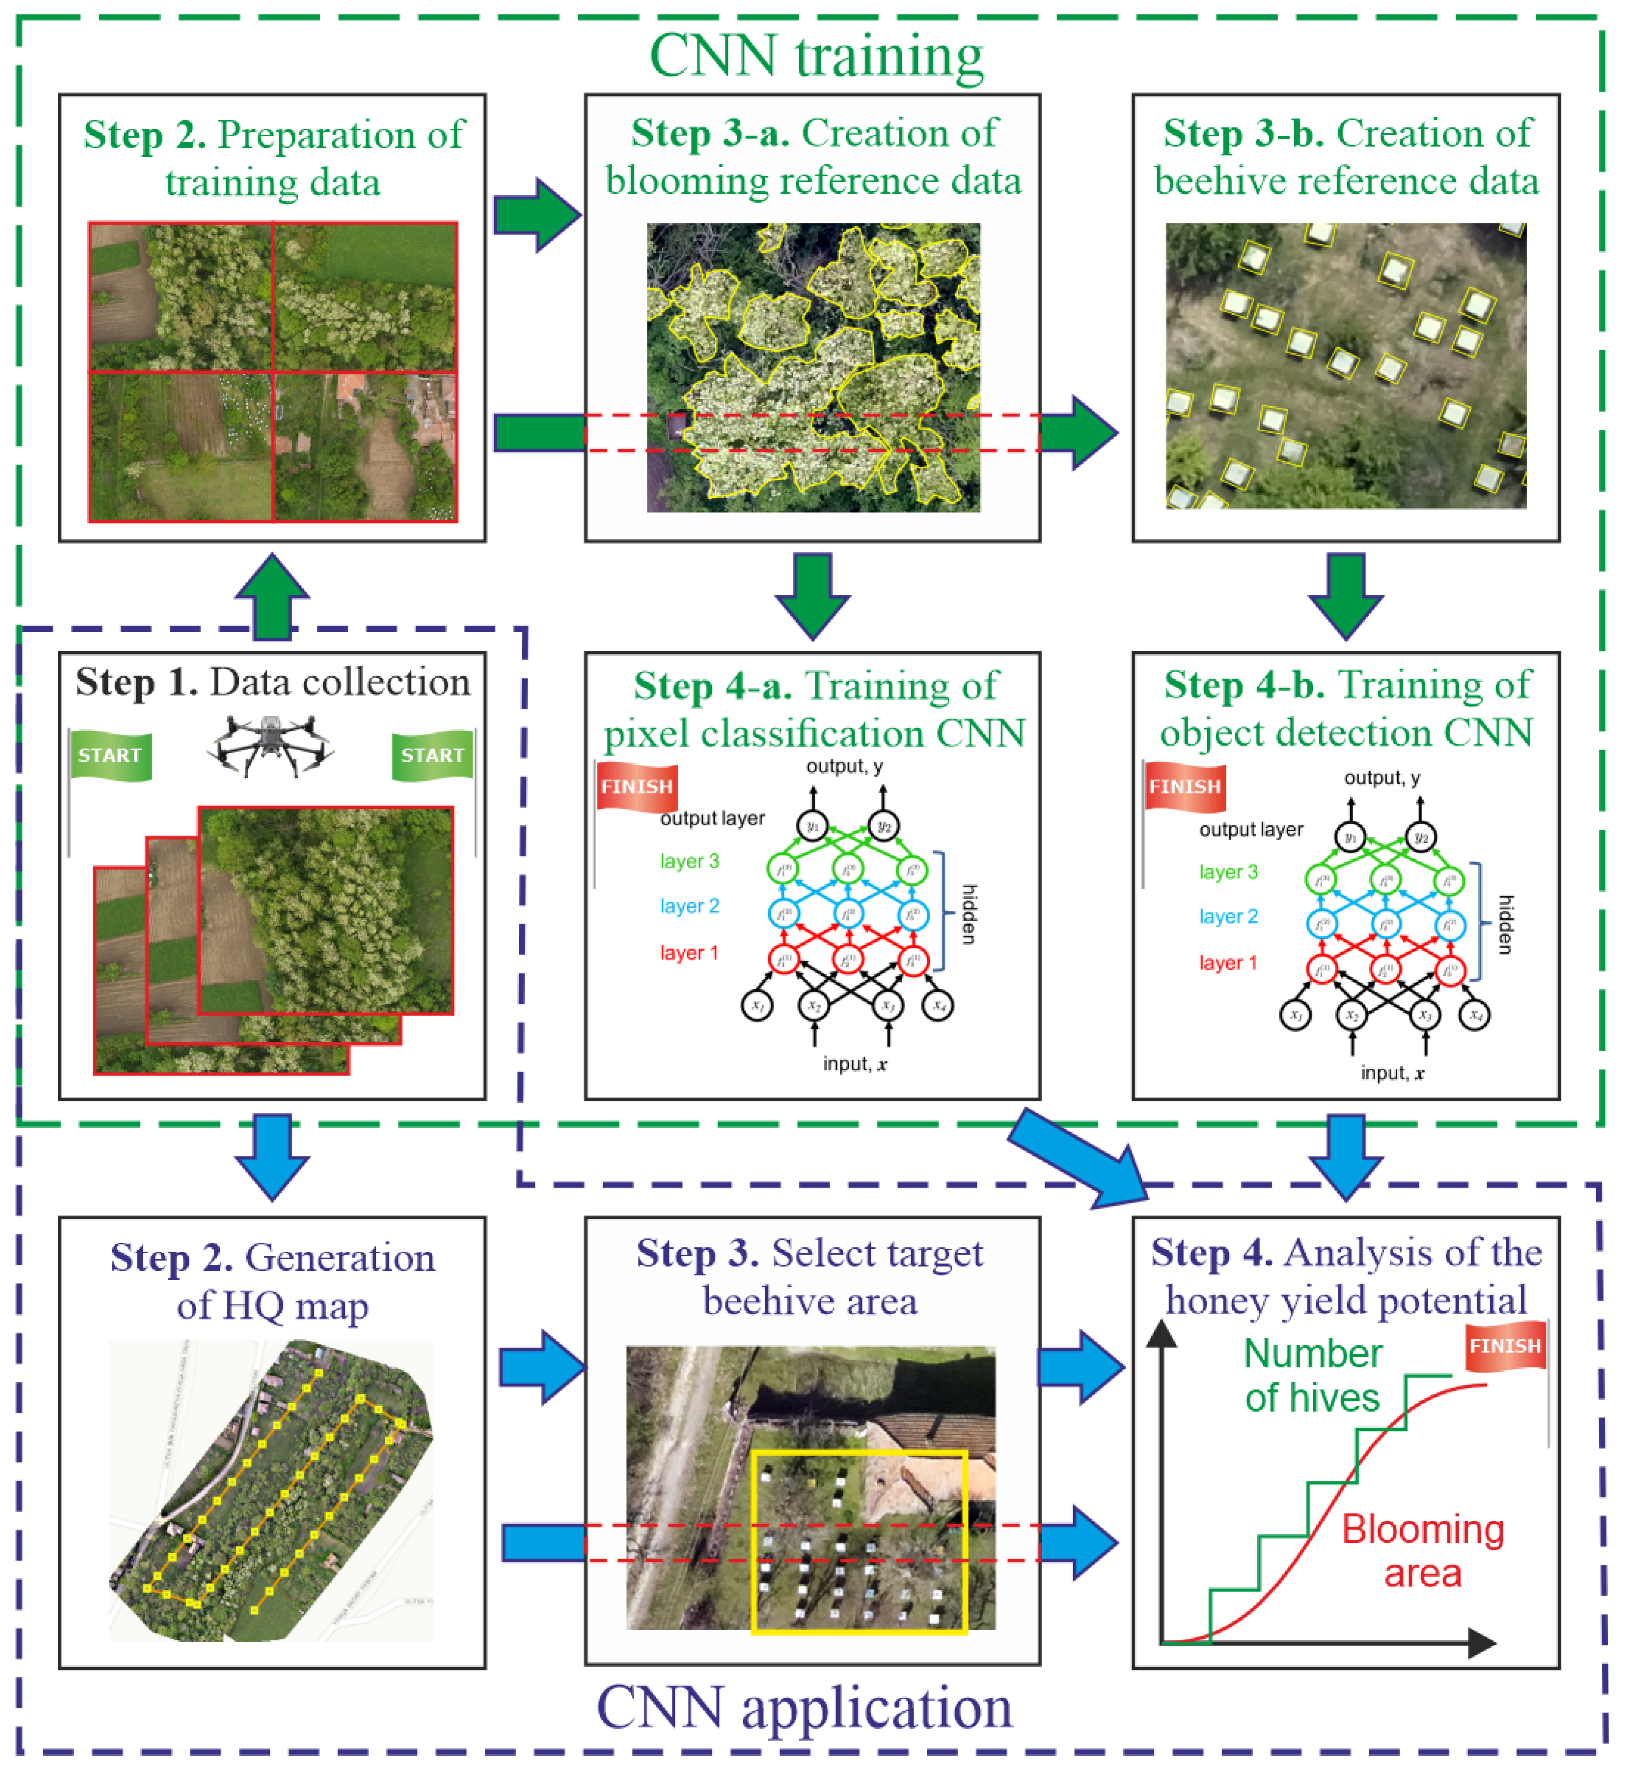
The data processing and analysis are implemented according to the methodology, described in Figure 2. It can be divided into two subparts: training of convolutional neural networks (CNNs) and their subsequent application. The CNN training methodology includes the following steps:
  • Step 1. Collection of data with the use of a UAV—a drone should be used to make visual spectrum pictures of the area of interest, which should include both blooming trees and beehives;
  • Step 2. Preparation of training data—at this stage, some of the UAV-obtained images, which contain many blooming trees and beehives, are selected for training and validation purposes. The selected photos could be combined into a single image to facilitate the training process.
  • Step 3. Creation of reference data—this step has two aspects:
    Creating reference data for the identification of blooming trees. This includes marking the available blooming areas over the training image with polygons;
    Creating reference data for identification and counting of beehives. This includes marking all available beehives in the training image with rectangles.
  • Step 4. Training convolutional neural networks for the following:
    Identification of blooming areas—considering these areas could be with random (polygonal) form, a pixel-based classification algorithm is chosen;
    Counting beehives—considering they have approximately the same form, an object detection algorithm should be chosen that works with regular rectangular areas.
The CNN application methodology includes the following steps:
  • Step 1. Collection of data with the use of a UAV—this step could be common with the CNN training methodology, although it is also possible to use different image datasets.
  • Step 2. Generation of a high-quality (HQ) map—the obtained drone images are combined into a giant orthomosaic for further analysis.
  • Step 3. Selection of areas with beehives—parts of the HQ map containing beehives are selected for counting their number. This step is required to reduce the number of false positives, which might occur in rural and suburban environments. The necessity for this step is explained in the Results section of this study.
  • Step 4. Application of the CNN and evaluation of the honey yield potential—this is conducted in three steps:
    The HQ map is analyzed using the trained pixel-based classification model to estimate the total area of blooming trees.
    The selected parts (from Step 3) of the HQ map are analyzed using the trained object-based detection model to estimate the total number of beehives.
    The obtained results are used to estimate the productive potential of the investigated area. The maximum honey yield expected from the experimental area was considered as the amount of honey yield to be harvested based on the nectar secretion potential of honey plants. The calculation of the expected honey yield is performed according to the method described in [4]:
O N P = N S P × A 2   , k g h a 1 ;
H Y = O N P n   , k g ,
where O N P   is the optimal quantity of stocks of nectar, kg ha−1; N S P is the nectar secretion potential, kg ha−1; A is the Area, ha; H Y is the expected quantity of honey per hive, kg; and n is the number of bee colonies.
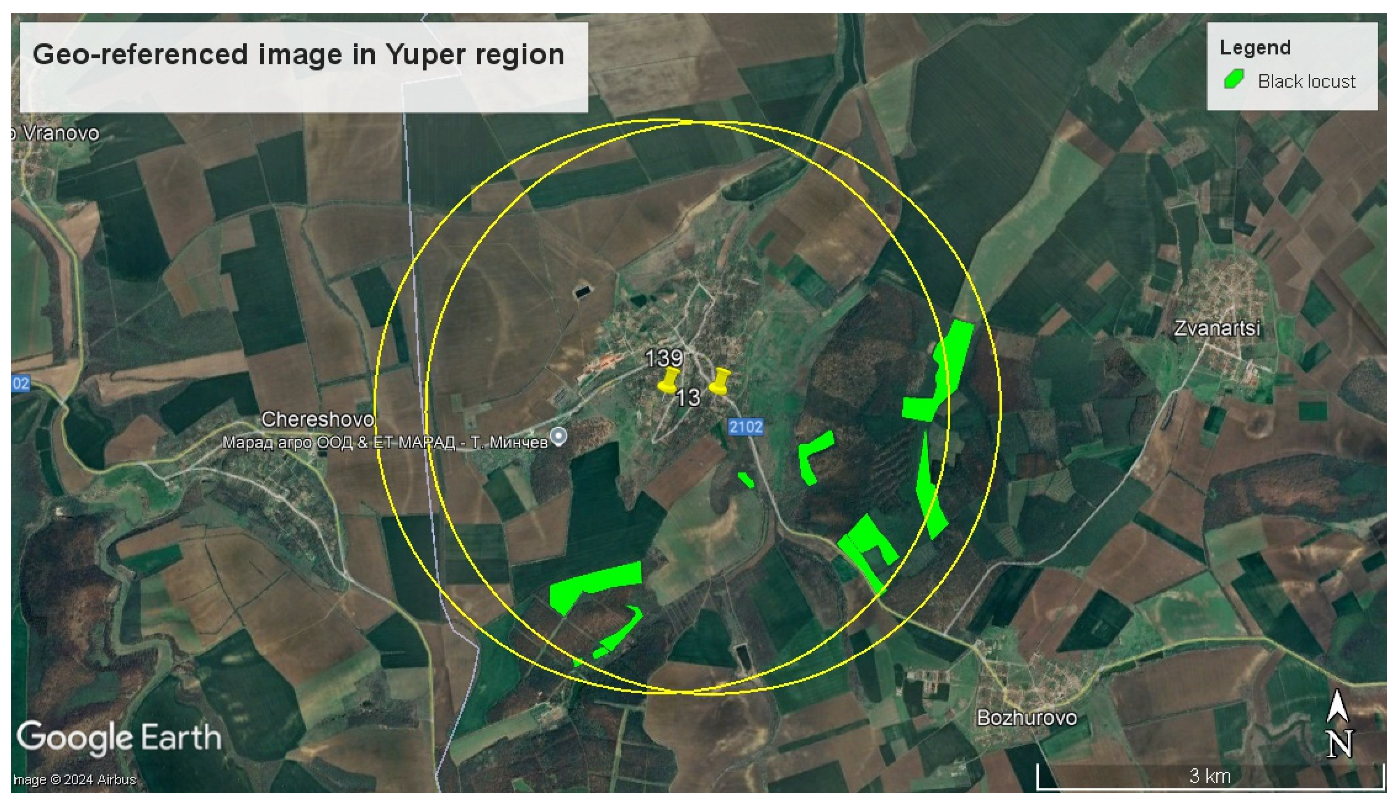
In their quest to find food, bees fly a certain distance during which they spend energy to carry the food to the hive. According to [42], the average foraging distance for honeybees is 2.3 km. In [43], various studies on the flight distance of honeybees are reviewed, with claims that a range of up to 10 km is possible. Energy consumption depends on the quality of the food source and the distance of the food source from the destination [16]. An important factor in determining the productive potential of a given area is flowering vegetation within the flight range of the foraging bees. In our study, the distance of 2.5 km was accepted, based on previous research on the flight range of honeybees. The rugged terrain of the area where the research was conducted, as well as the presence of buildings in the populated area, was also taken into account. In addition to identifying individual flowering plants within the settlement and mapping the area using UAV imagery, it is essential to determine the maximum honey yield and delineate the areas occupied by flowering trees and agricultural crops surrounding the village for a more comprehensive assessment of the study area. In our research, Google Earth Professional was used to create a geo-referenced map of the areas with black locust forest massifs and the locations of the apiaries. The data on the locations of black locust areas were obtained by surveying the sites and recording their GPS coordinates. The data on the location of the apiaries was obtained as a result of the drone flyover. Based on the research undertaken for 2024, it was found that the black locust forest massifs around the village have a total area of 38.18 ha. The geo-referenced image of the studied region is summarized in Figure 3.
The proposed methodology offers a practical technological solution for beekeepers to detect and distinguish white flowering nectar source trees, such as black locust, and to count bee colonies in rural and suburban environments using UAV-based RGB imaging. It can be used to determine the productive potential of the studied area by analyzing the flowering vegetation within the settlements and in the surrounding 2.5 km radius.

3. Results and Discussion

3.1. Training of a CNN for Blooming Trees Recognition

Multiple aerial surveys were conducted to collect spatial information from photographs during the period of full bloom of black locust coinciding with the date 19 April 2024. A total of 3648 images were taken, with the drone’s multi-spectral camera preconfigured to capture images at regular intervals along a pre-designed travel trajectory. According to the developed methodology, in step 2 there should be selected drone images to be used for training and validation. Three images were selected as the reference data for recognizing blooming white trees (black locust) and were merged into a single image. Furthermore, in step 3, all blooming areas were marked with polygonal shapes as shown in Figure 4.
For the analysis of the data, the ArcGIS Pro v. 3.3.1 tool was used, developed by Esri Inc. (Redlands, CA, USA). The model that was chosen for pixel-based recognition of blooming trees is the DeepLabV3 convolutional neural network. This is an advanced neural network architecture, used for semantic image segmentation. Therefore, the training data from step 3 were exported into the “Classified tiles” metadata format, to feed it to DeepLabV3. Furthermore, “resnet34” was selected as the backbone for the CNN, because a preliminary study showed that it returns fewer false positives, compared to other “resnet” models.
The obtained accuracy and F 1 score of the trained CNN are 93.4% and 84.0%, respectively, whose meaning is as follows:
A c c u r a c y = T P + T N P + N ;
F 1 = 2 T P 2 T P + F P + F N ,
where T P stands for “True positives”, T N for “True negatives”, F P for “False positives”, F N for “False negatives”, P for “Positives”, and N for “Negatives”.
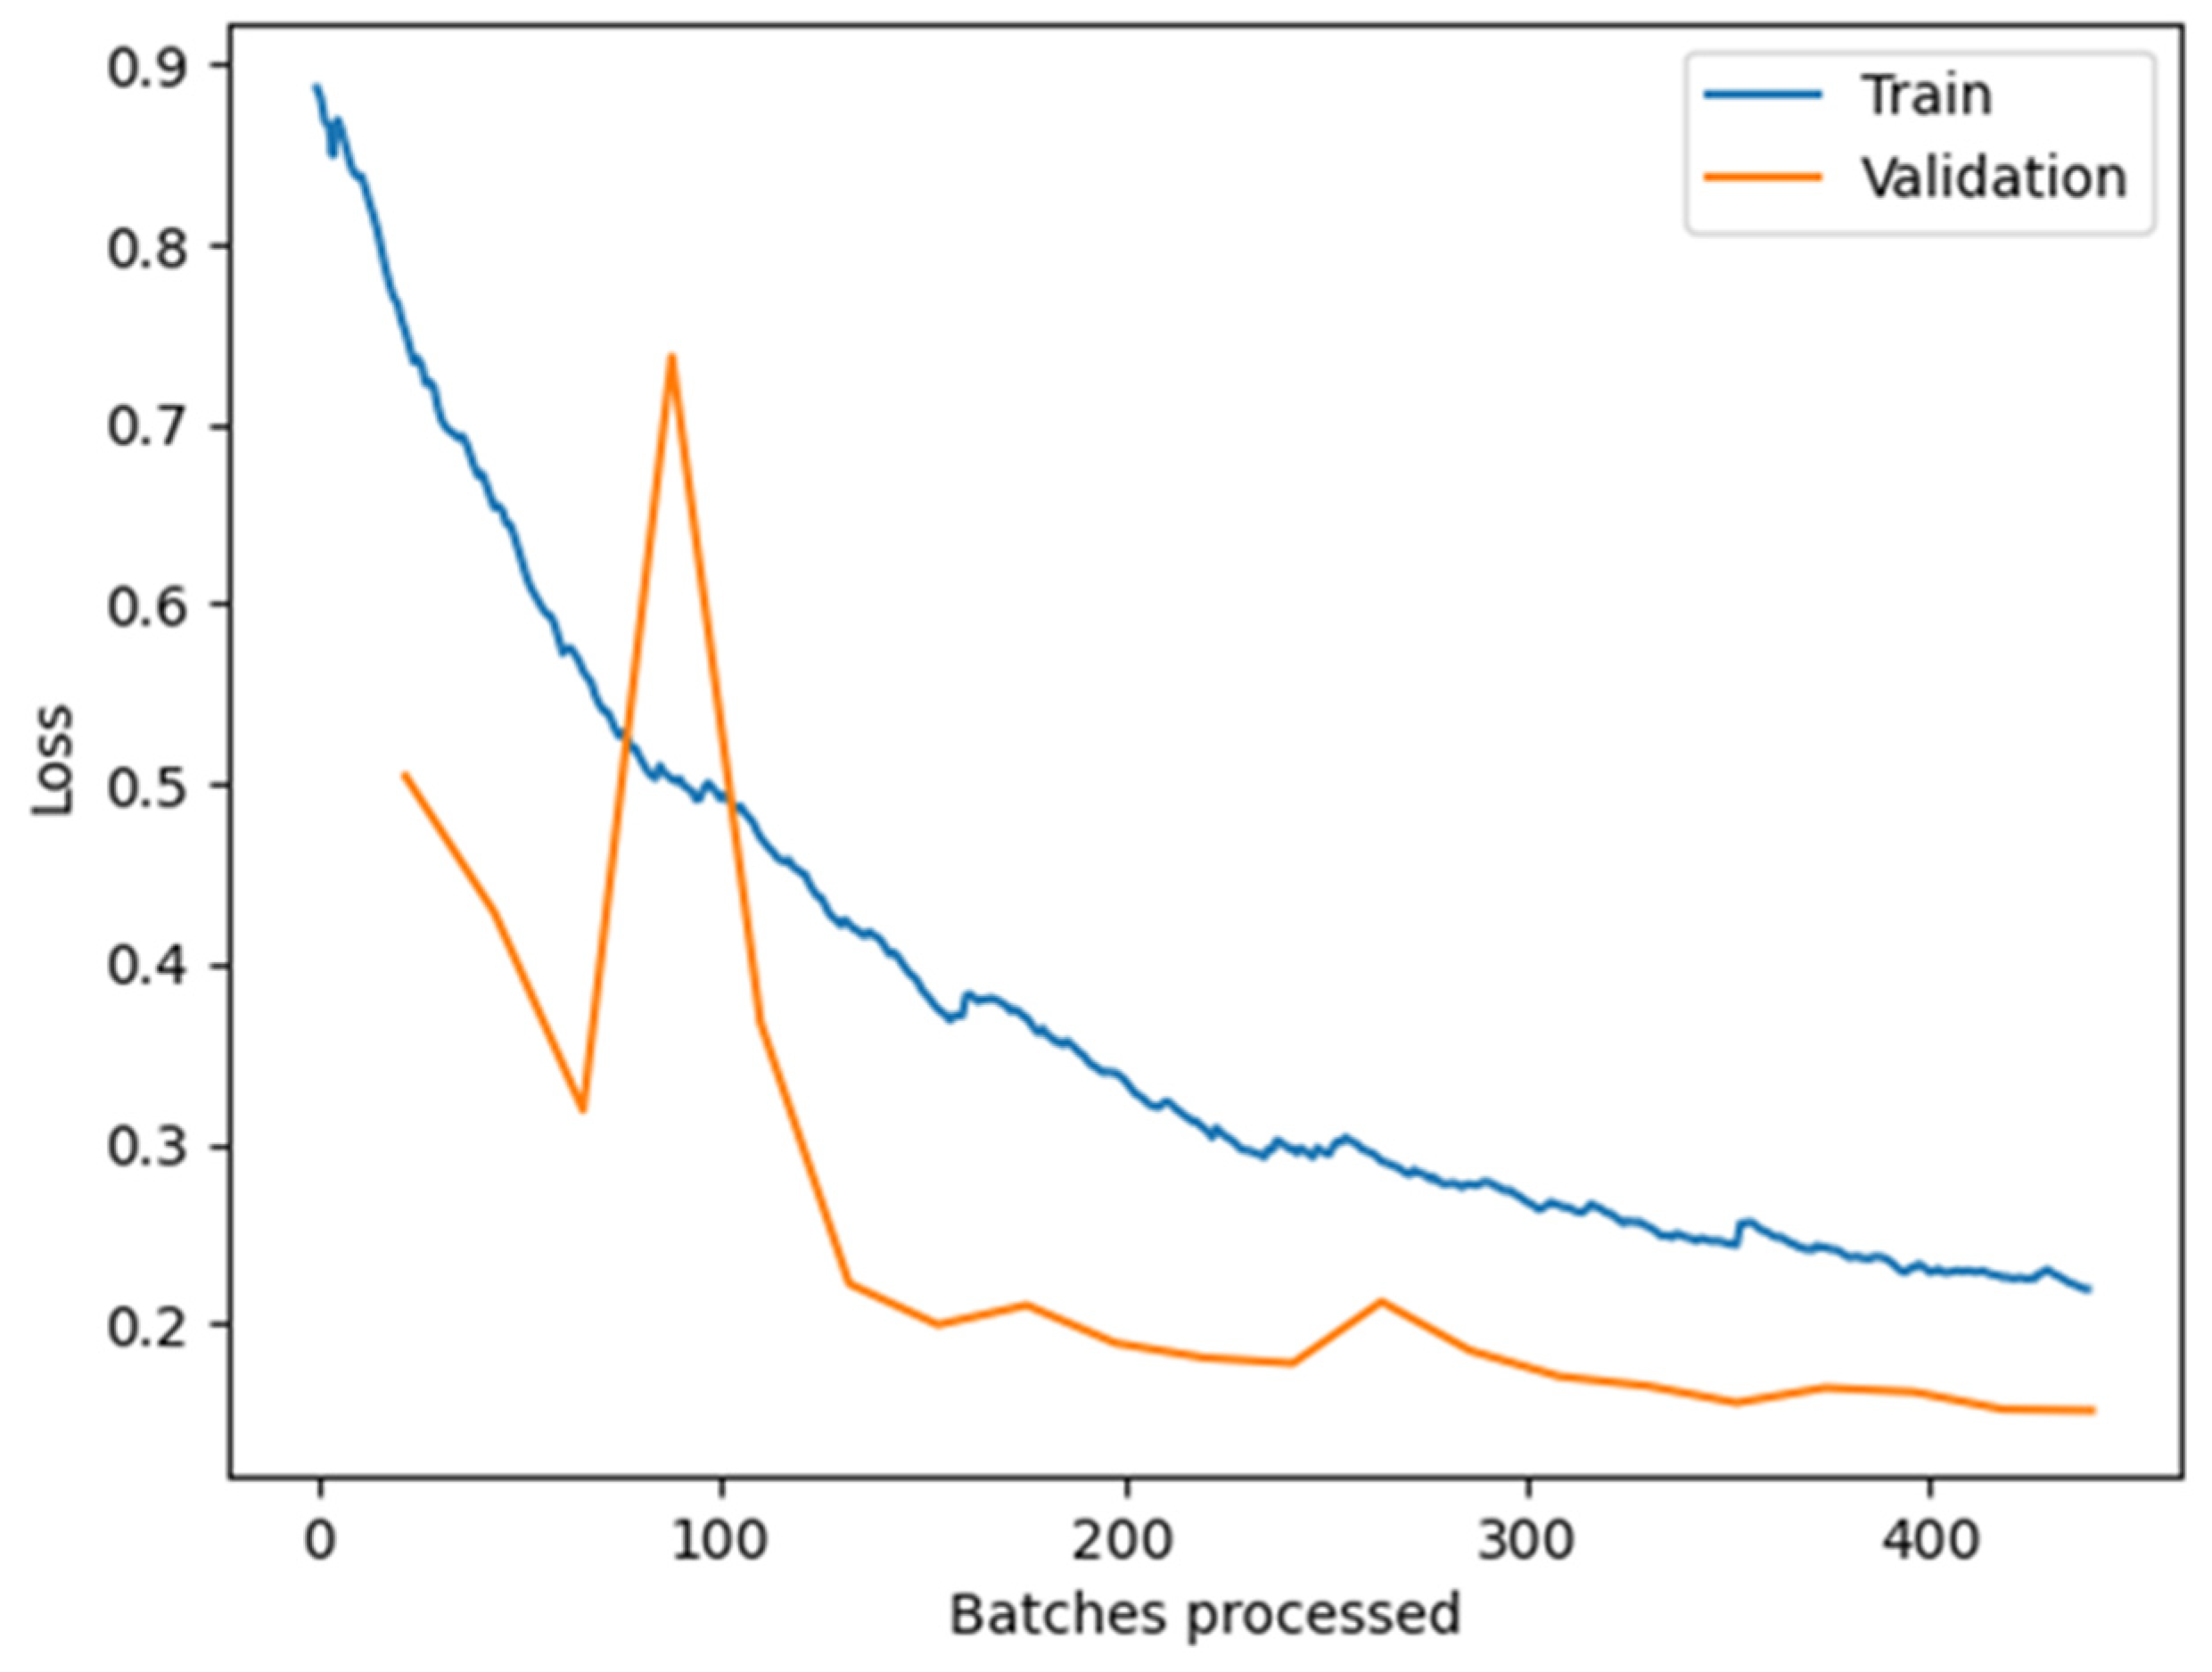
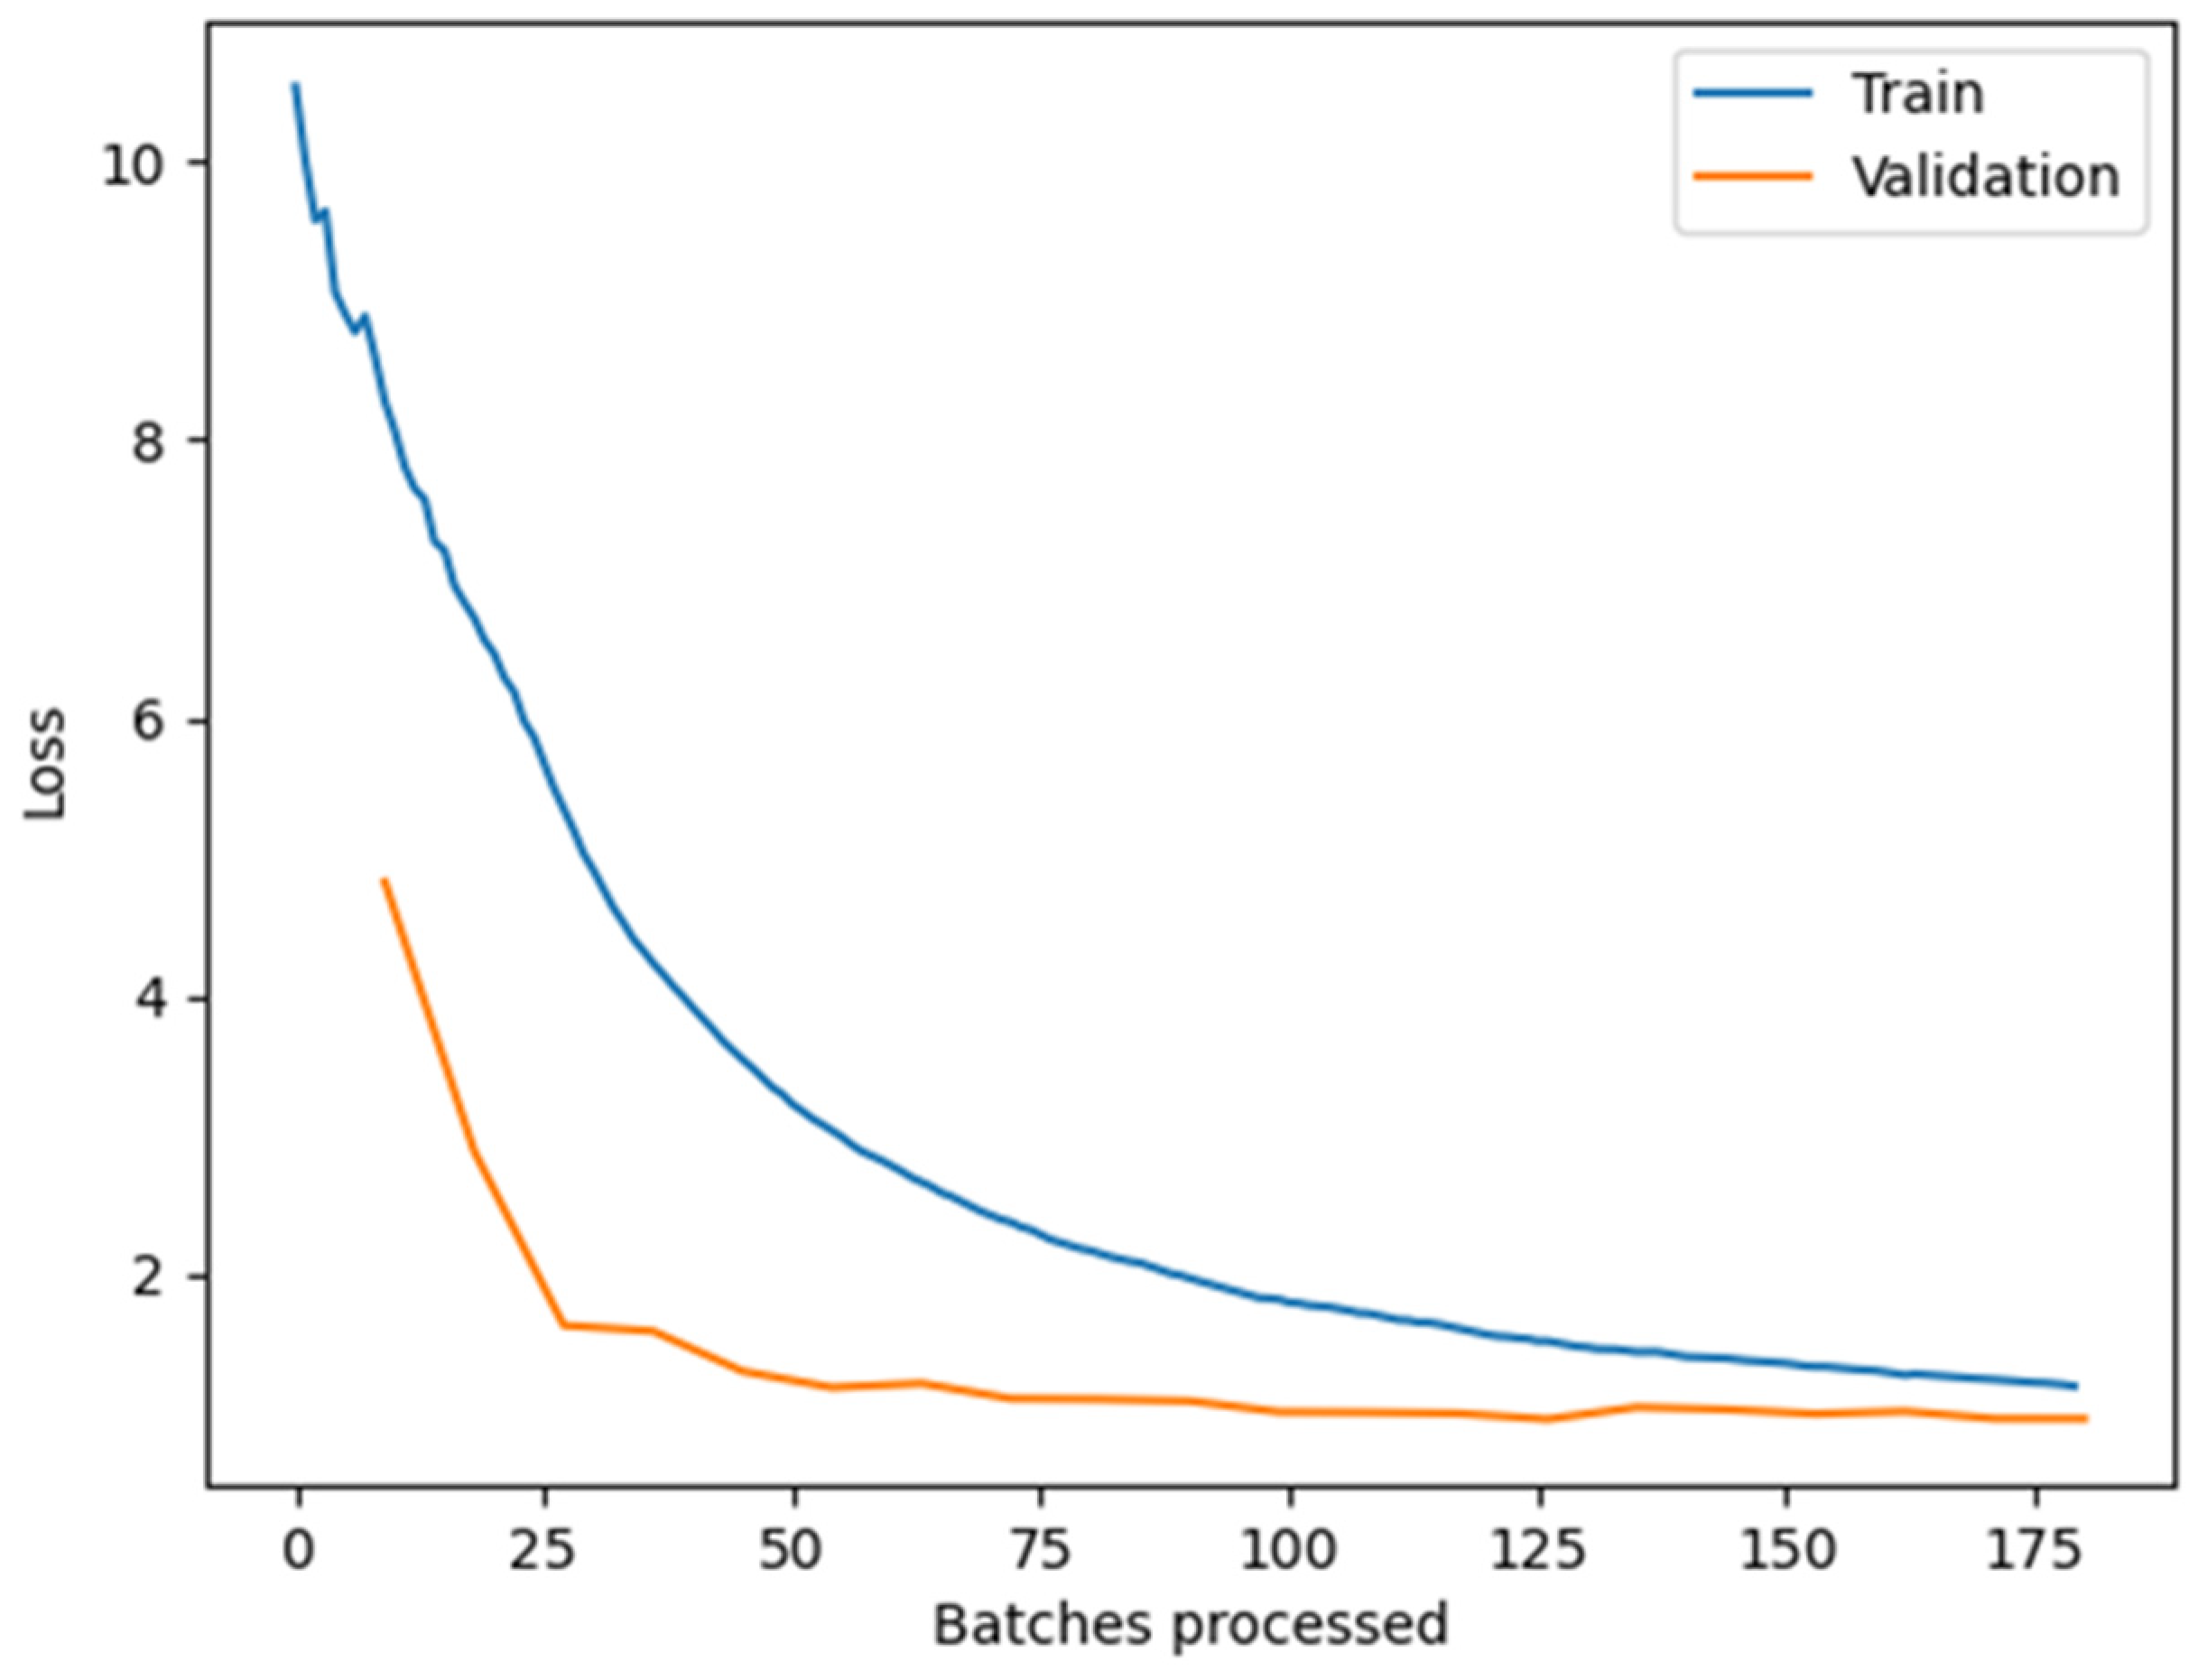
The training results represented as the function of the validation loss from the processed batches can be seen in Figure 5.
There are not many studies, dealing with the identification of blooming trees, and practically no previous studies dealing with such identifications in urban, suburban, or rural areas. In [26], an enhanced bloom index was proposed that can be used to identify white blooming areas in orchards; however, no quantitative measures were reported. In another study, a pixel-based clustering approach was proposed for the identification of white-blooming trees in mixed forest ecosystems [11]. The reported Kappa score varied between 0.88 and 0.95, which is slightly higher than the one obtained in this study. The results in [11] were also compared with the enhanced blooming index and the obtained Kappa score was 0.84–0.85. However, it is important to note that the earlier proposed methodologies are only applicable in wild forest areas and orchards. Populated areas contain many light-colored artificial objects, such as asphalt, house roofs, greenhouses, photovoltaics, beehives, etc., which would create an enormous number of false positives. Therefore, no direct comparison could be made with the proposed approach.

3.2. Training of a CNN for Identification of Beehives

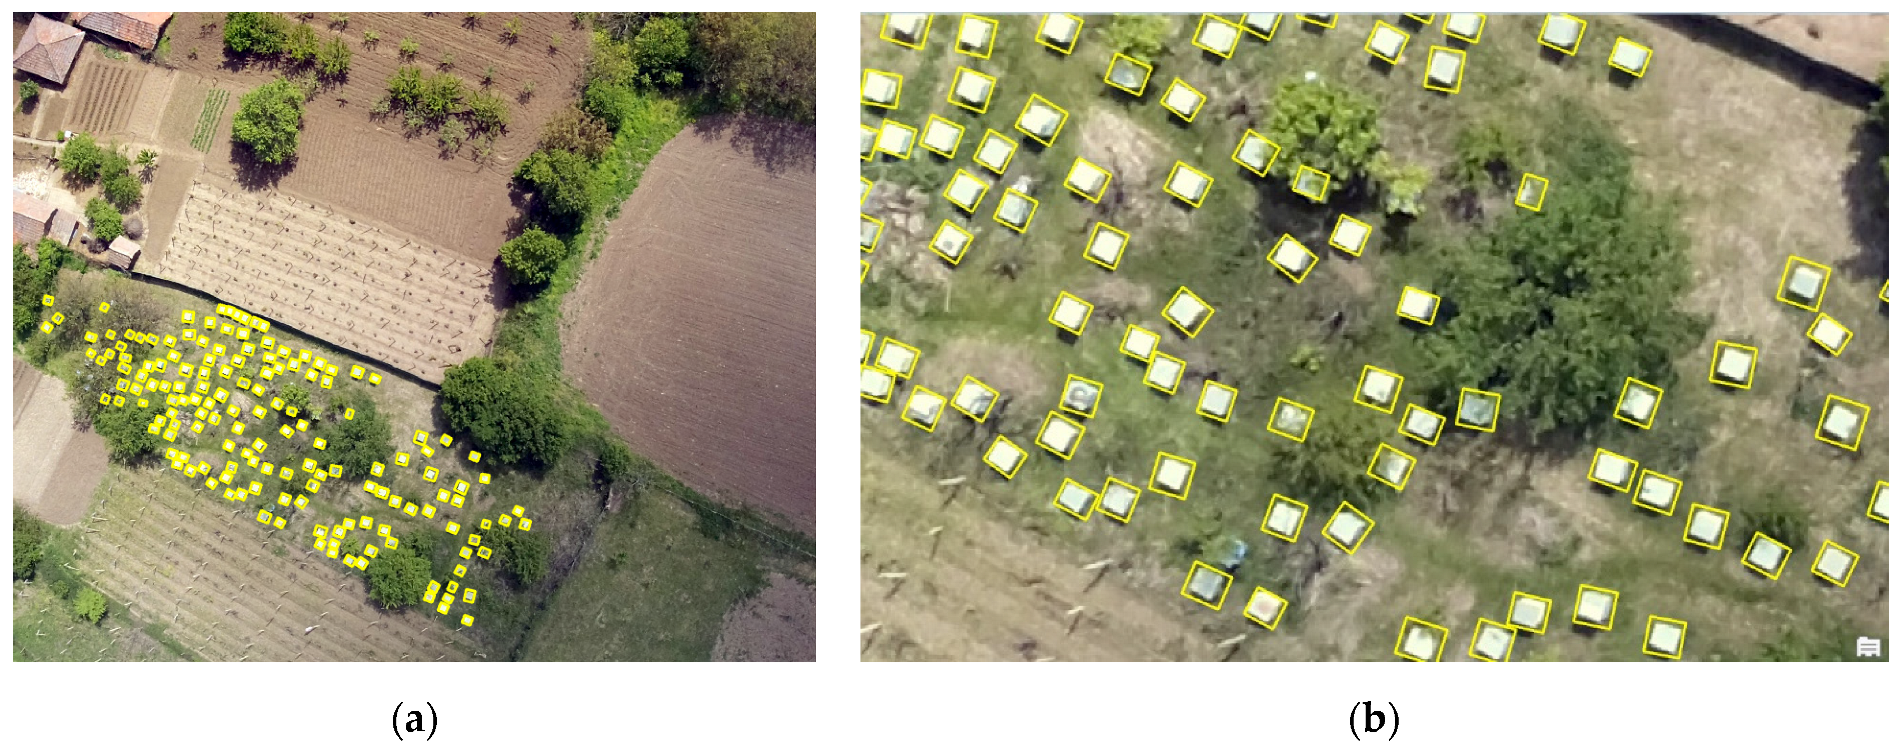
The same UAV-obtained input data were used in step 1 for beehive counting, as the one used for the identification of blooming trees. In step 2 of the methodology, one image with more than 140 beehives was selected as the input data for training the object detection CNN (Figure 6a). Next, in step 3, reference data were created by marking all beehives with rectangles, as shown in the closeup image in Figure 6b.
In step 4, the algorithm Mask Region-based Convolutional Neural Network (MaskRCNN) was chosen, which is known to be appropriate for object detection. It was applied with the “ResNet-50” as a backbone model and the maximal number of epochs was limited to 30. The average precision of the trained model is 95.2% and the training and validation loss curves can be observed in Figure 7.
The obtained average precision cannot be directly compared with other studies, because as was already stated, to the best of our knowledge, no previous studies dealt with the identification and counting of beehives. Nevertheless, it can be compared with similar object-based models, used for the identification of other objects. In [38], an accuracy of 90% was achieved with YOLOv5 when identifying cars. Similarly, in [39], apples were recognized with 86.6% accuracy using the YOLOv5 algorithm, and in [40], maize seedlings were identified with an F1 score of 94% using the YOLOv8n algorithm. It can be seen that the trained MaskRCNN model with the ResNet-50 backbone has commensurable and even slightly higher performance.

3.3. Assessment of the Honey Production Potential

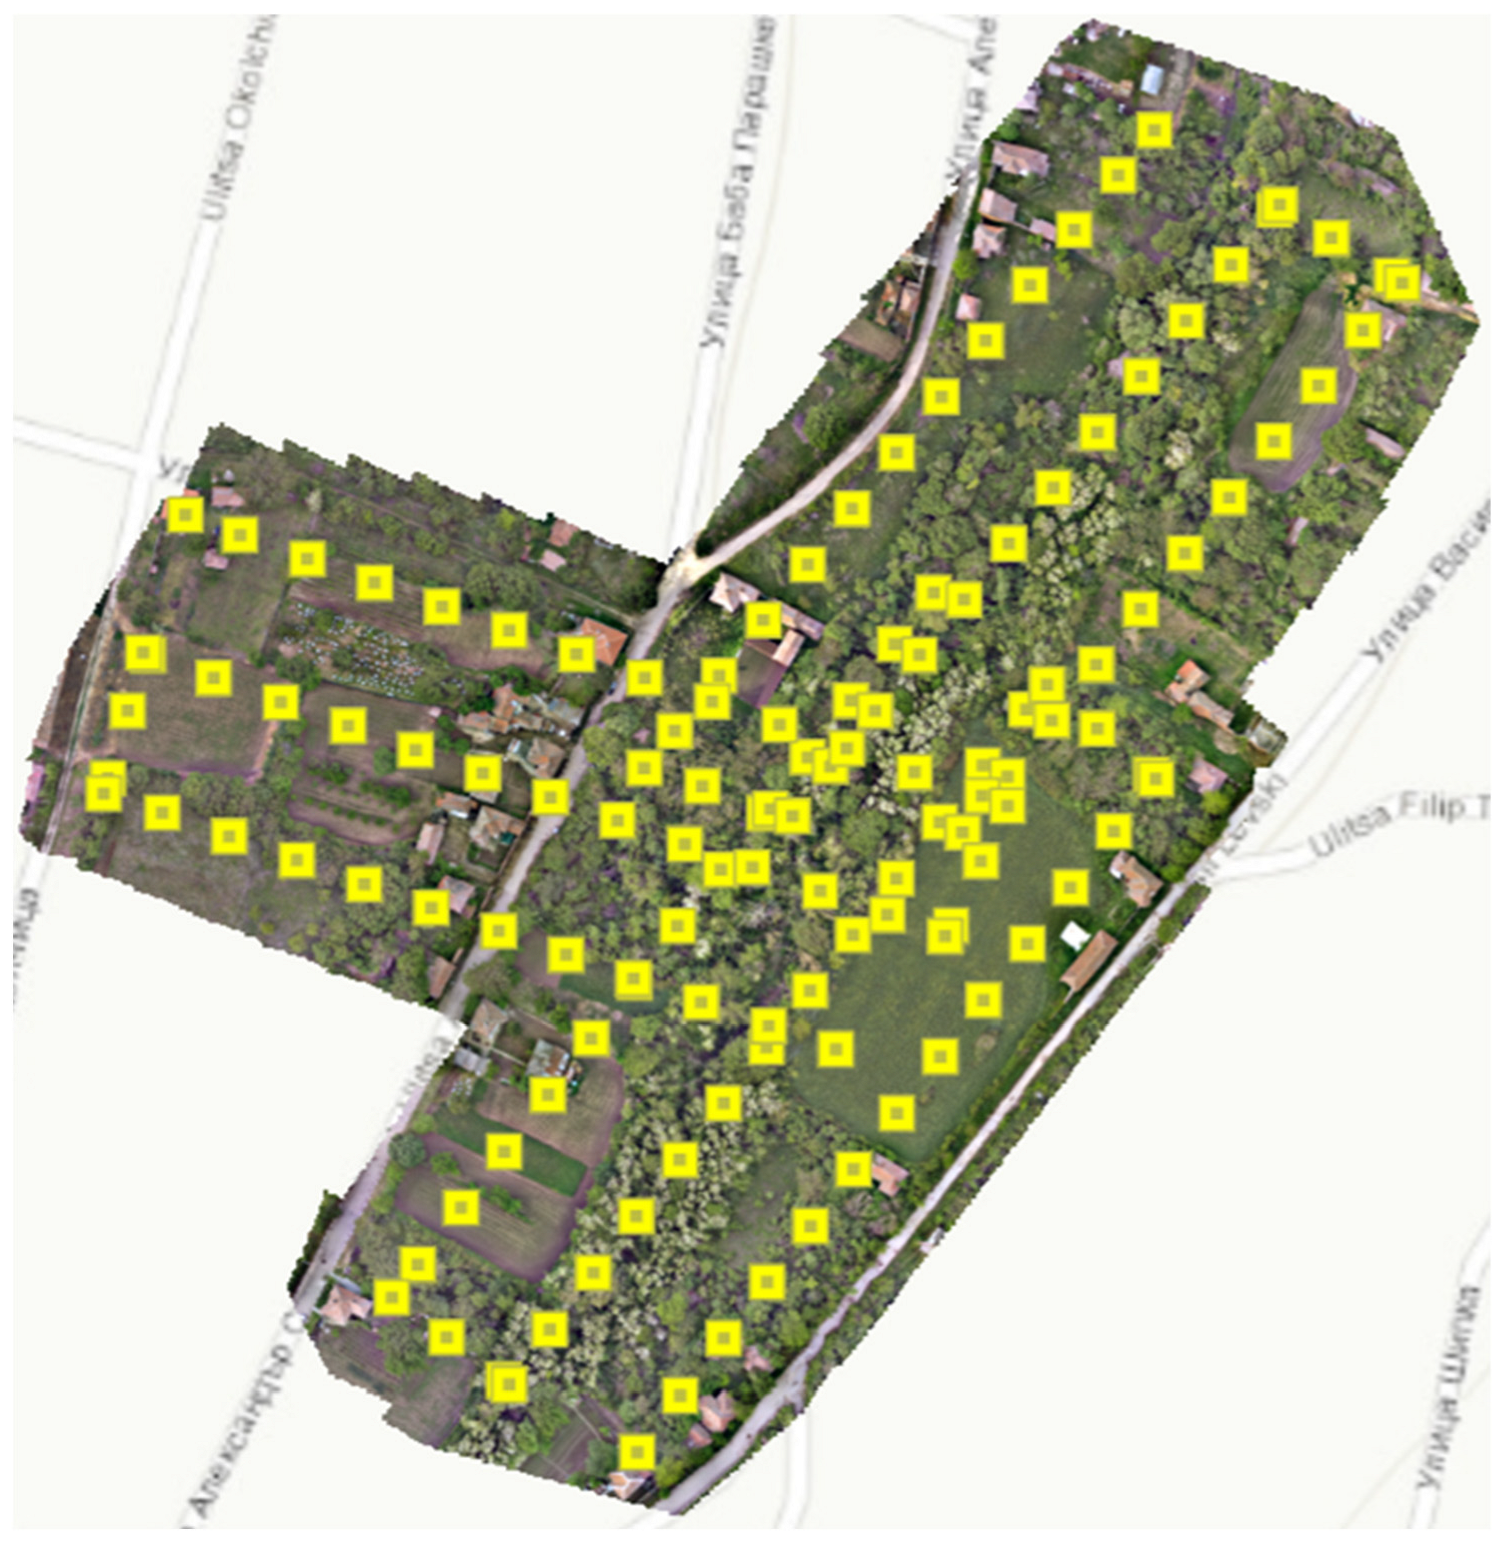
Next, according to the developed methodology, the honey production potential should be assessed. Initially, an HQ map of the region is created, using the UAV-obtained photos. This has been performed in ArcGIS, and includes importing the images; performing block adjustments by computing tie points; creating a digital surface model; and then creating an orthomosaic. The generated HQ map of the investigated area is presented in Figure 8, where the yellow squares represent the locations of the UAV-obtained images.

3.3.1. Estimation of the Number of Beehives

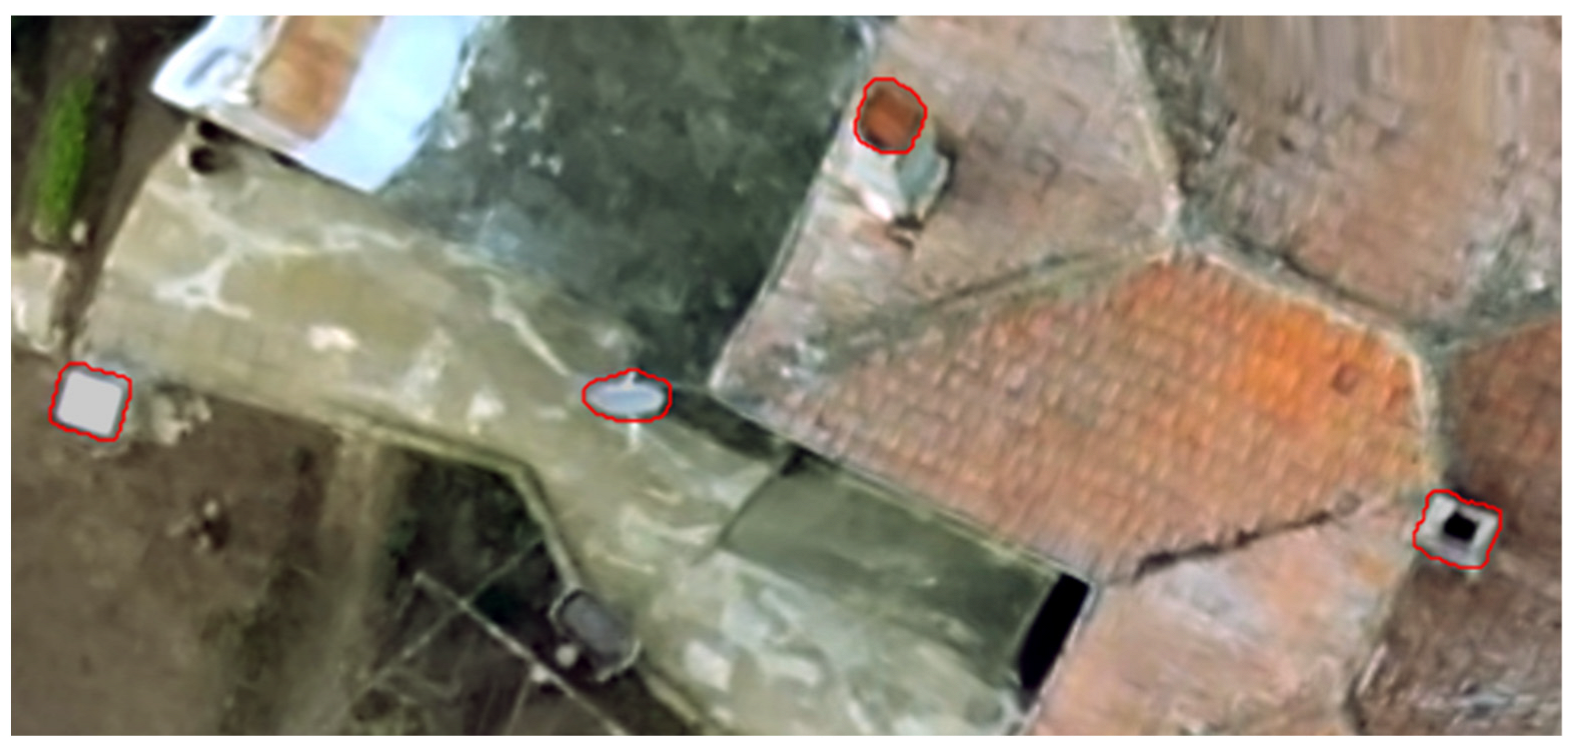
Initially, the whole HQ orthomosaic map was analyzed with the trained beehive object-detection neural network; however, it returned many false positives. The reason for this is that in the rural and suburban environment, many artificial objects exist, which look like beehives (Figure 9). This way, the number of beehives was overcounted to 236, which corresponds to an unacceptable relative error of 50%.
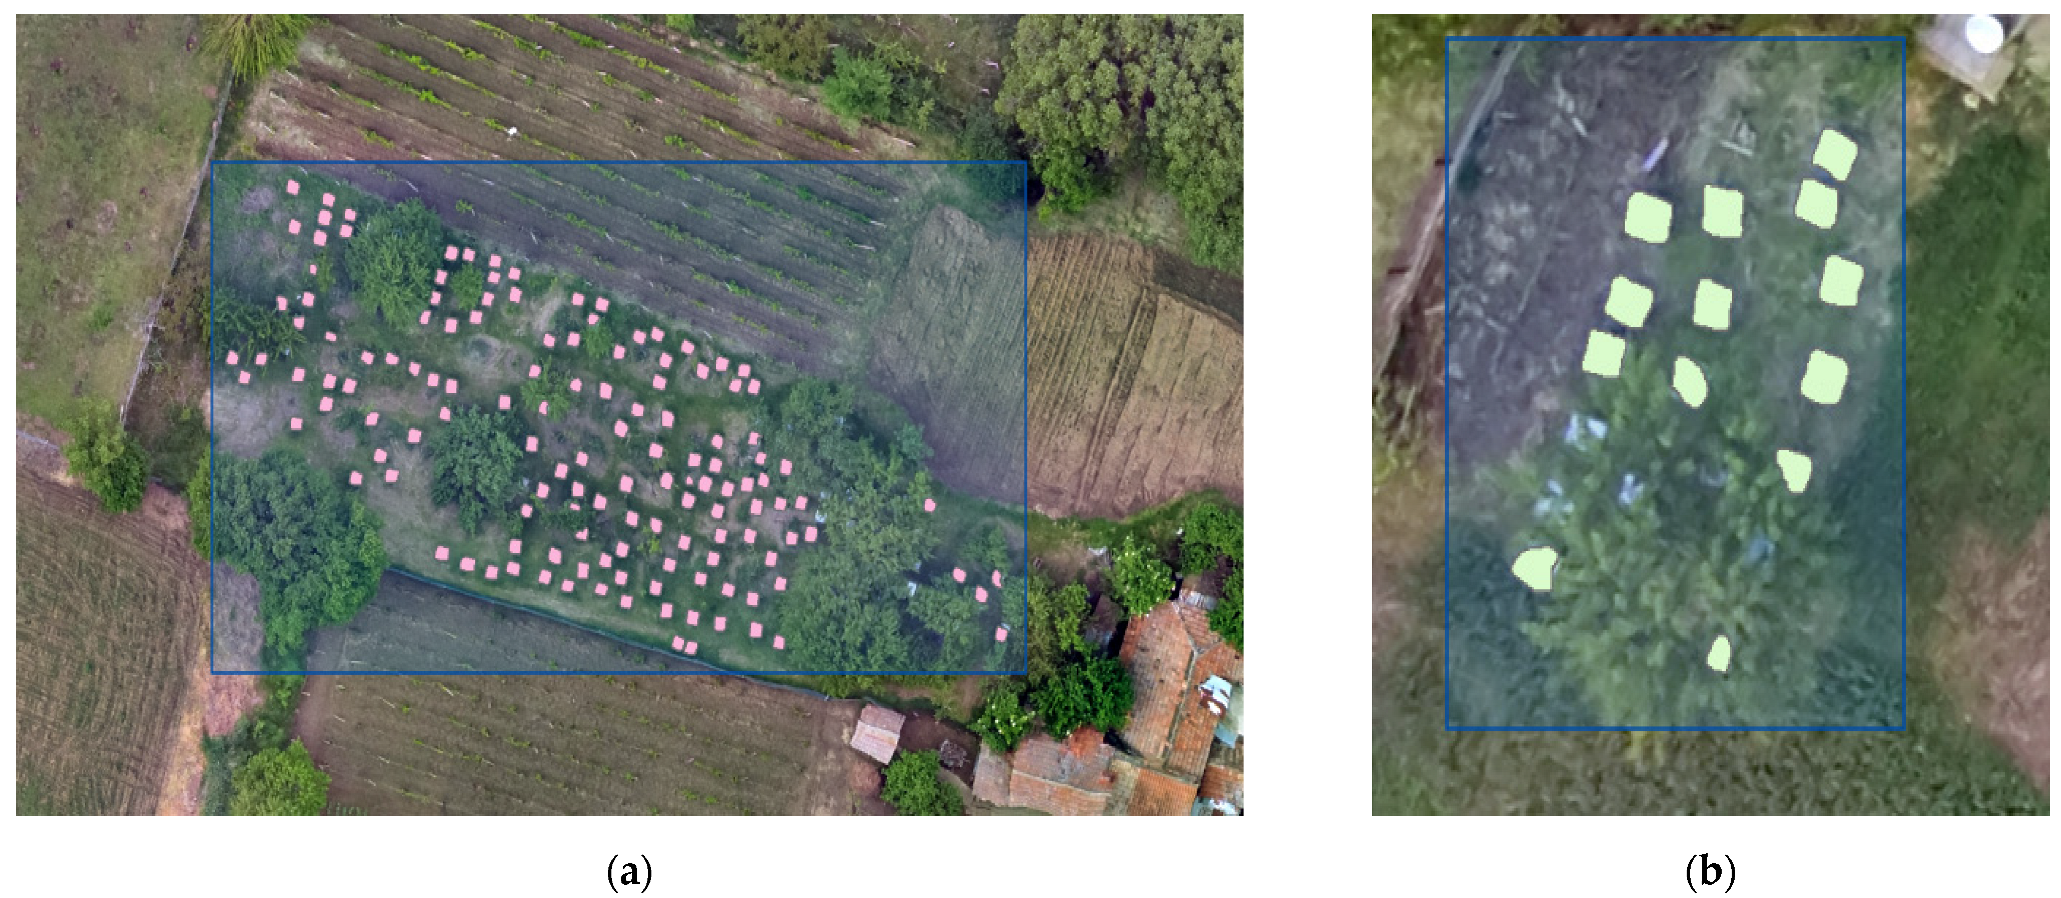
That is why step 3 was introduced into the proposed methodology, where areas with beehives are selected, and only they are analyzed with the trained CNN model. On the investigated map, two stacks of beehives can be noticed, and that is why they were marked and their count was obtained separately. Furthermore, when using the ArcGIS Pro v. 3.3.1 software for counting objects, it is important to check the “Non maximum suppression” checkbox, which will remove duplicate objects. The results from the beehive identification are presented in Figure 10, where (a) and (b) represent the two beehive areas. It can be seen that the trained model has a very high identification rate. The number of beehives identified within the two zones is 136 and 13, respectively, i.e., a total of 149.
Furthermore, it can be seen that some of the beehives were not identified because they are partially hidden under a tree. While the recognition rate could be improved, if the CNN is trained with partially hidden beehives, this would also increase the number of false positives. This limitation of the proposed methodology should be considered when interpreting the obtained results.
Another important aspect of the proposed methodology is the selection of areas with beehives. In the current study, this is performed manually, which is possible if smaller areas are analyzed. In case the analysis is made for a significantly larger area, this process might be automated with the help of another convolutional neural network, responsible for the identification of areas with numerous beehives. This has not been performed in this study.

3.3.2. Estimation of the Area Blooming Trees

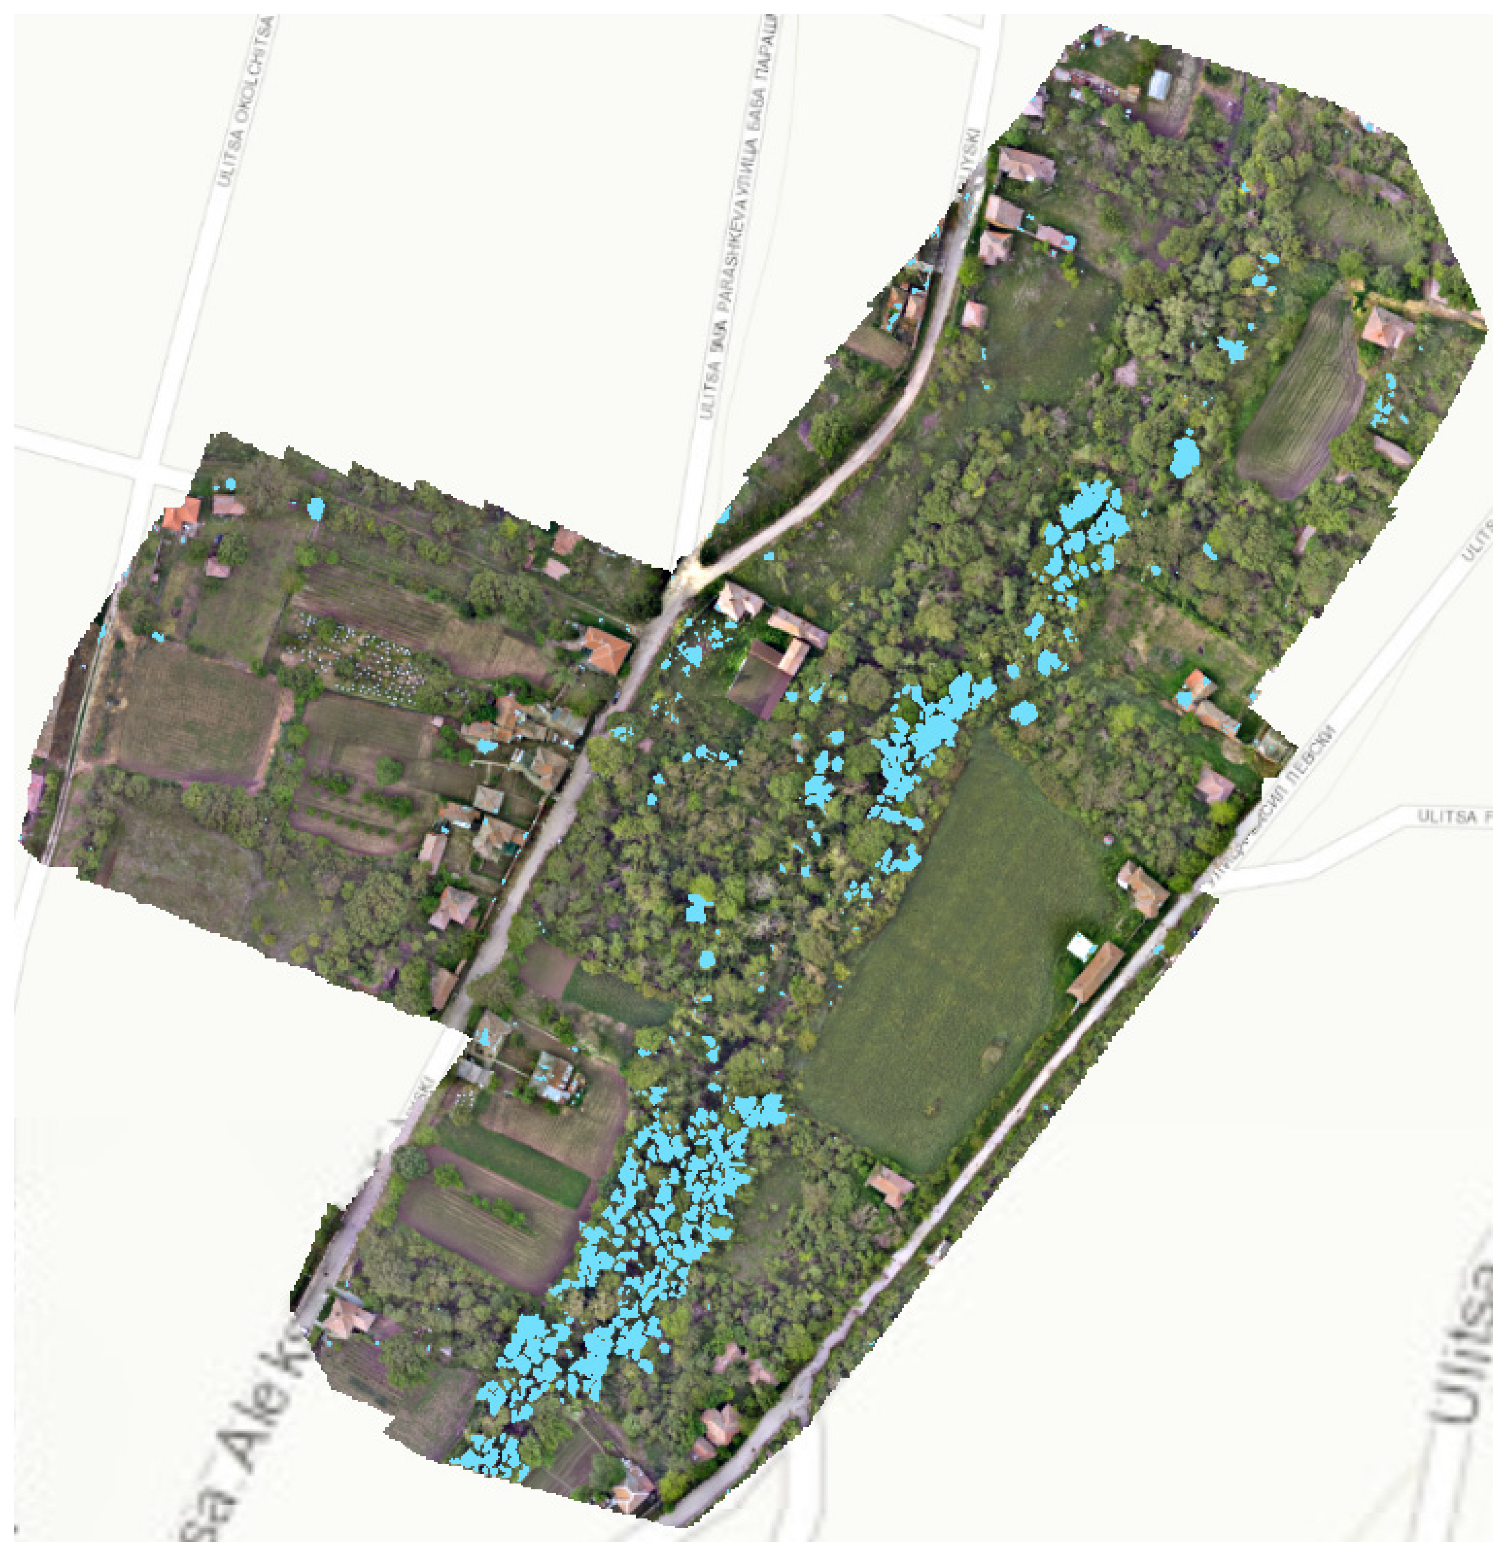
The created HQ map was also used as the input for the DeepLabV3 pixel-based CNN model, aimed at obtaining the total area of blooming trees. The graphical results from the performed analysis are presented in Figure 11. In this case, the identified blooming area corresponds to 3654 m2, out of 89,725 m2, i.e., approximately 4% of the area.

3.3.3. Analysis of the Honey Production Potential

Based on the results obtained in the estimation of the number of beehives and the blooming black locust trees area in the village, we calculated the honey production potential inside the village and summarized it in Table 1. It was found that with 149 colonies and a 0.365 ha area with black locust, the expected honey yield per hive is only 0.367 kg. According to [44], for the climatic conditions of Europe, the required amount of honey to maintain the life cycle of the bee colony for a year is between 60 and 202 kg. The calculations did not take into account the influence of weather conditions on nectar extraction, such as precipitation, wind, and air temperature, which can additionally negatively affect honey production.
The amount of honey obtained from black locust inside the village is insufficient to feed the identified number of bee colonies in the village. For a comprehensive assessment of the productive potential of black locust in the area, it is necessary to take into account the areas with flowering vegetation around the village at a radius of 2.5 km marked in Figure 2. Table 1 shows that accounting for additional areas with black locust increases the productive potential of the area.
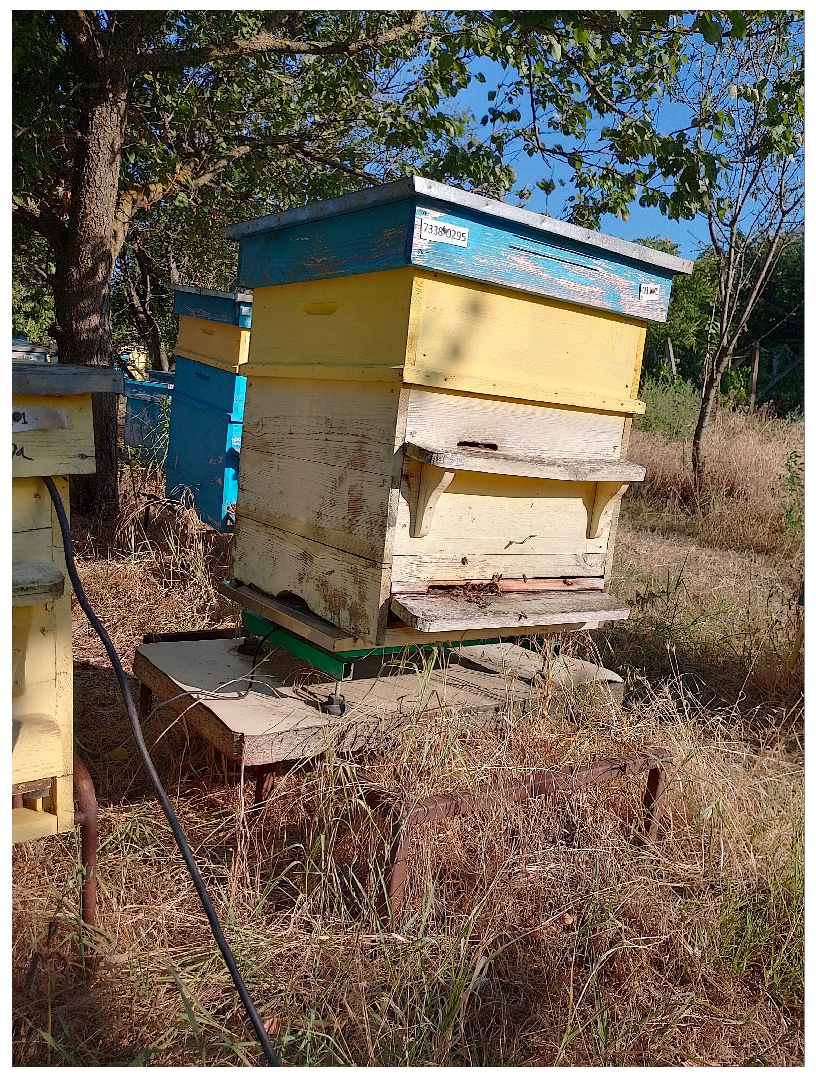
During the experiment to validate the obtained theoretical data, we placed a control hive (Figure 12) from the Dadant–Blatt system on a VAGA electronic beekeeping scale manufactured by Techtron Ltd. (Ruma, Serbia), to monitor the change in the amount of honey collected from the colony.
After the black locust honey collection ended on 2 June 2024, the collected honey was extracted and weighed. The amount of commodity honey produced by the colony was found to be 12,121 kg. Taking into account the difference in the amount of honey in the hive before the beginning of the black locust honey harvest and after the end of the honey harvest and the amount of extracted honey, we found that 18,089 kg of honey remained to maintain the vital functions of the colony. Therefore, the total amount of honey collected from the colony is 30.21 kg. Compared with the theoretical calculations, the amount of actually collected honey is 8.597 kg less than expected. This confirms the hypothesis that a large amount of the food resources is not digested by the bees due to many reasons, such as meteorological factors, competition between colonies, nectar extraction rate due to the age of the black locust trees, etc.
Despite the relatively high yield of honey, the present black locust is not sufficient to support the life cycle of the available colonies in the area for a year. For a comprehensive assessment, it is necessary to take into account meadow vegetation around the village, agricultural crops such as sunflower (Helianthus annuus L), oilseed rape (Brassica napus), and the fruit species in the settlement, which would supplement the food potential of the studied area. Such wide-ranging monitoring requires the development of new recognition algorithms, which is the goal of our next research.
The proposed methodology for detecting and distinguishing white flowering nectar source trees and counting of bee colonies in rural and suburban environments, as well as the delineation of uniform areas and determination of their nutritional potential, will facilitate beekeepers in choosing optimal places for the placement of new apiaries and planning activities of an organizational nature.

4. Conclusions

In the current study, a methodology for analysis of the honey production potential is proposed, using two different neural networks—an object-based one, responsible for identification and counting of the available beehives, and a pixel-based one, responsible for obtaining the total area of blooming vegetation. The experimental validation and demonstration of this approach showed satisfactory accuracy of the trained neural networks—93.4% and 95.2%, respectively, for the black locust recognition and beehive counting.
The analysis of the honey production potential in and near the village of Yuper (Bulgaria) found that the total theoretical potential of the observed flowering trees of black locust in the populated and non-populated areas was 0.367 kg hive−1 and 38.44 kg hive−1, respectively, and the number of identified beehives was 149. While in our study we scanned a relatively small area of the village with a drone to demonstrate the proposed concept, the methodology could be applied to significantly larger areas, obtained either from drone-based cameras or from satellites if the weather is appropriate.
The proposed methodology can be successfully used by beekeepers when detecting white flowering nectar source trees and counting bee colonies in rural and suburban environments for estimation of the productive potential of honey in the monitored area. To continue this research, we should develop algorithms to detect and recognize differently colored honey plants in populated and non-populated places, which is an object for future studies.

Author Contributions

Conceptualization, A.Z.A. and B.I.E.; methodology, A.Z.A. and B.I.E.; software, B.I.E.; validation, A.Z.A., B.I.E. and A.I.A.; formal analysis, A.Z.A. and B.I.E.; investigation, A.Z.A.; resources, A.Z.A.; data curation, B.I.E.; writing—original draft preparation, A.Z.A. and B.I.E.; writing—review and editing, A.I.A. and I.S.H.; visualization, B.I.E.; supervision, B.I.E.; project administration, A.Z.A.; funding acquisition, A.Z.A. All authors have read and agreed to the published version of the manuscript.

Funding

This research was funded by the Bulgarian National Science Fund under Project KP-06-PN 46-7 “Design and research of fundamental technologies and methods for precision apiculture”.

Institutional Review Board Statement

Not applicable.

Data Availability Statement

The data presented in this study are available on request from the corresponding author.

Acknowledgments

These studies are supported by the European Union-NextGenerationEU, through the National Recovery and Resilience Plan of the Republic of Bulgaria, project № BG-RRP-2.013-0001-C01.

Conflicts of Interest

The authors declare no conflict of interest.

References

  1. Layek, U.; Das, U.; Karmakar, P. The pollination efficiency of a pollinator depends on its foraging strategy, flowering phenology, and the flower characteristics of a plant species. J. Asia-Pac. Entomol. 2022, 25, 101882. [Google Scholar] [CrossRef]
  2. Herbertsson, L.; Rundlöf, M.; Smith, G.H. The relation between oilseed rape and pollination of later flowering plants varies across plant species and landscape contexts. Basic Appl. Ecol. 2017, 24, 77–85. [Google Scholar] [CrossRef]
  3. Atanasov, A.Z.; Georgiev, S.G.; Vulkov, L.G. Parameter Estimation Analysis in a Model of Honey Production. Axioms 2023, 12, 214. [Google Scholar] [CrossRef]
  4. Zhelyazkov, P.; Atanasov, A.; Hristakov, I. Study on the honey productive potential of the bee forage species in Northeast part of Bulgaria in Silistra region. In Proceedings of the X International Scientific Symposium FMPMSA, Lublin, Poland, 20–22 November 2019; pp. 183–188. [Google Scholar]
  5. Lu, B.; He, Y. Species classification using Unmanned Aerial Vehicle (UAV)-acquired high spatial resolution imagery in a heterogeneous grassland. ISPRS J. Photogramm. Remote Sens. 2017, 128, 73–85. [Google Scholar] [CrossRef]
  6. Sheffield, K.J.; Clements, D.; Clune, D.J.; Constantine, A.; Dugdale, T.M. Detection of Aquatic Alligator Weed (Alternanthera philoxeroides) from Aerial Imagery Using Random Forest Classification. Remote Sens. 2022, 14, 2674. [Google Scholar] [CrossRef]
  7. Fariz, T.R.; Suhardono, S.; Sultan, H.; Rahmawati, D.; Arifah, E.Z. Land cover mapping in lake Rawa pening using Landsat 9 Imagery and Google Earth Engine. J. Environ. Sci. Educ. 2022, 2, 1–6. [Google Scholar] [CrossRef]
  8. Papachristoforou, A.; Prodromou, M.; Hadjimitsis, D.; Christoforou, M. Detecting and distinguishing between apicultural plants using UAV multispectral imaging. PeerJ 2023, 11, e15065. [Google Scholar] [CrossRef]
  9. Ottoy, S.; Tziolas, N.; Van Meerbeek, K.; Aravidis, I.; Tilkin, S.; Sismanis, M.; Stavrakoudis, D.; Gitas, I.Z.; Zalidis, G.; De Vocht, A. Effects of Flight and Smoothing Parameters on the Detection of Taxus and Olive Trees with UAV-Borne Imagery. Drones 2022, 6, 197. [Google Scholar] [CrossRef]
  10. Torresani, M.; Kleijn, D.; de Vries, J.P.R.; Bartholomeus, H.; Chieffallo, L.; Gatti, R.C.; Moudrý, V.; Da Re, D.; Tomelleri, E.; Rocchini, D. A novel approach for surveying flowers as a proxy for bee pollinators using drone images. Ecol. Indic. 2023, 149, 110123. [Google Scholar] [CrossRef]
  11. Atanasov, A.Z.; Evstatiev, B.I.; Vladut, V.N.; Biris, S.-S. A Novel Algorithm to Detect White Flowering Honey Trees in Mixed Forest Ecosystems Using UAV-Based RGB Imaging. AgriEngineering 2024, 6, 95–112. [Google Scholar] [CrossRef]
  12. Ramon, J.P.E.; Michael, C.V.; Jomar, F.R. Determining the optimal distribution of bee colony locations to avoid overpopulation using mixed integer programming. J. Nat. Stud. 2010, 9, 79–82. [Google Scholar]
  13. Rebysarah, S.T.; Jomar, F.R.; Ramon, J.P.E.; Michael, C. Villadelrey Prediction of migration path of a colony of bounded-rational species foraging on patchily distributed resources. Adv. Stud. Biol. 2011, 3, 333–345. [Google Scholar]
  14. Yuce, B.; Packianather, M.S.; Mastrocinque, E.; Pham, T.D.; Lamiase, A. Honey bees inspired optimization method: The Bees Algorithm. Insects 2013, 4, 646–662. [Google Scholar] [CrossRef] [PubMed]
  15. Gavina, M.K.A.; Rabajante, J.F.; Cervancia, C.R. Mathematical Programming Models for Determining the Optimal Location of Beehives. Bull. Math. Biol. 2014, 76, 997–1016. [Google Scholar] [CrossRef] [PubMed]
  16. Saritha, R.; Vinod Chandra, S.S. Multi Dimensional Honey Bee Foraging Algorithm Based on Optimal Energy Consumption. J. Inst. Eng. India 2017, 98, 527–531. [Google Scholar] [CrossRef]
  17. Aderinto, O.Y.; Azagbaekwue, A.; Bamigbola, M.O.; Oke, M.O.; Obayomi, A.A.; Salaudeen, O.L.; Aliu, O.T. Optimization of Honey Bee Production. Int. J. Math. Models Methods Appl. Sci. 2020, 14, 56–61. [Google Scholar] [CrossRef]
  18. Atanasov, A.; Georgiev, I. Evaluation of the places for creation of apiaries and optimal distribution of the bee colonies. INMATEH—Agric. Eng. 2021, 65, 373–380. [Google Scholar] [CrossRef]
  19. Atanasov, A.; Georgiev, I.; Hristakov, I.; Hristov, P. Application of mathematical model for apiaries location evaluation. In Proceedings of the 21st International Scientific Conference “Engineering for Rural Development”, Jelgava, Latvia, 25–27 May 2022; pp. 187–193. [Google Scholar] [CrossRef]
  20. Kumar, P.B.; Prasad, T.K. Application of Multi-Criteria Decision Analysis (MCDA) to Apiculture Potential Assessment: A Case Study of Thiruvananthapuram Corporation, Kerala, India. Trans. Inst. Indian Geogr. 2021, 43, 215–226. [Google Scholar]
  21. Roque, N.; Fernandez, P.; Silveira, C.; Vilas-Boas, M.; Anjos, O. Using Analytic Hierarchy Process to Assess Beekeeping Suitability in Portuguese Controlled Areas: A First Approach. Insects 2024, 15, 91. [Google Scholar] [CrossRef]
  22. Egerer, M.; Kowarik, I. Confronting the modern gordian knot of urban beekeeping. Trends Ecol. Evol. 2020, 35, 956–959. [Google Scholar] [CrossRef]
  23. Quiralte, D.; Zarzo, I.; Fernandez-Zamudio, M.-A.; Barco, H.; Soriano, J.M. Urban Honey: A Review of Its Physical, Chemical, and Biological Parameters That Connect It to the Environment. Sustainability 2023, 15, 2764. [Google Scholar] [CrossRef]
  24. Mahé, C.; Jumarie, C.; Boily, M. The countryside or the city: Which environment is better for the honeybee? Environ. Res. 2021, 195, 110784. [Google Scholar] [CrossRef] [PubMed]
  25. Jovetić, M.S.; Redžepović, A.S.; Nedić, N.M.; Vojt, D.; Ðurđić, S.Z.; Brčeski, I.D.; Milojković-Opsenica, D.M. Urban honey-the aspects of its safety. Arh. Hig. Rada Toksikol. 2018, 69, 264–274. [Google Scholar] [CrossRef] [PubMed]
  26. Chen, B.; Jin, Y.; Brown, P. An enhanced bloom index for quantifying floral phenology using multi-scale remote sensing observations. ISPRS J. Photogramm. Remote Sens. 2019, 156, 108–120. [Google Scholar] [CrossRef]
  27. López-Granados, F.; Torres-Sánchez, J.; Jiménez-Brenes, F.M.; Arquero, O.; Lovera, M.; de Castro, A.I. An efficient RGB-UAV-based platform for field almond tree phenotyping: 3-D architecture and flowering traits. Plant Methods 2019, 15, 160. [Google Scholar] [CrossRef]
  28. Zhongyu, S.; Wenlong, J.; Xi, Q.; Long, Y. Identification and Monitoring of Blooming Mikania micrantha Outbreak Points Based on UAV Remote Sensing. Trop. Geogr. 2019, 39, 482–491. [Google Scholar] [CrossRef]
  29. Reckling, W.; Mitasova, H.; Wegmann, K.; Kauffman, G.; Reid, R. Efficient Drone-Based Rare Plant Monitoring Using a Species Distribution Model and AI-Based Object Detection. Drones 2021, 5, 110. [Google Scholar] [CrossRef]
  30. Haq, M.A.; Ahsan, A.; Gyani, J. Implementation of CNN for plant identification using UAV imagery. Int. J. Adv. Comput. Sci. Appl. 2023, 14. [Google Scholar] [CrossRef]
  31. Nasiri, V.; Darvishsefat, A.A.; Arefi, H.; Griess, V.C.; Sadeghi, S.M.M.; Borz, S.A. Modeling Forest Canopy Cover: A Synergistic Use of Sentinel-2, Aerial Photogrammetry Data, and Machine Learning. Remote Sens. 2022, 14, 1453. [Google Scholar] [CrossRef]
  32. Moysiadis, V.; Siniosoglou, I.; Kokkonis, G.; Argyriou, V.; Lagkas, T.; Goudos, S.K.; Sarigiannidis, P. Cherry Tree Crown Extraction Using Machine Learning Based on Images from UAVs. Agriculture 2024, 14, 322. [Google Scholar] [CrossRef]
  33. Williams, S.M.; Aldabashi, N.; Cross, P.; Palego, C. Challenges in Developing a Real-Time Bee-Counting Radar. Sensors 2023, 23, 5250. [Google Scholar] [CrossRef] [PubMed]
  34. Kulyukin, V.; Mukherjee, S. On Video Analysis of Omnidirectional Bee Traffic: Counting Bee Motions with Motion Detection and Image Classification. Appl. Sci. 2019, 9, 3743. [Google Scholar] [CrossRef]
  35. Florea, G.; Codreanu, N. Electronic System for the Management of a Beehive. In Proceedings of the 2022 IEEE 9th Electronics System-Integration Technology Conference (ESTC), Sibiu, Romania, 13–16 September 2022. [Google Scholar] [CrossRef]
  36. Voudiotis, G.; Moraiti, A.; Kontogiannis, S. Deep Learning Beehive Monitoring System for Early Detection of the Varroa Mite. Signals 2022, 3, 506–523. [Google Scholar] [CrossRef]
  37. Mrozek, D.; Gȯrny, R.; Wachowicz, A.; Małysiak-Mrozek, B. Edge-Based Detection of Varroosis in Beehives with IoT Devices with Embedded and TPU-Accelerated Machine Learning. Appl. Sci. 2021, 11, 11078. [Google Scholar] [CrossRef]
  38. Dirir, A.; Ignatious, H.; Elsayed, H.; Khan, M.; Adib, M.; Mahmoud, A.; Al-Gunaid, M. An Advanced Deep Learning Approach for Multi-Object Counting in Urban Vehicular Environments. Future Internet 2021, 13, 306. [Google Scholar] [CrossRef]
  39. Abeyrathna, R.M.R.D.; Nakaguchi, V.M.; Minn, A.; Ahamed, T. Recognition and Counting of Apples in a Dynamic State Using a 3D Camera and Deep Learning Algorithms for Robotic Harvesting Systems. Sensors 2023, 23, 3810. [Google Scholar] [CrossRef]
  40. Jia, Z.; Zhang, X.; Yang, H.; Lu, Y.; Liu, J.; Yu, X.; Feng, D.; Gao, K.; Xue, J.; Ming, B.; et al. Comparison and Optimal Method of Detecting the Number of Maize Seedlings Based on Deep Learning. Drones 2024, 8, 175. [Google Scholar] [CrossRef]
  41. P4 Multispectral. Available online: https://www.dji.com/bg/p4-multispectral (accessed on 20 July 2024).
  42. Visscher, P.K.; Seeley, T.D. Foraging strategy of honeybee colonies in a temperate deciduous forest. Ecology 1982, 63, 1790–1801. [Google Scholar] [CrossRef]
  43. Beekman, M.; Ratnieks, F.L.W. Long-range foraging by the honey-bee, Apis mellifera L. Funct. Ecol. 2000, 14, 490–496. [Google Scholar] [CrossRef]
  44. Seeley, T.D.; Camazine, S.; Sneyd, J. Collective decision making in honey bees: How colonies choose among nectar sources. Behav. Ecol. Sociobiol. 1991, 28, 277–290. [Google Scholar] [CrossRef]
Figure 1. Location of the experimental plot: (a) the village of Yuper; (b) the geographic location of the experimental area in the north-eastern part of Bulgaria.
Diversity 16 00578 g001
Figure 2. Summary of the proposed methodology for analysis of the honey production potential.
Diversity 16 00578 g002
Figure 3. Summary of the geo-referenced image in the Yuper region. The flight range of the bees is marked with the yellow circles. The areas Robinia pseudoacacia are marked with green.
Diversity 16 00578 g003
Figure 4. The merged images selected as reference data for recognizing blooming trees (marked in yellow).
Diversity 16 00578 g004
Figure 5. Training and validation loss of the DeepLabV3 CNN model for blooming areas identification.
Diversity 16 00578 g005
Figure 6. Image used as reference data for training the beehives recognition model (a) and closeup image of an area with the beehives (b). All beehives are marked with yellow rectangles.
Diversity 16 00578 g006
Figure 7. Training and validation loss of the Mask RCNN model for beehive counting.
Diversity 16 00578 g007
Figure 8. HQ map of the investigated area, generated using the UAV images. The yellow squares represent the locations of the UAV-obtained images.
Diversity 16 00578 g008
Figure 9. Examples of false positives during beehive identification and counting. The red marks represent the artificial objects, incorrectly identified as beehives.
Diversity 16 00578 g009
Figure 10. Identified beehives (marked in pink and green) in: (a) area 1; (b) area 2.
Diversity 16 00578 g010
Figure 11. Graphical results from the pixel-based identification of blooming trees (marked in blue).
Diversity 16 00578 g011
Figure 12. Control hive for monitoring the weight.
Diversity 16 00578 g012
Table 1. Results of the calculations for honey production potential inside and outside the village.
Overlap Zone Inside the Village
Forage SpeciesArea, haNumber of Bee ColoniesNectar Secretion Potential, kg ha−1Maximum Honey Yield Expected Potential, kgExpected Honey Yield, kg Hive−1 per Season
Black locust0.36514930054.750.367
Overlap Zone outside the village
Black locust38.18149300572738.44
Total38.807
Disclaimer/Publisher’s Note: The statements, opinions and data contained in all publications are solely those of the individual author(s) and contributor(s) and not of MDPI and/or the editor(s). MDPI and/or the editor(s) disclaim responsibility for any injury to people or property resulting from any ideas, methods, instructions or products referred to in the content.