Abstract
Beetles represent the most diverse group of living organisms on Earth, yet there has been very little in the way of using beetle distributions in bioregionalization exercises. Here, we combine several small data sets for beetle distributions in South Africa to produce a list of morphospecies and to analyze their presence within twenty geographic units spanning the entire country. We find a diversity of fine scale assemblages in the east, but also a disjunction between the western arid/winter-rainfall and eastern summer-rainfall half of the country, which is in line with several previous studies based on diverse groups of animals and plants. We recommend the use of the increasing citizen science data sets in studying biogeographic patterns in groups such as beetles, which have so far received limited attention.
1. Introduction
The accuracy of bioregionalization schemata depends on the completeness of the records for the group of organisms under study. This is why tetrapod vertebrates and higher plants dominate the majority of the available schemata to date [1]. In contrast, invertebrates, which include the majority of both terrestrial and marine species, remain poorly explored in both regional [2] and global [3] studies, and in the latter case, these often have to rely on substantial and not inconsequential interpolation exercises.
The advent of online data from platforms such as the Global Biodiversity Information Facility and iNaturalist, is likely to be a gamechanger in terms of invertebrate data availability, albeit, at this stage, the distribution data are still vastly lagging behind those for larger-bodied organisms, and much effort is going into data cleaning methods [4]. Thus, at least regionally, museum collections may yet represent the most comprehensive data source. While these are still being digitized, one can refer to other distribution data, derived from diverse taxonomic and ecological studies. The question of course remains—how representative can such data be, even when combining the efforts of multiple researchers, for entire biogeographic provinces or regions? Can the results favorably compare with schemata based on well-collected taxa?
Given the educational and conservational relevance of bioregionalization at a time of rapid biodiversity loss [5], and when increased environmental awareness is called for [6], such questions need to be addressed urgently. It is particularly important that, at a time when small-bodied invertebrates are still underrepresented in online databases, and when museum collections are incompletely digitized, other data sources be found and their representativeness be assessed. Here, we use beetle (Coleoptera) records collated from a range of ecological and other studies conducted across sections of South Africa, and use them to delineate regional subdivisions and compare these with available schemata based on invertebrates as well as other taxa.
2. Methods
We collated data sets compiled with reference digital photographs for 5269 individual beetles recorded in South Africa (SA) between 2008 and 2016 (although, in some cases, these were published later), as part of several ecological, evolutionary, taxonomic, and biogeographic projects [7,8,9,10,11,12,13]; these were combined with collections assessed for an undergraduate course at the University of KwaZulu-Natal, and occasional collections by the authors of this study, gathered during the same time interval. The photographs were examined and classified into morphospecies based on external morphology, following guidelines based on numerous recent genus-level revisions across most of the major beetle families, but without considering any differences in genitalia. This resulted in morphospecies likely being able to equate to actual species in most cases, but in some cases, potentially incorporating two or more species from the same genus. Following this method, the individual beetles were allocated to 2407 morphospecies representing 83 families based on the most recent classification for all beetles [14,15]. Collection localities were digitized and the coordinates assigned to operational geographic units (OGUs) were modified from a recent reference used in a similar study [16], as per Table 1 and illustrated in Figure 1. This resulted in a presence–absence matrix for morphospecies according to geographic units (Supplementary Table S1), which was then phenetically analyzed (Unweighted Pair Group Method with Arithmetic Mean (UPGMA) with the Jaccard similarity coefficient, as used in key bioregionalization studies [17]) using the PAST 3.22 software package [18], to determine the similarity between mapping units based on their assemblages of beetle morphospecies. Singletons (i.e., morphospecies present on only a single geographic unit) were removed prior to analyses [19].

Table 1.
The operational geographic units of analysis (modified from [16]) and the corresponding biomes and bioregions.
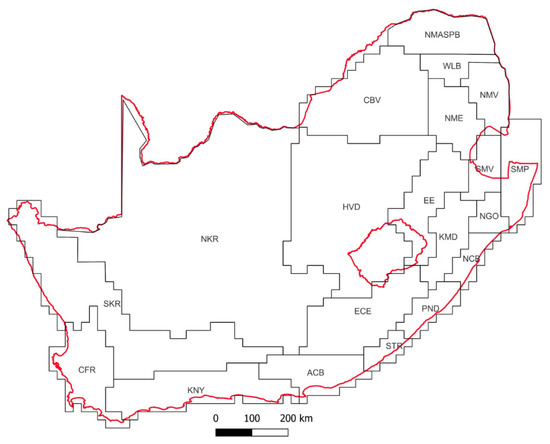
Figure 1.
Map of South Africa (red outline) with the geographic units used in the analysis (modified from [16] based on vertebrates); see Table 1 for further details.
3. Results
Where specimen and morphospecies representation across South Africa is concerned, the best represented were the OGUs where the included projects were centered, with most specimens being collected in coastal areas (Table 1). This was reflected in the number of morphospecies too, including in areas close to the cities of Durban (eThekwini Municipality), with exactly 800 morphospecies, followed by Cape Town, George, and Gqeberha (with 384, 295, and 242 morphospecies, respectively); the poorest representation was for the OGUs most distant from these (largely coinciding with the arid parts of South Africa—Nama karoo and Succulent karoo), with only 18 morphospecies for these two units combined.
The clusters of OGUs detected by our analyses were each spatially contiguous at 0.03 and 0.06 similarity on the resulting phenogram (Figure 2), and these sets of clusters were, respectively, mapped as main clusters and sub-clusters. At 0.03 similarity, three clusters were distinguished. Cluster 1 is composed of three units—NMSPB (Northern Mopane and Soutpansberg), WLB (Wolkberg), and NMV (Northern Middelveld). It is located in the northern summer-rainfall parts of SA and has tropical affinities, incorporating most of the Limpopo province, a large part of the Mpumalanga province, as well as northern parts of the Northwest province and Eswatini. This is the smallest cluster in terms of area, and is predominately a savanna cluster and, to a lesser degree, includes parts of the grassland biome. At 0.06 similarity, Cluster 1 is composed of two sub-clusters (1.1 and 1.2). Sub-cluster 1.1 is composed of NMSPB and WLB mostly in Limpopo and savanna biome, while sub-cluster 1.2 is composed only of NMV, which covers Eswatini-Eastern Mpumalanga and is also dominated by savanna.
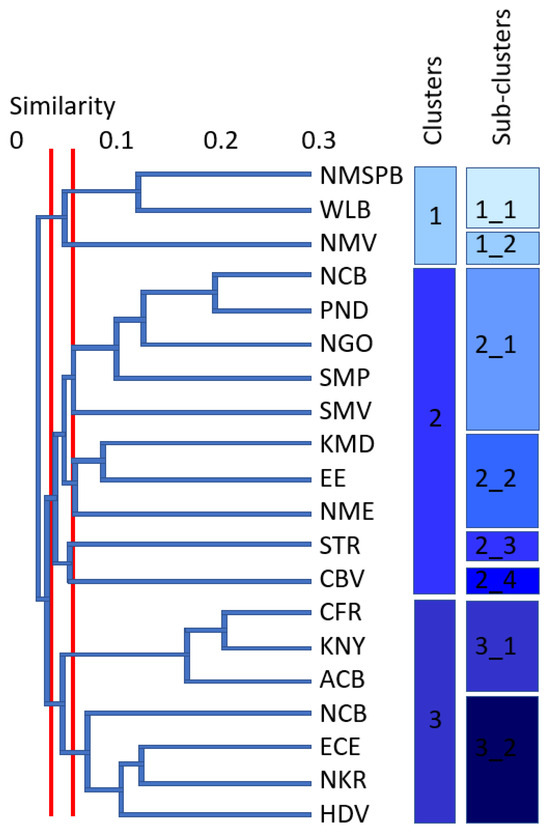
Figure 2.
Bioregionalization of South Africa based on beetle occurrences: phenogram of the operational geographic units, with phenon cutoffs represented by red lines at 0.03 (clusters) and 0.06 (sub-clusters) (abbreviations for the regions are given in Table 1). Clusters and sub-clusters in shades of blue as mapped in Figure 3.
Cluster 2 is composed of ten OGUs of SA (NCB (Natal Coastal Belt), PND (Pondoland), NGO (Ngoye), SMP (Southern Maputaland), SMV (Southern Middelveld), KMD (KwaZulu-Natal Midlands), EE (Eastern Escarpment), NME (Northern Mpumalanga Escarpment), STR (Southern Transkei Coastal Belt), and CBV (Central Bushveld)). This is a more temperate–subtropical cluster, including the South African provinces of KwaZulu-Natal, Gauteng, North West, and partly Mpumalanga and Eastern Cape (composed predominately of savanna and grassland biomes, with forest pockets). Cluster 2 has four sub-clusters at 0.06 similarity. Sub-cluster 2.1 has five units (NCB, PND, NGO, SMP, and SMV), including coastal KwaZulu-Natal and adjacent inland areas, as well as most of Eswatini (biome mosaics with savanna, grassland, and forest, as well as within the Indian Ocean Coastal Belt, best exemplified by the STR, PND, and NCB units in Table 1). Sub-cluster 2.2 has three units (KMD, EE, and NME) and covers inland KwaZulu-Natal, Gauteng, and western Mpumalanga. It is largely congruent with the grassland biome. Both sub-clusters 2.3. and 2.4. have a single unit each. Sub-cluster 2.3. is coastal and composed of STR (coastal Eastern Cape) with biome mosaics of savanna, grassland, and forest, as well as within the Indian Ocean Coastal Belt. Sub-cluster 2.4. is further inland and equates to the CBV unit, which is centered in the North West Province, straddling savanna and grassland vegetation.
Cluster 3 has seven units viz. CFR (Cape Floristic Region), KNY (Knysna), ACB (Albany Coastal Belt), SKR (Succulent Karoo), ECE (Eastern Cape Escarpment), NKR (Nama Karoo), and HVD (Highveld). This cluster covers the largest area including the arid parts of South Africa, as well as the winter-rainfall Cape Floristic Region (the Western Cape, Northern Cape, and parts of the Eastern Cape and Free State provinces of SA, as well as Lesotho). It includes the entire Fynbos, Succulent Karoo, Nama Karoo, and desert biomes; large parts of the Albany Thicket; and more arid sections of the grassland and savanna biomes. There are two sub-clusters at similarity 0.06, with Cluster 3 dividing into an arid and a winter-rainfall cluster. Sub-cluster 3.1 covers the Eastern, Western, and Northern Cape provinces and is composed of CFR, KNY, and ACB (winter-rainfall area) OGUs. Sub-cluster 3.2 is composed of the four remaining OGUs (SKR, ECE, NKR, and HVD). This is a large, mostly arid area covering the Northern Cape, Eastern Cape, Free State, Lesotho, and parts of the North West and Limpopo provinces.
4. Discussion
4.1. Spread of Collection Points
The collection localities were not evenly spread across SA. The vast majority of the collection points were close to the institutions that hosted the research projects (mostly the University of KwaZulu-Natal in Durban and Pietermaritzburg (KwaZulu-Natal), but also Nelson Mandela University in Gqeberha (formerly Port Elizabeth; Eastern Cape) and the University of Cape Town in Cape Town (Western Cape)), which biased the representation across geographic units (Table 1) (see [20] for a discussion on geographical bias in data for land snails in southern Africa). Nevertheless, at least a few records were available from each geographic unit, even after eliminating the morphospecies from single geographic units (i.e., singletons).
4.2. Regional Patterns
It is common for the main biogeographic disjunction in southern Africa to be either between the arid west and the mesic east, or between the winter-rainfall southwest and the rest of the region [21]. This study also illustrates a distinct western cluster, and a further disjunction in the west between the winter-rainfall southwest and the arid remainder. However, our primary disjunction is between the more tropical lowveld savanna (Limpopo and eastern Mpumalanga; Cluster 1 in Figure 3) and the rest, as has previously been retrieved in freshwater fishes, amphibians, and mammals [21], in all vertebrates [16], as well as in land snails [20]. These disjunctions largely match those shown here at 0.03 or 3% similarity (Figure 3). The finer subdivisions observed in the east and north at 0.06 (6%) similarity are possibly artifacts resulting from limited sampling, although a distinctive cluster centered around the North West province is arguably equivalent to the one retrieved for birds (see [21]).
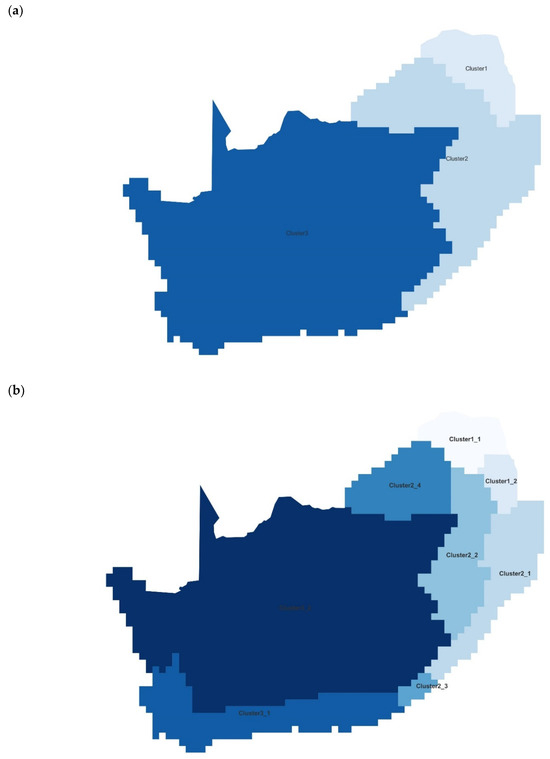
Figure 3.
Bioregionalization of South Africa based on beetle occurrences: maps show the geographic location of the three clusters differentiated at 0.03 similarity (a) and eight sub-clusters differentiated at 0.06 (b).
It is remarkable and reassuring that even with limited and biased sampling as reported here, it is possible to reconstruct broad regional biotic assemblage patterns similar to those acknowledged based on much larger data sets in organisms that are much better surveyed. It is, at the same time, important to understand how far this reliability goes in terms of finer subdivisions (cf. [16]).
The approach taken here, based on ad hoc collections, is likely to contain mainly common species, and very few rare ones. In a sense, this is similar to vegetation classification, which often places an emphasis on dominant taxa, and the opposite of the endemics-focused previous approach to vertebrate biogeography in Southeast Africa [16]. Insect morphospecies are in fact good biome indicators [22]. However, this does not seem to play an important role here, as the biogeographic units retrieved correspond better to those for endemic vertebrates than to biomes. This may have to do with multiple cryptic beetle species being lumped as one morphospecies in certain instances, but the broader species group is quite correctly defined and is associated with one or a few biome(s) or vegetation type(s). It is with great excitement that we are expecting regional pattern studies using citizen science-based data sets as they increase in size, and as their biases become better understood [23]. In the meantime, our study indicates that combining other data sources as available may provide reasonably reliable bioregionalization schemata.
Supplementary Materials
The following supporting information can be downloaded at: https://www.mdpi.com/article/10.3390/d16080454/s1, Table S1: Presence/absence matrix for beetle morphospecies by biogeographic unit (abbreviations as in Table 1 in the article).
Author Contributions
Conceptualization, Ş.P.; methodology, S.R. and S.J.P.; formal analysis, A.K.S.; original draft preparation, A.K.S. and Ş.P.; writing—review and editing, all authors participated in equal measure. All authors have read and agreed to the published version of the manuscript.
Funding
This research received no external funding.
Institutional Review Board Statement
Not applicable.
Data Availability Statement
The distribution data are available in the Supplementary Materials.
Acknowledgments
Ş.P. and S.R. thank UKZN for research support.
Conflicts of Interest
The authors declare no conflicts of interest.
References
- Padayachee, A.L.; Procheş, Ş.; Govender, C.O. Biogeographic Regionalization: Land. In Encyclopedia of Biodiversity, 3rd ed.; Cardozo da Silva, J.M., Ed.; Elsevier: Amsterdam, The Netherlands, 2024; pp. 885–895. [Google Scholar] [CrossRef]
- Santos, D.; Ribeiro, G.C. Areas of endemism in the Afrotropical region based on the geographical distribution of Tipulomorpha (Insecta: Diptera). Austral Ecol. 2022, 47, 92–113. [Google Scholar] [CrossRef]
- Moodley, S.; Procheş, Ş.; Perera, S.J.; Lubbe, E.; Ramdhani, S.; Leschen, R.A.B. Analysis of the diversity and distributional patterns of coleopteran families on a global scale. Zootaxa 2022, 5138, 575–583. [Google Scholar] [CrossRef] [PubMed]
- Koo, K.-S.; Oh, J.-M.; Park, S.-J.; Im, J.-Y. Accessing the accuracy of citizen science data based on iNaturalist data. Diversity 2022, 14, 316. [Google Scholar] [CrossRef]
- Jaureguiberry, P.; Titeux, N.; Wiemers, M.; Bowler, D.E.; Coscieme, L.; Golden, A.S.; Guerra, C.A.; Jacob, U.; Takahashi, Y.; Settele, J.; et al. The direct drivers of recent global anthropogenic biodiversity loss. Sci. Adv. 2022, 8, eabm9982. [Google Scholar] [CrossRef] [PubMed]
- de Oliveira Caetano, G.H.; Vardi, R.; Jarić, I.; Correia, R.A.; Roll, U.; Veríssimo, D. Evaluating global interest in biodiversity and conservation. Conserv. Biol. 2023, 37, e14100. [Google Scholar] [CrossRef]
- Gibson, M.R. Invasive Australian Acacias: Reproductive Biology and Effects on Native Plant-Pollinator Communities in Cape fynbos. Master’s Thesis, Stellenbosch University, Stellenbosch, South Africa, 2012. [Google Scholar]
- Meyer-Milne, E. Bontveld Landscape Ecology: A Platform for Biodiversity Conservation and Resource Management in Eastern Cape Thicket Mosaics. Ph.D. Dissertation, Nelson Nelson Mandela Metropolitan University, Port Elizabeth, South Africa, 2013. [Google Scholar]
- Padayachi, Y.; Procheş, Ş.; Ramsay, L.F. Beetle assemblages of indigenous and alien decomposing fruit in subtropical Durban, South Africa. Arthropod-Plant Interact. 2014, 8, 135–142. [Google Scholar] [CrossRef]
- Welsford, M.R.; Hobbhahn, N.; Midgley, J.J.; Johnson, S.D. Floral trait evolution associated with shifts between insect and wind pollination in the dioecious genus Leucadendron (Proteaceae). Evolution 2016, 70, 126–139. [Google Scholar] [CrossRef]
- Hickman, T.; Procheş, Ş.; Ramdhani, S. Patterns of species richness in two African-centered, aridity-adapted flightless weevil lineages (Coleoptera: Curculionoidea). Zootaxa 2017, 4323, 593–599. [Google Scholar] [CrossRef]
- Haran, J.; Procheş, Ş.; Benoit, L.; Kergoat, G.J. From monocots to dicots: Host shifts in Afrotropical derelomine weevils shed light on the evolution of non-obligatory brood pollination mutualism. Biol. J. Linn. Soc. 2022, 137, 15–29. [Google Scholar] [CrossRef]
- Sarapuu, J. Diversity Patterns of Beetles (Coleoptera) on South African Trees. Master’s Dissertation, University of Tartu, Tartu, Estonia, 2022. [Google Scholar]
- Beutel, R.G.; Leschen, R.A.B. Handbook of Zoology. Coleoptera, Beetles (Archostemata, Adephaga, Myxophaga, Polyphaga Part); Walter de Gruyter: Berlin, Germany, 2005; Volume 1. [Google Scholar]
- Leschen, R.A.B.; Beutel, R.; Lawrence, J.F. Handbook of Zoology. Coleoptera, Beetles. Morphology and Systematics (Polyphaga partim); Walter de Gruyter: Berlin, Germany, 2010; Volume 2. [Google Scholar]
- Perera, S.J.; Procheş, Ş.; Ratnayake-Perera, D.; Ramdhani, S. Vertebrate endemism in south-eastern Africa numerically redefines a biodiversity hotspot. Zootaxa 2018, 4382, 56–92. [Google Scholar] [CrossRef] [PubMed]
- Costello, M.J.; Tsai, P.; Wong, P.S.; Cheung, A.K.L.; Basher, Z.; Chaudhary, C. Marine biogeographic realms and species endemicity. Nat. Commun. 2017, 8, 1057. [Google Scholar] [CrossRef]
- Hammer, Ø.; Harper, D.A.T.; Ryan, P.D. PAST: Paleontological Statistics Software Package for Education and Data Analysis. Palaeontol. Electron. 2001, 4, 4. [Google Scholar]
- Ramdhani, S.; Barker, N.P.; Baijnath, H. Exploring the Afromontane centre of endemism: Kniphofia Moench (Asphodelaceae) as a floristic indicator. J. Biogeogr. 2008, 35, 2258–2273. [Google Scholar] [CrossRef]
- Perera, S.J.; Herbert, D.G.; Procheş, Ş.; Ramdhani, S. Land snail biogeography and endemism in south-eastern Africa: Implications for the Maputaland-Pondoland-Albany biodiversity hotspot. PLoS ONE 2021, 16, e0248040. [Google Scholar] [CrossRef]
- Colville, J.F.; Potts, A.J.; Bradshaw, P.L.; Measey, G.J.; Snijman, D.; Picker, M.D.; Procheş, Ş.; Bowie, R.C.K.; Manning, J.C. Floristic and faunal Cape biochoria: Do they exist? In Fynbos: Ecology, Evolution and Conservation of a Megadiverse Region; Allsopp, N., Colville, J.F., Verboom, T., Eds.; Oxford University Press: Oxford, UK, 2014; pp. 73–92. [Google Scholar] [CrossRef]
- Procheş, Ş.; Cowling, R.M. Do insect distributions fit our biomes? South Afr. J. Sci. 2007, 103, 258–261. [Google Scholar]
- Dimson, M.; Gillespie, T.W. Who, where, when: Observer behavior influences spatial and temporal patterns of iNaturalist participation. Appl. Geogr. 2023, 153, 102916. [Google Scholar] [CrossRef]
Disclaimer/Publisher’s Note: The statements, opinions and data contained in all publications are solely those of the individual author(s) and contributor(s) and not of MDPI and/or the editor(s). MDPI and/or the editor(s) disclaim responsibility for any injury to people or property resulting from any ideas, methods, instructions or products referred to in the content. |
© 2024 by the authors. Licensee MDPI, Basel, Switzerland. This article is an open access article distributed under the terms and conditions of the Creative Commons Attribution (CC BY) license (https://creativecommons.org/licenses/by/4.0/).