Article

Genetic Diversity and Profile of Red Algae Pterocladiella capillacea (Gelidiales, Rhodophyta) along the Coast of China

1
Marine Science Institute, Shantou University, Shantou 515063, China
2
Institute of Oceanology, Chinese Academy of Sciences, Qingdao 266071, China
*
Author to whom correspondence should be addressed.
Diversity 2024, 16(7), 389; https://doi.org/10.3390/d16070389
Submission received: 22 May 2024 / Revised: 20 June 2024 / Accepted: 26 June 2024 / Published: 8 July 2024

Abstract

:
Red algae Pterocladiella capillacea off the coast of China were investigated for genetic diversity. With 176 samples categorized into six populations based on concatenated rbcL and cox1 sequences, the results rang warning bells for the genetic diversity of Pterocladiella capillacea along the Chinese coastline: (1) a good diversity of haplotype (Hd > 0.5) in Naozhou and Hui’an populations situated along the southern coast of China, but highest in the former; (2) less nucleotide diversity in each of the six populations (Pi < 0.005); (3) genetic differentiation occurred between the north population in Changdao and the two southern grown populations in Nan’ao, and Naozhou. To identify molecular markers, an MP phylogenetic tree was used to illustrate genetic profiles in detail, with 161 concatenated sequences clustered into four branches: Changdao (north), Nan’ao (south), Naozhou (south), and the remaining regions (middle). The Fst value for each of Changdao, Nan’ao, and Naozhou was greater than 0.5, which denotes that these three populations are genetically different to those growing in the middle coast. Moreover, a 30-haplotype-based median-joining network corroborated this genetic differentiation, though variations between all the investigated populations were not very high due to the relatively smaller values of genetic distance between the six (Dxy < 0.01). Overall, red algae P. capillacea in Chinese coastal seawater showed a higher haplotype diversity and lower nucleotide diversity. Such a genetic profile indicates that both natural random genetic drift and interference from human activities have possibly affected the distribution of gene frequencies in red algae P. capillacea along the Chinese coastline.

1. Introduction

The predominant order Gelidiales of Rhodophyta has drawn great attention from marine biologists and aquacultural industrial researchers due to its high economic value and ocean ecological value. Of the family Pterocladiaceae, red algae Pterocladiella capillacea (S.G.Gmelin) Santelices & Hommersand has a unique role in marine biology [1]. The species is a major cash crop in the Chinese aquacultural industry, and grows abundantly along the rocky parts of the coast of China, especially in the subtidal line of the southern coastal regions [1,2]. In addition to its economic value of being used for food, medical product resources, and fishery industry feed [3], red algae P. capillacea is important for a plethora of marine organisms in both food chain and inhabitation conditions [4].
In recent years, wildly grown P. capillacea has decreased in quantity and in quality as well, due to the impact of climate change and human activities. In the ensuing consequences, the utilization of this species in the aquacultural industry has devalued and extinction of the species has even occurred in some areas. In addition, the lack of research on the genetic diversity of order Gelidials is obvious, especially in China. Therefore, there is a great need to research the genetic diversity and profile of P. capillacea for the purposes of ecological goals and economic value.
Exploring techniques of aqua-farming algae often begins with figuring out a species’ genetic profile, and molecular marker technology is widely used for this purpose in modern marine biology. Molecular marker technologies like AFLP (Amplified Fragment Length Polymorphism), RAPD (Random Amplified Polymorphic DNA), ITS (Internal Transcribed Spacer), ISSR (Inter-Simple Sequence Repeat), cox2-3 (Intergenic spacer between the cytochrome oxidase subunits 2 and 3), etc., have been broadly applied in taxonomy and phylogenetic analysis of algae [5,6,7,8]. Undoubtably, there is no all-in-one molecular marker, and successful genetic marking is based on compatibility between markers and species. Of the popular molecular markers, the Chloroplast rbcL gene and mitochondria cox1 gene are the two most widely used for red algae studies [9,10,11,12]. These techniques have been fully developed since the middle of the 1990s, and the rbcL gene has been meticulously checked in Gelidiales for taxonomy and phylogenetic analysis of different species [13,14,15]. Freshwater et al. [13] studied rbcL presentation in different species and populations of Rhodophyta, revealing genetic differentiation. Indeed, rbcL was proved by many studies (e.g., Shimada et al.; Thomas & Freshwater; Tronchin & Freshwater [16,17,18]) as the most commonly used molecular marker in the classification of Gelidiales. However, relying solely on rbcL cannot clearly clarify related species. In another study from Freshwater [19], cox1 provided a more effective and reliable marker than rbcL for defining Gelidiales species, especially in distinguishing close-kinship related species. Besides Freshwater, others [20,21] have also shown the cox1 gene’s effectiveness in phylogenetic studies.
In fact, researchers found that using a set of molecular markers consisting of rbcL and cox1 would release comprehensive genetic messages for algae populations, which provide useful information for academic research and industrial aims alike. Wang (2016) [10] applied rbcL and cox1 molecular markers to the molecular phylogeny of Rhodophyta and the classification of Gelidiales that grow in the Chinese coastal sea. Wu et al. (2020) [11] conducted genetic diversity analysis on various populations of Pyropia haitanensis along the southeastern coast of China using rbcL and cox1. While Chinese marine biology researchers and aquaculture industry practitioners have conducted studies on algae genetic diversity for economic value and academic purposes, little is known about the genetic diversity of species of Pterocladiella.
In the current study, we marked rbcL and cox1 sequences in 161 out of 176 initially collected samples, examining the genetic diversity of P. capillacea grown along the coast of China, and described the genetic profile of six populations of this species from the north coast to the south coast. We hope the results will be useful for the Chinese aquacultural industry and algae research academics alike.

2. Materials and Methods

2.1. Algae Materials

We collected 176 individuals of P. capillacea in its growing season from 2022 to 2024. Six sampling sites were situated in intertidal zones along the coast of China, including Shandong, Zhejiang, Fujian, and Guangdong Province (see Figure 1 and Table 1). At each site, algae were randomly and orderly collected; for the record, each sampling distance was at least 2 m between individuals. Sample preparation: (1) the whole plant of each individual sample was sorted and coded. (2) All the samples were cleaned using a brush and tweezers in sterilized seawater to remove attached organisms or sludge under a dissecting microscope. (3) Blotting paper was used to dry the samples; then, the samples were each weighed to 0.1 g. (4) Each sample was kept in a 1.5 mL centrifuge tube and stored at −20 °C.

2.2. Sequencing Molecular Markers

Total genomic DNA extraction followed the protocol of the Plant Genomic DNA Kit (TIANGEN, Beijing, China). The DNA quality was detected by 1% agarose gel electrophoresis. The concentration and purity of DNA were determined using Thermo’s ultra-micro ultraviolet visible photometer (Nanodrop one, wavelength accuracy 1 nm). The extraction was stored at −20 °C (c ≥ 20.0 ng/μL).
The total genomic DNA was then amplified through PCR to mark rbcL and cox1. Based on a modified method of Freshwater et al. [13,22], sequences of the rbcL gene were amplified using the combined start primer F645/R-rbcS, and that of the cox1 gene was coxI43F/coxI1549R [23,24]. The PCR specification was 25 μL: 2× Rapid Tag Master Mix (12.5 μL); upstream and downstream primer (each 1 μL); total DNA (2 μL); and ddH2O (8.5) μL. Amplification conditions for both rbcL and cox1 consisted of 4 min at 94 °C for denaturation followed by 30 cycles of 60 s at 94 °C, 60 s at 55 °C, and 90 s at 72 °C with a final 5 min extension cycle at 72 °C, and then kept at 4 °C. The amplification reactions were performed using a Takara TP350 PCR thermal cycler. The PCR products were sent to BGl Genomics Co., Ltd. (Shenzhen City, China) for sequencing.

2.3. Data Analysis

Multiple sequence alignments and editing were performed using the Clastal W algorithm in MEGA 11 [25]. The K2P method (Kimura-2 Parameter) was selected to calculate genetic distances [26]. Genetic diversity indices (Fst) were calculated using DnaSP v5 [27]. Using P. caerulescens as an outgroup (rbcL sequence GenBank: OL809925.1; and cox1 sequence GenBank: OL809698.1), a phylogenetic tree was constructed through Maximum Likelihood. The Hasegawa–Kishino–Yano (HKY) model [28] was selected as the optimal model and then we constructed the samples’ haplotype phylogenetic tree using the Maximum Likelihood method. A haplotype network diagram was constructed through PopART 1.7 [29]. Molecular variance analysis (AMOVA) was performed using Arlequin v3.5.2.2 [30].

3. Results

3.1. Molecular Data

In total, 161 rbcL sequences (838 bp) and 161 cox1 sequences (1395 bp) were generated. The T, C, A, and G contents of rbcL were 30.9%, 17.7%, 30.9%, and 20.5%, respectively. Those of cox1 were 39.9%, 15.1%, 26.3%, and 18.6%, respectively. The length of the sequence after concatenation was 2233 bp, with T, C, A, and G contents of 36.5%, 16.1%, 28.1%, and 19.4%, respectively.

3.2. Genetic Diversity

In all the gene sequences obtained in this study, the variation sites and haplotype diversity of rbcL were much less than those of cox1. In concatenated fragments, variable sites occurred at 54 positions, and 28 sites were parsimoniously informative (Table 2). The haplotype diversity was 0.805 ± 0.023, and nucleotide diversity was 0.00368 ± 0.00023. The average nucleotide difference was 8.22042, and Tajima’s D value was −0.51893 (p > 0.1). The total number of haplotypes was 30. The highest haplotype diversity was found in NZ. The highest nucleotide diversity was observed in both NA and NZ.

3.3. Genetic Profile

The values of genetic distance for all populations ranged from 0.000319 to 0.007647, which showed relatively low genetic distance, not exceeding 0.01. Table 3 and Table 4 present the details of genetic distance and fixation index between the investigated populations, respectively. The genetic distance between NZ and other populations was the highest, followed by CD. The Fst of NZ, CD, and NA was high (>0.5). The average nucleotide difference between the NZ and other populations was observed as the highest, followed by CD.
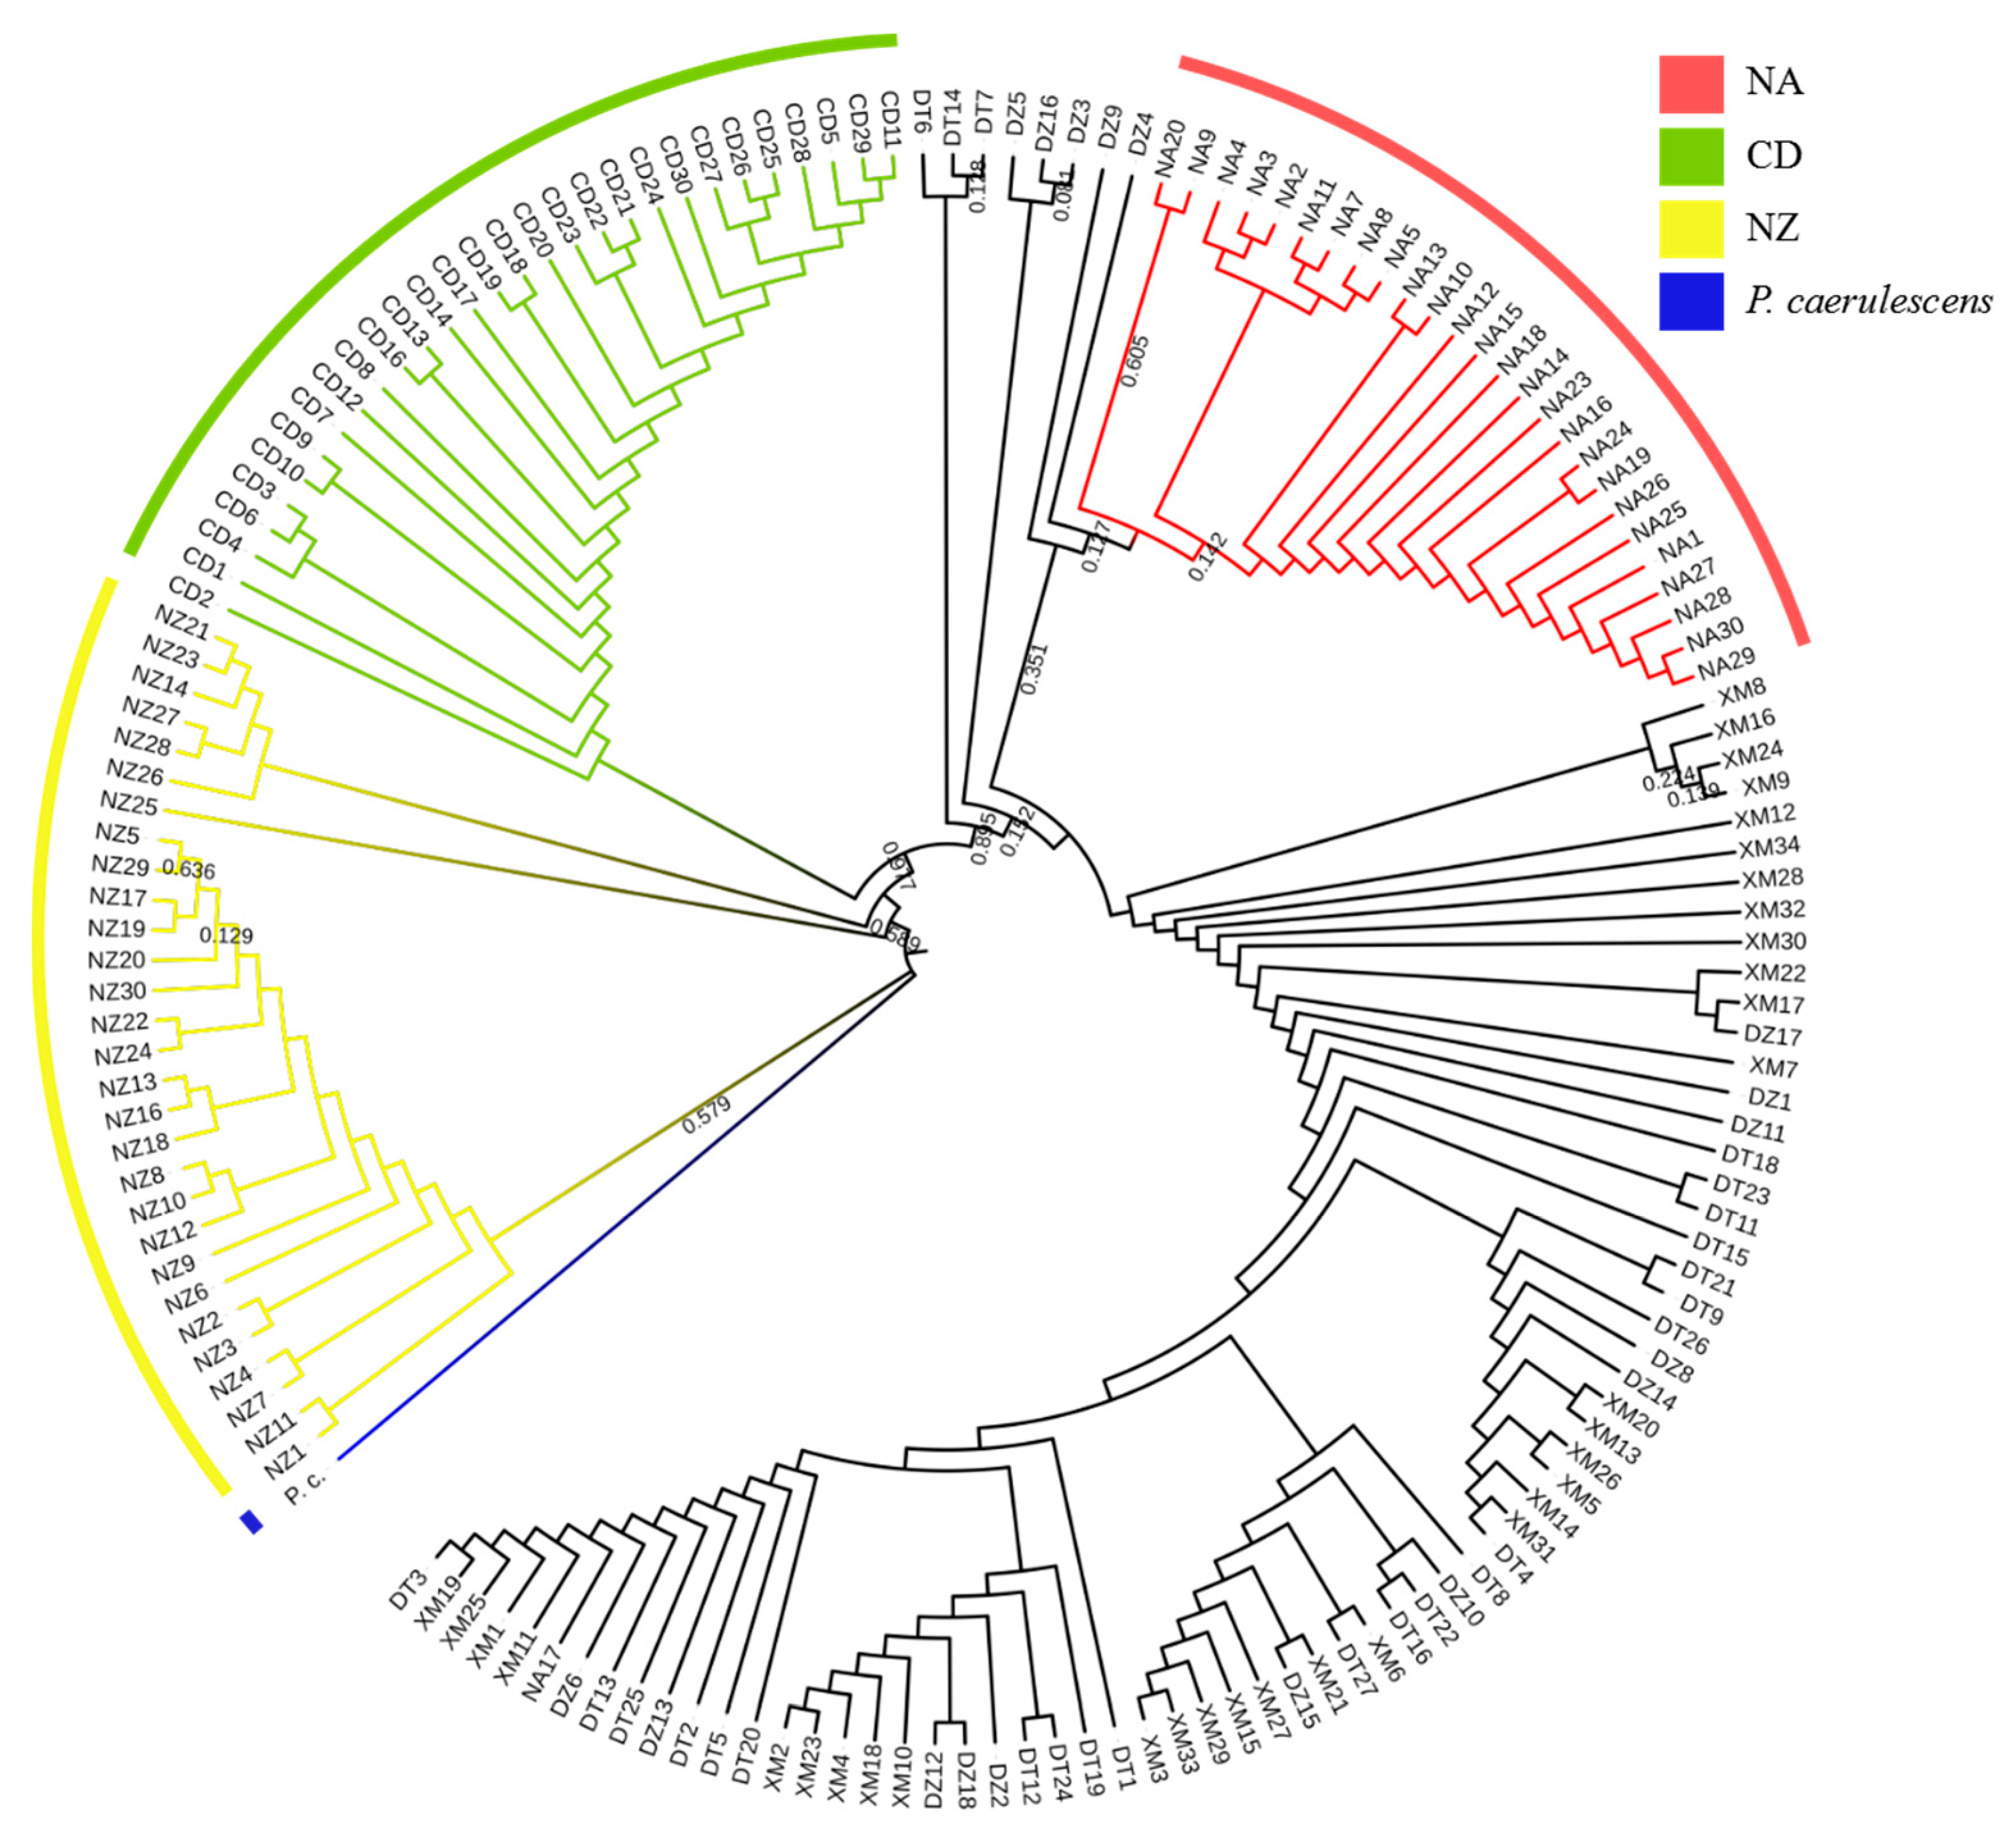
The ML tree based on concatenated rbcL and cox1 gene fragments (Figure 2) showed that NA and CD clustered into one branch, while NZ had a small number of parallel branches, but they were close in genetic distance, and the reliability of the branches was not high, so they were considered the same branch. The sequences of the other populations were closely branched.
The median-joining network (Figure 3) showed four major branches, with the number one core haplotype being Hap_4 and the second core haplotypes being Hap_1, Hap_14, and Hap_17. These four haplotypes accounted for 37.27%, 16.77%, 14.29%, and 9.94% of the total sequence number, respectively. Hap_1, Hap_14, and Hap_17 came from CD, NA, and NZ, respectively, and were not overlapped on the network.
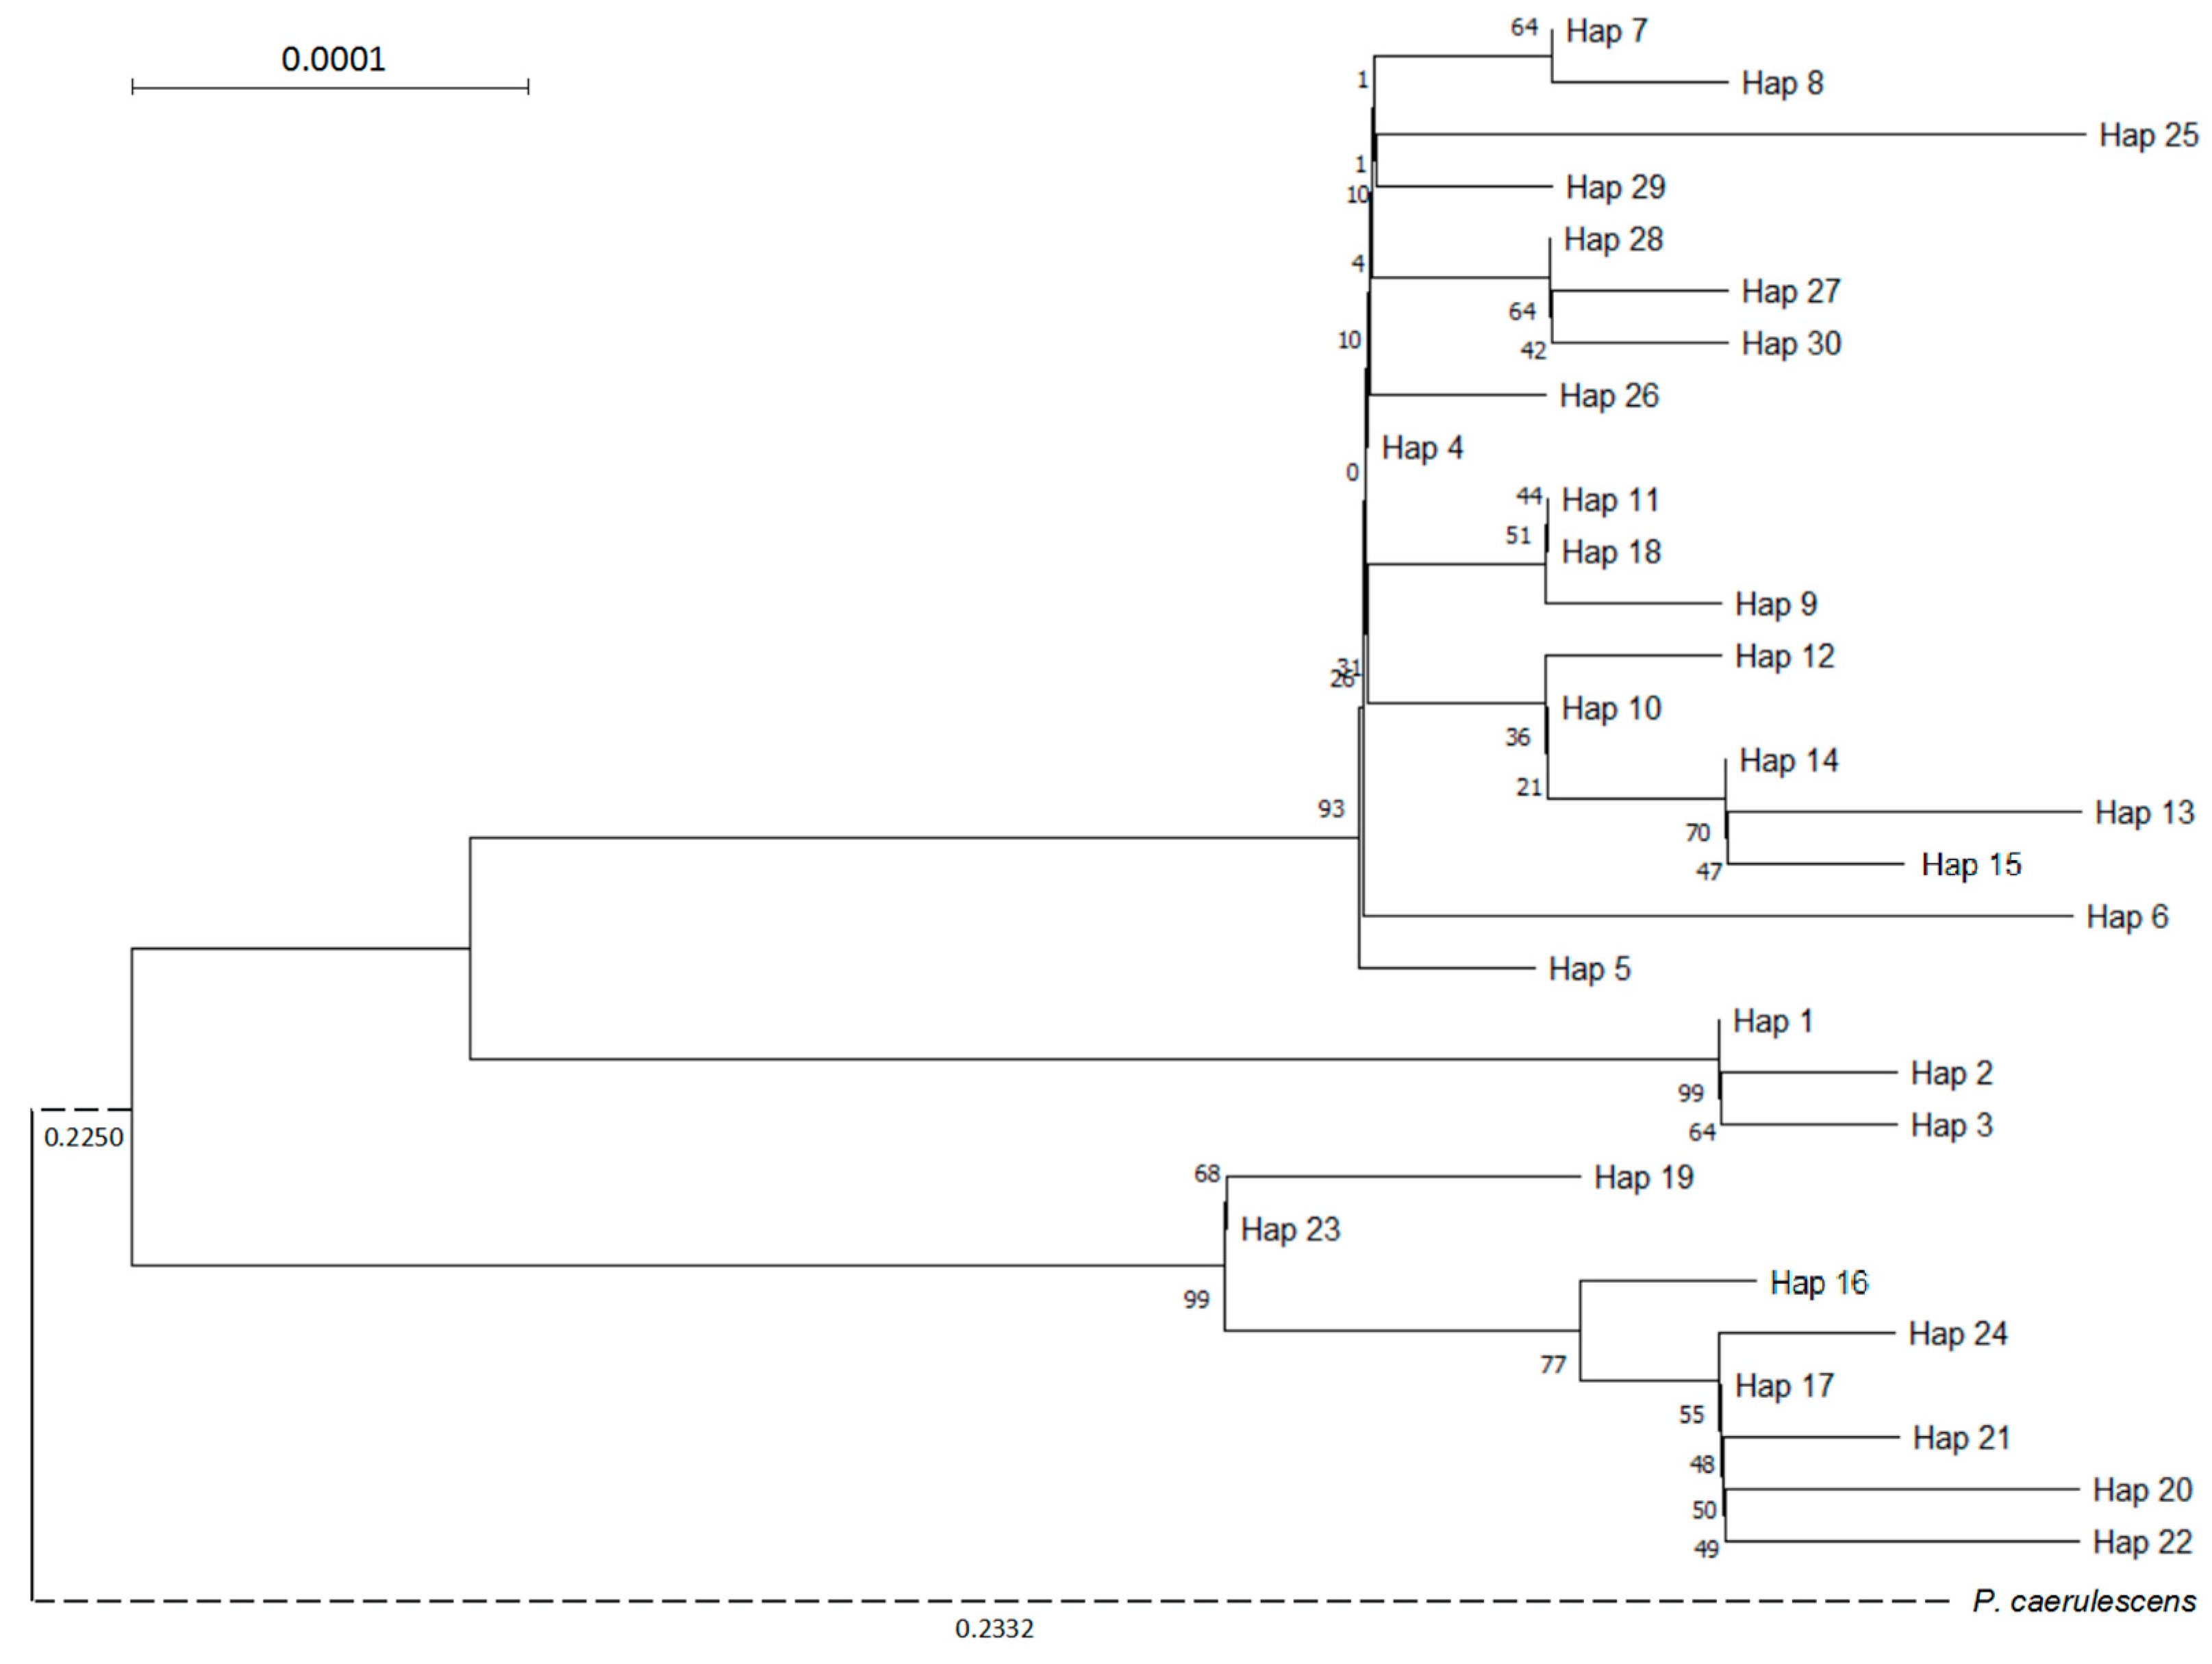
The haplotype ML tree (Figure 4) showed that the haplotypes clustered into four major branches, consistent with the network, but the distances among them were not far.
The AMOVA analysis (Table 5) showed that inter-population gene variation appeared to be a significant source of genetic variation (90.74%, p < 0.001), while intra-population gene variation was inferior (9.26%, p < 0.001). These outcomes are consistent with the above phylogenetic and genetic diversity analysis.

4. Discussion

The calculation of genetic distance and construction of phylogenetic trees solely based on rbcL showed an inability to tell the difference between individuals or populations. In the clustering results based on the cox1 gene, inter-population diversity was pronounced, which effectively distinguished different populations of the same species. The result is consistent with that of Yang et al. [31], demonstrating the higher resolution of cox1. But the number of haplotypes increased when combining this with rbcL sequences. However, only using the cox1 gene cannot thoroughly describe genetic differentiation within a population. Apparently, calculating genetic distance and constructing phylogenetic trees based on concatenated rbcL and cox1 gene fragments together conveyed accurate information on the genetic diversity.
Haplotype diversity and nucleotide diversity are important indicators in determining genetic differentiation and polymorphism for inter-population species and intra-population individuals. The overall haplotype diversity of the six sampled populations was 0.805 ± 0.023, and the nucleotide diversity was 0.00368 ± 0.00023, indicating a high haplotype diversity and low nucleotide diversity. NZ had a total of 28 valid sequences, with eight haplotypes detected, accounting for 26.67% of the total haplotypes. Its haplotype diversity and nucleotide diversity reached the highest among all populations. The genetic diversity of HA, NA, and NZ was slightly high compared to other populations. Similarly, Kong et al. [32] analyzed Gelidium amansii by AFLP, showing lower genetic polymorphism of the population from the Shilaoren sea area in the north nearby Xiaomai island. Thus, we can see that order Gelidiales showed much lower genetic diversity.
Genetic differentiation is addressed by two indexes, Dxy and Fst: the former indicates the proportion of genetic differentiation between populations (inter-population) and within a population (intra-population), and the latter conveys the distinction of a gene that makes the population stand out compared to other populations. In the current study, the genetic distance (Dxy) among all populations did not exceed 0.01, showing a low degree of genetic differentiation; in other words, a small proportion of genetic differentiation took place. The highest genetic distance occurred between CD and NZ, with a Dxy value of 0.0076. Noticeably, the Fst values of CD, NA, and NZ were relatively high, indicating the existence of distinctive genes between these three populations, which are probably due to geographical barriers between these populations. And the lower Fst values between the rest of the populations serves as a signal that gene flow happened quite often between them. The ML tree mainly presents three major branches, which are consistent with the above results and the haplotype network. The remaining populations of XM, DT, and HA were difficult to distinguish and can be considered the same large population. However, correlation or association between genetic differentiation and geographical distribution was not clearly shown. With the Tajima test, the six populations of this investigation all showed negative results, which indicates population expansion, negative selection, a decrease in gene flow between populations, random drift, and so on. Considering the actual situation, it is possible that the degradation of wild P. capillace resources, fragmented population distribution, and random drift may all be reasons.
Genetic diversity is an important aspect of biodiversity, a raw material for natural selection, and a fundamental condition for species to maintain their evolutionary potential [33]. However, overall, the genetic diversity of wild P. capillacea in the Chinese coastal sea was relatively low. A possible explanation could be the geographical barriers from ocean current, over picking, and environmental deterioration. In the long run, it would possibly impact P. capillacea germplasm resources, so would not be conducive to the Chinese coastal ocean ecosystem and economic utilization.
Naozhou island is located in western Guangdong Province and has abundant resources of algae. Of 12 dominant algae species in Naozhou seawater, P. capillacea remarkably grow for the whole year [34]. And this study found a high haplotype diversity in Naozhou P. capillacea. Nan’ao island is nearby Naozhou, but separate from it. The biomass of P. capillacea in the intertidal zone of the main island began to decrease in recent years, and its genetic diversity may be affected by gene drift due to its small population size. A population with low genetic diversity is subject to degradation of germplasm resources and diseases. Therefore, it is necessary to prevent degradation through human hands-on aquacultural activities to stimulate the species’ biomass potential, such as by introducing new varieties of this species from distant sea water like Changdao island in the north, boosting gene flow and sea ecological regeneration. Variety selection and germplasm breeding should be prioritized in order to prevent the degradation of germplasm resources of P. capillacea; further study is needed to strengthen the ecological status of wild P. capillacea.
In conclusion, this study found that the genetic diversity of P. capillacea in Chinese coastal intertidal zones was low, at both inter- and intra-population level, though partly higher gene differentiation and greater haplotype diversity existed. The findings provide warning bells to the Chinese aquacultural industry and coastal ocean ecological concerns to policy makers.

Author Contributions

Conceptualization, W.C.; methodology, J.L.; software, J.L.; validation, J.L.; formal analysis, J.L. and Z.C.; investigation, J.L., Z.C., W.C. and Z.S.; resources, W.C. and Z.S.; data curation, J.L.; writing—original draft preparation, J.L.; writing—review and editing, W.C.; visualization, J.L.; supervision, W.C. and Z.C.; project administration, W.C.; funding acquisition, W.C. All authors have read and agreed to the published version of the manuscript.

Funding

This research was supported by the Southern Marine Science and Engineering Guangdong Laboratory (Zhuhai) (SML2023SP237) and the China Agriculture Research System of Algae (CARS-50).

Institutional Review Board Statement

Not applicable.

Data Availability Statement

The original contributions presented in the study are included in the article, further inquiries can be directed to the corresponding author.

Conflicts of Interest

The authors declare no conflicts of interest. The funders had no role in the design of the study; in the collection, analyses, or interpretation of data; in the writing of the manuscript; or in the decision to publish the results.

References

  1. Xia, B.M. Tomus II Rhodophyta. Part III. Gelidiales Cryptonemiales Hildenbrandiales. In Flora Algarum Marinarum Sinicarum; Science Press: Beijing, China, 2004; pp. 59–81. (In Chinese) [Google Scholar]
  2. Guiry, M.D.; Guiry, G.M.; AlgaeBase. World-Wide Electronic Publication. 2024. Available online: https://www.algaebase.org/ (accessed on 20 March 2024).
  3. Patarra, R.F. Short term effects of irradiance on the growth of Pterocladiella capillacea (Gelidiales, Rhodophyta). Arquipelago. Life Mar. Sci. 2019, 1, 85–94. [Google Scholar] [CrossRef]
  4. Patarra, R.F.; Iha, C.; Pereira, L.; Neto, A.I. Concise review of the species Pterocladiella capillacea (SG Gmelin) Santelices & Hommersand. J. Appl. Phycol. 2020, 32, 787–808. [Google Scholar]
  5. Yang, R.; Liu, B.Q.; Luo, Q.J.; Wang, Y.J.; Zhou, X.C.; Dai, J.X. Genetic variation of Porphyra haitanensis by applying AFLP. Chin. High Technol. Lett. 2002, 1, 83–86, (In Chinese with English Abstract). [Google Scholar]
  6. Xie, C.T.; Ji, D.H.; Chen, C.S.; Xu, Y.; Zhang, Y. Application of ISSR markers in germplasm identification of different color’s Porphyra haitanensis filament strains. J. Fish. China 2007, 1, 105–111, (In Chinese with English Abstract). [Google Scholar]
  7. Xie, C.T.; Ji, D.H.; Chen, C.S.; Xu, Y.; Liu, B. Sequence analysis and application of 5.8S rDNA and ITS regions of Porphyra haitanensis. Chin. High Technol. Lett. 2007, 17, 540–545, (In Chinese with English Abstract). [Google Scholar]
  8. Lim, P.E.; Yang, L.E.; Tan, J.; Maggs, C.A.; Brodie, J. Advancing the taxonomy of economically important red seaweeds (Rhodophyta). Eur. J. Phycol. 2017, 52, 438–451. [Google Scholar] [CrossRef]
  9. Boo, G.H.; Cai, Y.; Boo, S.M. Molecular identification of Gelidioid algae (Gelidiales, Rhodophyta) from Singapore with a description of Gelidium sentosaense sp. nov. Phycologia 2006, 55, 247–256. [Google Scholar] [CrossRef]
  10. Wang, X.L. The Preliminary Analysis of Molecular Phylogeny of Marinerhodophyta and the Taxonomic Study of Gelidiales (Rhodophyta) from China; Chinese Academy of Sciences (Institute of Oceanology): Qingdao, China, 2016. (In Chinese) [Google Scholar]
  11. Wu, X.W.; Wang, T.G.; Liu, Y.; Zhang, P. Genetic diversity of Pyropia haitanensis alongthe southeast coast of China. J. Mar. Sci. 2020, 4, 58–64, (In Chinese with English Abstract). [Google Scholar] [CrossRef]
  12. Wang, X.L.; Yan, S.H.; Wang, Y.Q.; Sun, Z.M.; Xia, B.M.; Wang, G.C. Study of the phylogeny and distribution of Pterocladiella (Pterocladiaceae, Rhodophyta) from China. Phycologia 2020, 59, 165–176. [Google Scholar] [CrossRef]
  13. Freshwater, D.W.; Rueness, J. Phylogenetic relationships of some European Gelidium (Gelidiales, Rhodophyta) species, based on rbcL nucleotide sequence analysis. Phycologia 1994, 33, 187–194. [Google Scholar] [CrossRef]
  14. Shimada, S.; Horiguchi, T.; Masuda, M. Two new species of Gelidium (Rhodophyta, Gelidiales), Gelidium tenuifolium and Gelidium koshikianum, from Japan. Phycol. Res. 2000, 48, 37–46. [Google Scholar] [CrossRef]
  15. Millar, A.J.; Freshwater, D.W. Morphology and molecular phylogeny of the marine algal order Gelidiales (Rhodophyta) from New South Wales, including Lord Howe and Norfolk Islands. Aust. Syst. Bot. 2005, 18, 215–263. [Google Scholar] [CrossRef]
  16. Shimada, S.; Horiguchi, T.; Masuda, M. Phylogenetic affinities of genera Acanthopeltis and Yatabella (Gelidiales, Rhodophyta) inferred from molecular analyses. Phycologia 1999, 38, 528–540. [Google Scholar] [CrossRef]
  17. Tronchin, E.M.; Freshwater, D.W. Four Gelidiales (Rhodophyta) new to southern Africa, Aphanta pachyrrhiza gen. et sp. nov., Gelidium profundum sp. nov., Pterocladiella caerulescens and P. psammophila sp. nov. Phycologia 2007, 46, 325–348. [Google Scholar] [CrossRef]
  18. Thomas, D.T.; Freshwater, D.W. Studies of Costa Rican Gelidiales (Rhodophyta): Four Caribbean taxa including Pterocladiella beachii sp. nov. Phycologia 2001, 40, 340–350. [Google Scholar] [CrossRef]
  19. Freshwater, D.W.; Tudor, K.; O’shaughnessy, K.; Wysor, B. DNA barcoding in the red algal order Gelidiales: Comparison of COI with rbcL and verification of the “barcoding gap”. Cryptogam. Algol. 2010, 31, 435. [Google Scholar]
  20. Iha, C.; Milstein, D.; Guimaraes, S.M.; Freshwater, D.W.; Oliveria, M.C. DNA barcoding reveals high diversity in the Gelidiales of the Brazilian southeast coast. Bot. Mar. 2015, 58, 295–305. [Google Scholar] [CrossRef]
  21. Iha, C.; Jamas, M.; Guimaraes, S.M.; Fuji, M.T.; Freshwater, D.W.; Oliveria, M.C. Pterocladiella (Gelidiales, Rhodophyta) species of Brazil including morphological studies of Pterocladiella media and a reassessment of Pterocladiella taylorii. Phycologia 2017, 56, 624–637. [Google Scholar] [CrossRef]
  22. Lin, S.M.; Fredericq, S.; Hommersand, M.H. Systematics of the Delesseriaceae (Ceramiales, Rhodophyta) based on large subunit rDNA and rbcL sequences, including the Phycodryoideae, subfam. nov. J. Phycol. 2001, 37, 881–899. [Google Scholar] [CrossRef]
  23. Geraldino, P.J.L.; Yang, E.C.; Boo, S.M. Morphology and molecular phylogeny of Hypnea flexicaulis (Gigartinales, Rhodophyta) from Korea. Algae 2006, 21, 417–423. [Google Scholar] [CrossRef]
  24. Boo, G.H.; Park, J.K.; Boo, S.M. Gelidiophycus (Gelidiales, Rhodophyta): A new genus of marine algae from East Asia. Taxon 2013, 62, 1105–1116. [Google Scholar] [CrossRef]
  25. Tamura, K.; Stecher, G.; Kumar, S. MEGA11: Molecular evolutionary genetics analysis version 11. Mol. Biol. Evol. 2021, 38, 3022–3027. [Google Scholar] [CrossRef] [PubMed]
  26. Kimura, M. A simple method for estimating evolutionary rates of base substitutions through comparative studies of nucleotide sequences. J. Mol. Evol. 1980, 16, 111–120. [Google Scholar] [CrossRef] [PubMed]
  27. Librado, P.; Rozas, J. DnaSP v5: A software for comprehensive analysis of DNA polymorphism data. Bioinformatics 2009, 25, 1451–1452. [Google Scholar] [CrossRef]
  28. Hasegawa, M.; Kishino, H.; Yano, T.A. Dating of the human-ape splitting by a molecular clock of mitochondrial DNA. J. Mol. Evol. 1985, 22, 160–174. [Google Scholar] [CrossRef]
  29. Leigh, J.W.; Bryant, D. POPART: Ful-feature software for haplotype network construction. Methods Ecol. 2015, 6, 1110–1116. [Google Scholar] [CrossRef]
  30. Excoffier, L.; Lischer, H.E. Arlequin suite ver 3.5: A new series of programs to perform population genetics analyses under Linux and Windows. Mol. Ecol. Resour. 2010, 10, 564–567. [Google Scholar] [CrossRef]
  31. Yang, E.C.; Kim, M.S.; Geraldino, P.J.L.; Sahoo, D.; Shin, J.A.; Boo, S.M. Mitochondrial cox1 and plastid rbcL genes of Gracilaria vermiculophylla (Gracilariaceae, Rhodophyta). J. Appl. Phycol. 2008, 20, 161–168. [Google Scholar] [CrossRef]
  32. Kong, F.; Mao, Y.; Gao, Z.; Wang, L.; Sun, P.; Shi, X. Genetic Polymorphic Analysis from the Shilaoren Sea Area of Qingdao. Period. Ocean Univ. China 2010, 40, 75–78. [Google Scholar]
  33. Shi, L.M. Genetic diversity and its preservation. Bio. Sci. Inf. 1993, 2, 159–164. (In Chinese) [Google Scholar]
  34. Zhang, C.X.; Zhou, W.N.; Sun, S.L.; Song, Z.G. Seasonal succession of macroalgae community in Naozhou Island. J. Trop. Oceanogr. 2020, 1, 74–84, (In Chinese with English Abstract). [Google Scholar]
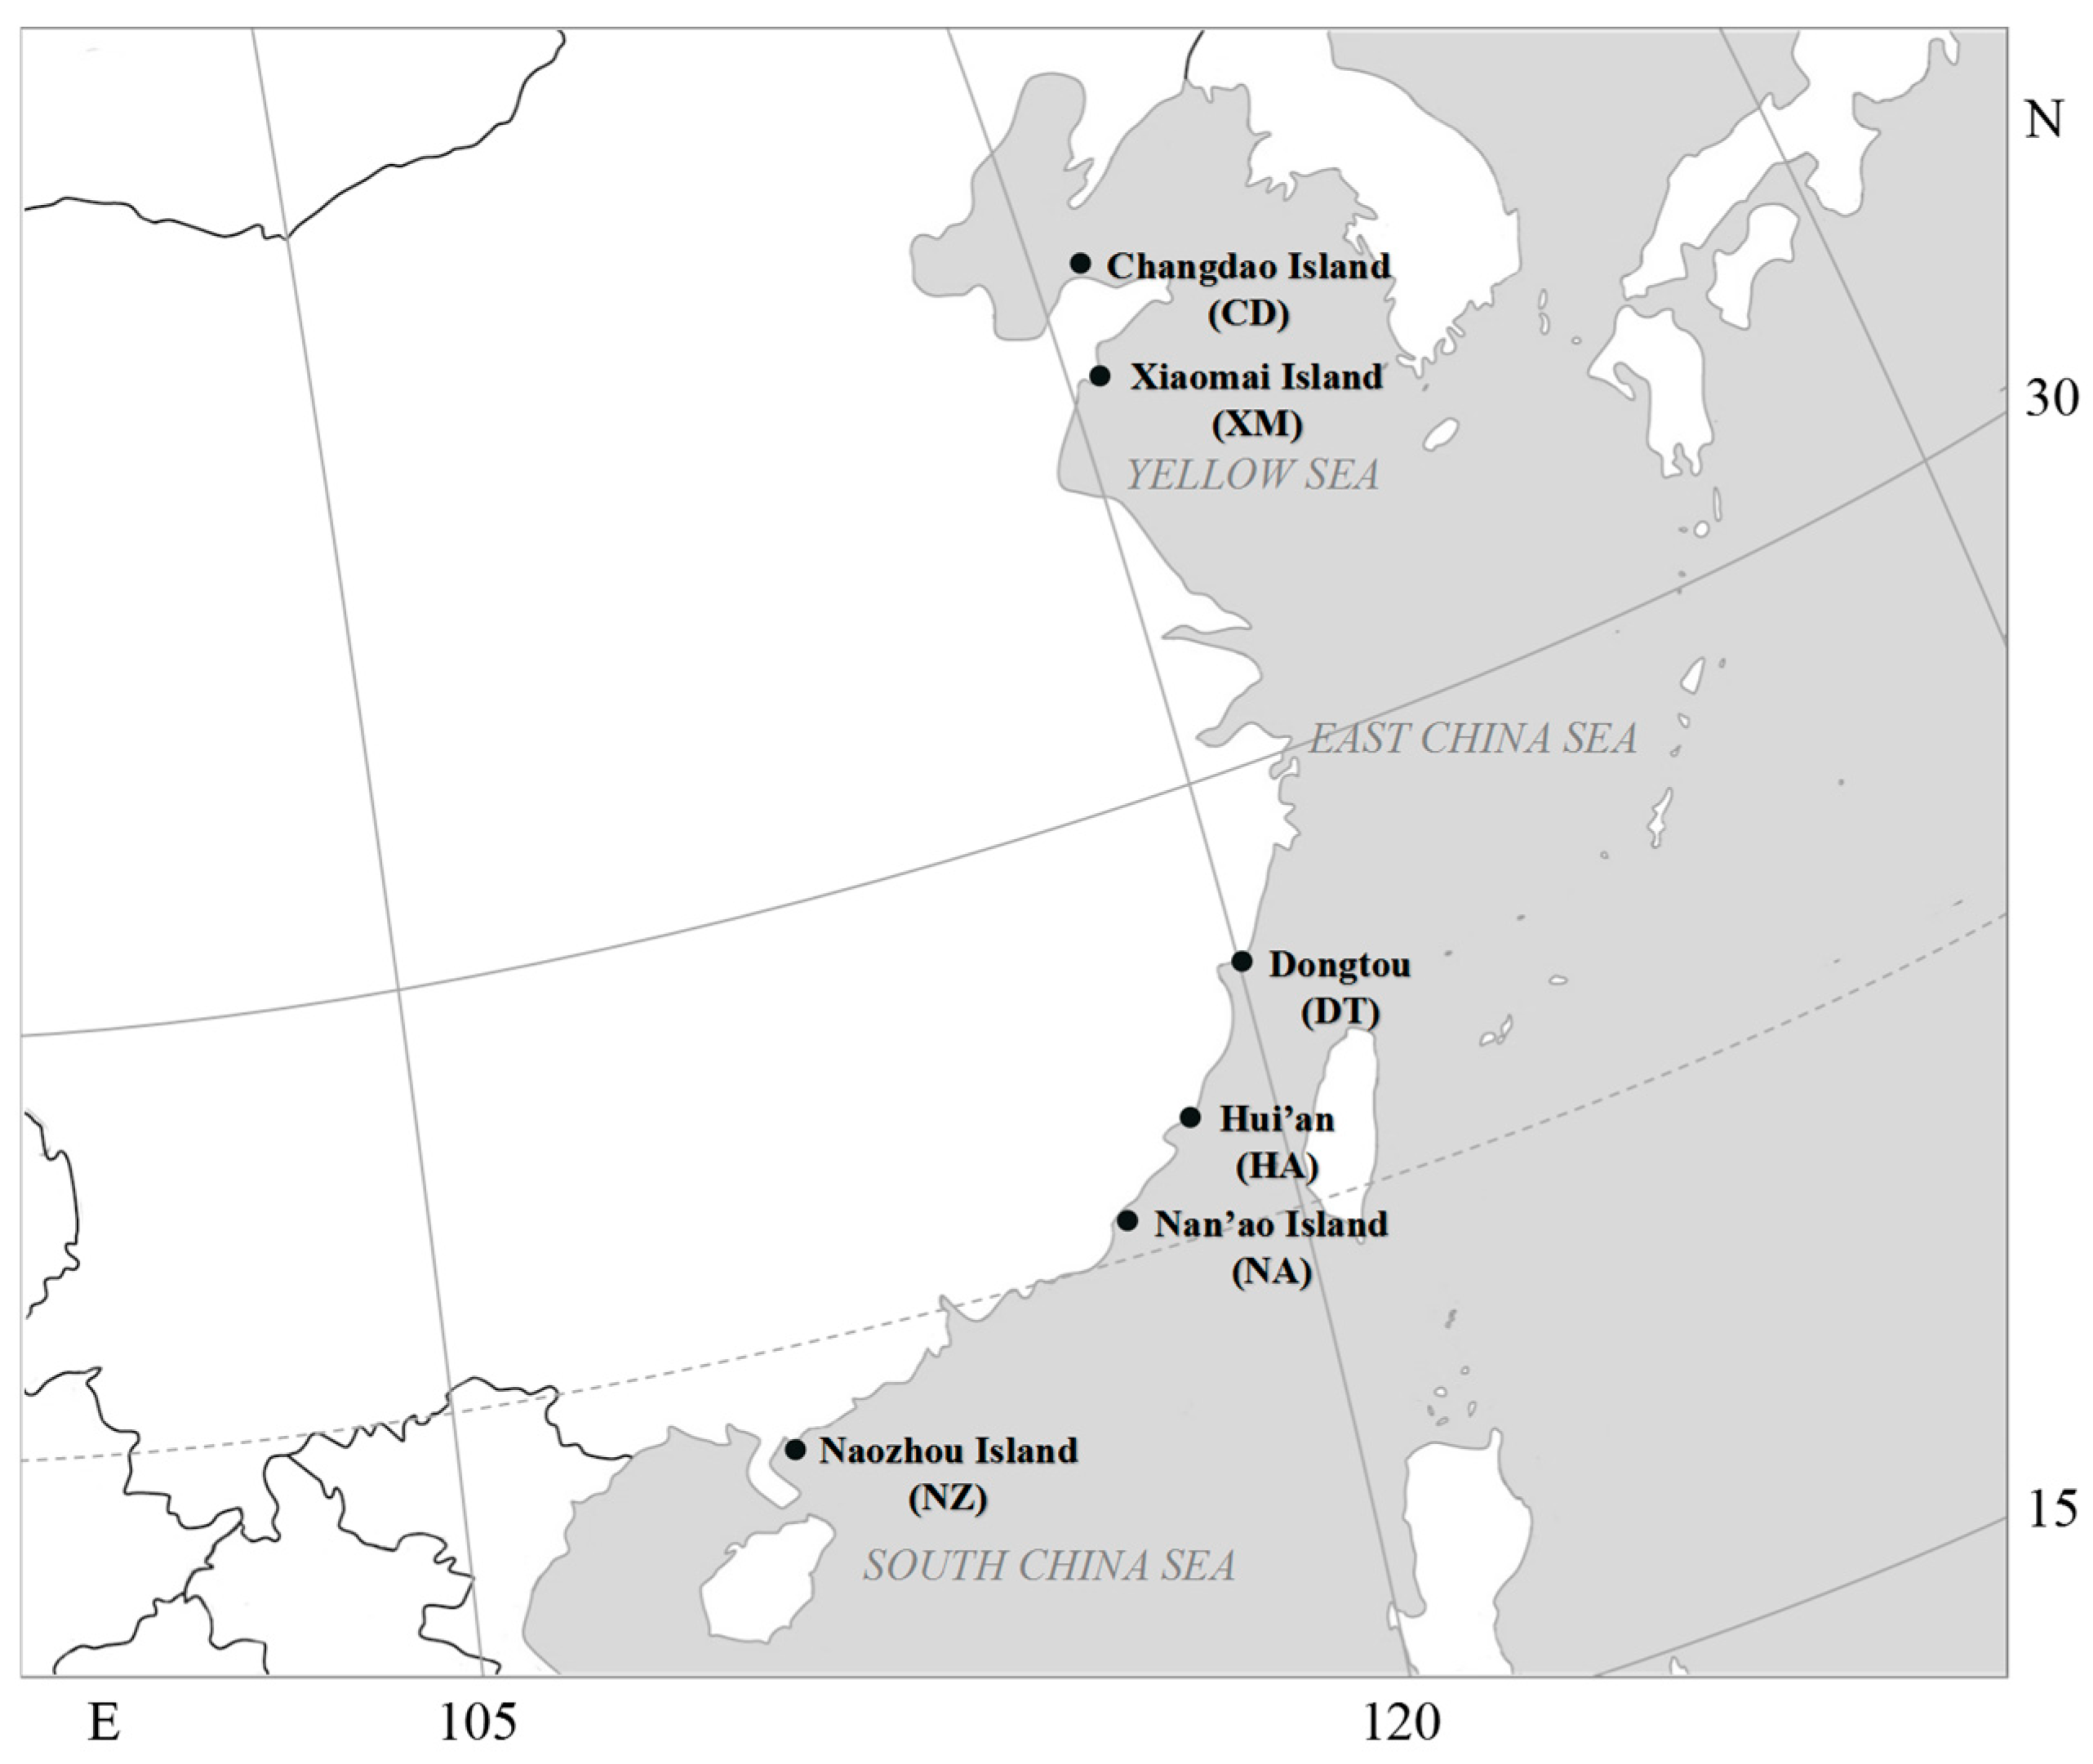
Figure 1. Sampling diagram (the diagram was modified according to the Ministry of Natural Resources of the People’s Republic of China, 2019).
Diversity 16 00389 g001
Figure 2. Maximum Likelihood Tree of P. capillacea based on 161 concatenated rbcL and cox1 gene fragments (bootstrap > 0.1).
Diversity 16 00389 g002
Figure 3. Median-joining network showing haplotype relationships based on concatenated rbcL and cox1 gene fragments (each circle represents a haplotype, the area of the circle is proportional to the frequency of the haplotype, and the black dot represents the hypothetical intermediate haplotype).
Diversity 16 00389 g003
Figure 4. Maximum Likelihood Tree of 30 haplotypes based on concatenated rbcL and cox1 gene fragments.
Diversity 16 00389 g004
Table 1. Information of P. capillace samples.
Sampling LocationCodeLongitude (E)Latitude (N)Quantity
Shandong ProvinceChangdao IslandCD120°44′41″37°57′3″29
Xiaomai IslandXM120°25′8″36°3′54″34
Zhejiang ProvinceDongtouDT121°9′2″27°41′57″25
Fujian ProvinceHui’anHA118°59′30″24°52′53″17
Guangdong ProvinceNan’ao IslandNA117°6′37″23°28′54″28
Naozhou IslandNZ110°34′6″20°53′31″28
Total 161
Table 2. Indices of 7 P. capillacea populations based on concatenated rbcL and cox1 gene fragments.
PopulationQuantityNhHdNsvNpiPikTajima’s D
CD2930.135 ± 0.085200.00006 ± 0.000040.138−1.50906, p > 0.10
XM3470.373 ± 0.105910.00031 ± 0.000120.684−2.08287, p < 0.05
DT2550.363 ± 0.120610.00031 ± 0.000230.700−1.92457, p < 0.05
HA1750.507 ± 0.140320.00033 ± 0.000110.735−0.48541, p > 0.10
NA2850.328 ± 0.1121630.00070 ± 0.000461.556−2.39364, p < 0.01
NZ2880.643 ± 0.088930.00070 ± 0.000141.558−1.63850, 0.10 > p > 0.05
Total161300.805 ± 0.02326280.00368 ± 0.000238.22042−0.51893, p > 0.1
Note: Number of haplotypes (Nh), haplotype diversity (Hd), number of singleton variable sites (Nsv), number of parsimony informative sites (Npi), nucleotide diversity (Pi), average number of nucleotide difference (k), fixation index (Fst), and Tajima’s D.
Table 3. Genetic distance (Dxy) based on concatenated rbcL and cox1 gene fragments.
CDXMDTHANANZ
CD
XM0.005591
DT0.0055940.000319
HA0.0056180.0003430.000343
NA0.0055930.0012800.0012830.001159
NZ0.0076470.0068680.0068700.0068950.007407
Table 4. Fixation index (Fst) based on concatenated rbcL and cox1 gene fragments.
CDXMDTHANANZ
CD
XM0.96690
DT0.966290.02903
HA0.965020.071680.06728
NA0.931860.607410.605670.55673
NZ0.950000.926450.925960.925070.90523
Table 5. AMOVA analysis of P. capillacea populations based on concatenated rbcL and cox1 gene fragments.
Source of VariancedfSum of SquaresVariance ComponentsPercentage Variationp
Among populations5588.0904.3989190.74<0.0010
Within populations15569.5430.448679.26<0.0010
Total160657.6344.84757
Disclaimer/Publisher’s Note: The statements, opinions and data contained in all publications are solely those of the individual author(s) and contributor(s) and not of MDPI and/or the editor(s). MDPI and/or the editor(s) disclaim responsibility for any injury to people or property resulting from any ideas, methods, instructions or products referred to in the content.