Article

Invasive Plant Species Demonstrate Enhanced Resource Acquisition Traits Relative to Native Non-Dominant Species but not Compared with Native Dominant Species

by
Yingcan Chen
1,
Yijie Xie
1,
Caihong Wei
1,
Si Liu
1,
Xiaoyue Liang
1,
Jiaen Zhang
1,2 and
Ronghua Li
1,2,*
1
College of Natural Resources and the Environment, South China Agricultural University, Guangzhou 510642, China
2
Key Laboratory of Agro-Environment in the Tropics, Ministry of Agriculture and Rural Affairs, South China Agricultural University, Guangzhou 510642, China
*
Author to whom correspondence should be addressed.
Diversity 2024, 16(6), 317; https://doi.org/10.3390/d16060317
Submission received: 14 April 2024 / Revised: 3 May 2024 / Accepted: 6 May 2024 / Published: 26 May 2024
(This article belongs to the Topic Plant Invasion)

Abstract

:
Invasive plant species are often characterized by superior resource acquisition capabilities compared with native species, contributing to their success in new environments. However, the dominance of these species varies, and not all invasive species become dominant, nor are all native species uniformly vulnerable to competitive exclusion. In this study, we analyzed 19 functional traits across 144 herbaceous plant species in Guangzhou, China. The studied species included 31 invasive dominant species (IDS), 19 invasive non-dominant species (INS), 63 native dominant species (NDS), and 31 native non-dominant species (NNS). Our findings reveal no significant differences in functional traits between IDS and INS, indicating a broad trait similarity within invasive categories. Pronounced similarities between invasive species and NDS suggest an ecological equivalency that facilitates successful integration and competition in new habitats. Notable differences in several key traits—height, leaf thickness, leaf water content, stoichiometry, photosynthetic rate, water use efficiency, and nitrogen use efficiency—indicate a competitive superiority in resource acquisition and utilization for invasive species over NNS. These distinctions are vital for understanding the mechanisms driving the success of invasive species and are crucial for developing strategies to manage their impact on native ecosystems.

1. Introduction

Recent studies reveal that China hosts 933 naturalized plant species [1]. Among these, 403 have been classified as invasive alien plants [2]. The annual direct economic losses attributed to 283 invasive species in China are estimated to surpass USD 2397.39 million, with invasive alien plants responsible for 66.4% of these costs. Previous studies utilizing the Global Naturalized Alien Flora Database have revealed that the highest numbers of alien species are found in Australian states and several regions in North America, England, Japan, and New Zealand, and that 3.9% of the existing global vascular flora have become naturalized worldwide due to human activities [3,4]. Furthermore, studies based on the year of alien species records suggest an anticipated increase of approximately 1200 alien vascular plant species in Asia from 2005 to 2050 [5], indicating an ongoing trend without signs of saturation.
Concerns regarding the impact of alien species have significantly heightened interest in identifying the determinants of invasion success. Consequently, the mechanisms driving alien plant species invasions have emerged as a principal focus within the field of biology. A leading hypothesis posits that alien plant species exhibit greater competitiveness compared with native species [6]. The comparative analysis of trait differences between native and alien plant species has gained prominence in the field of plant invasion ecology [7,8,9,10]. The variance in traits between native and alien species is often considered a key mechanism explaining the successful invasion of plant communities [11]. To elucidate the traits characteristic of invasive plants, numerous case studies have compared these traits of both native and non-invasive exotic species. Despite these efforts, the findings have been inconclusive or contradictory at times, failing to reveal a consistent pattern [8,9,11,12,13,14,15].
Not every alien species becomes dominant, and not all native species are susceptible to being competitively excluded [9]. In the same region, there are many alien invasive species, but their abundance varies significantly, and the same is true for native species. Therefore, if all alien species are grouped together and all native species are also grouped together for trait comparison, the impact of the abundance differences among the species might be overlooked [16,17,18]. For example, a study conducted in the United States highlights that invasive grasses intensify the adverse effects of drought on native annual forbs, particularly impacting resource-acquisitive species more severely than resource-conservative ones by altering demographic rates, such as mortality and seed production [19]. Thus, the results of previous studies on competition between alien and native species may be biased by focusing on a single common alien species and a rare native species. Rigorous tests of competition between alien and native species that include both rare and common species are, thus, crucial to understanding the determinants of invasion success and rarity [20].
When comparing trait differences among species groups, the shared evolutionary history, which leads to non-independence of species data, can affect the outcomes. Recognizing the significant influence of phylogenetic relationships on species traits, many researchers have focused on the comparison of functional traits between specific alien invasive species and their native counterparts within the same genus. Nonetheless, the competition involving alien species typically includes multiple coexisting native species in a particular region. Therefore, it becomes important to evaluate trait differences across a broader spectrum of coexisting alien and native species. Yet, such assessments often overlook the phylogenetic context, omitting a critical factor in understanding trait evolution and species interactions. Phylogenetic ANOVA, which considers phylogenetic relationships among species, is crucial for accurately analyzing trait differences among groups [21]. However, integrating functional trait analyses with phylogenetic distance measures, as recommended by Hulme and Bernard-Verdier [11], is rarely done. This oversight indicates a significant gap in research methodologies, emphasizing the need for more nuanced approaches that include phylogenetic and functional traits for a better understanding of species invasions.
Furthermore, while most studies on functional traits have concentrated on a core set of traits that are straightforward to measure, such as plant height, seed weight, and specific leaf area, these traits do not necessarily predict the success or failure of plant species. A review has shown that the influence of traits on species demographic performance depends on both the abiotic and biotic environment [22]. Therefore, our research was dedicated to quantifying the precise characteristics of plant species by incorporating both easily measurable and physiological traits. Specifically, we focused on leaf stoichiometry, carbon assimilation capacity, and nutrient use efficiency, as these traits directly influence the performance and competitive ability of species [23,24].
Located at the junction of tropical and subtropical zones, Guangzhou boasts a rich diversity of plant species and complex ecosystem types. As the political, economic, and transportation hub of southern China, the city engages extensively in international communication and trade. These factors contribute to the notable richness of invasive plant species in Guangzhou. Field surveys combined with a review of relevant literature indicate that there are 131 invasive plant species in the city, of which 114 are terrestrial herbaceous plants [25]. In this study, we analyzed a dataset comprising 144 herbaceous plant species, including 50 alien and 94 native species, identified as either common or rare in Guangzhou. We constructed a phylogenetic tree to contextualize the evolutionary relationships among the species under investigation. Our analysis focused on 19 functional traits, encompassing both easily measurable and physiological characteristics, to assess potential differences between alien and native species within a phylogenetic framework. We conducted two primary tests: (1) We examined if the functional traits’ differences were associated with commonness and rarity among alien and native species. (2) We assessed how these differences varied when considered within a phylogenetic context.

2. Materials and Methods

2.1. Study Area

Guangzhou is located at the southern tip of mainland China (112°57′ to 114°03′ E, 22°26′ to 23°56′ N), covering an area of 7434.4 square kilometers (Figure 1). The region experiences an average annual temperature ranging between 21.5 °C and 22.2 °C. It boasts abundant water resources, with an average annual precipitation of over 1800 mm and approximately 150 rainy days per year. The area’s complex topography harbors rich plant resources, creating favorable ecological conditions for plant growth. The study area is situated in a large urban setting, where the predominant land uses are divided between construction land and various forms of vegetation. The potential vegetation of the area primarily consists of woodland, farmland, and grassland. The woodland coverage rate in the region is 42.14%, reflecting the richness of plant species and diversity of natural vegetation.
In this study, we analyzed a dataset comprising 144 herbaceous plant species in Guangzhou, which includes 50 alien and 94 native species (Table S1). These species primarily inhabit wastelands, ecosystems characterized by herbaceous vegetation interspersed with occasional shrubs or small trees. Their overlapping distributions suggest potential interactions within their natural habitats. The species were categorized as common or rare according to their frequency of occupancy and levels of local abundance. The categories were determined mainly according to the Guangzhou Invasive Plants [25] and Global Biodiversity Information Facility databases (https://www.gbif.org). Specifically, a species was deemed common if it exhibited widespread presence and local abundance across Guangzhou, and rare if it was neither widespread nor locally abundant. Species categorized under invasion levels 1 and 2 are designated as invasive dominant species, whereas those classified under levels 3, 4, and 5 are termed invasive non-dominant species [25]. In total, the 144 species were categorized into 31 invasive dominant species (IDS), 19 invasive non-dominant species (INS), 63 native dominant species (NDS), and 31 native non-dominant species (NNS).

2.2. Functional Traits Measurements

For each of the 144 species, we measured 3–5 individuals of the invasive and native species. The thousand-seed weight (TSW) data were mainly extracted from the seed information database of Kew (https://ser-sid.org/). Seed mass data were also collected from papers published up to December 2023. For data from these sources, when the authors provided a single-seed mass value for a species, that value was adopted. When multiple values were reported for a species from different sources, we used the mean value. Plant height (H) was measured for five mature plants using a ruler. Three to five leaves per plant were used to determine leaf thickness (LT) using a microcalliper. For leaf area (LA) measurements, 20 fully expanded, sun-exposed leaves from the canopy of three to five individuals per species were measured using a Li-3000A leaf area meter (Li-Cor, Lincoln, NE, USA), after removing petioles and/or rachises. Leaves were weighed to obtain their fresh weight and then oven-dried at 70 °C for 48 h to determine their dry mass. Leaf water content (LWC) was calculated as the ratio of the difference between fresh weight and dry weight to fresh weight. Specific leaf area (SLA) for each specimen was calculated as the ratio of total leaf area to leaf dry mass. Subsequently, the oven-dried leaves were ground into a fine powder for chemical analysis. Nitrogen content (Nmass, mg g−1) was determined by Kjeldahl analysis, while phosphorus content (Pmass, mg g−1) was measured using atomic absorption spectrophotometry. Leaf carbon content (LC) was determined using the external heating method with potassium dichromate. The C:N and N:P ratios were determined by calculating the leaf carbon to nitrogen content ratio and the leaf nitrogen to phosphorus content ratio, respectively. Leaf chlorophyll content was assessed using a SPAD meter (Konica Minolta, Tokyo, Japan) on selected leaves.
To assess light capture strategies, we measured the maximum CO2 assimilation rate per unit area (Aarea, μmol m−2 s−1) and stomatal conductance per unit area (gsa, mol m−2 s−1) using a Li-6400 portable photosynthesis system (Li-Cor, Lincoln, NE, United States) between 9:00 and 11:00 am on sunny days. For each species, 5–10 fully expanded, sun-exposed leaves were measured. The mass-specific CO2 assimilation rate (Amass, μmol g−1 s−1) and stomatal conductance (gs) were calculated using the formulas Amass = SLA × Aarea/10,000 and gs = SLA × gsa/10, respectively.
Photosynthetic nitrogen use efficiency (PNUE, μmol g−1 s−1), photosynthetic phosphorus use efficiency (PPUE, μmol g−1 s−1), and intrinsic water use efficiency (WUEi) were calculated to assess resource utilization efficiency. PNUE was determined as the ratio of Amass to leaf nitrogen content per mass (Nm), PPUE as the ratio of Amass to leaf phosphorus content per mass (Pm), and WUEi as the ratio of Amass to gs. These calculations allow for a comparative analysis of how plants efficiently utilize nitrogen, phosphorus, and water under similar photosynthetic conditions.

2.3. Data Analyses

All data were analyzed in R 4.3.2 [26]. To account for the effects of shared evolutionary history on species traits, we conducted phylogenetically informed statistical analyses. Firstly, we standardized species names via the R package “Taxonstand”, using the Plant List (https://wfoplantlist.org/) as the backbone, to have a taxonomically consistent dataset. Then, the construction of the phylogenetic tree was accomplished using the phylo.maker function within the R package “V.PhyloMaker”, as developed by Jin and Qian [27] (Figure S1). We investigated differences in individual trait values among IDS, INS, NDS, and NNS with a phylogenetic one-way analysis of variance (phylogenetic ANOVA) via the R package “phytools”.
To examine multivariate associations among the traits, we used principal component analysis (PCA). To better adhere to the assumptions of normality and homogeneous variances, we scaled the trait values. Mean factor loading values of the four species groups on the first two axes were also tested by phylogenetic ANOVA, to examine whether the species groups differed significantly along the PCA axes.

3. Results

3.1. Phenotypic and Reproductive Traits

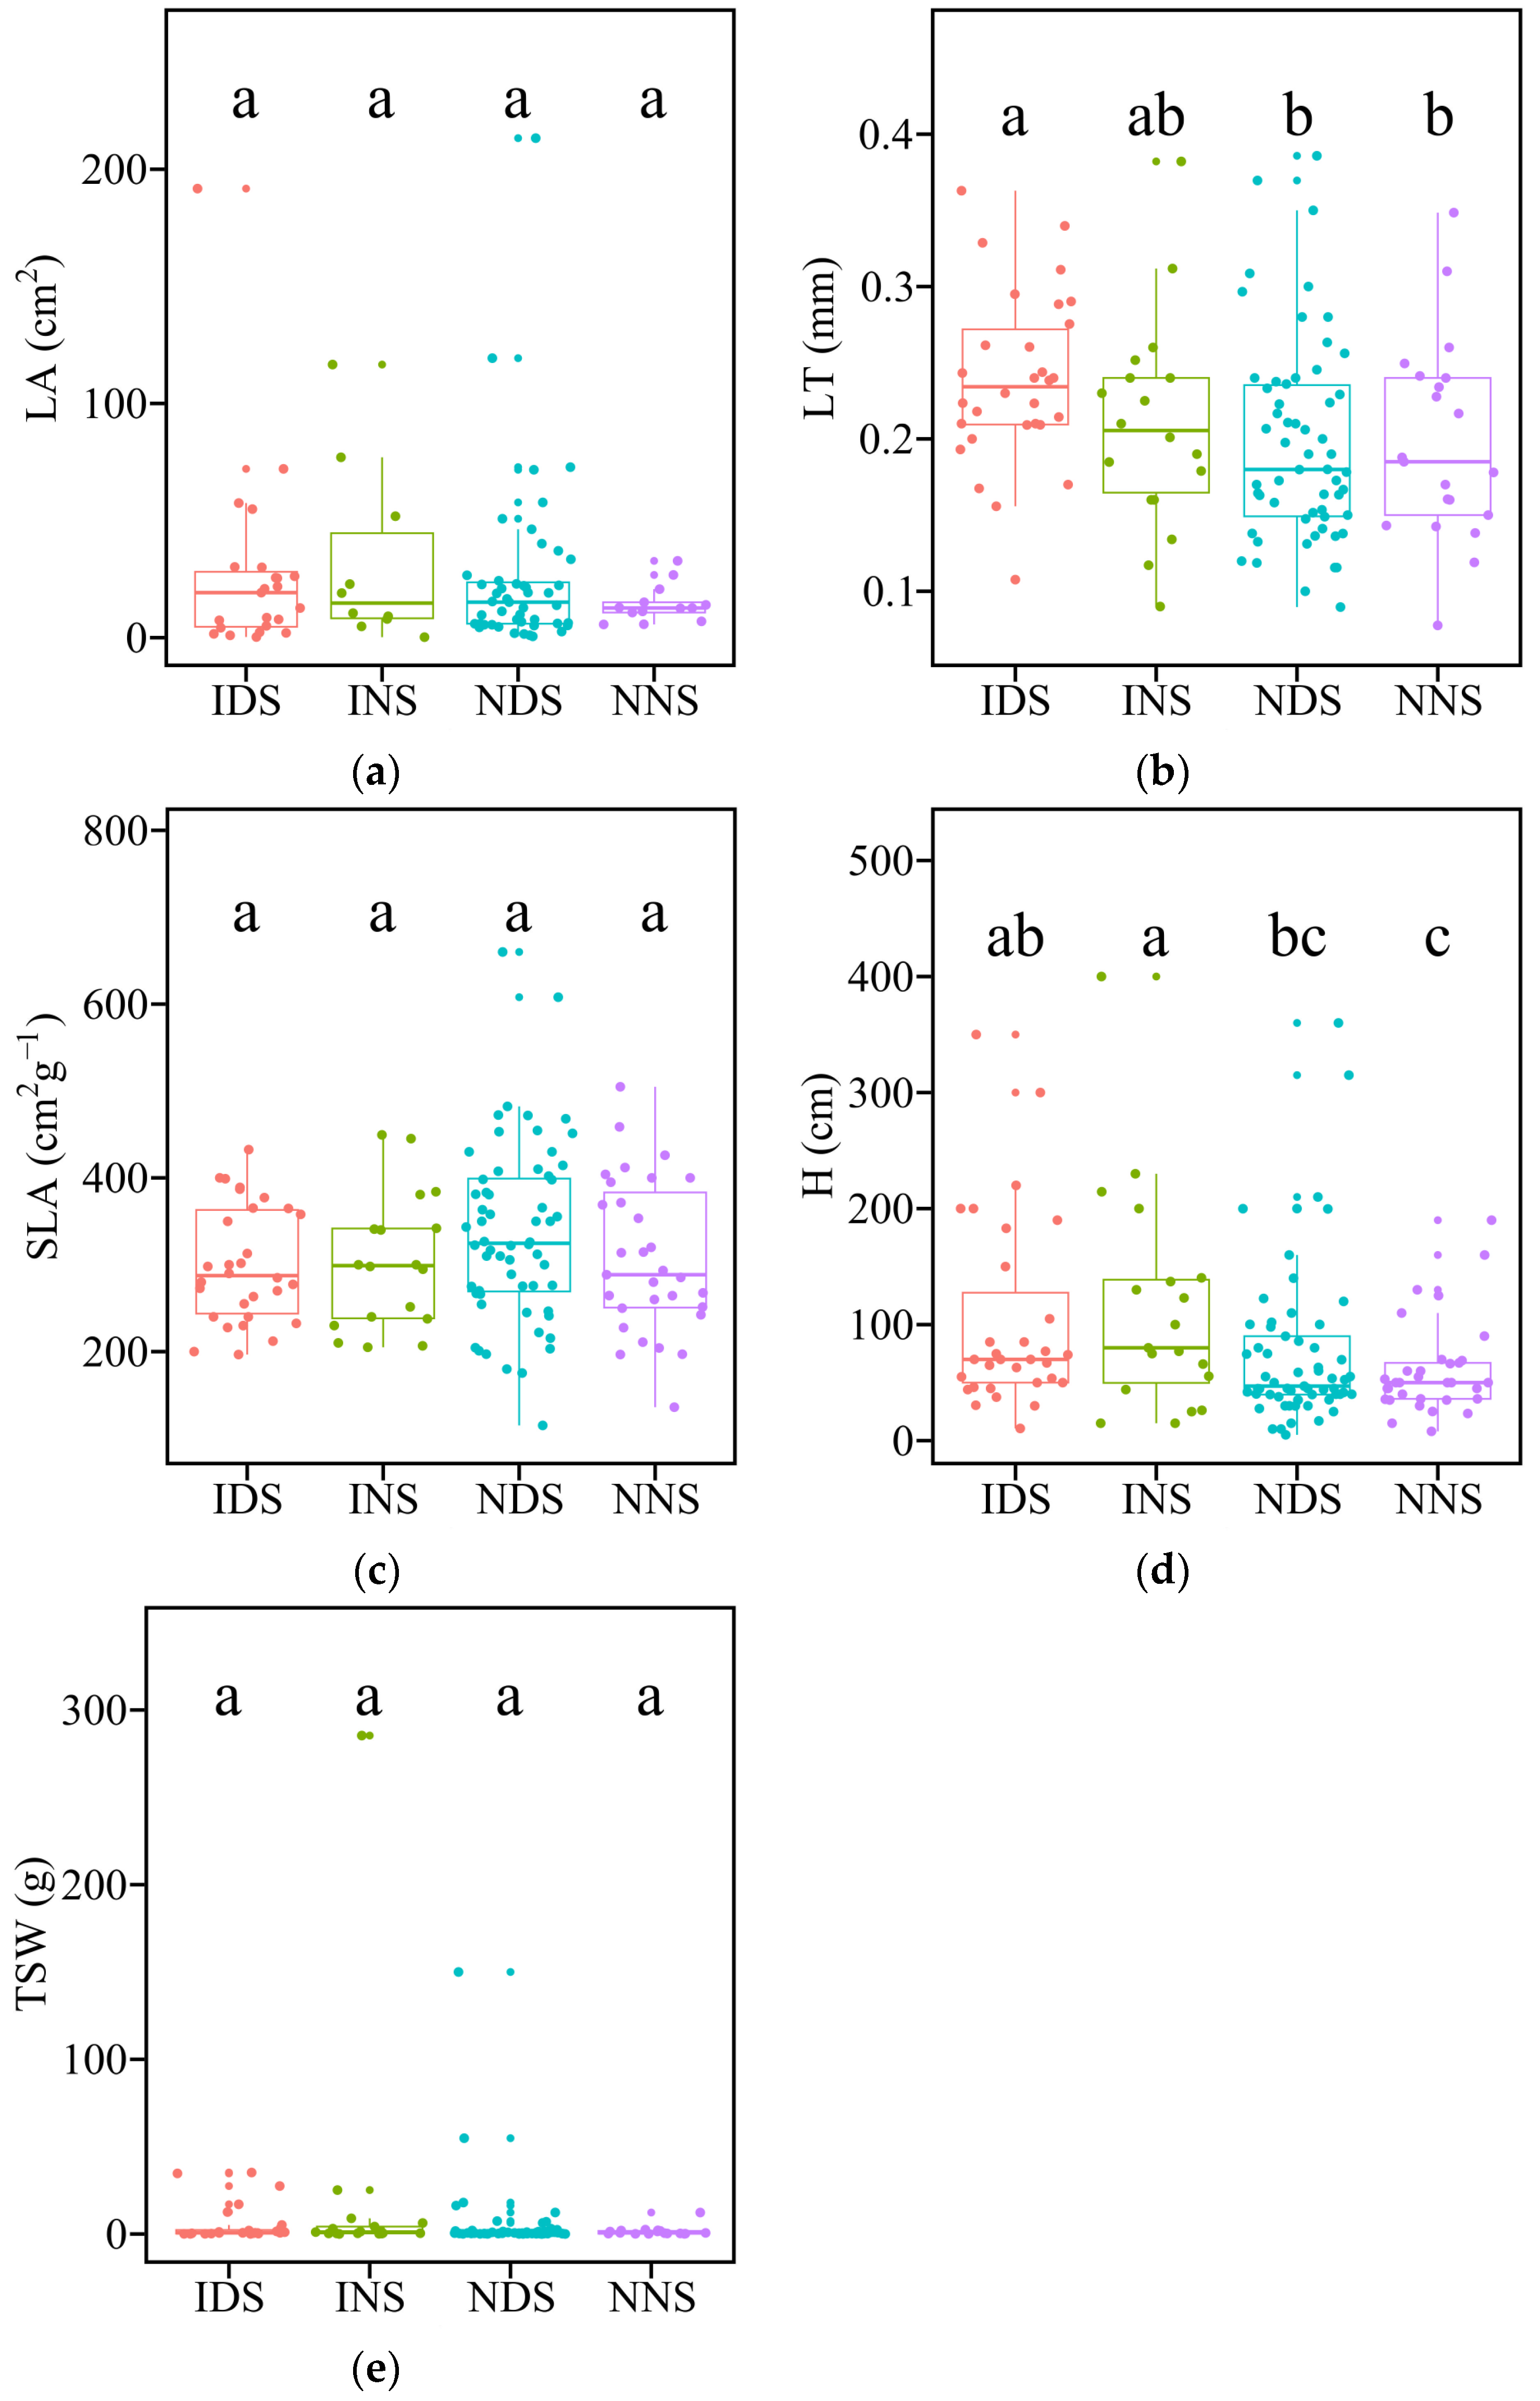
Figure 2 shows phenotypic and reproductive traits among invasive dominant species (IDS), invasive non-dominant species (INS), native dominant species (NDS), and native non-dominant species (NNS). The analysis reveals statistical equivalence in leaf area (LA) across all groups, indicating that neither invasiveness nor dominance status significantly affects LA (Figure 2a). In terms of leaf thickness, IDS did not significantly differ from INS but varied compared with native species; both NDS and NNS exhibited thicker leaves than IDS, with no significant difference from INS (Figure 2b). Furthermore, there was no significant difference in specific leaf area (SLA) among the groups, suggesting that SLA is unaffected by the species’ ecological status or dominance (Figure 2c). Regarding plant height, no differences were observed between IDS and INS, suggesting that invasive species may generally share similar growth heights. However, NNS were significantly shorter than both IDS and INS, and NDS were shorter than INS, suggesting a competitive advantage in height for invasive species (Figure 2d). Finally, no significant difference was noted in thousand-seed weight (TSW) among the groups, indicating that seed weight is not influenced by a species’ invasive or native status, nor by its dominance (Figure 2e).

3.2. Leaf Stoichiometry and Leaf Water Content

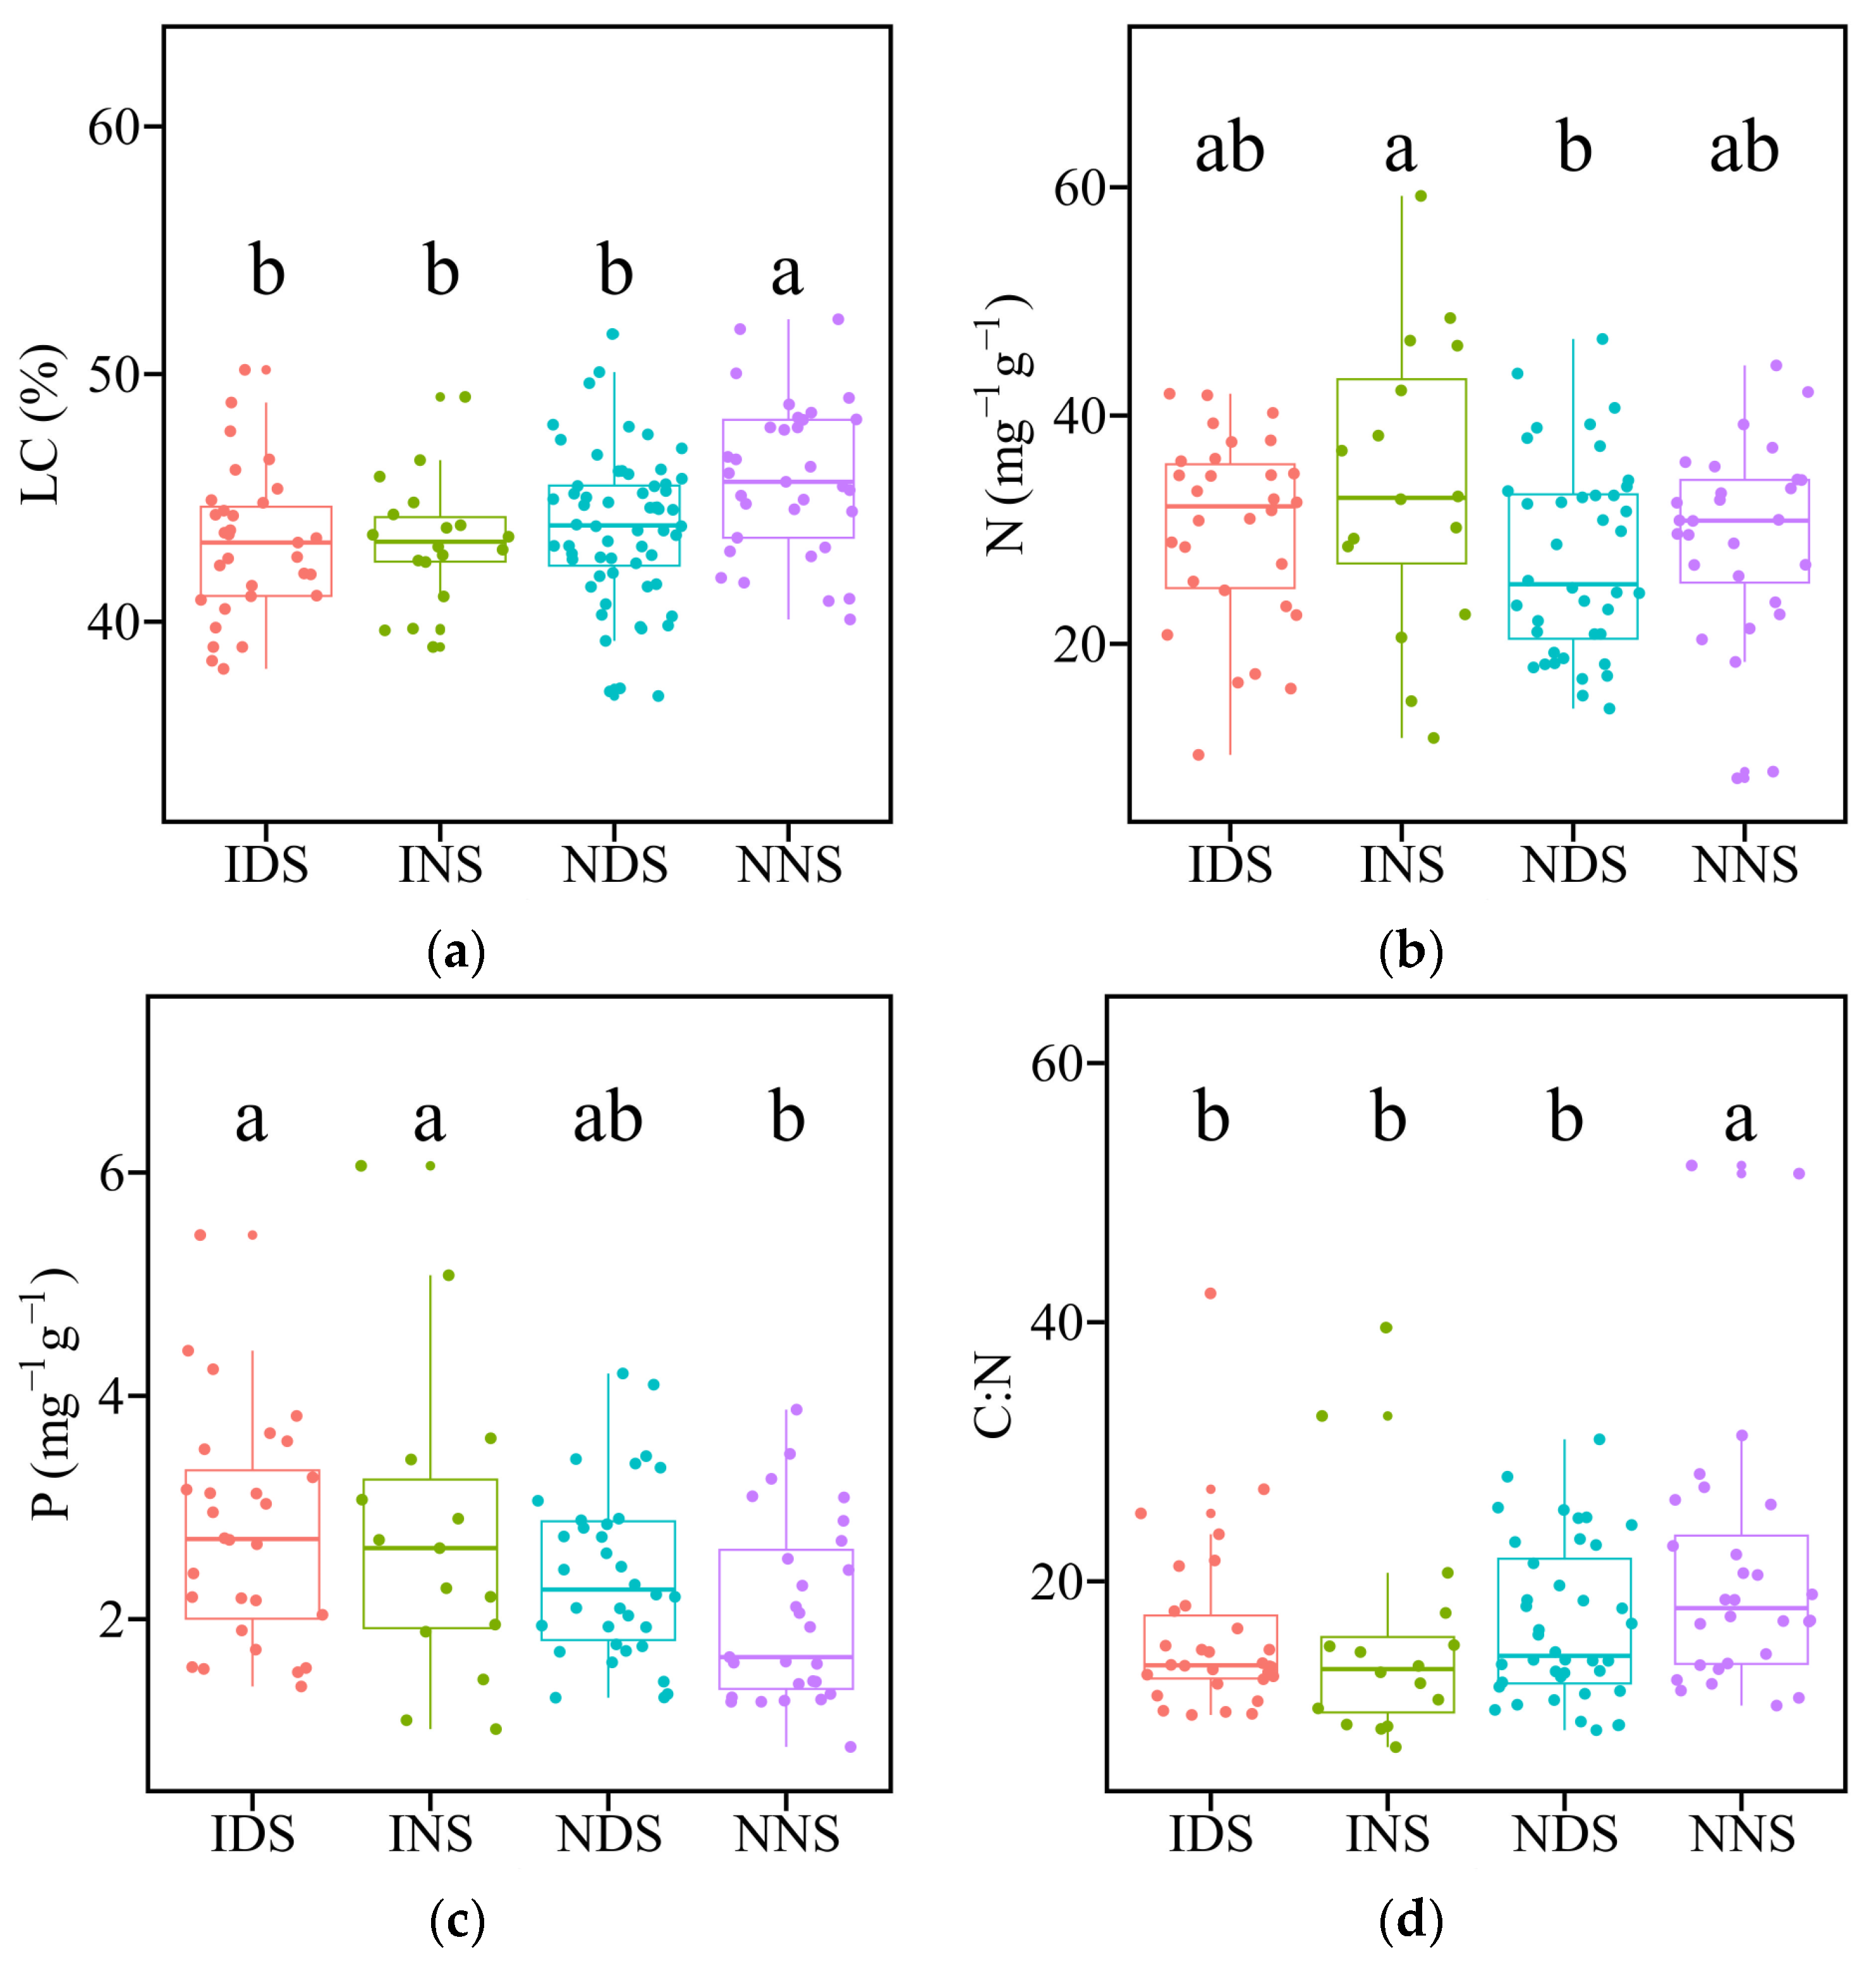
Figure 3 provides a comparative analysis of leaf stoichiometry and water content among the four groups. For leaf carbon content (LC), NNS exhibited significantly higher values than the other groups, while IDS, INS, and NDS showed no significant differences among themselves (Figure 3a). In terms of leaf nitrogen content (N), INS had significantly higher levels compared with NDS. However, there were no significant differences observed between the invasive species and NNS (Figure 3b). As for leaf phosphorus content (P), NNS were significantly lower compared with the invasive species, but not in comparison to NDS. Among IDS, INS, and NDS, no significant differences were noted for leaf phosphorus content (Figure 3c). Regarding the C:N ratio, the NNS group exhibited a markedly higher C:N ratio when compared with the other groups. Conversely, the IDS, INS, and NDS did not show significant disparities in their C:N ratios (Figure 3d). When examining the N:P, NNS showed significantly higher ratios compared with IDS and NDS but not with INS. No significant differences were detected among IDS, INS, and NDS (Figure 3e). For leaf water content (LWC), NNS were found to have a significantly lower LWC than the other groups. Conversely, IDS, INS, and NDS did not show any significant differences in LWC among themselves (Figure 3f).

3.3. Leaf Chlorophyll Content and Photosynthetic Rate

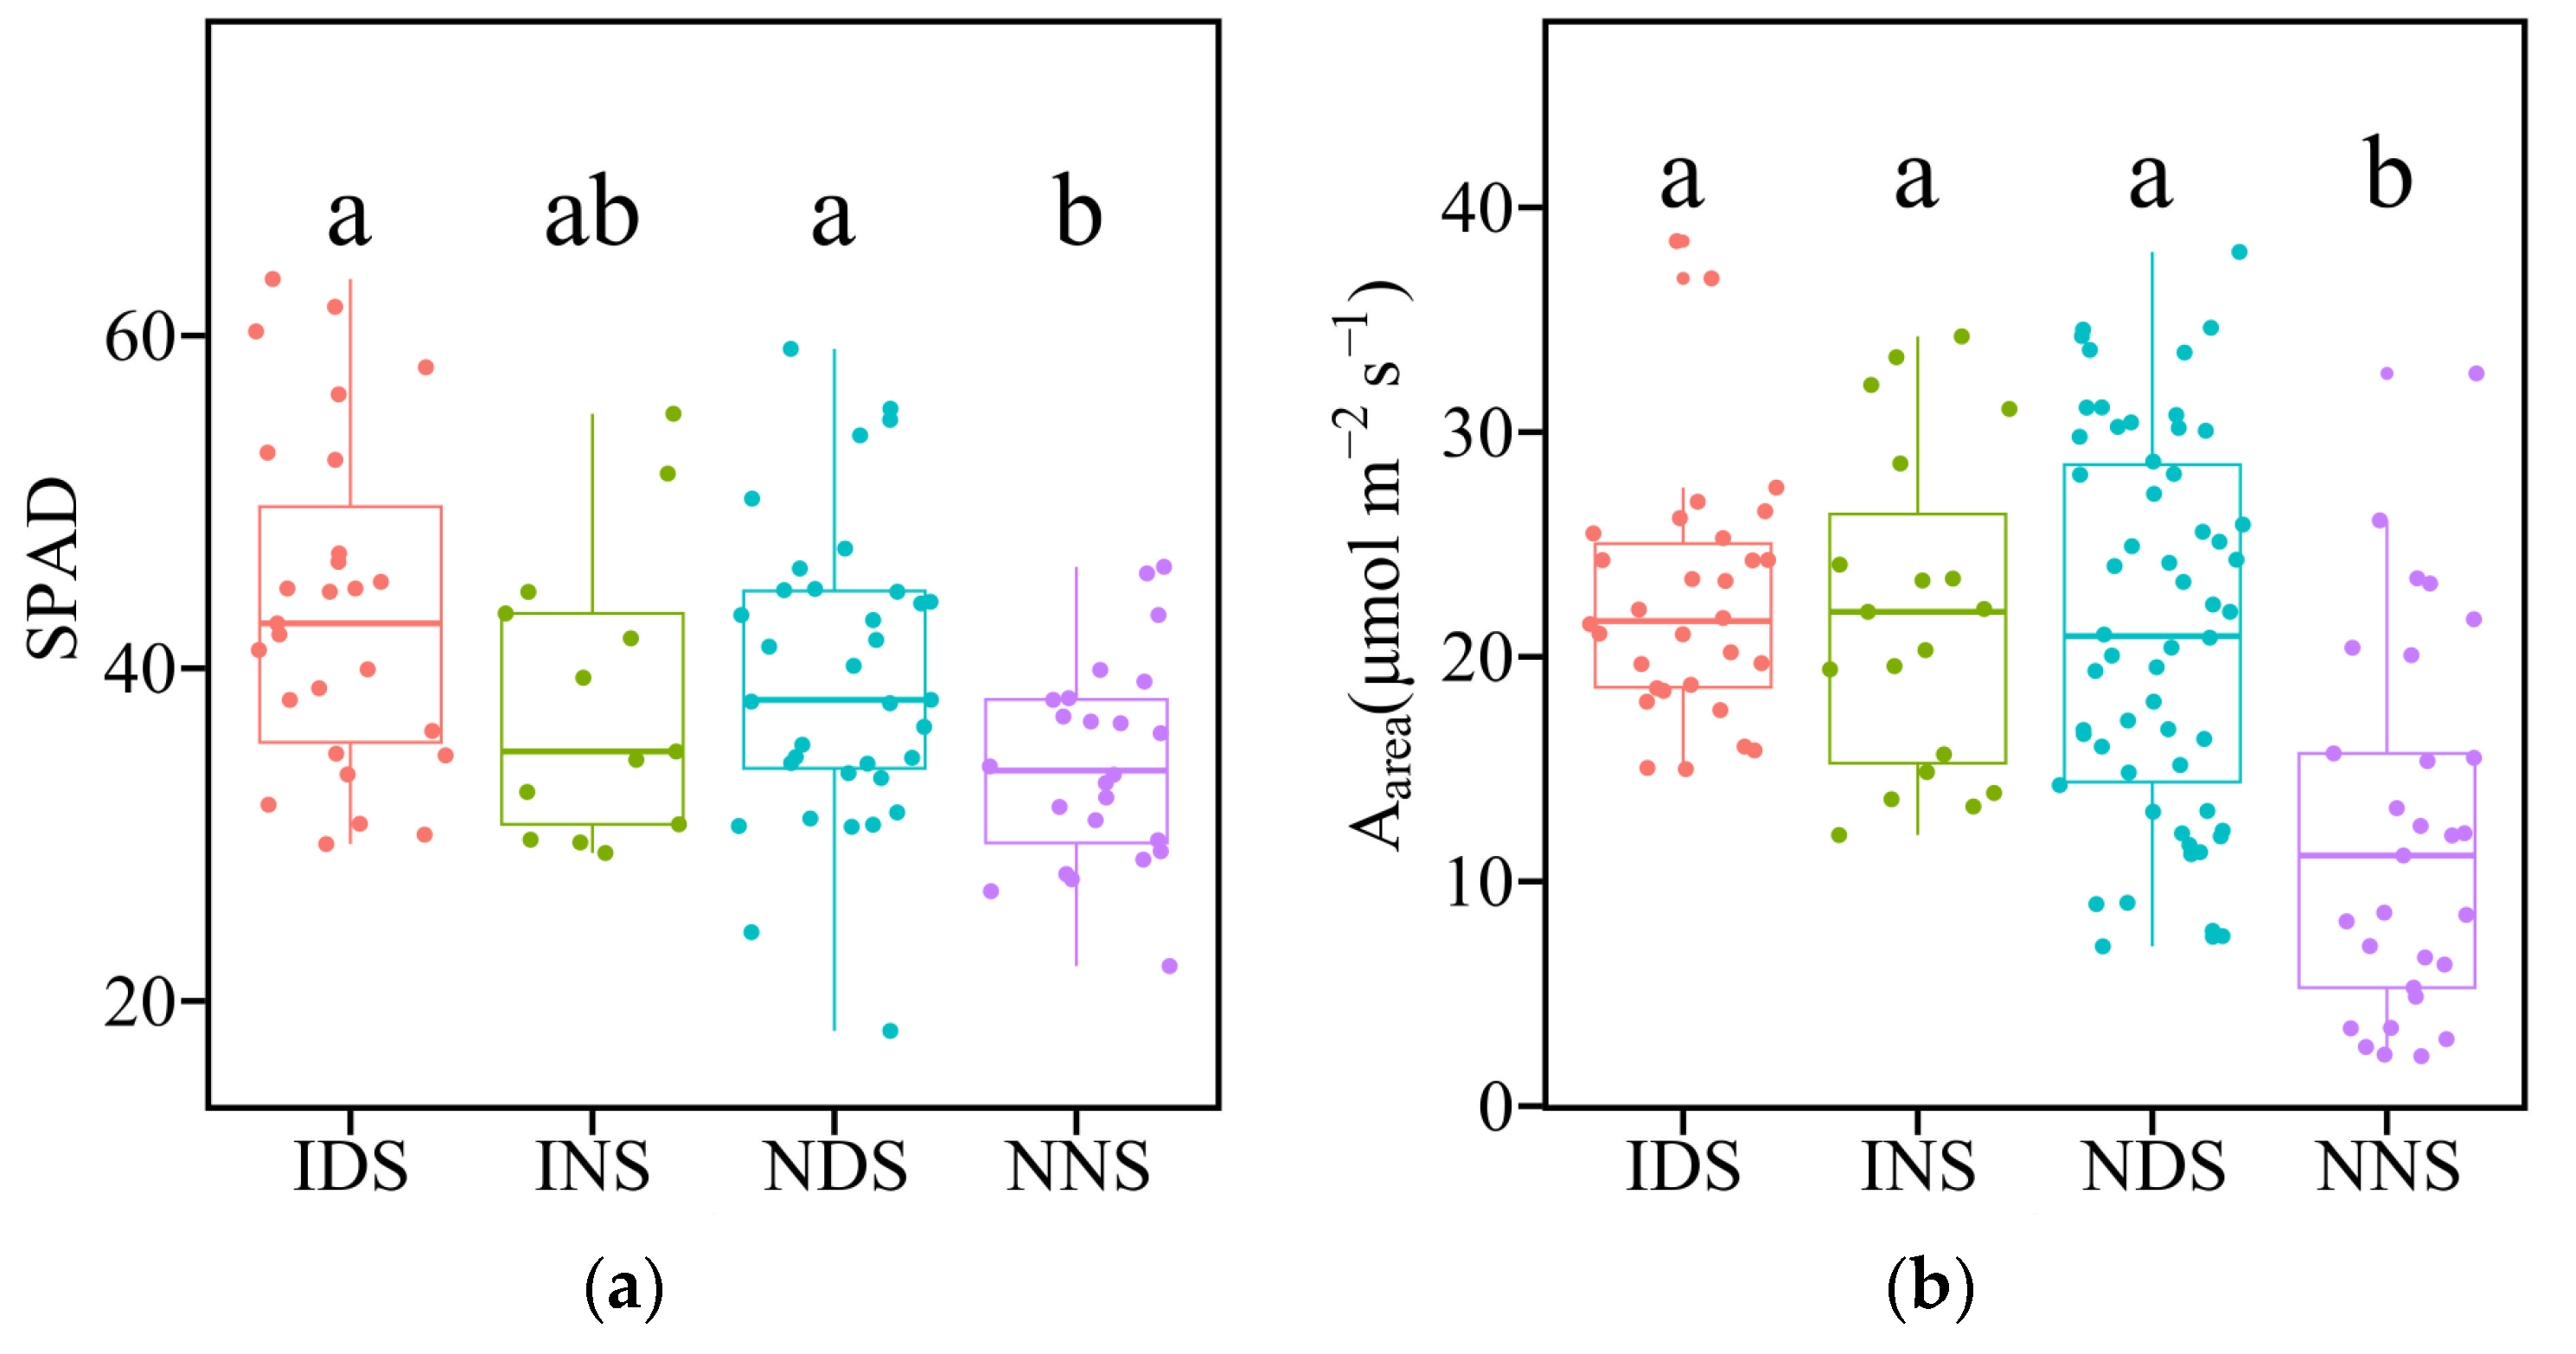
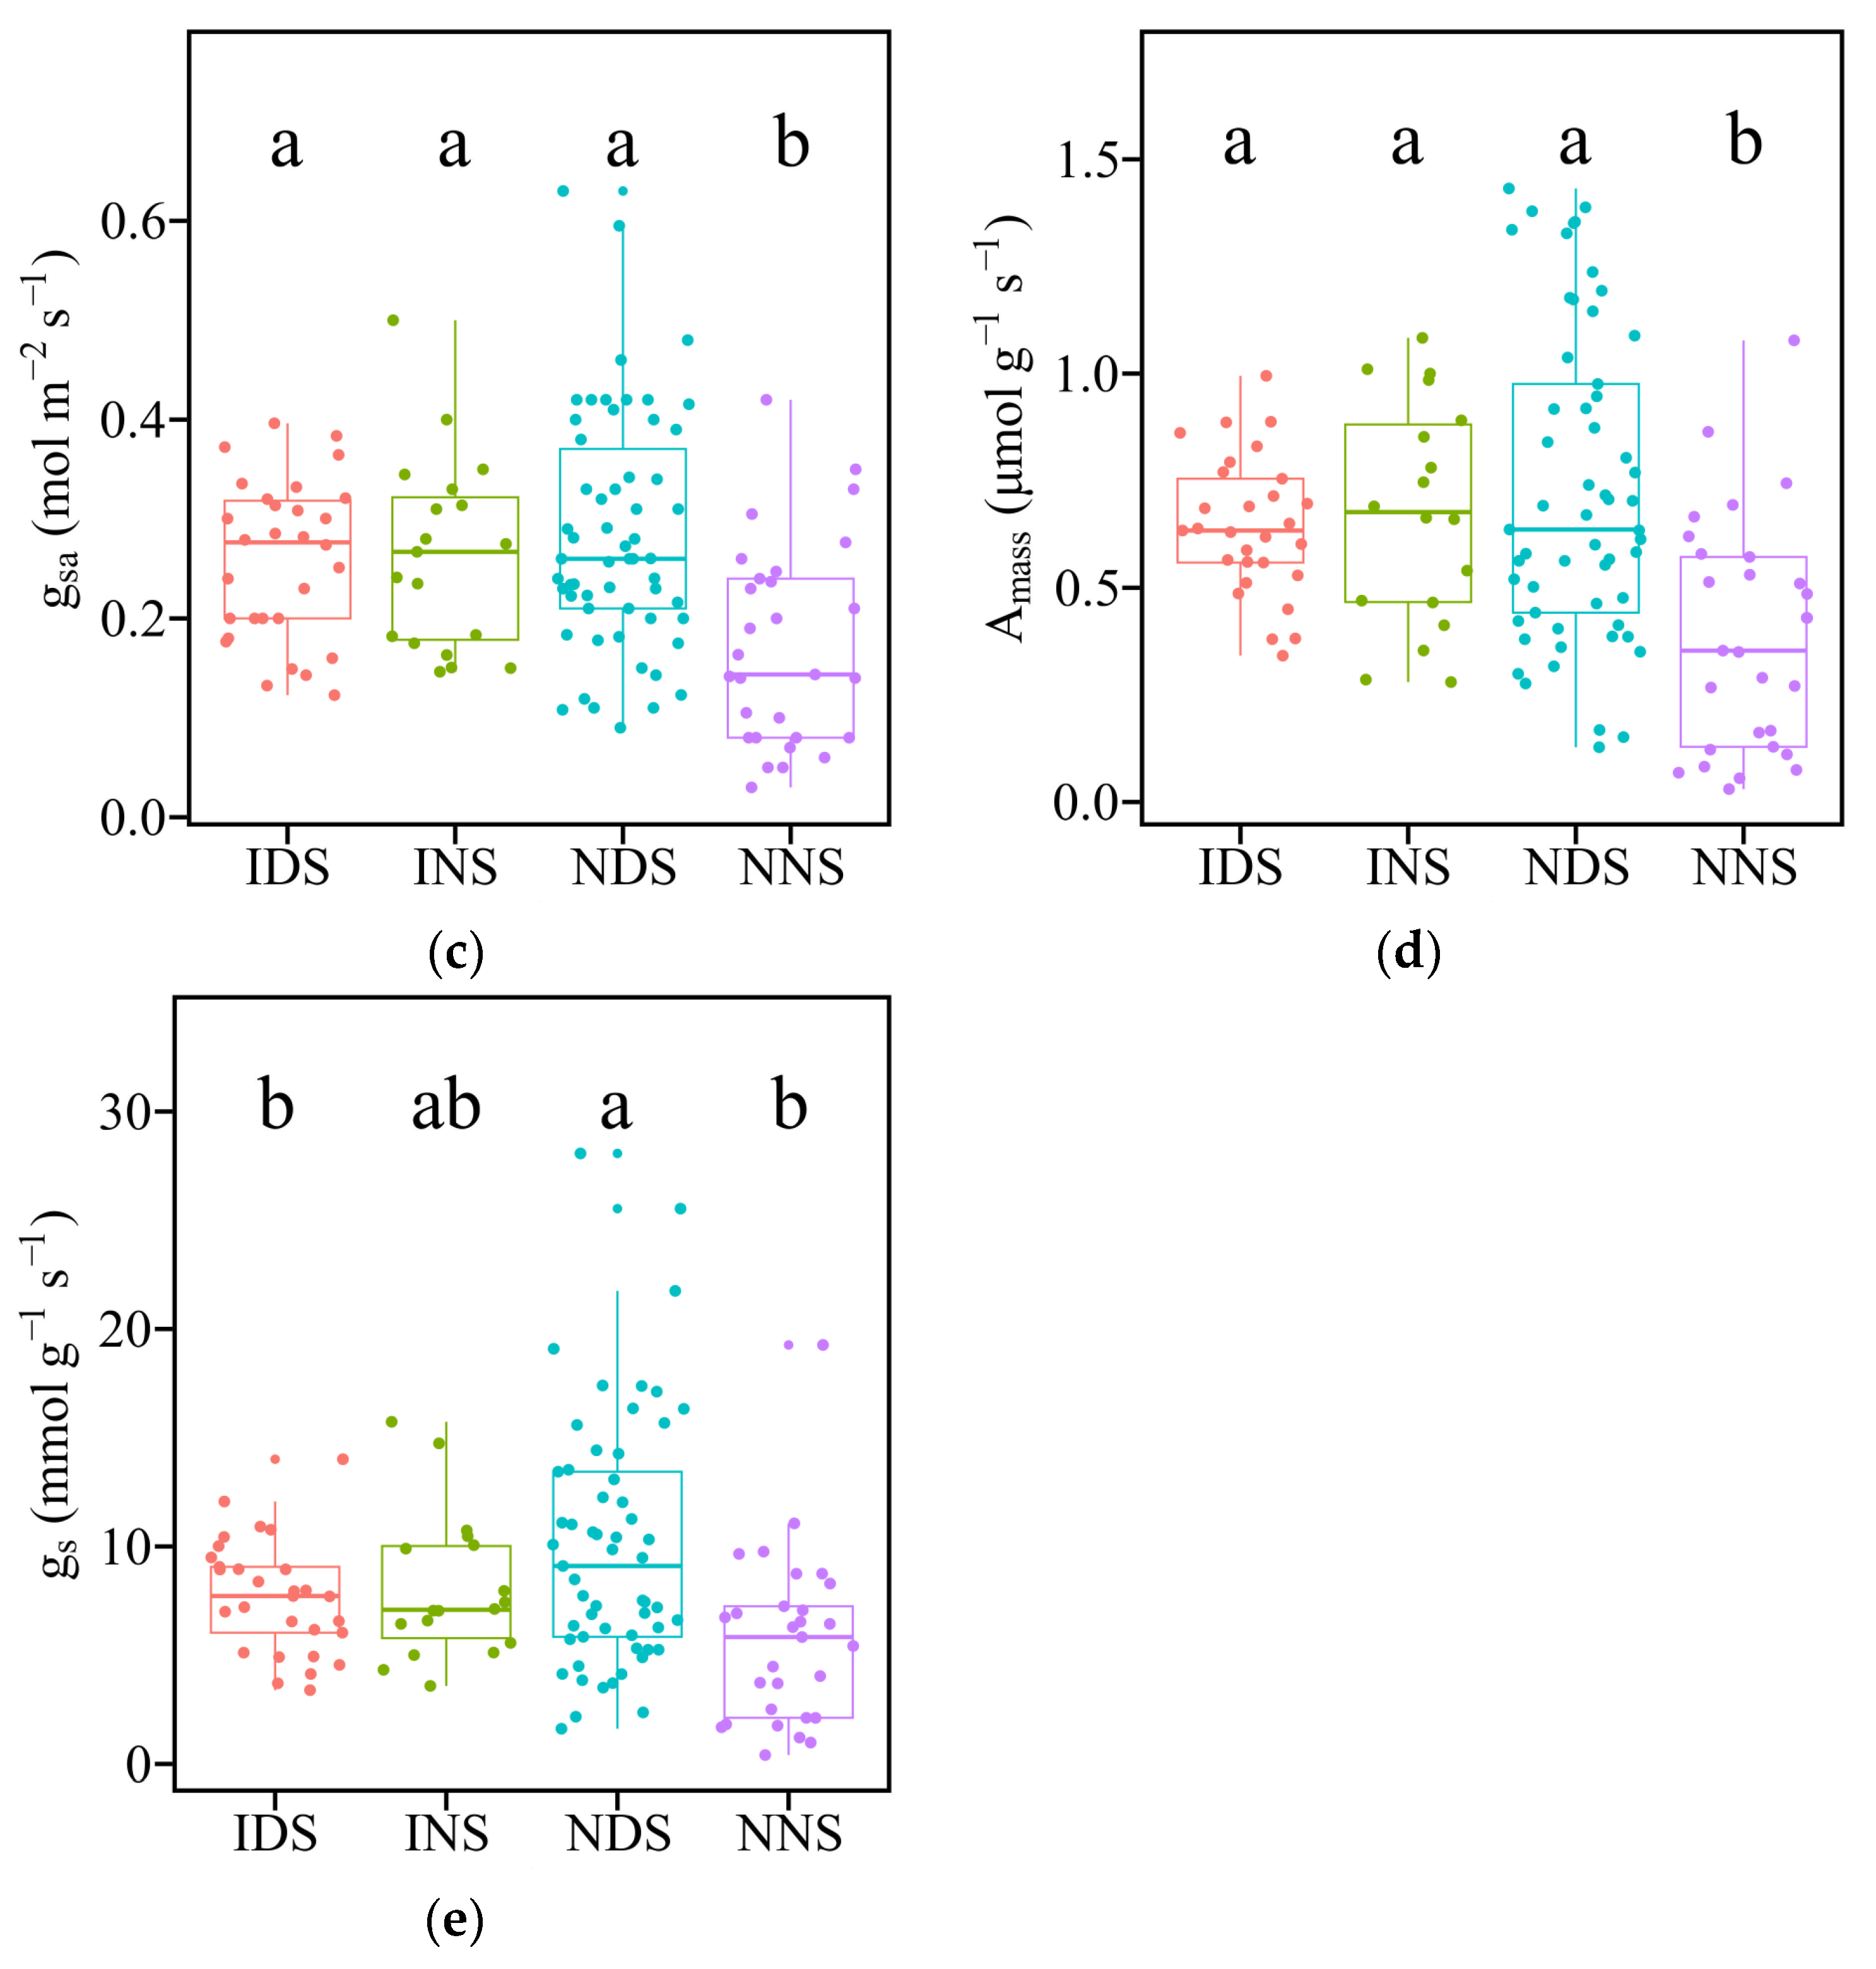
Figure 4 demonstrates the differences in plant leaf chlorophyll content and photosynthetic rate across the four groups. Leaf chlorophyll content (SPAD) was statistically indistinguishable among IDS, INS, and NDS (Figure 4a). Conversely, the NNS exhibited a significantly lower chlorophyll content. No significant differences were found in photosynthetic rate and stomatal conductance per area among IDS, INS, and NDS, whereas NNS display reduced values in both parameters (Figure 4b,c). Similarly, the photosynthetic rate per mass (Amass) followed the same pattern, with NNS showing significantly lower rates than other groups (Figure 4d). For gs, NDS had significantly higher stomatal conductance per mass than IDS and NNS (Figure 4e). Thus, the observed trends suggest that native non-dominant species (NNS) tend to exhibit lower values in the assessed physiological parameters, which may imply a reduced capacity for photosynthesis and water transport compared with other groups.

3.4. Leaf Water Use Efficiency and Nutrient Use Efficiency

Figure 5 presents an analysis of variance in plant water and nutrient use efficiencies among the four groups. The data on leaf water use efficiency (WUEi) showed that there was no significant distinction between the IDS and INS (Figure 5a). However, IDS demonstrated higher WUEi when compared with NDS. In contrast, the comparison between INS and NDS did not yield any significant differences, indicating similar WUEi between these two groups. The invasive groups, both IDS and INS, exhibited significantly higher WUEi than the NNS. In terms of leaf nitrogen use efficiency, IDS stood out, with significantly higher efficiency compared with NNS, while the differences between the other groups were not statistically significant (Figure 5b). When analyzing leaf phosphorus use efficiency, the study observed a homogeneous efficiency among all groups, indicating that this trait index did not differ significantly between invasive and native species, nor between dominant and non-dominant species (Figure 5c).

3.5. Impact of Invasiveness and Dominance on Trait Coordination: PCA

The first two principal components (PCs) extracted from the analysis accounted for a considerable proportion of the variability within the dataset, 28.87% for PC1 and 21.84% for PC2 (Figure 6a). The loadings on PCA axis 1 were positive for traits associated with photosynthetic-related traits (Aarea, gsa, Amass, gs, PNUE, and PPUE) and leaf water content (LWC), while LT, N:P were loaded at the negative end. The second PCA axis was primarily structured by leaf stoichiometry traits (N, P, LC, and C:N) and leaf area. PC1 significantly separated NNS from IDS, INS, and NDS (Figure 6b,c), while PC2 significantly separated invasive species from NDS and NNS (Figure 6b and Figure 5d). The results indicate that the divergence of multiple functional traits along the first two axes was closely associated with both invasiveness and dominance.

4. Discussion

This study reveals significant trait similarities between both dominant and non-dominant invasive species and native dominant species, as well as between dominant and non-dominant invasive species. However, invasive species display unique adaptations compared with native non-dominant species. These include variations in height, leaf thickness, leaf water content, leaf stoichiometry, photosynthetic rate, water use efficiency, and nitrogen use efficiency, suggesting a competitive superiority in resource acquisition and utilization. However, no significant differences in leaf area, specific leaf area, seed weight, and phosphorus use efficiency were found among all groups. Principal component analysis (PCA) further illustrates a systematic differentiation between native non-dominant species and both groups of invasive species. The application of a phylogenetic ANOVA to our dataset reveals that the differences observed among the four groups for most of the traits remained statistically significant, even when accounting for their evolutionary relationships. This analysis underscores the robustness of the trait variations, indicating that they are not merely results of phylogenetic relatedness but likely reflect genuine adaptive differences [21,28]. Such findings are crucial as they suggest that despite sharing a common evolutionary background, the groups have diverged significantly in terms of certain key traits [29].
In this study, we did not find differences in seed weight among all groups. Seed weight is a pivotal trait influencing dispersal capability, germination success, and early-life-stage survival, which in turn affects the establishment and spread of species in new environments. Some studies report that invasive species often have smaller seeds, facilitating wider dispersal over large areas, a trait beneficial for species establishing themselves in new regions [30,31]. Conversely, other research finds invasive species with larger seeds, which might contribute to higher survival rates and competitive advantages in certain environments [9,14,32]. Additionally, many studies have documented similar seed weights between invasive and native species, indicating that seed size alone does not predict invasiveness [14,33]. Our results regarding leaf area diverge from studies conducted in Mediterranean ecosystems, where invasive species exhibit larger leaves than native species, and contrast with findings from the sub-Antarctic region, where invasive species have smaller leaves than their native counterparts [8,34]. For specific leaf area, our study is similar to a study carried out in northeast China [9,14,35] and different from studies indicating that invasive species have a higher SLA [8,36,37]. For leaf phosphorus use efficiency, our results differ from a study reporting that invasive species have higher PPUE [7].
Our results showed no significant differences in any of the 19 functional traits between invasive dominant species (IDS) and invasive non-dominant species (INS). IDS and INS may both employ generalist strategies that enable them to thrive in diverse environmental conditions. The similarity in traits suggests a concept of ecological equivalence among invasive species, where both IDS and INS possess an overlapping set of adaptive traits conducive to invasion success. This suggests that invasiveness and dominance may not always be readily apparent through traditional trait comparisons. Our findings are consistent with other studies reporting that common invasive species exhibit similar functional traits or intrinsic growth rates with rare invasive species [9,12,38]. In summary, the observed lack of significant trait differences between IDS and INS adds an important dimension to our understanding of biological invasions, highlighting the need for comprehensive approaches to studying, managing, and mitigating the impacts of invasive species on native ecosystems. Our results also indicate that, based solely on the functional traits studied, we cannot accurately predict which alien species will become more invasive and cause significant damage in invaded areas. Therefore, it is essential to carefully monitor and manage all alien species during the early stages of invasion.
The research provides compelling evidence for the significant trait similarities between IDS and native dominant species (NDS), as well as between INS and NDS, spanning a wide range of ecological and physiological characteristics. However, certain specific traits—such as leaf thickness, maximum stomatal conductance per mass, intrinsic water use efficiency for IDS compared with NDS, and plant height and leaf nitrogen content for INS versus NDS—were exceptions. This trait convergence suggests a fundamental ecological equivalency that may underlie the ability of invasive species to successfully integrate into and compete within new environments [9,12]. The lack of significant differences among IDS, INS, and NDS could be attributed to their adaptation to disturbance-prone environments. However, these traits do not uniformly confer a competitive advantage, as demonstrated by a study in France, where most invasive dominant species exhibited larger biomass production compared with native species [39]. A study conducted in California, United States, found that dominant invasive species negatively impacted all target species, particularly those that are resource-acquisitive, suggesting that IDS and NDS may share similar traits [19]. Our observation supports the Pre-Adaptation Hypothesis in invasion ecology, which posits that invasive species possess pre-existing traits that are advantageous in new environments, even before exposure to these environments.
IDS manifest an array of superior traits relative to native non-dominant species (NNS), characterized by increased leaf thickness, enhanced plant height, augmented leaf phosphorus and water content, elevated chlorophyll concentrations, and markedly higher rates of photosynthesis and stomatal conductance. Additionally, these species exhibit diminished leaf carbon content and reduced carbon-to-nitrogen (C:N) and nitrogen-to-phosphorus (N:P) ratios. Such phenotypic characteristics underscore a heightened efficiency in water and nitrogen utilization. A congruent pattern was observed between INS and NNS. Our results are consistent with recent studies which found that non-native plant species exhibit significantly enhanced leaf nutrient content and leaf photosynthetic-related traits compared with native species, as well as greater photosynthetic water use efficiency and nitrogen use efficiency [14,40,41,42]. Invasive species across various communities exhibit leaf traits indicative of an acquisitive resource use strategy, in contrast to the more conservative traits observed in native non-dominant species. This is contrary to another study, which found that both native and invasive species within annual and perennial groups exhibited similar patterns of carbon assimilation and resource use [43]. And it is contrary to a study in the sub-Antarctic area, which found that invasive species had lower plant height, smaller leaf area, and higher specific leaf area than non-invasive aliens, suggesting that these traits are associated with invasiveness [8].

5. Conclusions

Our investigation into the phenotypic, physiological, and reproductive characteristics of both invasive and native plant species, categorized by their dominance status, illuminates the complex dynamics underlying plant competition and survival. While our findings indicate that certain traits such as leaf area, specific leaf area, and thousand-seed weight do not significantly vary across the four studied groups, this suggests a fundamental homogeneity in these traits, which transcends ecological and biological boundaries. Invasive species generally exhibit traits conducive to a competitive advantage over native non-dominant species. These traits underscore that dominance within a habitat is closely linked to superior resource acquisition and utilization capabilities, a trait especially pronounced in invasive dominant species. Such traits not only facilitate their survival and proliferation but also enable them to outcompete other species. This pattern suggests that the capacity for effective resource use is a critical determinant of dominance and success in various ecological settings. Further reflecting on the broader impacts, anthropization and environmental degradation can significantly alter ecological balances, potentially enhancing the invasiveness of certain species by creating niches that exploit their competitive traits. The scientific implications of this work extend to enhance our understanding of invasion biology and the factors that confer competitive advantages to invasive species in various ecological contexts. Practically, this knowledge assists in the development of more effective management strategies that consider both the phenotypic traits and environmental factors driving the success of invasive species, thereby informing conservation efforts and ecological restoration practices for maintaining biodiversity and ecological health.

Supplementary Materials

The following supporting information can be downloaded at https://www.mdpi.com/article/10.3390/d16060317/s1, Table S1: Taxonomic classification and dominance status of the 144 plant species analyzed in the study. Figure S1: Phylogenetic tree of the 144 species studied.

Author Contributions

Conceptualization, R.L.; methodology, R.L., Y.X.; software, R.L and Y.C; formal analysis, R.L.; Y.C and Y.X.; investigation, Y.X., Y.C., C.W. and S.L.; data curation, Y.C., R.L. and Y.C.; writing—original draft preparation, Y.C., X.L. and R.L.; visualization, Y.C. and R.L.; supervision, writing—review and editing, J.Z.; funding acquisition, R.L. All authors have read and agreed to the published version of the manuscript.

Funding

This research was supported by grants from the Guangzhou Basic and Applied Basic Research Foundation (202201010506) and the Guangdong Forestry Science and Technology Innovation Project (2022KJCX018).

Institutional Review Board Statement

Not applicable.

Data Availability Statement

The data presented in this study are available on request from the corresponding author.

Conflicts of Interest

The authors declare no conflicts of interest. The funders had no role in the design of the study; in the collection, analyses, or interpretation of data; in the writing of the manuscript; or in the decision to publish the results.

References

  1. Yan, X.; Wang, Z.; Ma, J.; Li, H.; Yan, J. The Checklist of the Naturalized Plants in China; Shanghai Scientific and Technical Publishers: Shanghai, China, 2019. [Google Scholar]
  2. Hao, Q.; Ma, J.S. Invasive alien plants in China: An update. Plant Divers. 2023, 45, 117–121. [Google Scholar] [CrossRef]
  3. Pyšek, P.; Pergl, J.; Essl, F.; Lenzner, B.; Dawson, W.; Kreft, H.; Weigelt, P.; Winter, M.; Kartesz, J.; Nishino, M.; et al. Naturalized alien flora of the world. Preslia 2017, 89, 203–274. [Google Scholar] [CrossRef]
  4. van Kleunen, M.; Dawson, W.; Essl, F.; Pergl, J.; Winter, M.; Weber, E.; Kreft, H.; Weigelt, P.; Kartesz, J.; Nishino, M.; et al. Global exchange and accumulation of non-native plants. Nature 2015, 525, 100–103. [Google Scholar] [CrossRef]
  5. Seebens, H.; Bacher, S.; Blackburn, T.M.; Capinha, C.; Dawson, W.; Dullinger, S.; Genovesi, P.; Hulme, P.E.; van Kleunen, M.; Kuhn, I.; et al. Projecting the continental accumulation of alien species through to 2050. Glob. Chang. Biol. 2020, 27, 970–982. [Google Scholar] [CrossRef]
  6. Huang, K.; Kong, D.; Lu, X.; Feng, W.; Liu, M.; Feng, Y. Lesser leaf herbivore damage and structural defense and greater nutrient concentrations for invasive alien plants: Evidence from 47 pairs of invasive and non-invasive plants. Sci. Total Environ. 2020, 723, 137829. [Google Scholar] [CrossRef]
  7. Liu, Y.; van Kleunen, M. Responses of common and rare aliens and natives to nutrient availability and fluctuations. J. Ecol. 2017, 105, 1111–1122. [Google Scholar] [CrossRef]
  8. Mathakutha, R.; Steyn, C.; le Roux, P.C.; Blom, I.J.; Chown, S.L.; Daru, B.H.; Ripley, B.S.; Louw, A.; Greve, M.; Price, J. Invasive species differ in key functional traits from native and non-invasive alien plant species. J. Veg. Sci. 2019, 30, 994–1006. [Google Scholar] [CrossRef]
  9. Liu, M.; Dong, T.; Feng, W.; Qu, B.; Kong, D.; van Kleunen, M.; Feng, Y. Leaf trait differences between 97 pairs of invasive and native plants across China: Effects of identities of both the invasive and native species. Neobiota 2022, 71, 1–22. [Google Scholar] [CrossRef]
  10. Zhao, Y.; Liu, M.; Feng, Y.; Wang, D.; Feng, W.; Clay, K.; Durden, L.A.; Lu, X.; Wang, S.; Wei, X.; et al. Release from below- and aboveground natural enemies contributes to invasion success of a temperate invader. Plant Soil 2020, 452, 19–28. [Google Scholar] [CrossRef]
  11. Hulme, P.E.; Bernard-Verdier, M. Comparing traits of native and alien plants: Can we do better? Funct. Ecol. 2018, 32, 117–125. [Google Scholar] [CrossRef]
  12. Zhang, Z.; van Kleunen, M. Common alien plants are more competitive than rare natives but not than common natives. Ecol. Lett. 2019, 22, 1378–1386. [Google Scholar] [CrossRef]
  13. Canessa, R.; Saldana, A.; Rios, R.S.; Gianoli, E. Functional trait variation predicts distribution of alien plant species across the light gradient in a temperate rainforest. Perspect. Plant Ecol. 2018, 32, 49–55. [Google Scholar] [CrossRef]
  14. Divisek, J.; Chytry, M.; Beckage, B.; Gotelli, N.J.; Lososova, Z.; Pysek, P.; Richardson, D.M.; Molofsky, J. Similarity of introduced plant species to native ones facilitates naturalization, but differences enhance invasion success. Nat. Commun. 2018, 9, 4631. [Google Scholar] [CrossRef]
  15. Gallagher, R.V.; Randall, R.P.; Leishman, M.R. Trait differences between naturalized and invasive plant species independent of residence time and phylogeny. Conserv. Biol. 2015, 29, 360–369. [Google Scholar] [CrossRef]
  16. Jeschke, J.M.; Strayer, D.L. Are threat status and invasion success two sides of the same coin? Ecography 2008, 31, 124–130. [Google Scholar] [CrossRef]
  17. Milanovic, M.; Knapp, S.; Pysek, P.; Kuehn, I. Trait-environment relationships of plant species at different stages of the introduction process. Neobiota 2020, 58, 55–74. [Google Scholar] [CrossRef]
  18. Iqbal, M.F.; Liu, M.; Iram, A.; Feng, Y. Effects of the invasive plant Xanthium strumarium on diversity of native plant species: A competitive analysis approach in North and Northeast China. PLoS ONE 2020, 15, e228476. [Google Scholar] [CrossRef]
  19. LaForgia, M.L.; Harrison, S.P.; Latimer, A.M. Invasive species interact with climatic variability to reduce success of natives. Ecology 2020, 101, e03022. [Google Scholar] [CrossRef]
  20. van Kleunen, M.; Schlaepfer, D.R.; Glaettli, M.; Fischer, M. Preadapted for invasiveness: Do species traits or their plastic response to shading differ between invasive and non-invasive plant species in their native range? J. Biogeogr. 2011, 38, 1294–1304. [Google Scholar] [CrossRef]
  21. Rohlfs, R.V.; Nielsen, R. Phylogenetic ANOVA: The Expression Variance and Evolution Model for Quantitative Trait Evolution. Syst. Biol. 2015, 64, 695–708. [Google Scholar] [CrossRef]
  22. Yang, J.; Cao, M.; Swenson, N.G. Why Functional Traits Do Not Predict Tree Demographic Rates. Trends Ecol. Evol. 2018, 33, 326–336. [Google Scholar] [CrossRef]
  23. Li, R.H.; Zhu, S.D.; Chen, H.; John, R.; Zhou, G.Y.; Zhang, D.Q.; Zhang, Q.M.; Ye, Q. Are functional traits a good predictor of global change impacts on tree species abundance dynamics in a subtropical forest? Ecol. Lett. 2015, 18, 1181–1189. [Google Scholar] [CrossRef]
  24. Qiu, S.; Liu, S.; Wei, S.; Cui, X.; Nie, M.; Huang, J.; He, Q.; Ju, R.; Li, B. Changes in multiple environmental factors additively enhance the dominance of an exotic plant with a novel trade-off pattern. J. Ecol. 2020, 108, 1989–1999. [Google Scholar] [CrossRef]
  25. Wang, R. Guangzhou Invasive Plants; Guangdong Science & Technology Press: Guangzhou, China, 2019. [Google Scholar]
  26. R Core Team. R: A Language and Environment for Statistical Computing; R Foundation for Statistical Computing: Vienna, Austria, 2017. [Google Scholar]
  27. Jin, Y.; Qian, H.V. PhyloMaker: An R package that can generate very large phylogenies for vascular plants. Ecography 2019, 42, 1353–1359. [Google Scholar] [CrossRef]
  28. Adams, D.C.; Collyer, M.L. Phylogenetic ANOVA: Group-clade aggregation, biological challenges, and a refined permutation procedure. Evolution 2018, 72, 1204–1215. [Google Scholar] [CrossRef]
  29. Adams, D.C.; Collyer, M.L. Consilience of methods for phylogenetic analysis of variance. Evolution 2022, 76, 1406–1419. [Google Scholar] [CrossRef]
  30. Rindyastuti, R.; Hapsari, L.; Byun, C. Comparison of ecophysiological and leaf anatomical traits of native and invasive plant species. J. Ecol. Environ. 2021, 45, 4. [Google Scholar] [CrossRef]
  31. Ni, M.; Deane, D.C.; Li, S.; Wu, Y.; Sui, X.; Xu, H.; Chu, C.; He, F.; Fang, S. Invasion success and impacts depend on different characteristics in non-native plants. Divers. Distrib. 2021, 27, 1194–1207. [Google Scholar] [CrossRef]
  32. Pik, D.; Lucero, J.E.; Lortie, C.J.; Braun, J. Light intensity and seed density differentially affect the establishment, survival, and biomass of an exotic invader and three species of native competitors. Community Ecol. 2020, 21, 259–272. [Google Scholar] [CrossRef]
  33. Kunstler, G.; Falster, D.; Coomes, D.A.; Hui, F.; Kooyman, R.M.; Laughlin, D.C.; Poorter, L.; Vanderwel, M.; Vieilledent, G.; Wright, S.J.; et al. Plant functional traits have globally consistent effects on competition. Nature 2016, 529, 174–204. [Google Scholar] [CrossRef]
  34. Díaz De León Guerrero, S.D.; González-Rebeles Guerrero, G.; Ibarra-Montes, T.M.; Rodríguez Bastarrachea, A.; Santos Cobos, R.; Bullock, S.H.; Sack, L.; Méndez-Alonzo, R. Functional traits indicate faster resource acquisition for alien herbs than native shrubs in an urban Mediterranean shrubland. Biol. Invasions 2020, 22, 2699–2712. [Google Scholar] [CrossRef]
  35. Luo, J.; Gao, Y.; Feng, W.; Liu, M.; Qu, B.; Zhang, C.; Feng, Y. Stronger ability to absorb nitrate and associated transporters in the invasive plant Xanthium strumarium compared with its native congener. Environ. Exp. Bot. 2022, 198, 104851. [Google Scholar] [CrossRef]
  36. Castro-Díez, P.; Valle, G.; González-Muñoz, N.; Alonso, Á. Can the Life-History Strategy Explain the Success of the Exotic Trees Ailanthus altissima and Robinia pseudoacacia in Iberian Floodplain Forests? PLoS ONE 2014, 9, e100254. [Google Scholar] [CrossRef] [PubMed]
  37. Liu, W.W.; Wang, W.W.; Zhang, Y.H. Differences in leaf traits of Spartina alterniflora between native and invaded habitats: Implication for evolution of alien species competitive ability increase. Ecol. Indic. 2022, 138, 108799. [Google Scholar] [CrossRef]
  38. Fenesi, A.; Botta-Dukat, Z.; Miholcsa, Z.; Szigeti, V.; Molnar, C.; Sandor, D.; Szabo, A.; Kuhn, T.; Kovacs-Hostyanszki, A. No consistencies in abundance-impact relationships across herbaceous invasive species and ecological impact metrics. J. Ecol. 2023, 111, 1120–1138. [Google Scholar] [CrossRef]
  39. Bottollier Curtet, M.; Planty Tabacchi, A.M.; Tabacchi, E.; Güsewell, S. Competition between young exotic invasive and native dominant plant species: Implications for invasions within riparian areas. J. Veg. Sci. 2013, 24, 1033–1042. [Google Scholar] [CrossRef]
  40. Liu, M.; Kong, D.; Lu, X.; Huang, K.; Wang, S.; Wang, W.; Qu, B.; Feng, Y. Higher photosynthesis, nutrient- and energy-use efficiencies contribute to invasiveness of exotic plants in a nutrient poor habitat in northeast China. Physiol. Plant. 2017, 160, 373–382. [Google Scholar] [CrossRef] [PubMed]
  41. Abdallah, M.; Douthe, C.; Flexas, J. Leaf morpho-physiological comparison between native and non-native plant species in a Mediterranean island. Biol. Invasions 2022, 24, 2597–2612. [Google Scholar] [CrossRef]
  42. Barros, V.; Oliveira, M.T.; Santos, M.G. Low foliar construction cost and strong investment in root biomass in Calotropis procera, an invasive species under drought and recovery. Flora 2021, 280, 151848. [Google Scholar] [CrossRef]
  43. Funk, J.L.; Standish, R.J.; Stock, W.D.; Valladares, F. Plant functional traits of dominant native and invasive species in mediterranean-climate ecosystems. Ecology 2016, 97, 75–83. [Google Scholar] [CrossRef]
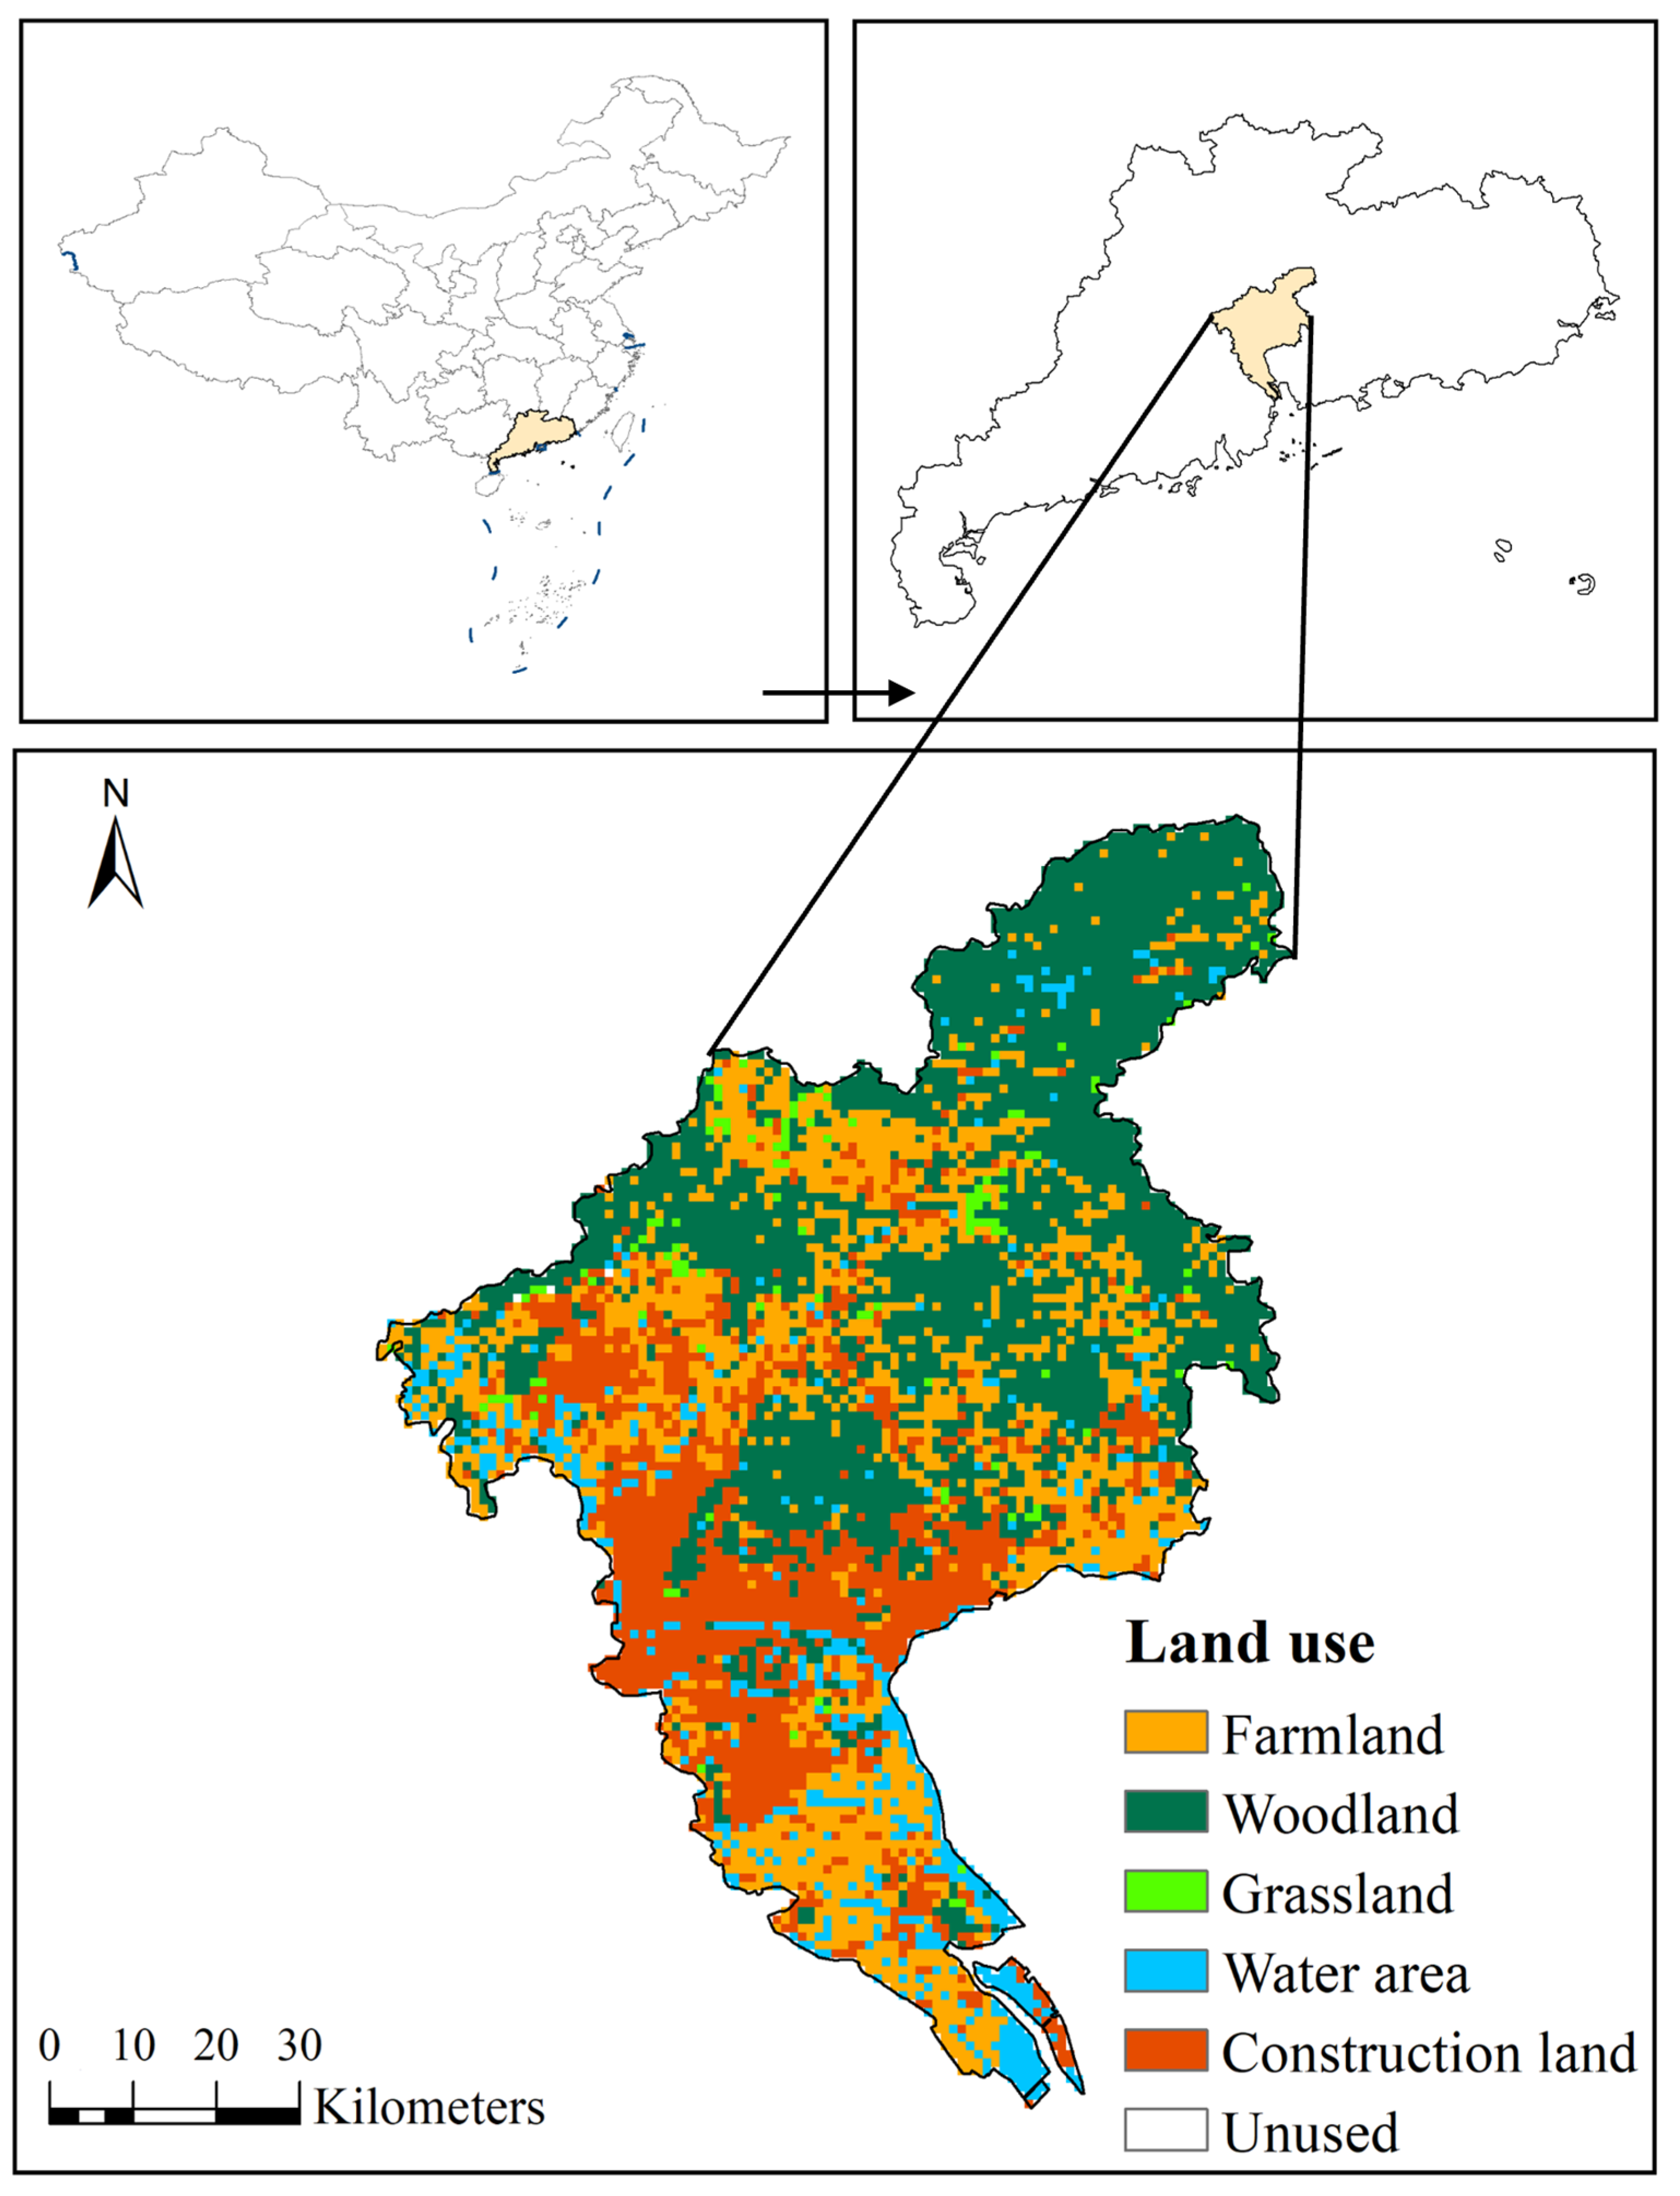
Figure 1. Geographic map and land use pattern of the studied area. Note: the land use pattern of Guangzhou is based on data sourced from the website https://www.resdc.cn/.
Diversity 16 00317 g001
Figure 2. Differences in plant phenotypic and reproductive traits using phylogenetic ANOVA. (a) Leaf area (LA, cm2); (b) leaf thickness (LT, mm); (c) specific leaf area (SLA, cm2 g−1); (d) height (H, cm); (e) thousand-seed weight (TSW, g).
Diversity 16 00317 g002
Figure 3. Differences in plant leaf stoichiometry and leaf water content using phylogenetic ANOVA. (a) Leaf carbon content (LC, %); (b) leaf nitrogen content (N, mg−1 g−1); (c) leaf phosphorus content (P, mg−1 g−1); (d) leaf carbon/nitrogen ratio (C:N); (e) leaf nitrogen/phosphorus ratio (N:P); (f) leaf water content (LWC, %).
Diversity 16 00317 g003aDiversity 16 00317 g003b
Figure 4. Comparative analysis of leaf chlorophyll content and photosynthetic rates across four groups using phylogenetic ANOVA. (a) Leaf chlorophyll content (SPAD); (b) maximum photosynthetic rate per area (Aarea, μmol m−2 s−1); (c) maximum stomatal conductance per area (gsa, mol m−2 s−1); (d) maximum photosynthetic rate per mass (Amass, μmol g−1 s−1); (e) maximum stomatal conductance per mass (gs, mmol g−1 s−1).
Diversity 16 00317 g004aDiversity 16 00317 g004b
Figure 5. Differences in plant water and nutrient use efficiency traits using phylogenetic ANOVA. (a) Intrinsic water use efficiency (WUEi, μmol mol−1); (b) photosynthetic nitrogen use efficiency (PNUE, μmol mol−1 s−1); (c) photosynthetic phosphorus use efficiency (PPUE, μmol mol−1 s−1).
Diversity 16 00317 g005
Figure 6. A principal component analysis of 19 functional traits of the 144 study species. (a) Loading of the 19 traits on the first two axes; (b) species loadings on the first and second axes; (c) box-plots of species scores on PC1; (d) box-plots of species scores on PC2. The red circles, blue triangles, purple squares, and pink crosses in (b) represent invasive dominant species (IDS), invasive non-dominant species (INS), native dominant species (NDS), and native non-dominant species (NNS), respectively. The abbreviations used for the traits are consistent with those mentioned in the text.
Diversity 16 00317 g006
Disclaimer/Publisher’s Note: The statements, opinions and data contained in all publications are solely those of the individual author(s) and contributor(s) and not of MDPI and/or the editor(s). MDPI and/or the editor(s) disclaim responsibility for any injury to people or property resulting from any ideas, methods, instructions or products referred to in the content.