Article

Multi-Scale Habitat Selection by the Wintering Whooper Swan (Cygnus cygnus) in Manas National Wetland Park, Northwestern China

1
State Key Laboratory of Desert and Oasis Ecology, Key Laboratory of Ecological Safety and Sustainable Development in Arid Lands, Xinjiang Institute of Ecology and Geography, Chinese Academy of Sciences, Urumqi 830011, China
2
Xinjiang Key Laboratory of Biodiversity Conservation and Utilization in Arid Lands, Xinjiang Institute of Ecology and Geography, Chinese Academy of Sciences, Urumqi 830011, China
3
Sino-Tajikistan Joint Laboratory for Conservation and Utilization of Biological Resources, Urumqi 830011, China
4
University of Chinese Academy of Sciences, Beijing 100049, China
5
Xinjiang Key Laboratory for Ecological Adaptation and Evolution of Extreme Environment Biology, College of Life Sciences, Xinjiang Agricultural University, Urumqi 830052, China
*
Authors to whom correspondence should be addressed.
These authors contributed equally to this work and should be considered co-first authors.
Diversity 2024, 16(5), 306; https://doi.org/10.3390/d16050306
Submission received: 8 April 2024 / Revised: 16 May 2024 / Accepted: 17 May 2024 / Published: 20 May 2024
(This article belongs to the Section Animal Diversity)

Abstract

:
Habitat selection has been a central focus of animal ecology, with research primarily concentrating on habitat choice, utilization, and evaluation. However, studies confined to a single scale often fail to reveal the habitat selection needs of animals fully and accurately. This paper investigates the wintering whooper swan (Cygnus cygnus) in Manas National Wetland Park, Xinjiang, using satellite tracking to determine their locations. The Maximum Entropy model (MaxEnt) was applied to explore the multi-scales habitat selection needs of Manas National Wetland Park’s wintering whooper swans across nighttime, daytime, and landscape scales. This study showed that the habitat selection of the wintering whooper swans varied in different scales. At the landscape scale, wintering whooper swans prefer habitats with average winter precipitations of 6.9 mm and average temperatures of −6 °C, including water bodies and wetlands, indicating that climate (precipitation and temperature) and land type (wetlands and water bodies) influence their winter habitat selection. During daytime, whooper swans prefer areas close to wetlands, water bodies, and bare land, with a more dispersed distribution of water bodies. For nighttime, they tend to choose areas within the wetland park where human disturbance is minimal and safety is higher. This study can provide scientific basis and data support for habitat conservation and management of wintering waterbirds like whooper swans, recommending targeted conservation measures to effectively manage and protect the wintering grounds of whooper swans.

1. Introduction

Habitats are defined as the spaces required for animal survival and reproduction, mainly referring to areas that provide food, shelter, mating, and nesting sites [1]. For birds, habitat refers to the environmental type occupied by individuals, populations, or communities during specific life stages (such as breeding or wintering periods), serving as the location for various life activities [2]. The habitat selection of birds is the result of the combined effects of various ecological factors [3]. On a macro scale, emphasis is placed on the influence of larger-scale factors on habitat selection, while on a micro scale, the focus is on the impact of micro habitat factors such as vegetation, food, hydrology, and soil. Only through a comprehensive analysis of macro and micro habitat selection can the underlying reasons for complex bird habitat selection be understood [4].
Multi-scale habitat selection has become a key focus of bird habitat research, as utilizing multi-scale theories allows for the comprehensive study of habitat-influencing factors across different temporal and spatial scales, whereas single-scale studies cannot accurately reflect the factors influencing bird habitat selection [5]. Birds exhibit a penchant for selecting habitat patches conductive to their nesting requirements, and the non-uniform utilization of these patches has been well documented [6]. Landscape fragmentation can impede habitat connectivity, leading to alterations in the spatial distribution and availability of resources [7]. Furthermore, bird movement patterns interact intricately with landscape configuration, with avian inhabitants in fragmented habitats expanding their range to exploit multiple patches to meet their energy needs [8]. Thus, the assessment of avian habitat utilization necessitates a consideration of diverse land types [9]. Previous studies have underscored the influence of landscape elements composition and structure on bird abundance and distribution [10]. Factors such as land type (e.g., grassland, forest, wetland), vegetation cover, and proximity to water bodies also play pivotal roles in shaping bird habitat selection [11]. It is noteworthy that bird habitat preferences vary across seasons, with distinct factors influencing the selection of breeding and wintering habitats [12]. Moreover, diurnal and nocturnal disparities in birds’ habitat utilization are evident, with daytime activities predominantly centered on foraging and movement, exhibiting variations in activity intensity and range compared to nighttime behaviors [8]. For instance, geese exhibit a preference for foraging or resting in rice fields and intertidal zones during the day, while opting for mudflats for roosting at night [9]. The daytime home range of wintering whooper swans in Sanmenxia surpasses that of the nighttime range, with daytime foraging activities concentrated around Canglong Lake, while nighttime sites are predominantly situated near the wooden walkway at Canglong Lake and the black swan Base at Qinglong Lake [13]. Eurasian woodcocks (Scolopax rusticola) exhibit a tendency to inhabit denser canopy habitats during the day and more open habitats at night [14]. Therefore, a multi-scale approach to habitat selection is needed to reveal the mechanisms of bird habitat selection at different temporal and spatial scales [15]. Currently, research based on mathematical models and species distribution site analysis is common [16]. Among these, the Maximum Entropy model (MaxEnt model) is a commonly used mathematical model that explores the maximum entropy probability distribution of suitable habitats for species by using animal “presence points” as well as environmental variables (such as climate, altitude, anthropogenic disturbances) as constraints. This model fits well with small sample data and exhibits superior predictive ability and stability at larger scales, making it a widely applied ecological niche model currently [17].
The whooper swan (Cygnus cygnus Linnaeus, 1758) holds the status of a second-level key protected wild animal in China [18]. Research pertaining to wintering whooper swans predominantly encompasses aspects such as population size and distribution, avian influenza transmission during migration periods, behavioral patterns, dietary analysis, habitat selection, and migration strategies [19,20]. For instance, wintering whooper swans in Sanmenxia exhibit a preference for foraging sites abundant in vegetation and distanced from disturbances, favoring open waters with sparse vegetation, while nighttime sites are in close proximity to foraging areas [4]. Despite extensive investigations into species–environment relationships, the role of bird habitats in shaping landscape composition and structure remains relatively underexplored.
We hypothesized that the habitat selection patterns of overwintering whooper swans’ manifest across distinct spatial scales. Furthermore, we proposed that their daytime and nighttime habitat requirements differ, with environmental variables exerting varying degrees of influence. Consequently, our study focuses on a multi-scale assessment of habitat selection, including landscape, daytime, and nighttime scale with the objectives of (1) evaluating the optimal gradient model at each scale and assessing the significance of environmental variables and (2) predicting the distribution of suitable habitats at each scale and examine the pivotal variables influencing habitat selection.

2. Materials and Methods
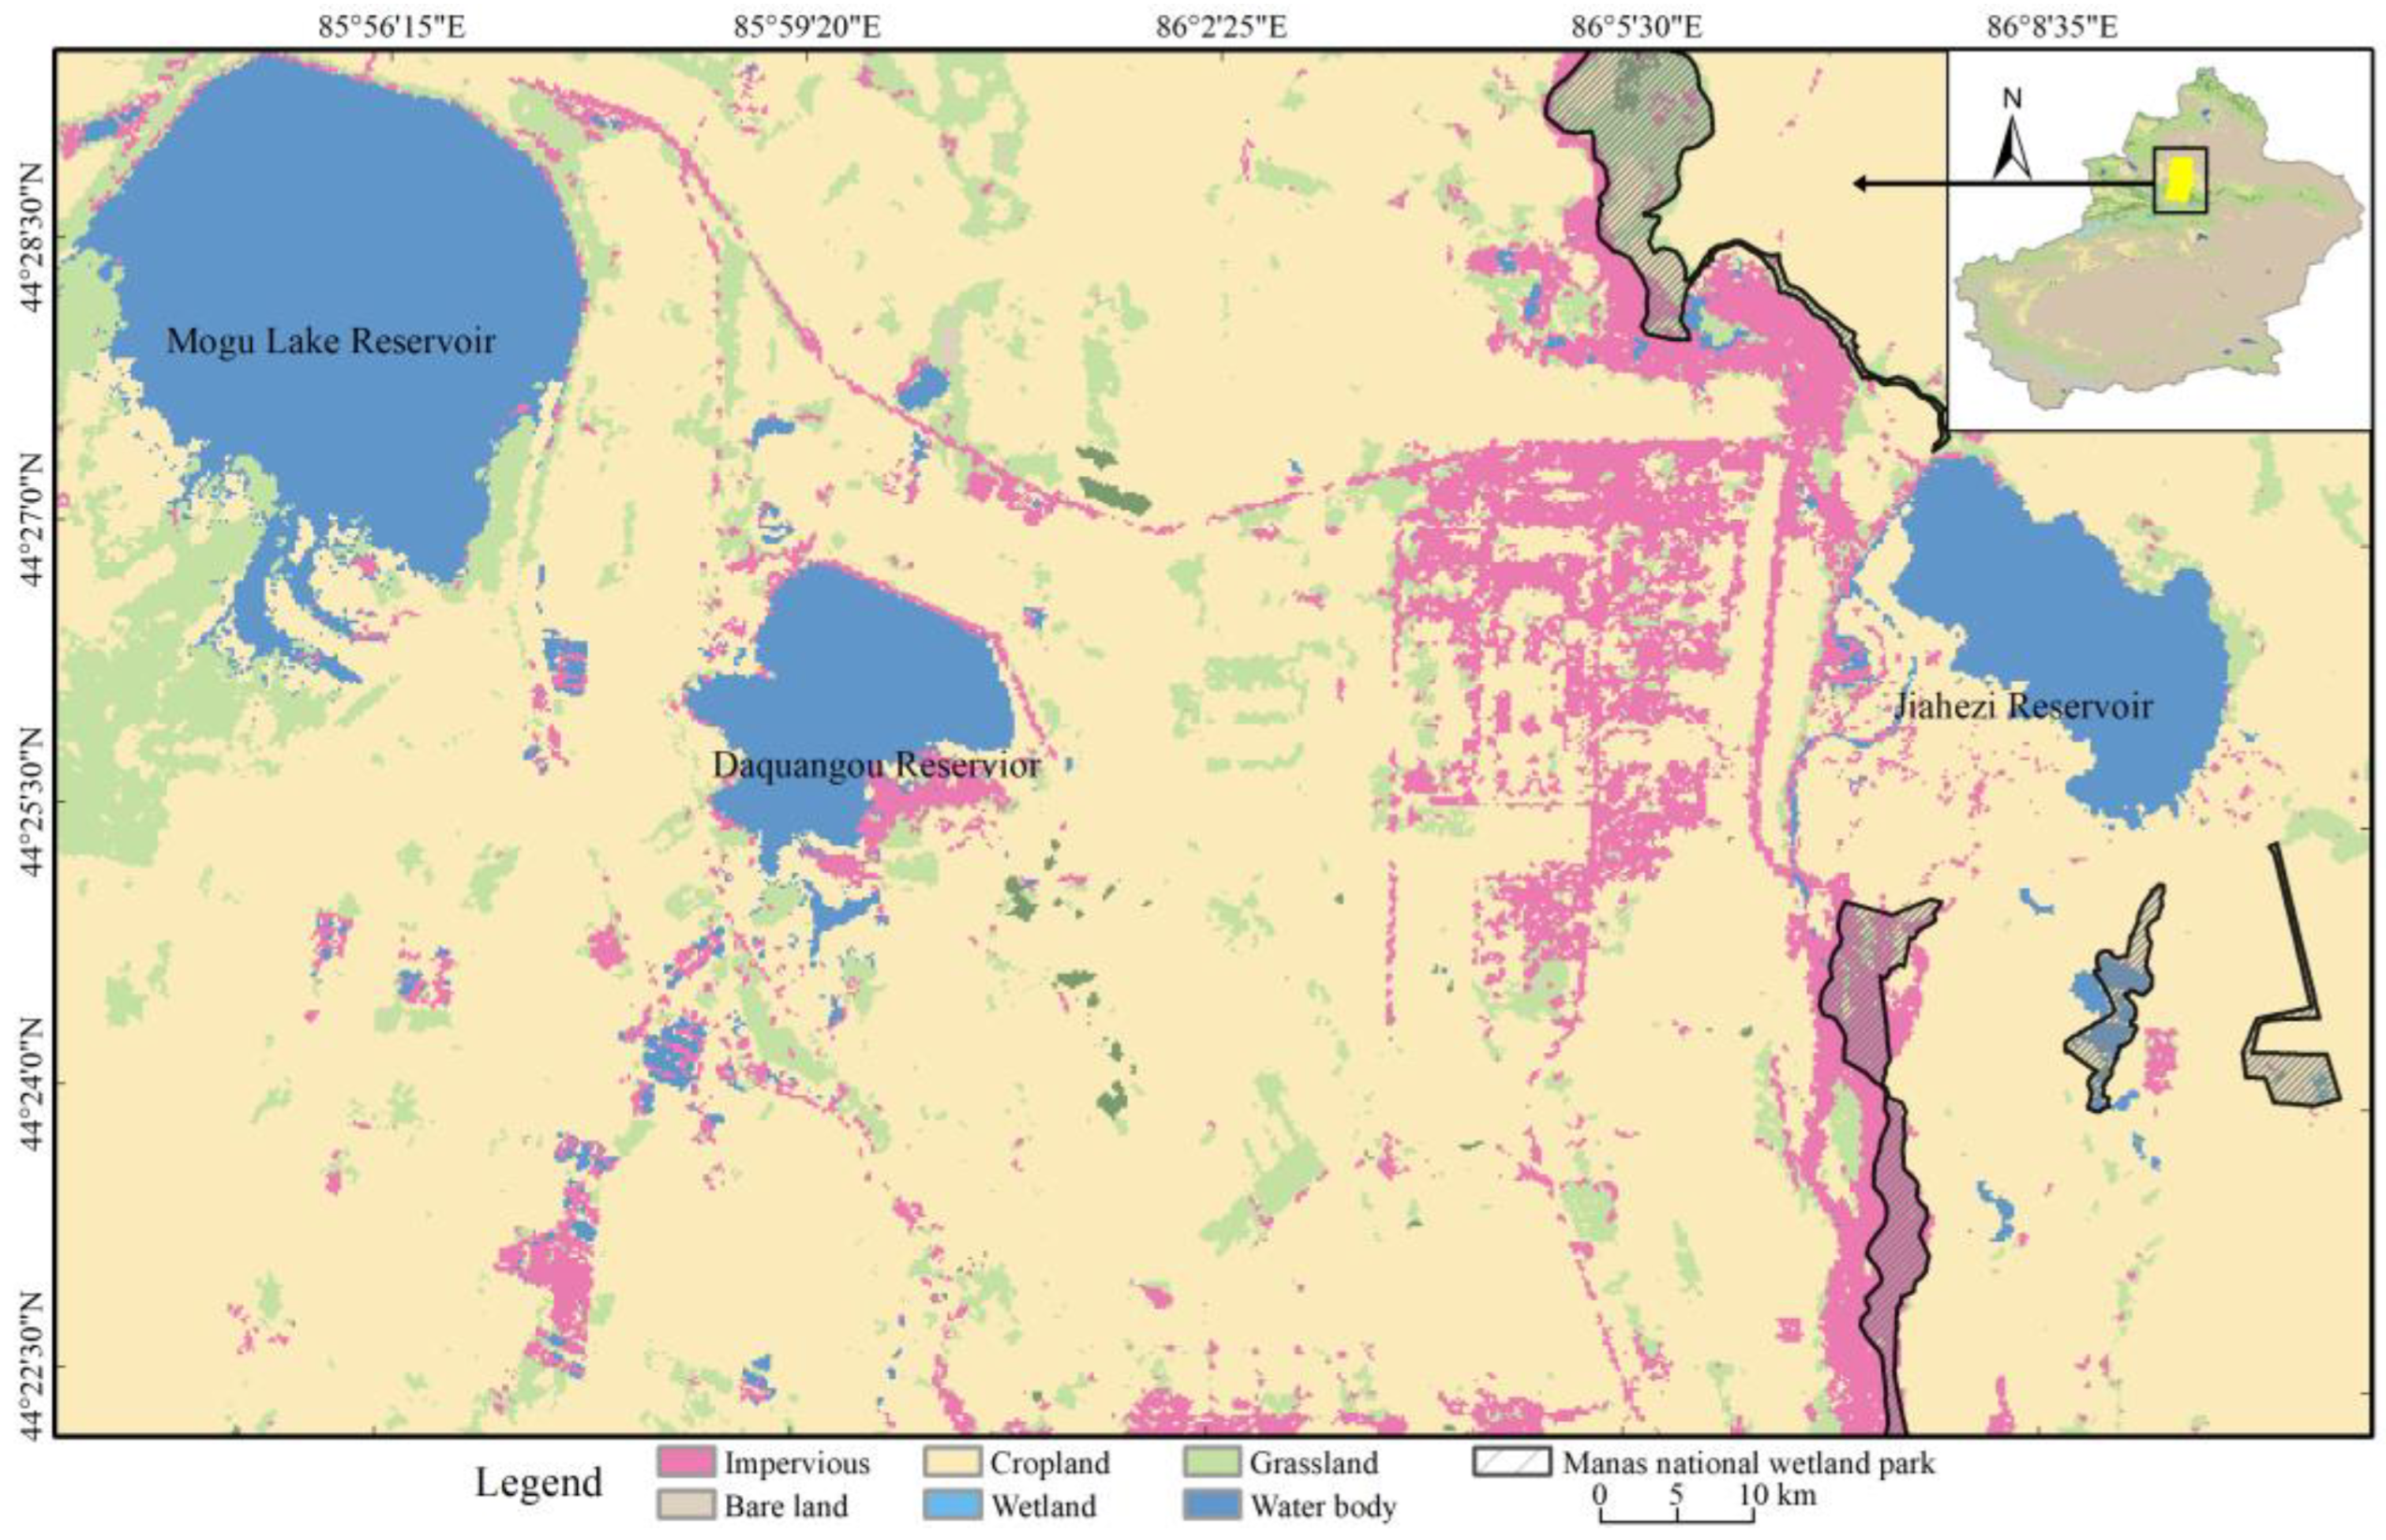
2.1. Study Area

Manas National Wetland Park (hereinafter referred to as the wetland park), situated at the northern base of the Tianshan Mountains within a temperate continental arid climate zone, experiences temperature notable variations, with cold winters and hot summers. The annual average temperature is 8.8 °C, with an average temperature of −20 °C in January. Manas National Wetland Park serves as an important stopover and sanctuary for migratory birds. Every year from September to November, in autumn, many migratory birds, such as the common crane, rest here, while the whooper swan winters here from October to the March of the following year [21,22,23] (Figure 1). To support wintering birds, the park’s management undertakes proactive ecological measures such as water replenishment and the cultivation of crops like wheat and alfalfa to ensure an abundant food supply. Moreover, in response to the freezing of a substantial portion of the wetland’s lakes during winter, supplementary feeding stations are established, providing essential sustenance like corn for the resident avifauna. To safeguard the avian inhabitants from illegal hunting, rigorous surveillance and patrol efforts are conducted in collaboration with forestry law enforcement.

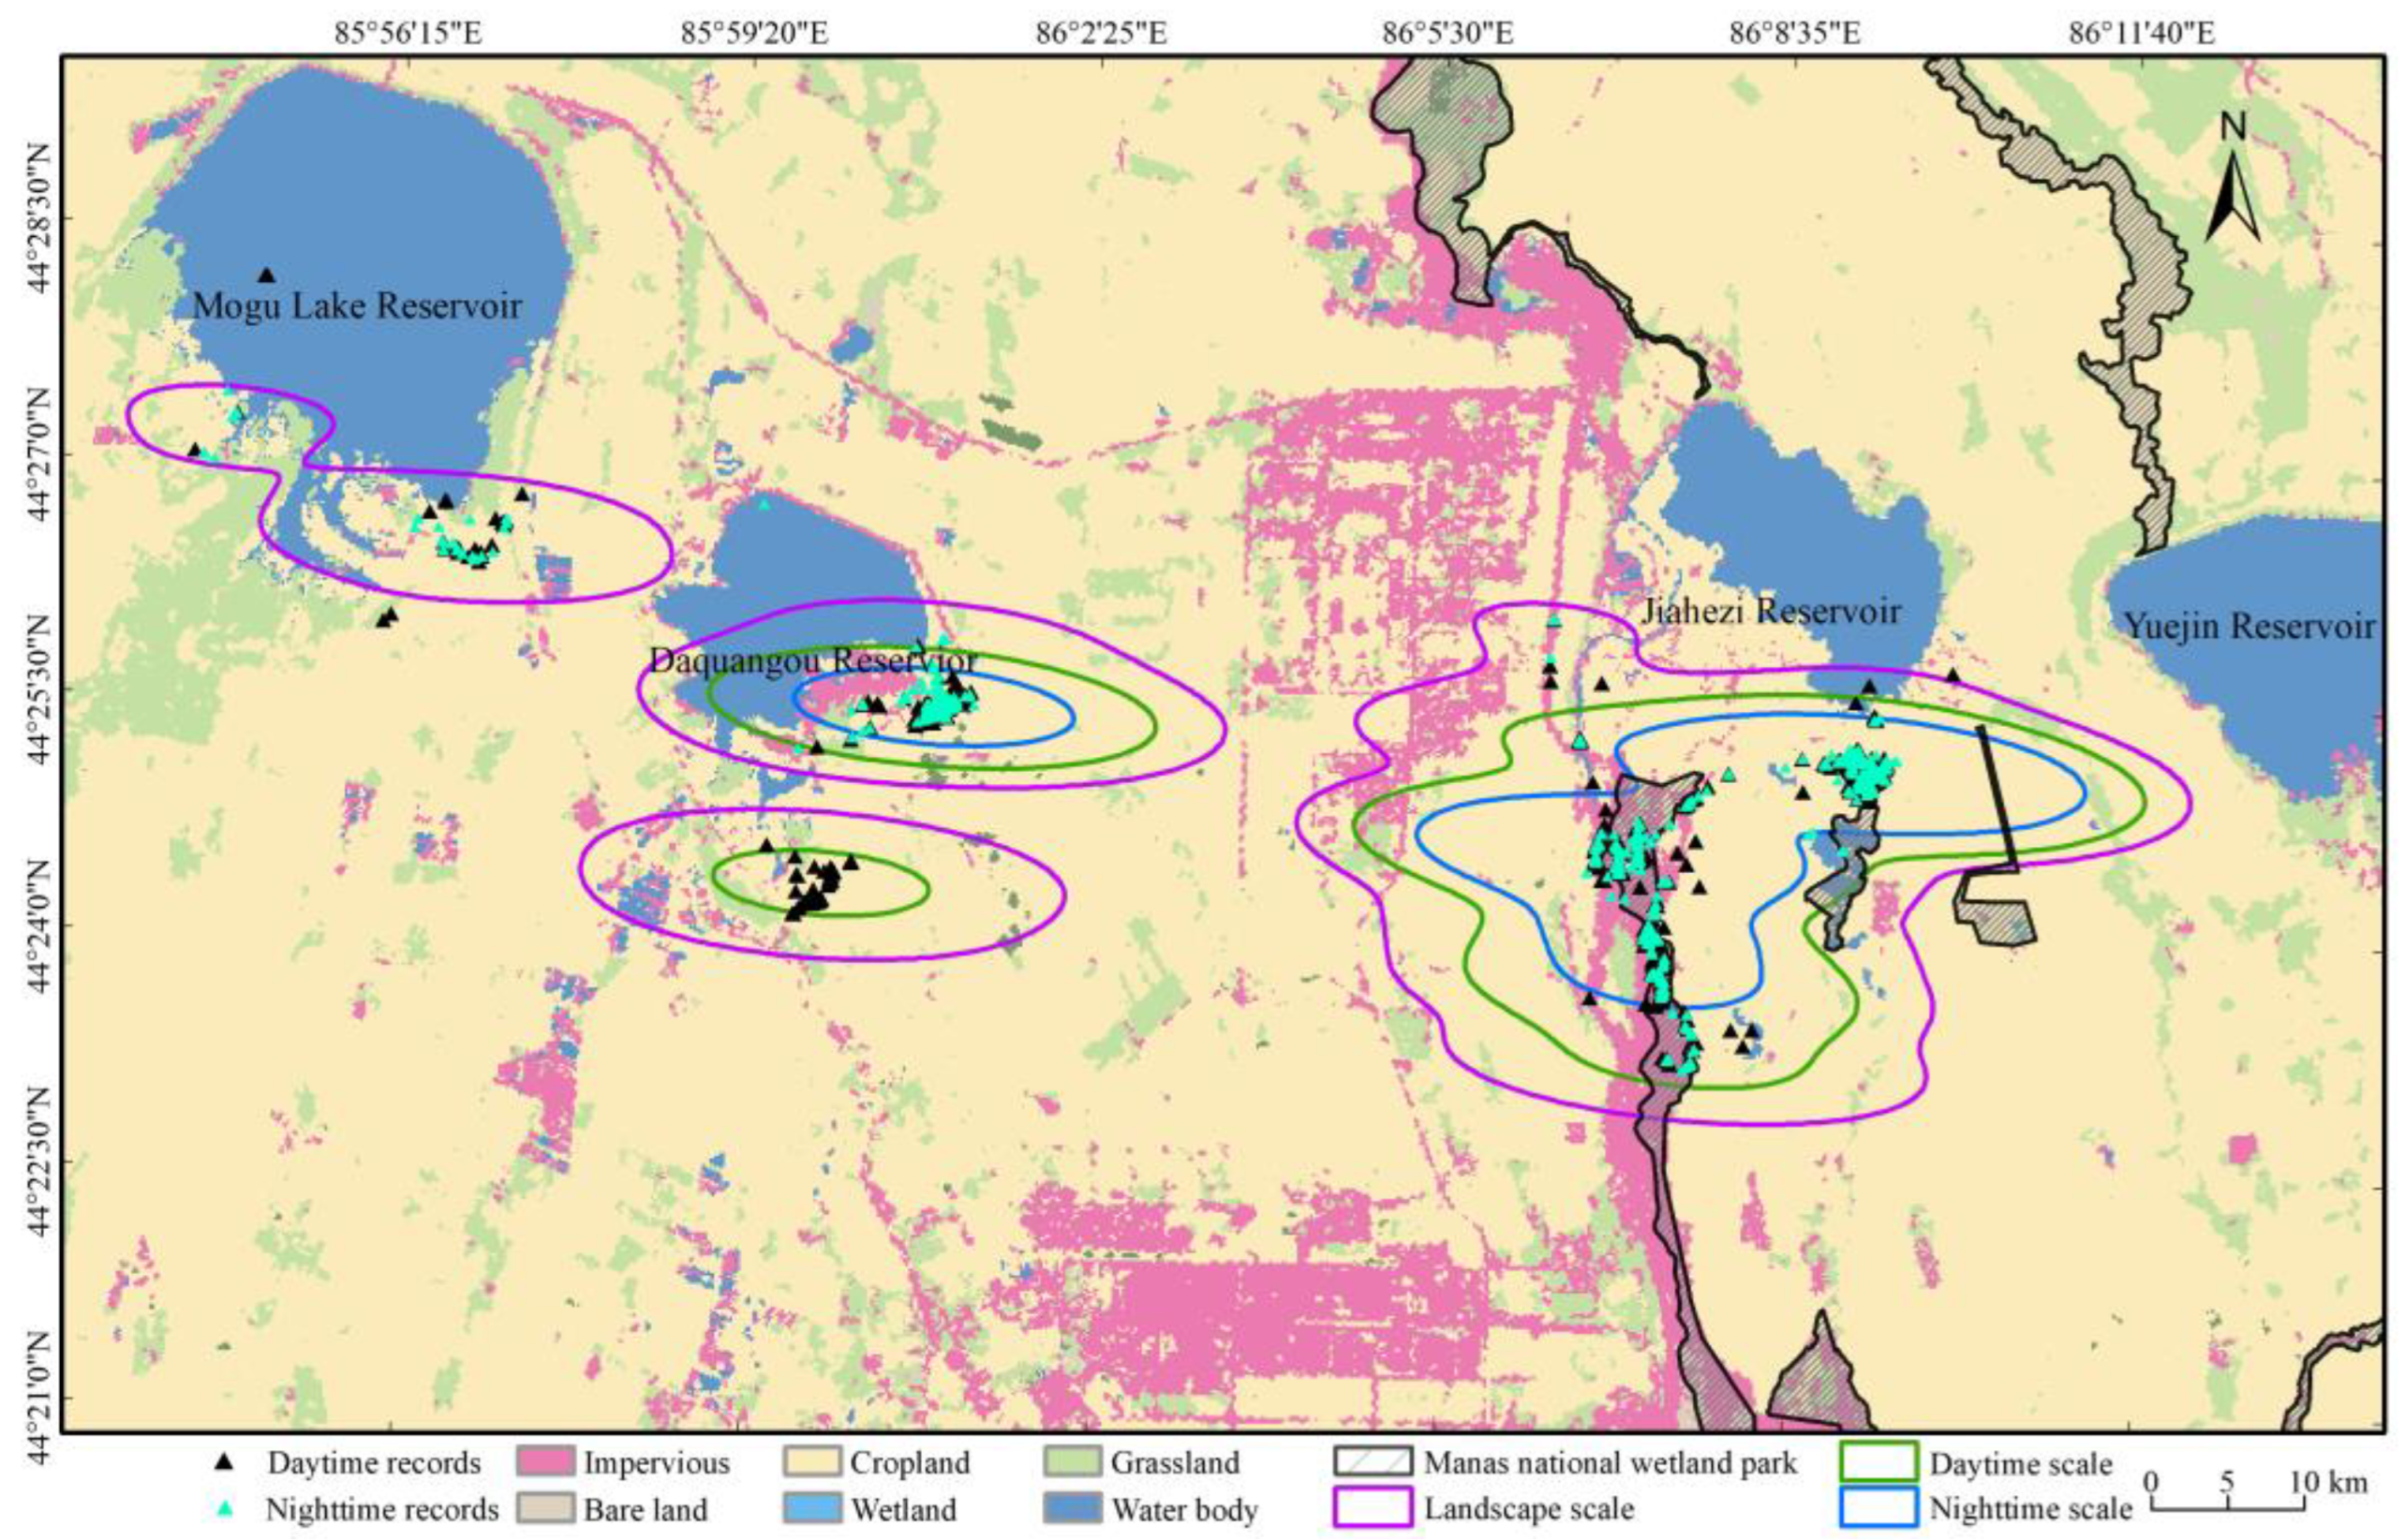
2.2. Bird Tracking Data

In January 2021, 22 whooper swans, including 12 adults and 10 juveniles, were captured by wetland park staff in Manas National Wetland Park using net-cage food traps. They were equipped with a 35 g solar-powered backpack data-logging GPS-GSM (Global Positioning System-Global System for Mobile Communications) tracking devices (constructed by Hunan Global Messenger Technology Co., Ltd., Changsha, Hunan, China). These devices had a weight that did not exceed 3% of the swans’ average body mass (35 g) and were programmed to log a location point every two hours, enabling the comprehensive monitoring of the swans’ movements and behaviors within the wetland park.
Due to the limited number of valid location points returned by some individuals, only 9 individuals with over 100 location points were retained for further analysis, including 5 adults and 4 juveniles. Field observations indicate that these 9 whooper swans belong to different family groups. Among them, the tracking time for ID2196 and ID2239 was less than 15 days due to satellite acquisition failure or low battery level; the remaining individuals were tracked for 13 to 33 days. After excluding the satellite tracking points from the first week and the points where the whooper swans left their wintering sites, location points with positioning accuracy ≤ 30 m (accuracy grades A (±5 m), B (±10 m), and C (±20 m)) were collected for subsequent data analysis, resulting in a total of 3357 location points for the 9 whooper swans (Table 1).
The kernel density estimation method assumes independent and identically distributed location data but fails to account for autocorrelation in location data, resulting in an underestimation of home ranges [24]. However, the autocorrelated kernel density estimation (AKDE) method can efficiently deal with locality autocorrelation and provide accurate confidence intervals, producing realistic home range sizes. We used all locations to calculate the home range using the R ctmm package [25].

2.3. Radius of the Landscape, Daytime, and Nighttime Scales

We used the Suncalc algorithm to obtain sunrise and sunset times at the tracking locations based on the positioning date and coordinates of satellite tracking points. Subsequently, we categorized the points as daytime or nighttime based on their positioning times. This method can be implemented using the ‘tod’ function in the R package ‘amt’ [26].
Whooper swans engage in foraging during the day and resting at night, with low levels of activity levels, and exhibit distinct activity patterns characterized by clustered distributions during the winter [13]. Leveraging a methodology akin to the white-rumped swallow, in which daytime activities signify daytime and nighttime activities denote roosting, we applied the autocorrelated kernel density estimation (AKDE) home range model to conduct landscape-scale, nighttime-scale, and daytime-scale analyses [10,27].
The optimal value for the selection of percentage volume contours varies among scales and species [10]. Thus, based on visual inspection of our data, 99%, 90%, and 75% isopleths of utilization distribution were adopted to represent the areas used at the landscape, foraging, and roosting scales.
Through the utilization of home range distribution analysis, we delineated scale ranges encompassing all points, daytime points, and nighttime points, and 99%, 90%, and 75% isopleths were used to represent the landscape, daytime, and nighttime scales, respectively [10]. The landscape scale denotes the potential distribution area, the daytime scale signifies the primary region of daytime activity, and the nighttime scale indicates the predominant resting site for whooper swans during the night (Figure 2).
The determination of the optimal scale for assessing environmental variables and their consequential biological responses remains a challenging endeavor, often marked by ambiguity [28]. Consequently, the significance of environmental factors is anticipated to vary across different scales [29]. The radius of the three scales were calculated based on the average radius of multiple utilization area patches at each scale using the Fragstats 4.2 software [30,31]. By determining the equivalent radius representing the average area of all patches at the landscape, daytime, and nighttime scales, we established the range for each scale [27]. Specifically, the landscape scale boasts a radius of 12.86 km, with gradient ranges of 10 km, 15 km, and 20 km; the daytime scale features a radius of 7.44 km, with gradient ranges of 6 km, 7 km, and 8 km; and the nighttime scale exhibits a radius of 2.23 km, with gradient ranges of 1 km, 2 km, and 3 km.

2.4. Environmental Data

Environmental temperature and precipitation are the main climatic factors limiting the distribution of overwintering whooper swans [32]. The average temperature and precipitation data for January to March 2021 in the northern region of Xinjiang were obtained from the China Meteorological Administration’s historical dataset of surface meteorological observations (https://data.cma.cn, accessed on 23 December 2023) at 36 meteorological stations [33]. To reduce interpolation errors, Anusplin meteorological interpolation software was used to conduct thin-plate spline interpolation on temperature and precipitation data from the 36 meteorological stations, with elevation data as a covariate, resulting in the average temperature and precipitation data for the northern region of Xinjiang from January to March 2021 at a spatial resolution of 30 m [34].
Land type data for the year 2021 were sourced from the Chinese National Glacier Permafrost Desert Scientific Data Center (http://www.ncdc.ac.cn, accessed on 6 December 2023), providing a comprehensive overview of China’s annual land cover and its temporal changes spanning from 1985 to 2022 at a spatial resolution of 30 m. Derived from the Landsat annual land cover product, these data underwent classification using a random forest classifier [35]. Land types, including cropland, forestland, grassland, shrubland, wetland (inland marshes, lake marshes, river wetlands), water bodies (rivers, lakes, reservoirs, ponds), impervious surfaces (roofs, river surfaces), and bare land were delineated through a series of image processing steps such as stitching, resampling, mask extraction, and analysis conducted within the ArcGIS platform. The administrative boundary layer of Xinjiang Province was sourced from the Resource and Environment Data Cloud Platform of the Institute of Geographic Sciences and Natural Resources Research, Chinese Academy of Sciences (http://www.resdc.cn, accessed on 1 August 2023). The Manas National Wetland Park layer was obtained from the National Earth System Science Data Center (http://www.geodata.cn, accessed on 6 March 2023). All variables were projected to WGS_1984_UTM_Zone45N and converted to ASCII format for input into the MaxEnt model.

2.5. Landscape Metrics

Species are not evenly distributed within habitat patches, and each species needs to select resource patches that are suitable for it. Therefore, when studying the relationship between species and habitat utilization, it is important to consider the landscape structure and composition of habitats and their connection to species [36]. Buffer radii for tracking points at different scales were delineated based on each scale gradient, and these buffer radii were obtained through buffer analysis using ArcGIS 10.5 software. All landscape indices were calculated using the moving window analysis method in Fragstats 4.2 software.
Landscape diversity reflects the types of landscapes, connectivity between patches, and functional diversity, and is a result of human activities and natural evolution, playing a crucial role in the transfer and transformation of matter and energy in landscape processes [37]. Key landscape metrics include the percentage of land cover types (pland), which represents the proportion of different land use patches in the landscape [38]. The density, shape, size, and connectivity of patches have significant impacts on animal foraging, movement, and food resource abundance [38]. The most important feature of patch shape is the edge effect, where patches with higher edge density exhibit greater biological richness [39]. Land type diversity is correlated with species diversity, with lower land type diversity corresponding to lower species diversity. For birds, adjacent patches within their movement range still exhibit optimal connectivity, as non-contiguous patches within their range [40].
Based on the life history characteristics of whooper swans and the land types of distribution points, distinct environmental variables were employed at various spatial scales. Various landscape indices and distances to each land type were incorporated into the model across three scales. The Euclidean distances of these variables were calculated using the spatial analyst tools function of ArcGIS 10.5 for each land type. Average temperature and precipitation in the study area were included as environmental variables at the landscape scale, while only four land use types—cropland, grassland, wetland, and water bodies—were considered at the nighttime scale, with corresponding landscape indices and distances to land types included in the model (Table 2).

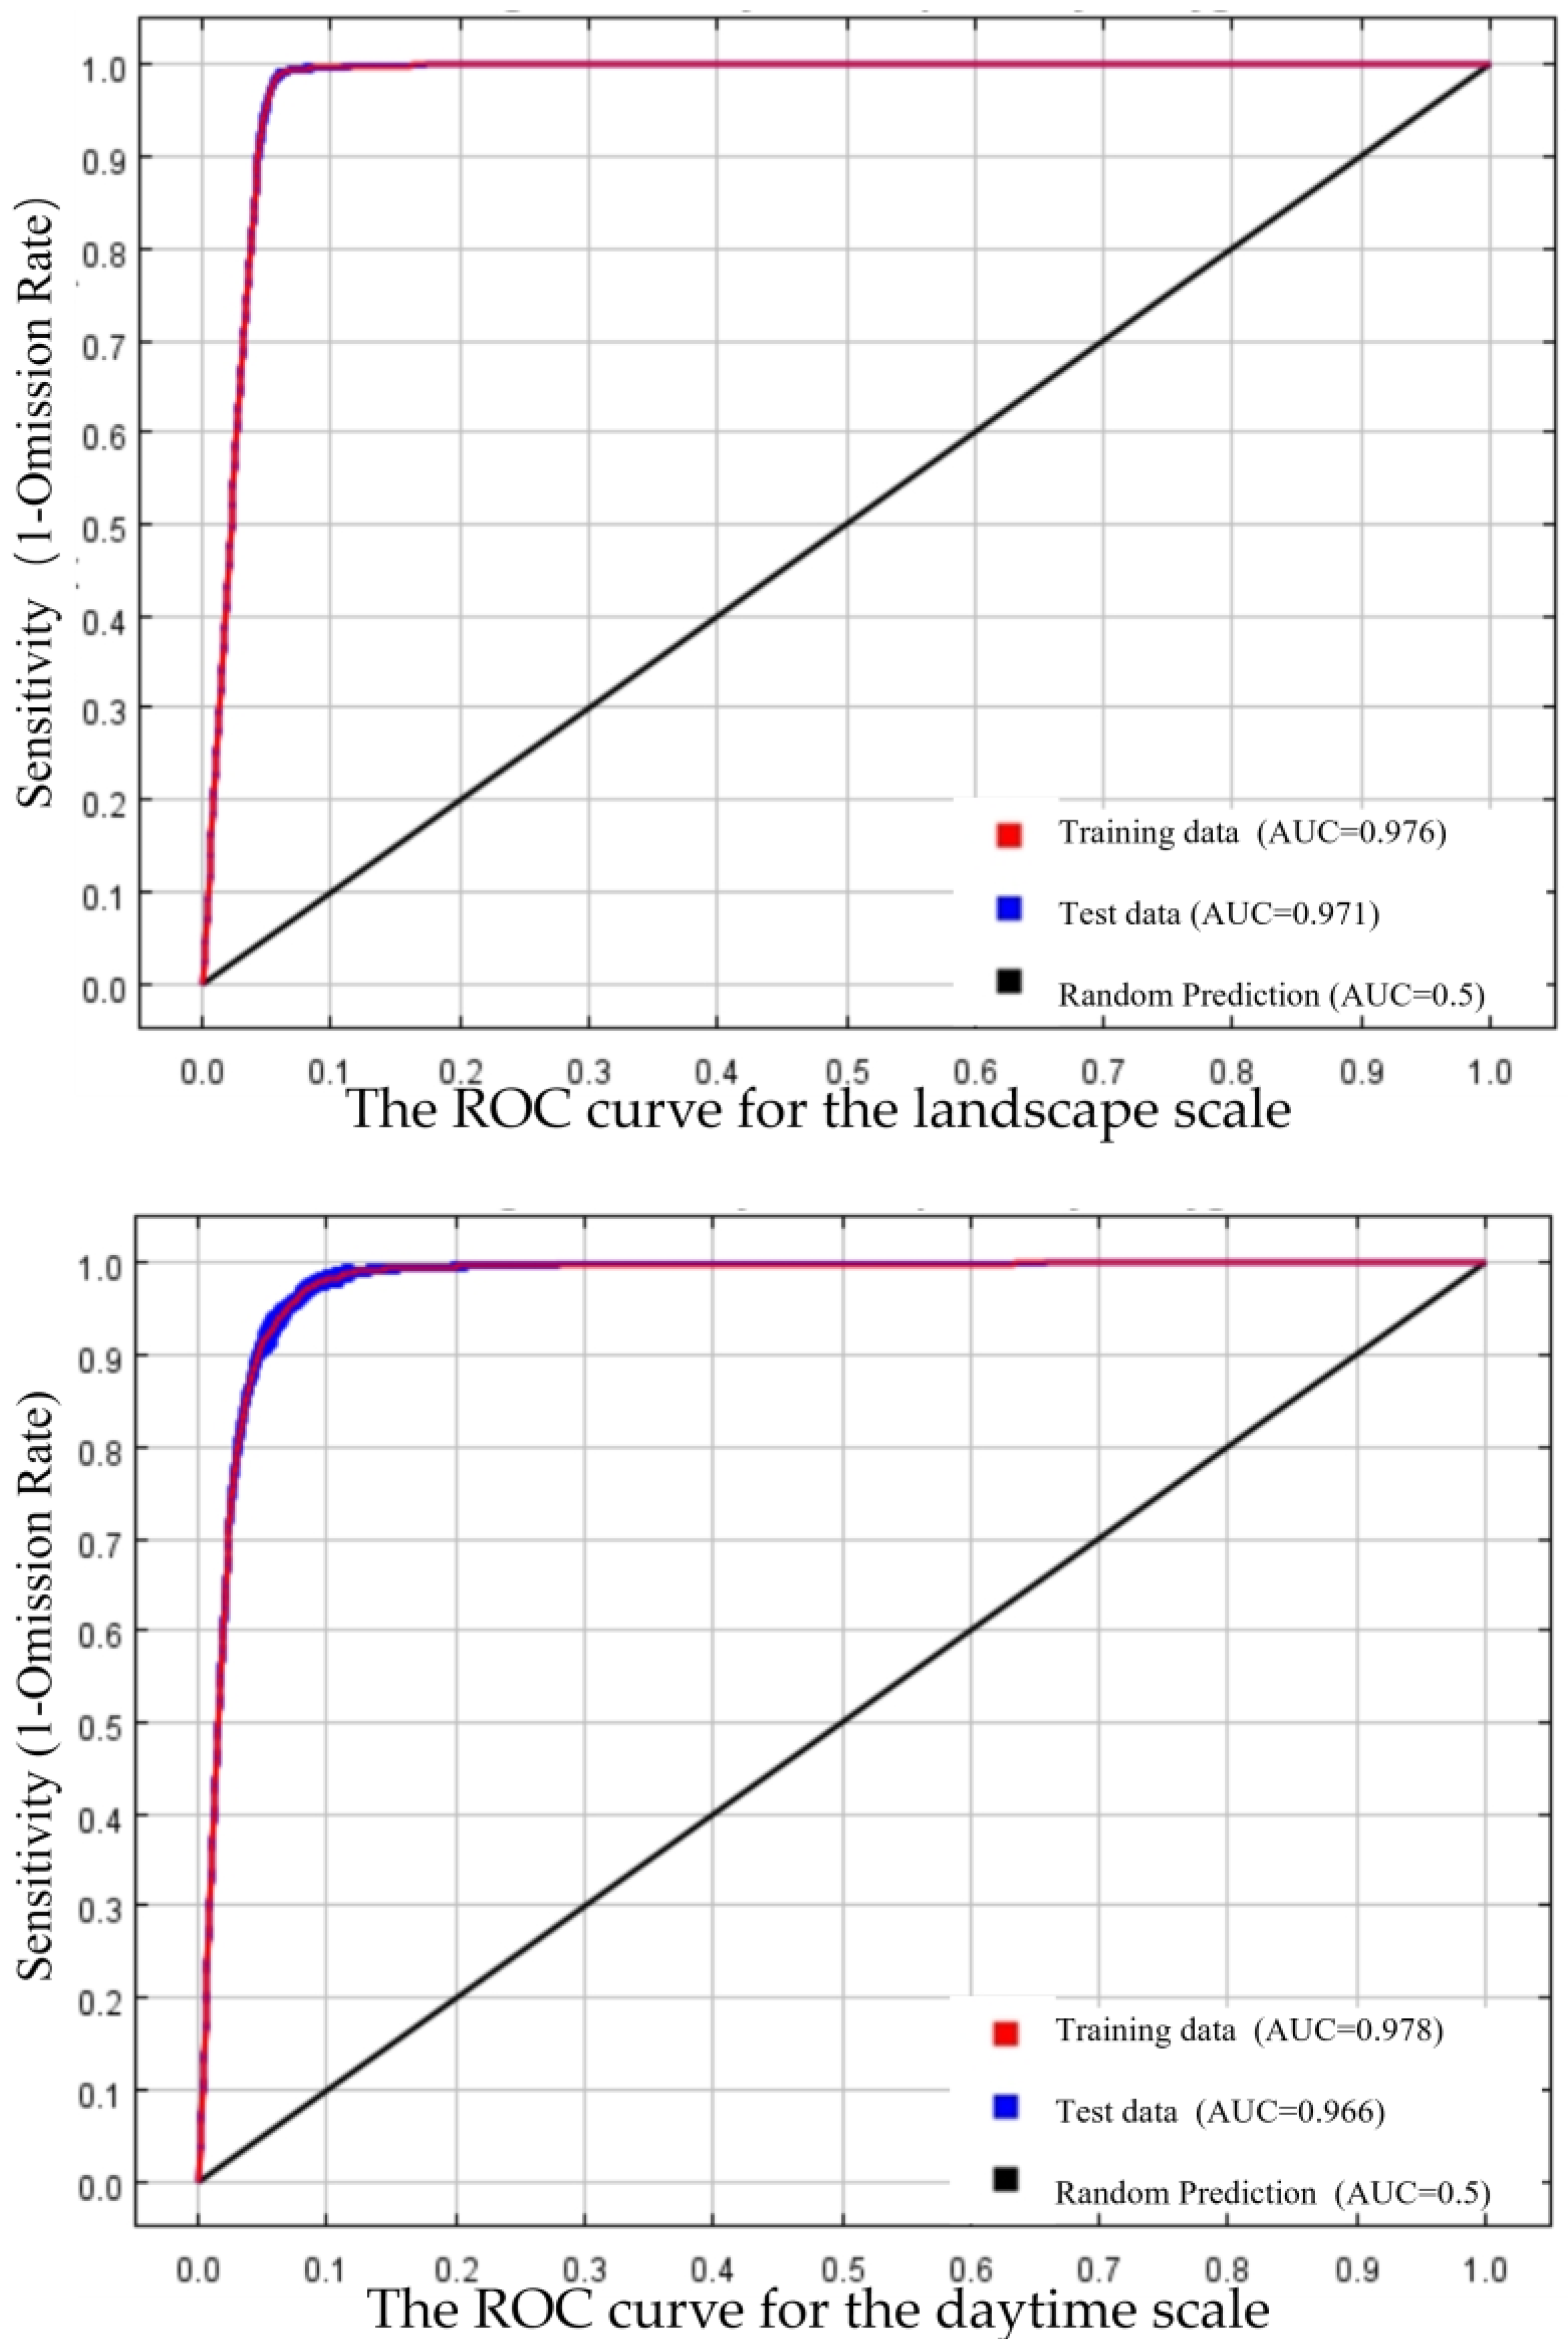
2.6. Habitat Selection Modeling

In this study, MaxEnt models were used to analyze habitat selection at three different scales, resulting in the construction of 9 model sets. Among these, three gradients at the landscape scale utilized all points as species distribution data, while for the daytime and nighttime scales, daytime and nighttime points, respectively, were used for modeling. To address multicollinearity among environmental factors, the Variance Inflation Factor (VIF) from the usdm package in R was employed for testing [41]. A VIF exceeding 10 indicates highly correlated variables [42], and these variables were progressively eliminated using the vifstep function to select variables with a VIF less than 10 for modeling. To minimize pseudoreplication and match the resolution of the species distribution points with that environmental variables, duplicate points that overlapped within the same 30 × 30 m2 pixel were removed to prevent pseudoreplication using the spThin package [43].
In terms of model parameters, 10,000 random points were selected as background values. Each model underwent 1000 iterations, and 20 bootstrapping resamples were performed. For each model, 25% of the distribution points were chosen as a validation set, and the receiver operating characteristic (ROC) curve was used to evaluate model performance, with the area under the curve (AUC) used to select the optimal gradient model. Finally, the Jackknife method was employed to validate the importance of each ecological factor.

3. Results

3.1. Partitioning of Different Scale Radii

The evaluation of gradient models at various scales using the area under the receiver operating characteristic curve (AUC) resulted in the optimal gradient for the landscape scale being 15 km, 8 km for the daytime scale, and 3 km for the nighttime scale, with AUC values exceeding 0.9 for each scale, indicating excellent predictive capabilities of all scale models (Table 3, Figure 3).
Variable importance testing utilizing the Jackknife method elucidated a significant impact of various environmental variables on the habitat selection of wintering whooper swans, as illustrated in Figure 4. At the landscape scale, key factors influencing habitat selection encompassed distance to wetlands, average precipitation, distance to water bodies, and average temperature, collectively contributing 71.1% of the model. At the daytime scale, variables including distance to wetlands, distance to water bodies, water body dispersion, and distance to bare land emerged as pivotal, accounting for 57.5% of the model’s explanatory power. Similarly, at the nighttime scale, factors such as distance to wetlands, distance to water bodies, and water body dispersion played a crucial role, contributing 62.8% of the model’s predictive capacity (Figure 4).

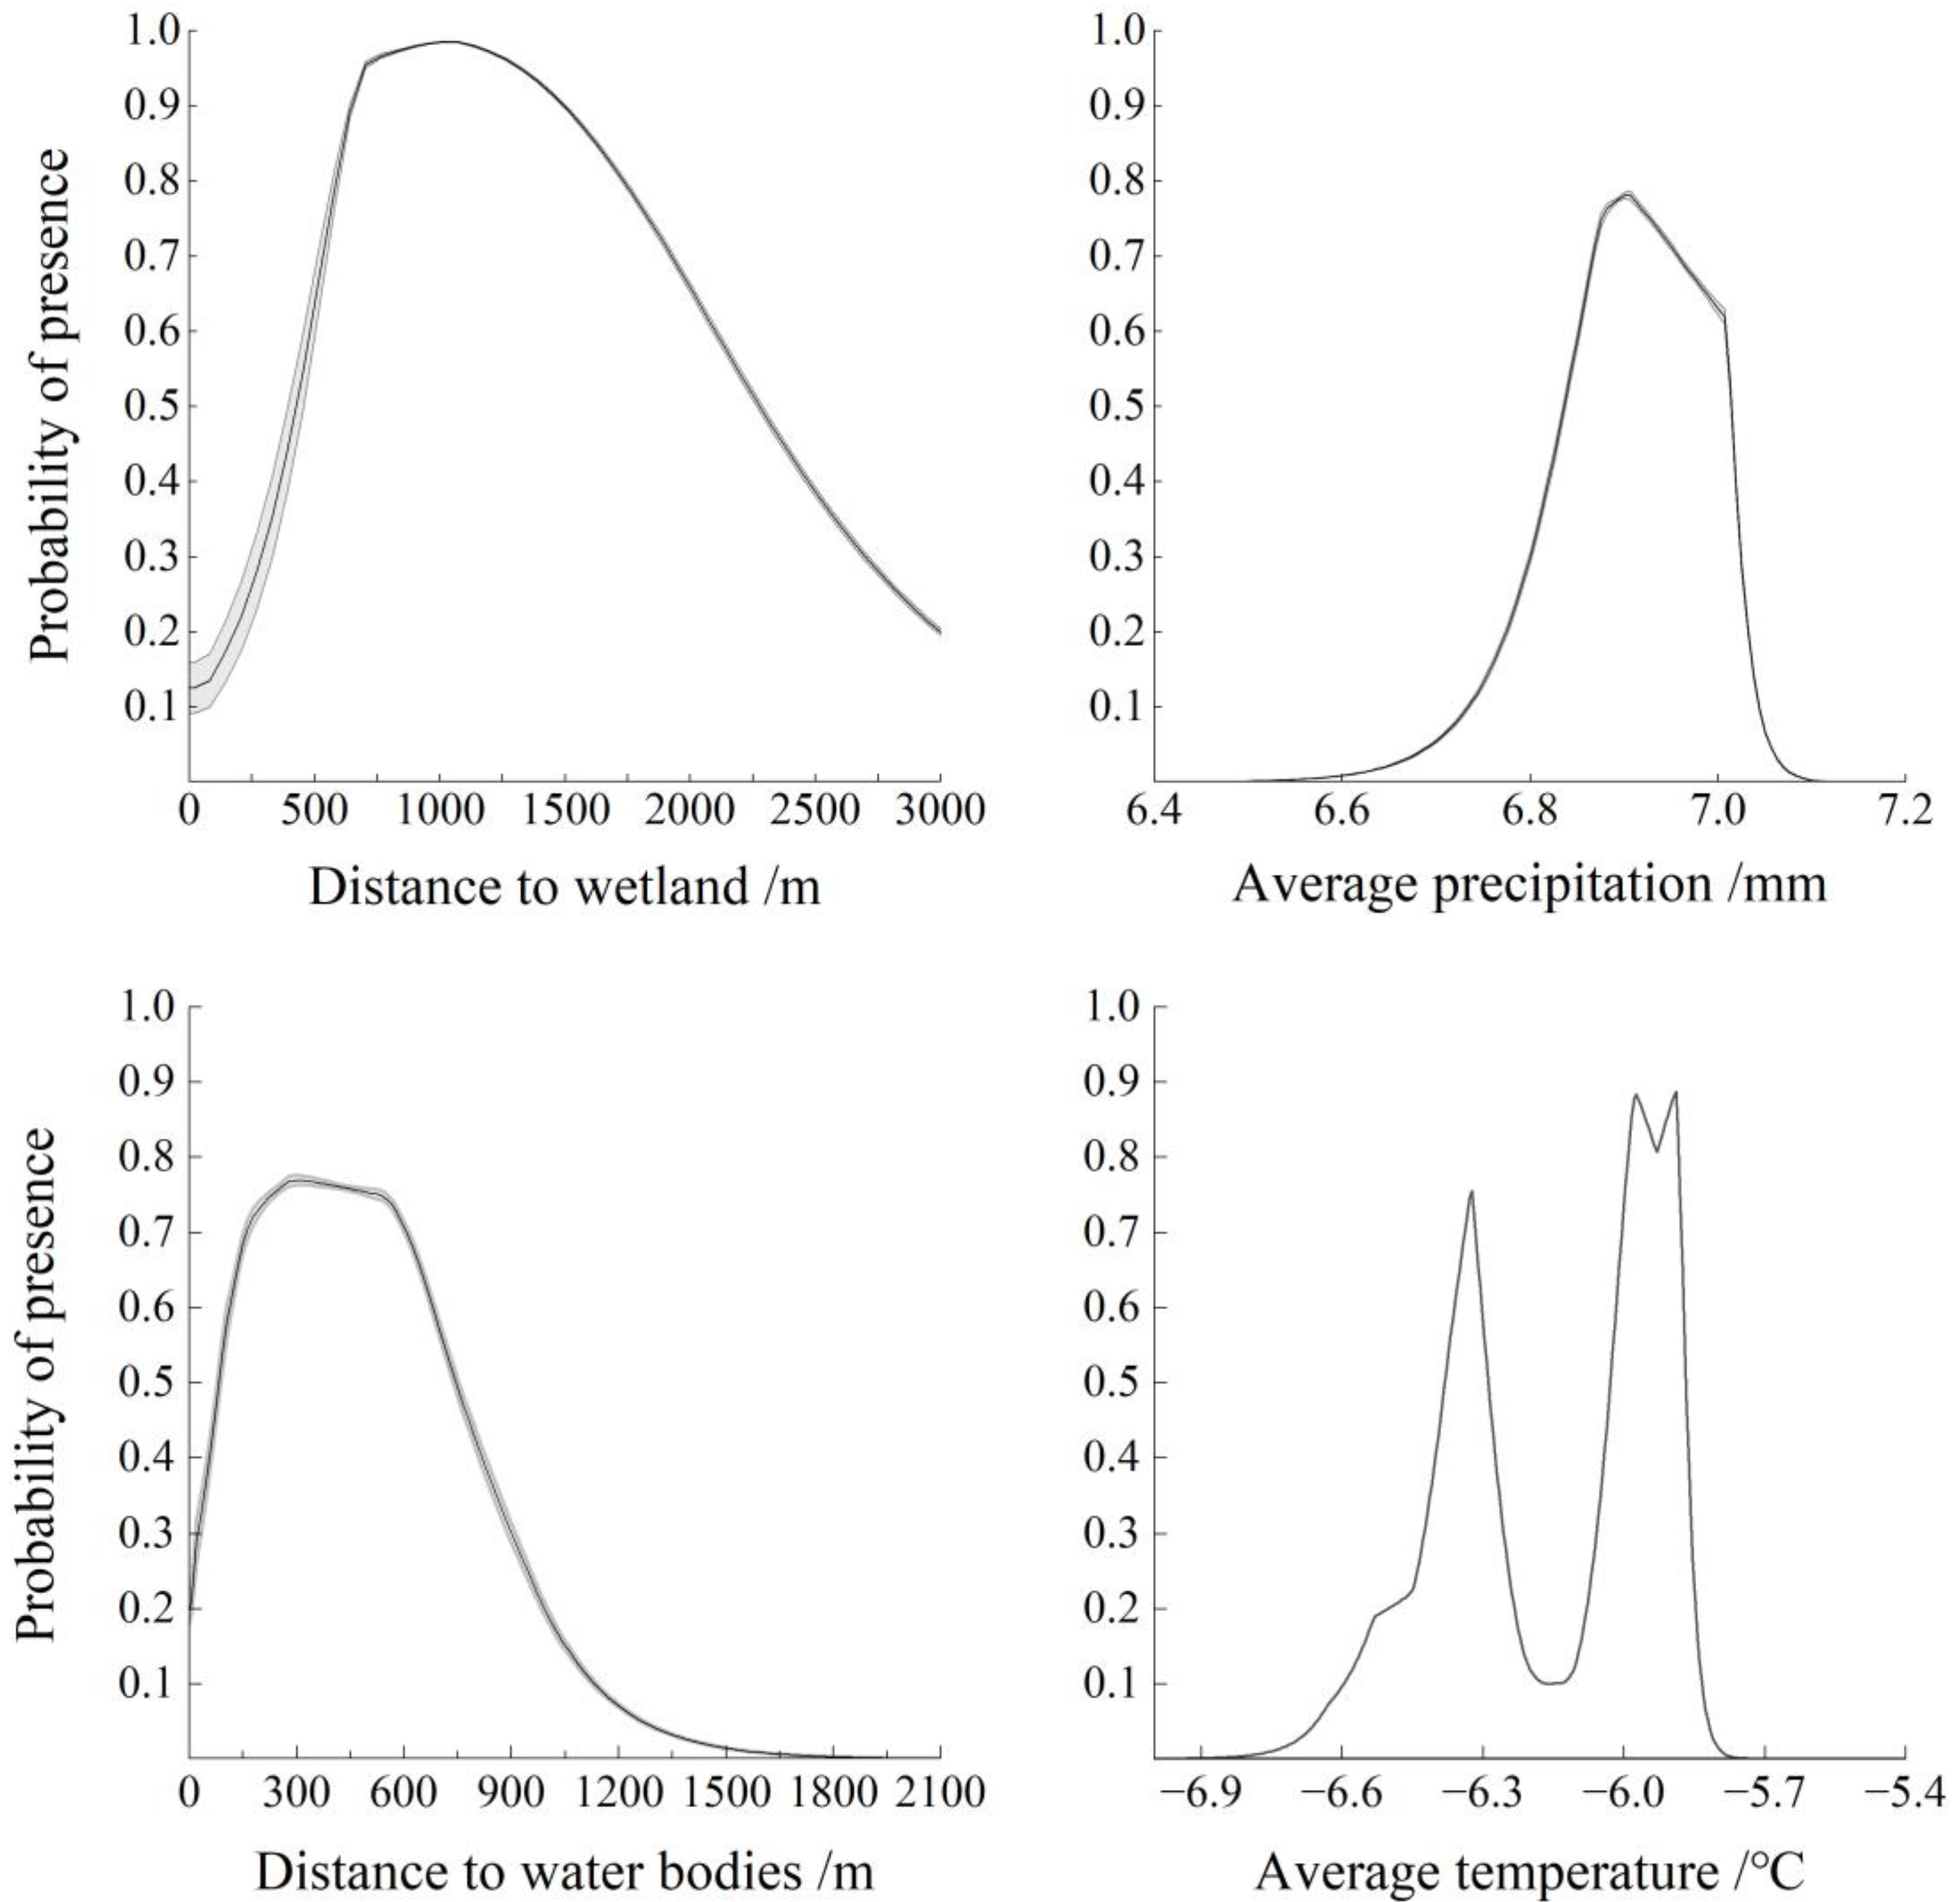
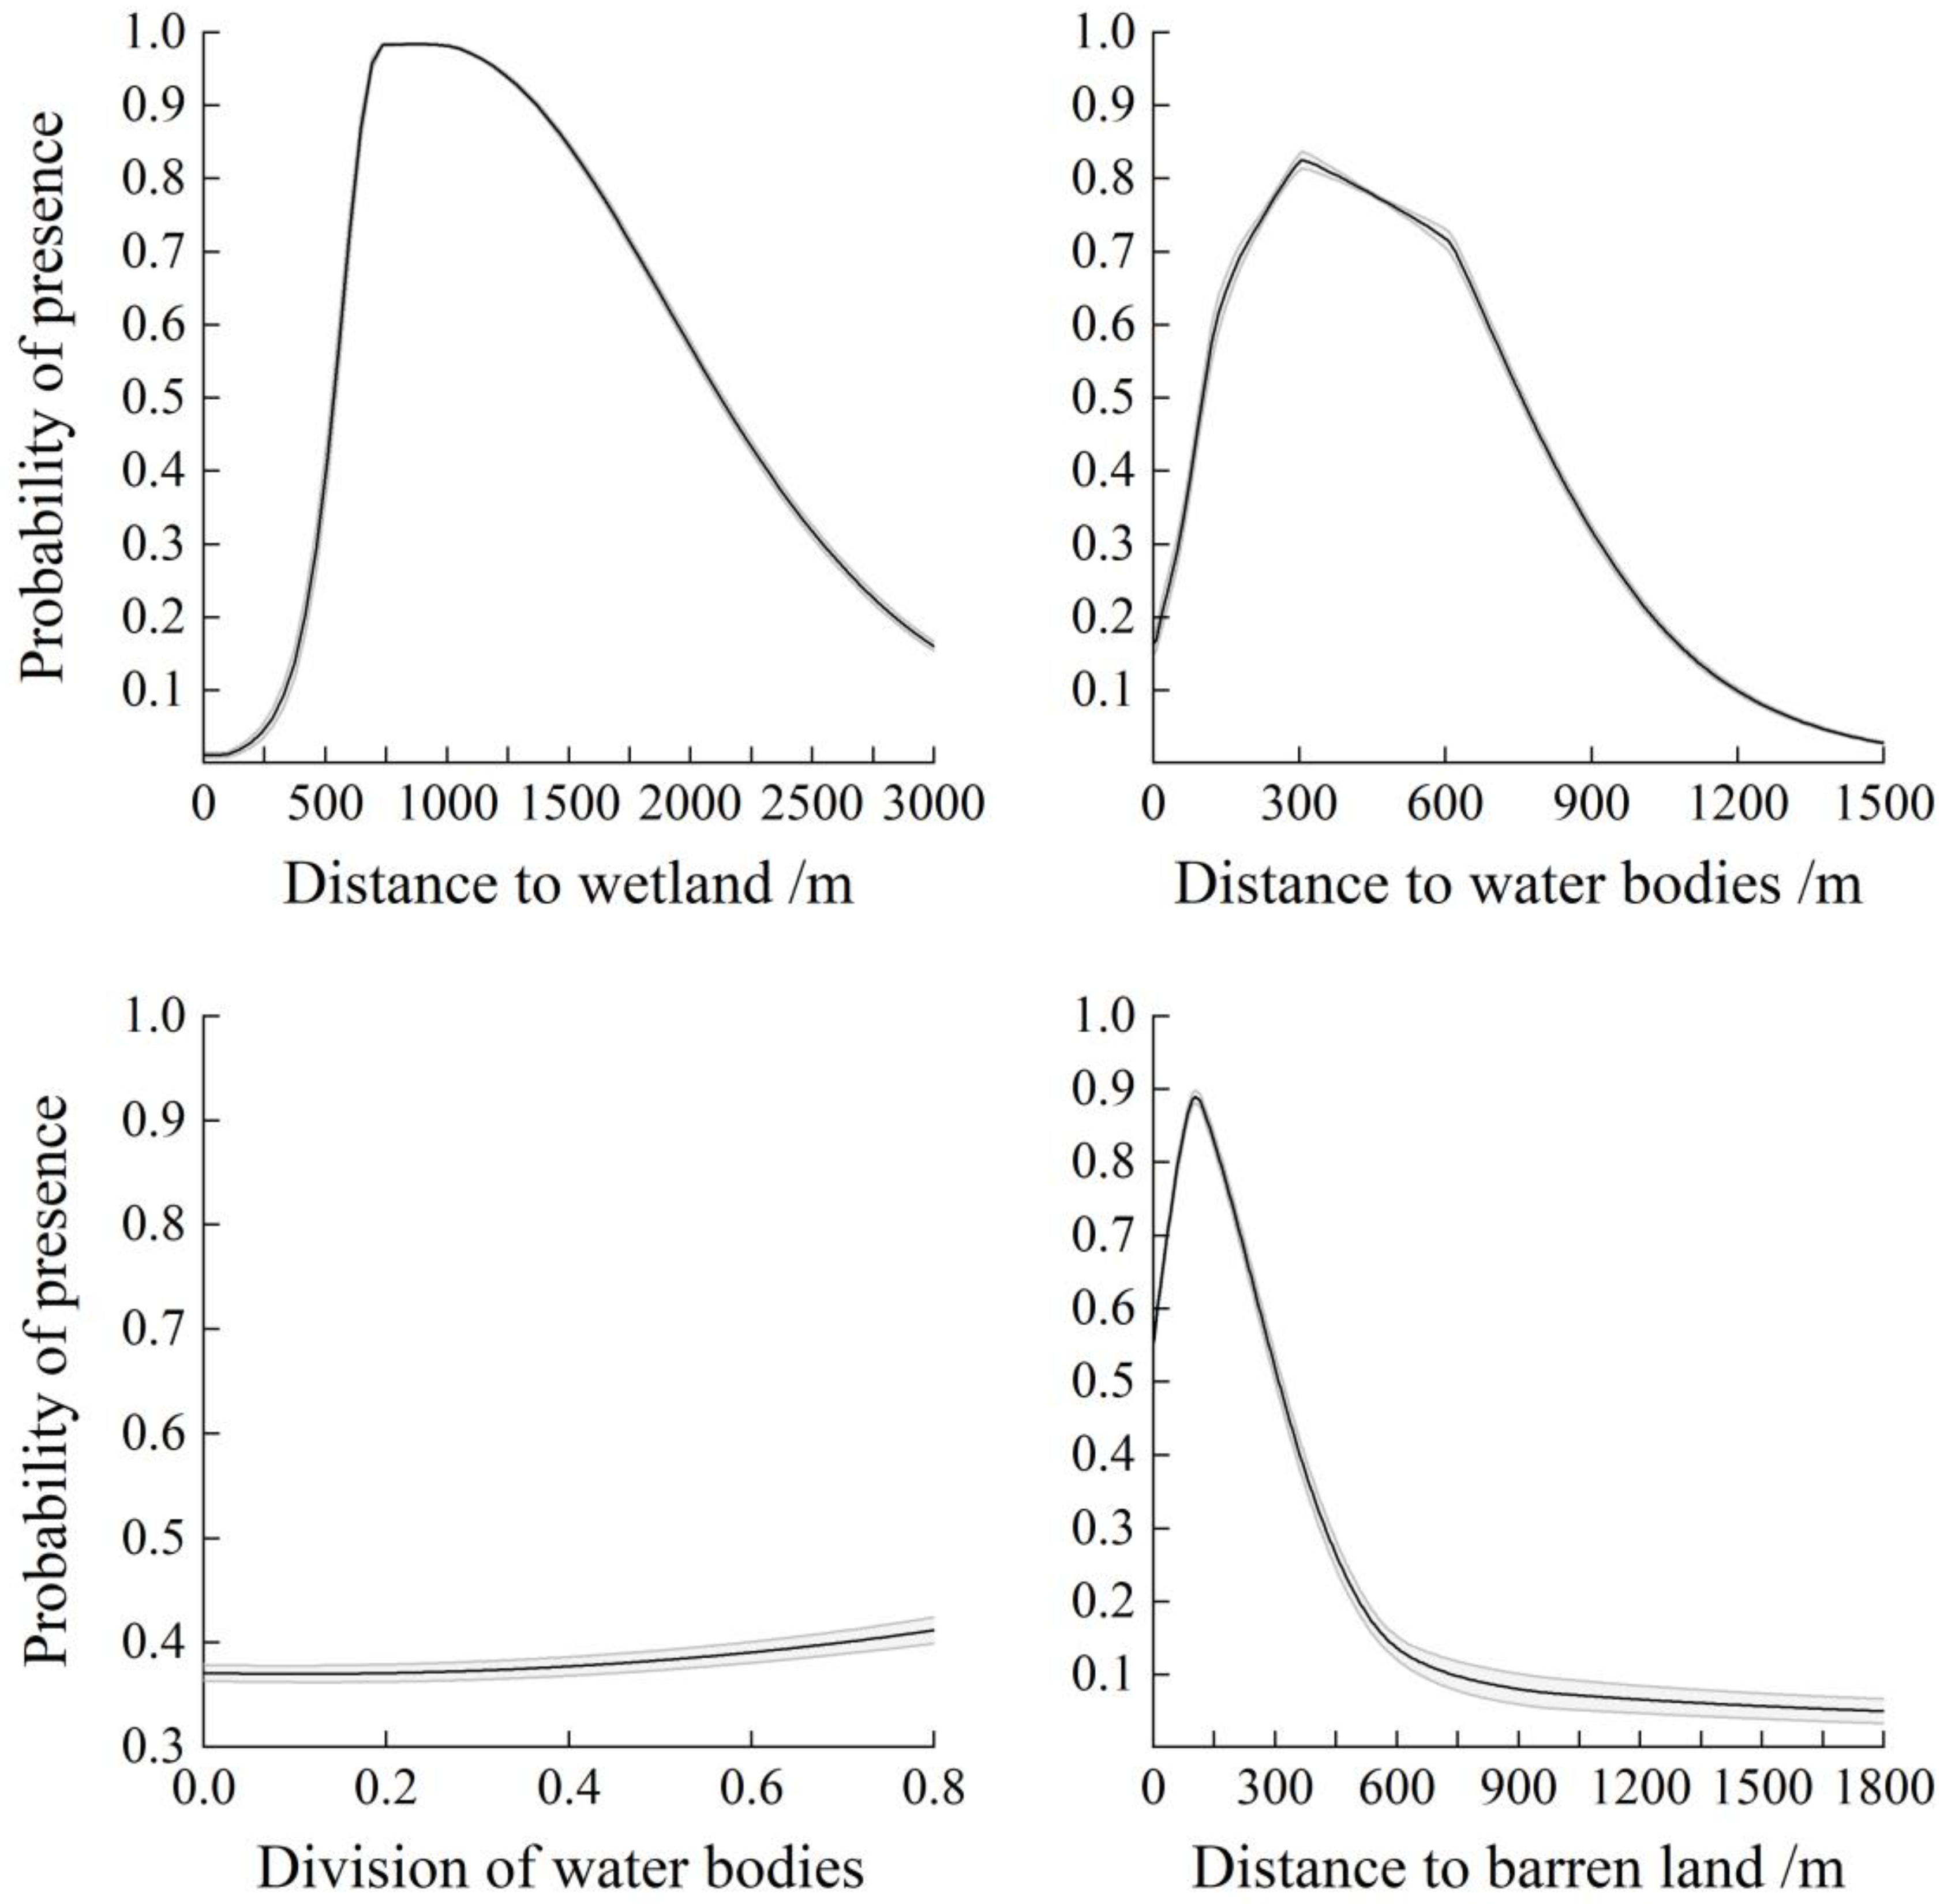
3.2. Habitat Selection of Wintering Whooper Swans at Different Scales

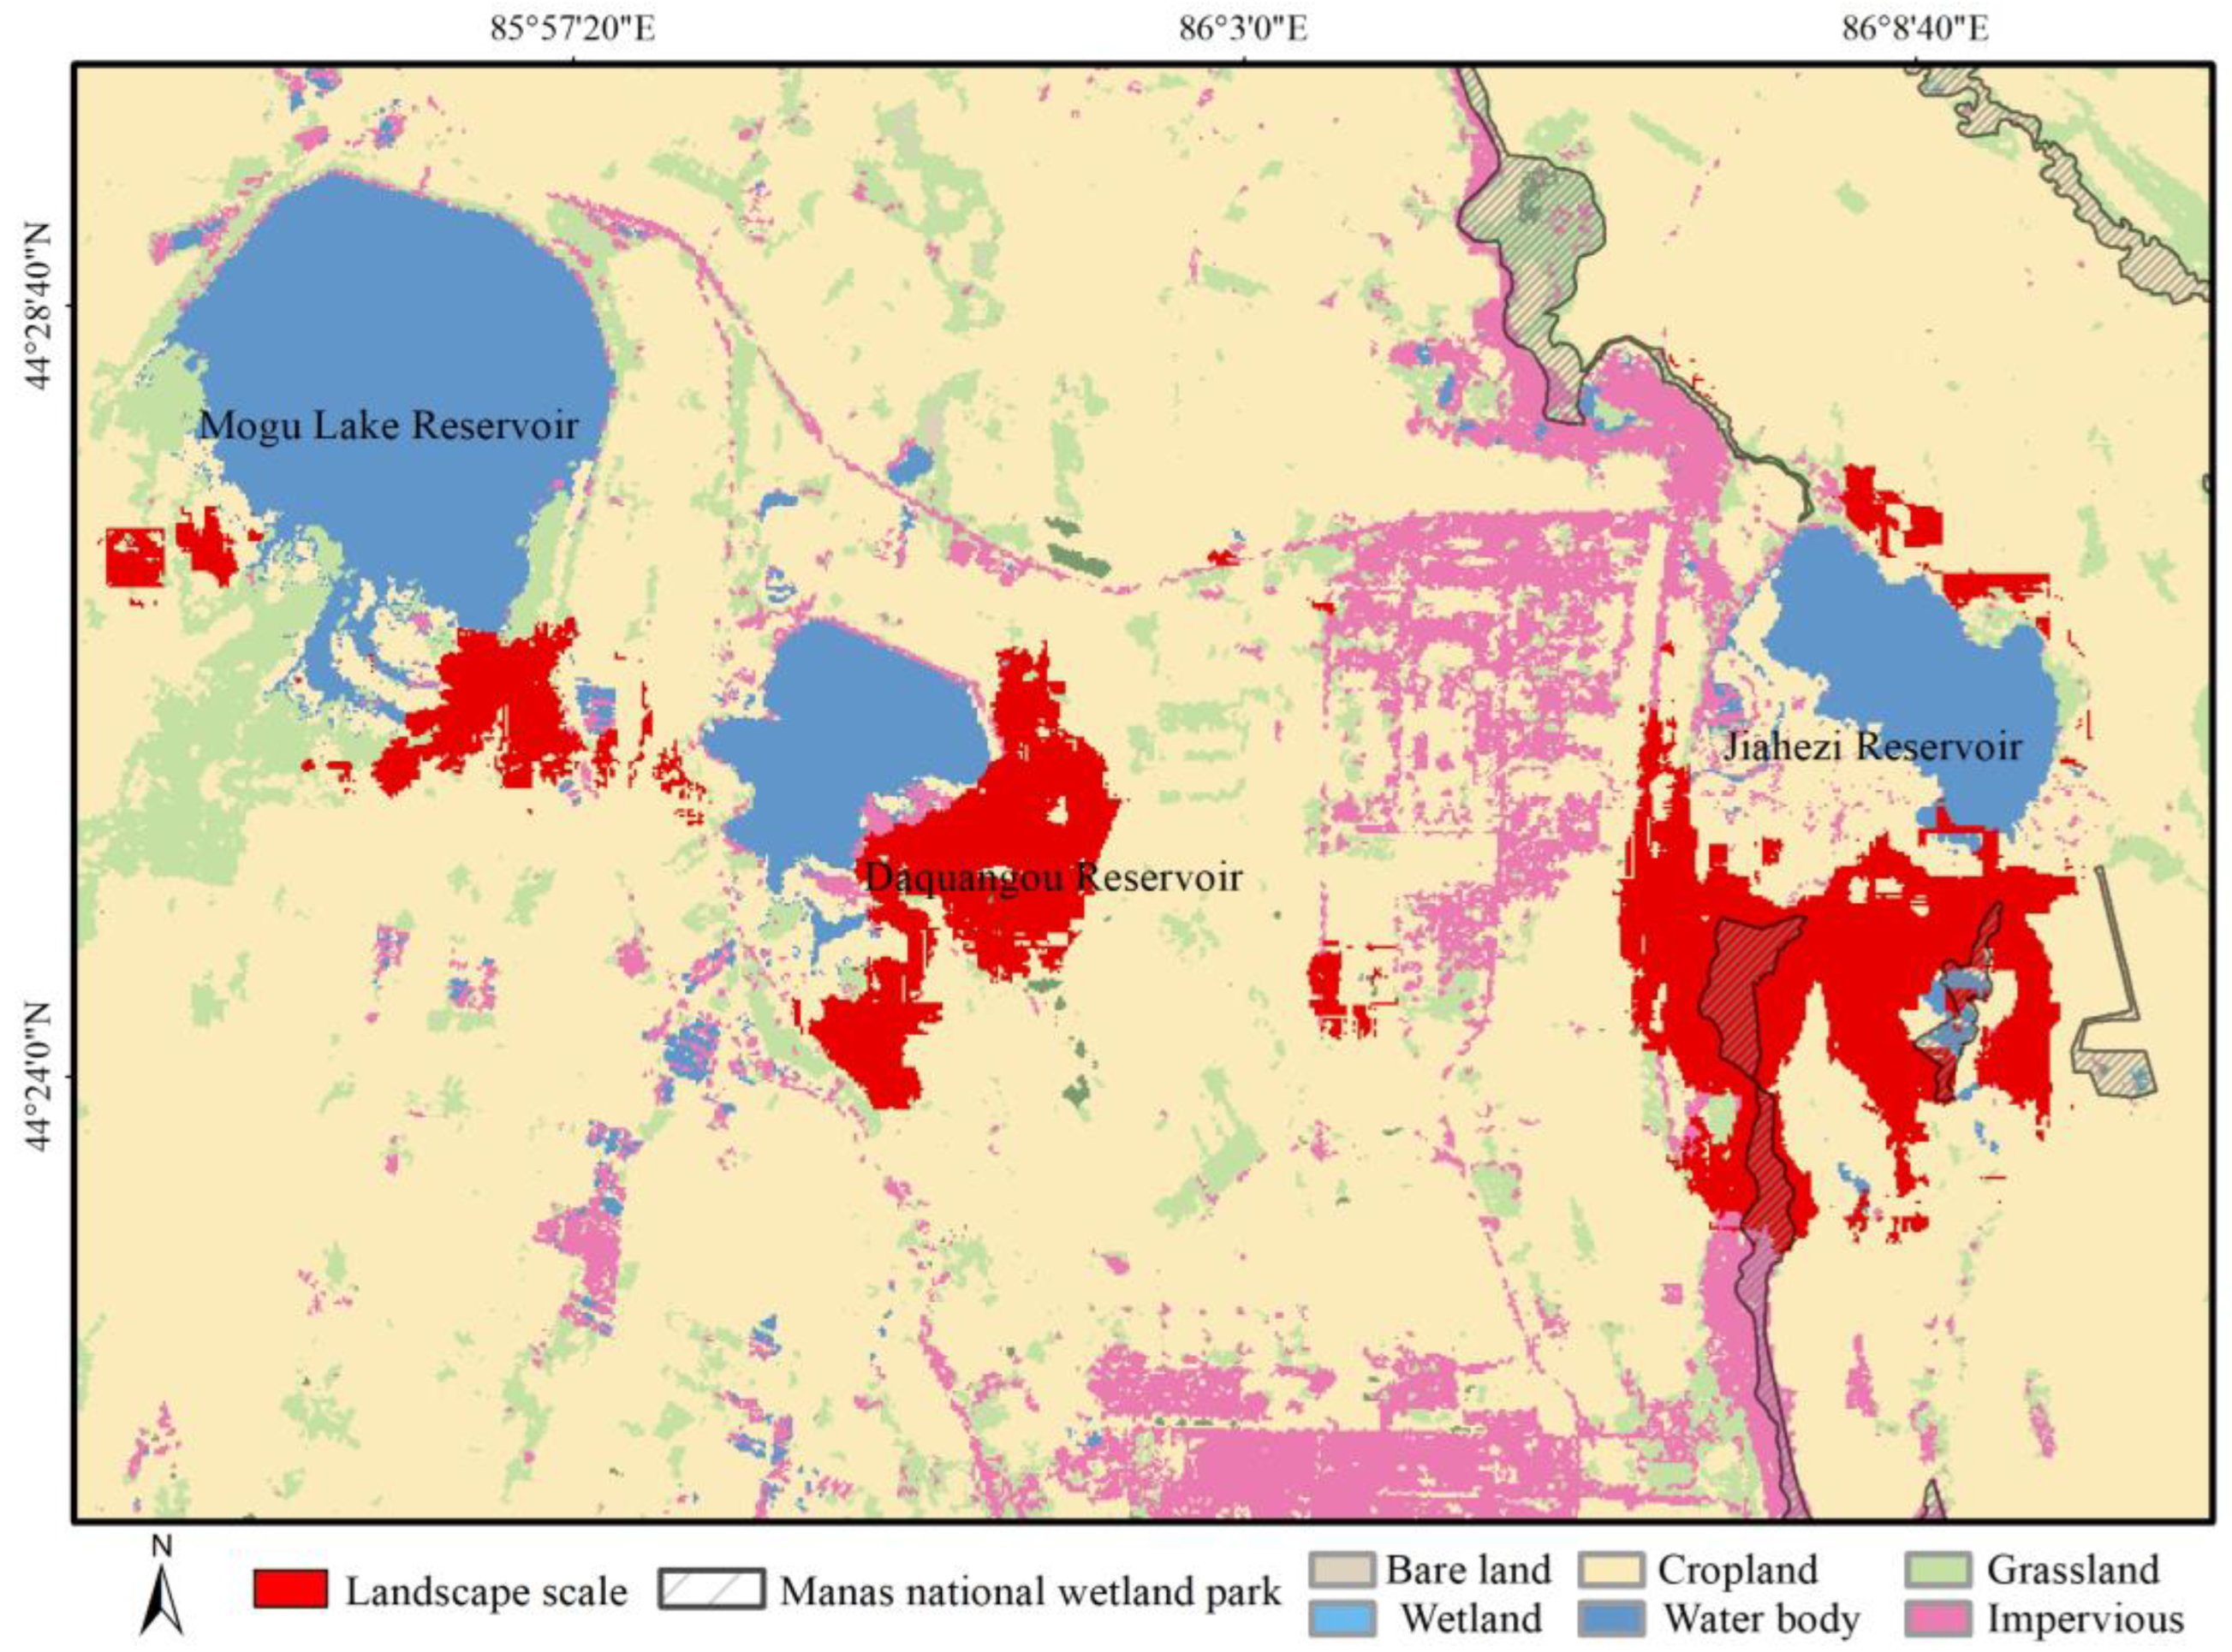
3.2.1. Habitat Selection of Wintering Whooper Swans at the Landscape Scale

The analysis of the primary influencing variables revealed by the model and displayed in Figure 5 indicates that wintering whooper swans primarily inhabit areas near water bodies and wetlands, with the highest probability of presence at distances of 1000 m from wetlands and 300 m from water bodies, indicating that at the landscape scale, whooper swans predominantly choose regions near water bodies and wetlands as wintering grounds. Additionally, winter temperatures and precipitation significantly constrain the distribution of wintering whooper swans, with the highest probability of presence observed at an average precipitation of 6.9 mm and an average temperature of −6 °C. This preference indicates they select the climate conditions within this range and regions closer to wetlands and water bodies as habitat choices at the landscape scale (Figure 5).
Model predictions indicated a suitable habitat area of 24.50 km2 at the landscape scale, with whooper swan wintering habitats predominantly located around the southern Jiahezi Reservoir within Manas National Wetland Park, followed by the eastern parts of the Daquangou Reservoir and the southeastern part of Mogu Lake Reservoir. Suitable habitats were primarily distributed in patches, indicating a preference for regions near large and medium-sized water bodies and wetlands as primary wintering grounds at the landscape scale (Figure 6).

3.2.2. Habitat Selection of Wintering Whooper Swans at the Daytime Scale

The key factors influencing whooper swans’ habitat selection at the daytime scale, as shown in Figure 7, demonstrated that swans’ preferences for areas near wetland and water bodies were aligned with those at the landscape scale. This indicates that whooper swans primarily frequent areas near wetlands and water bodies. Furthermore, increased water body dispersion was associated with a higher probability of presence, suggesting that wintering swans preferentially select areas with more dispersed water bodies for foraging. The highest probability of presence was observed at 300 m from bare land, indicating that wintering whooper swans mainly utilize areas near wetlands, water bodies, and sparsely distributed wetland for foraging activities. During daytime, water bodies and wetlands provide resting sites for whooper swans, while bare land offers a broad view, aiding in predator detection and evasive behaviors (Figure 7).
We identified a suitable daytime habitat area of 12.23 km2, predominantly concentrated in the southern part of the Jiahezi Reservoir in the wetland park, with scattered distribution in the eastern part of the Daquangou Reservoir. These habitats mainly comprise farmland near water bodies and impermeable surfaces within the wetland park, reflecting the swan’s preference for cropland near water bodies and wetland parks as daytime areas (Figure 8).

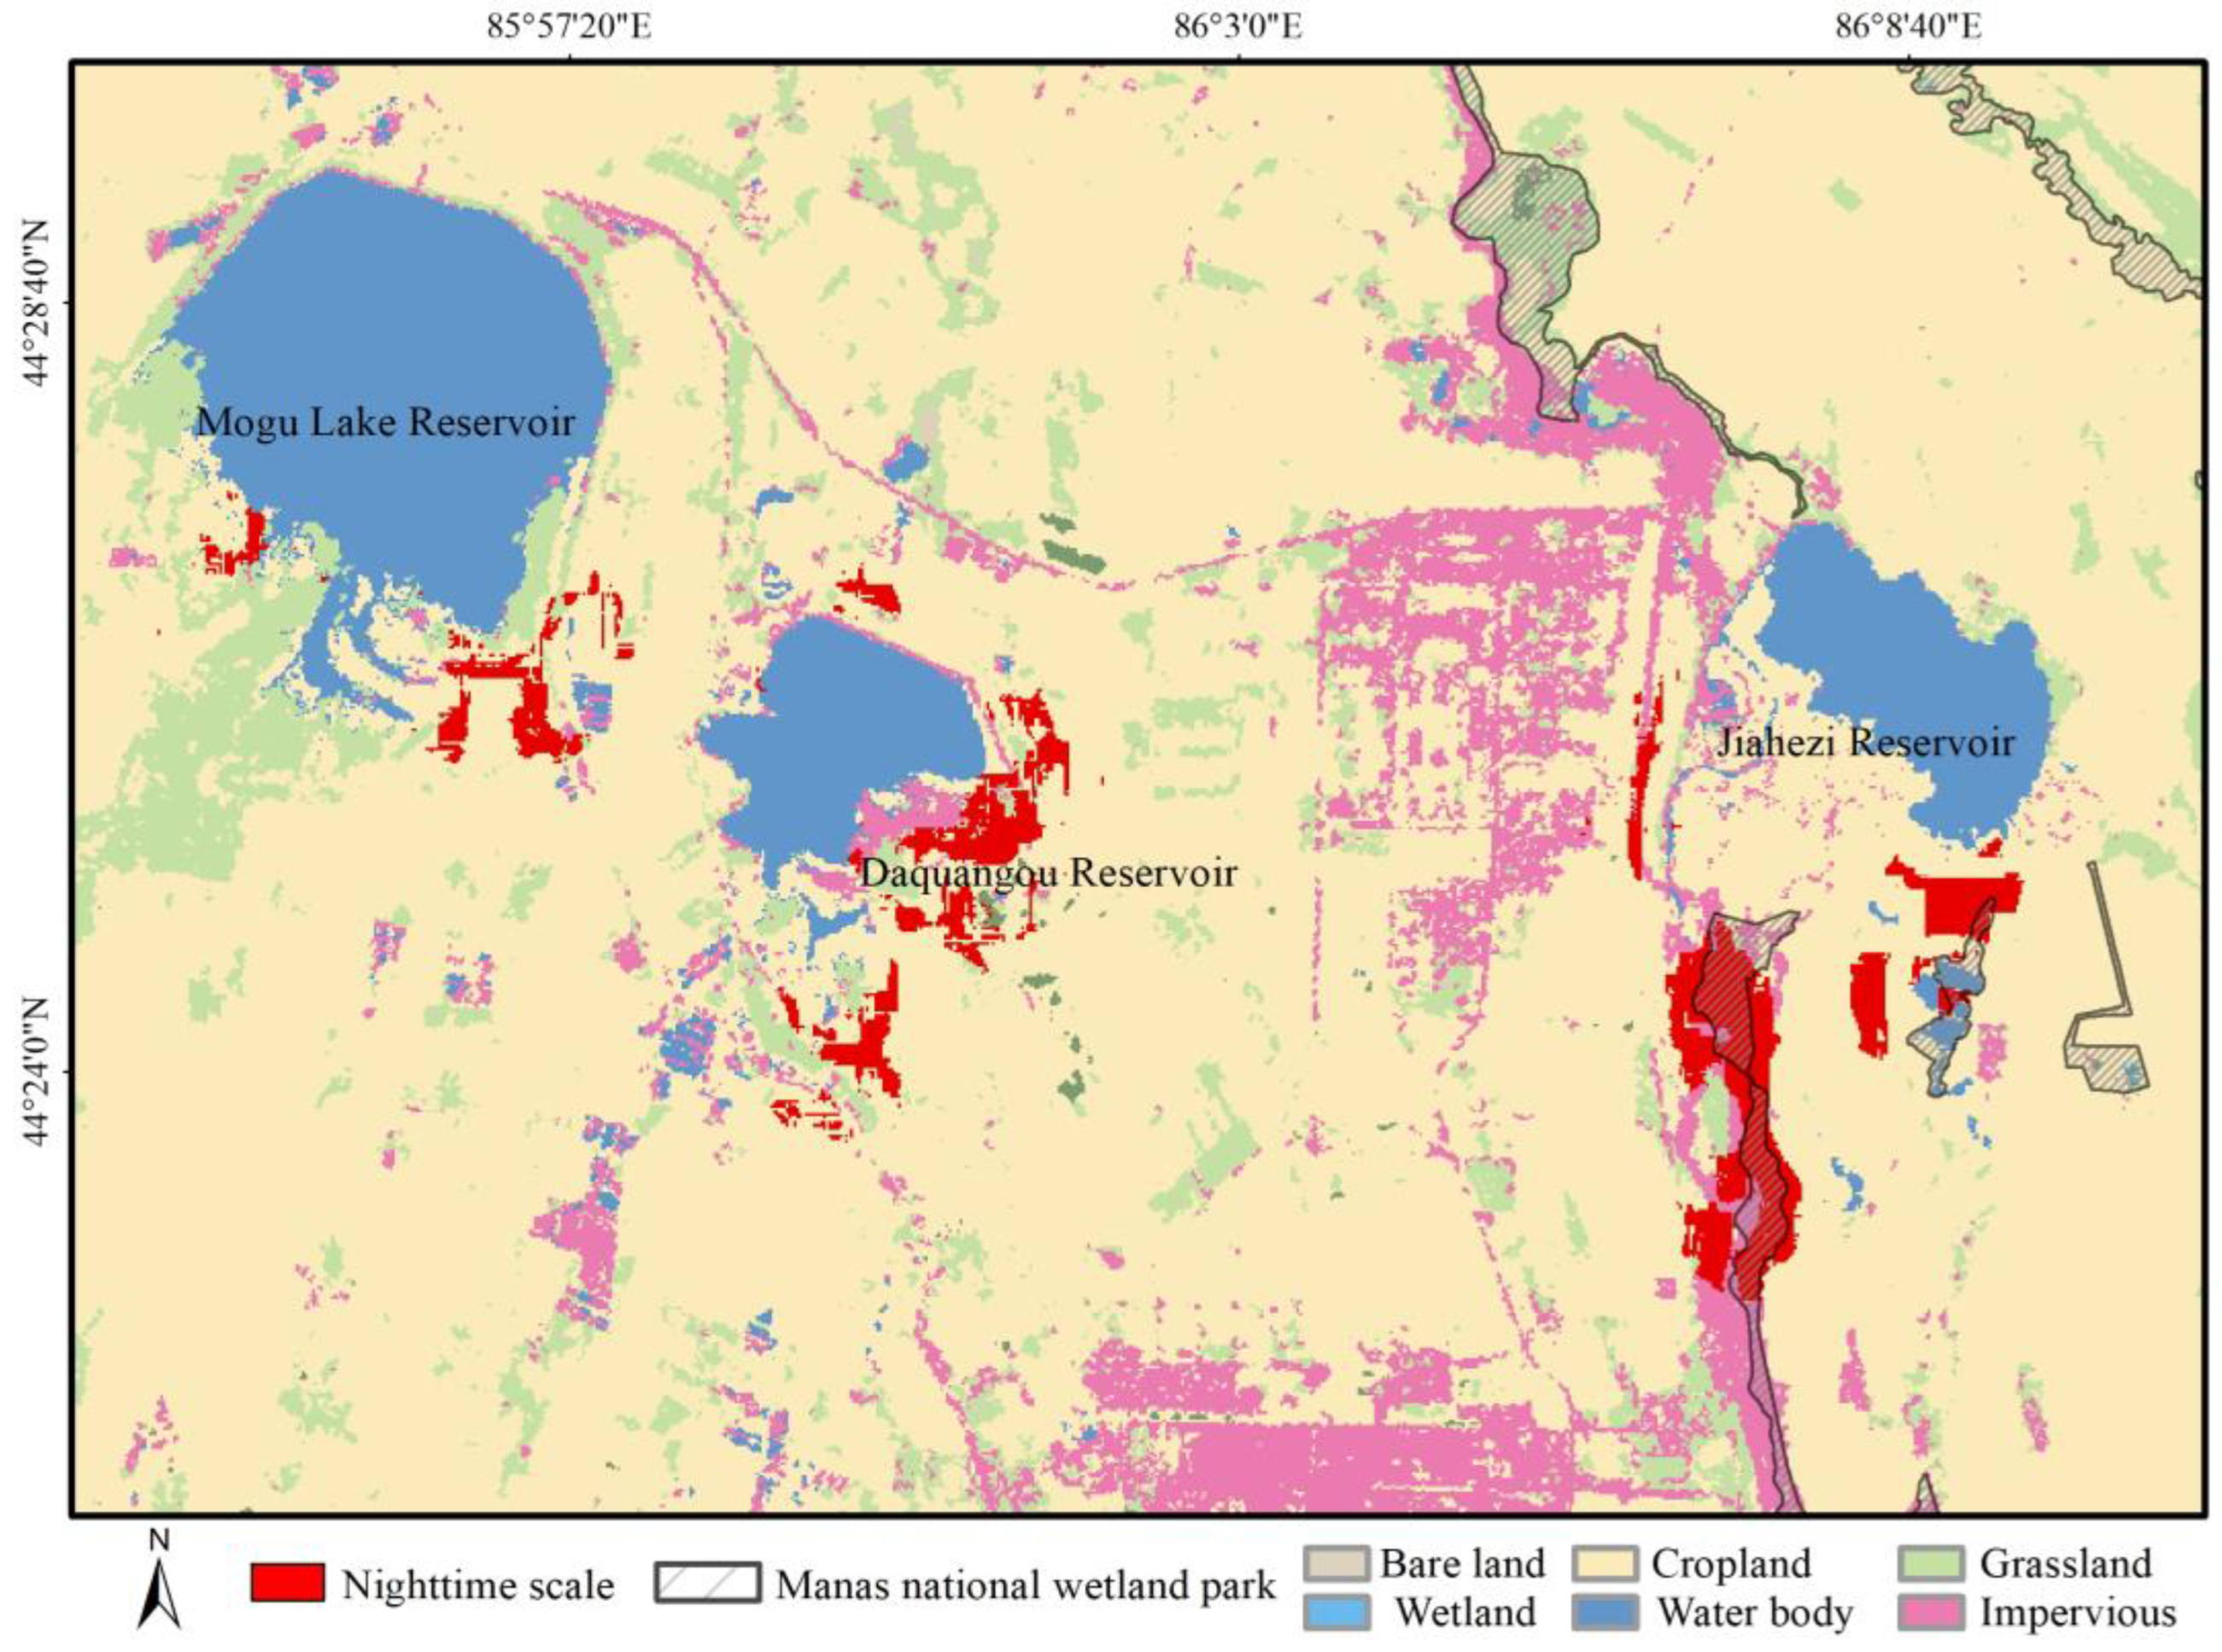
3.2.3. Habitat Selection of Wintering Whooper Swans at the Nighttime Scale

The key factors influencing whooper swans’ habitat selection at the nighttime scale, as shown in Figure 9 were similar to those at the daytime scale. At nighttime, whooper swans mainly choose water bodies near wetlands and with high dispersion which are characterized by minimal human activity, providing higher security (Figure 9).
The nighttime-scale suitable habitat has an area of 8.21 km2 and is predominantly concentrated within the wetland park in the southern part of the Jiahezi Reservoir. This indicates that whooper swans primarily concentrate in this part of the wetland park for resting at night, with fewer occurrences in the Daquangou Reservoir’s eastern area, reflecting their preference for areas with minimal human disturbance and high safety for night roosting (Figure 10).

4. Discussion

4.1. Wintering Whooper Swan Habitat Selection at the Landscape Scale

This study reveals that at the landscape scale, wintering whooper swans primarily select areas near wetlands and water bodies. This indicates that these waterbirds mainly winter near water bodies and wetlands, aligning with the habitat selection preferences of large-to-medium-sized waterbirds [44] (see Figure 6). Additionally, groups of waterbirds, such as the Anatidae family, concentrate in lakes and wetlands in the middle and lower reaches of Yangtze River during the winter [45]. Habitat quality is the most crucial factor influencing the abundance and distribution of herbivorous waterbirds [15]. Whooper swans mainly concentrate their wintering activities in wetlands, such as Rongcheng in Shandong and Pinglu in Shanxi [46].
Winter temperatures are low, with an average temperature of −20 °C in January, and extreme cold temperatures (−30 °C) are frequent, with phenomena like cold waves leading to rapid ice formation on water surfaces, restricting the activities and foraging of waterbirds [47]. Prolonged low temperatures can reduce energy acquisition, increasing the risk of individual mortality [48]. Therefore, suitable temperatures are crucial for successful waterbird wintering [49]. For instance, species like the swan goose (Anser cygnoides), bean goose (Anser fabalis), and Eurasian teal (Anas crecca) exhibit peak foraging periods in the early mornings, when temperatures are low, while they rest more during warmer midday temperatures [45]. Furthermore, extreme weather events such as the polar vortex have been identified as factors contributing to decreased bird population densities at observation sites, leading to reduced activity levels and potential migration to alternative locations [50]. A study conducted in Sanmenxia Wetland Park revealed significant variations in the home range and habitat utilization patterns of whooper swans across three distinct wintering periods [51]. Furthermore, research conducted in Manas National Wetland Park highlighted a significant correlation between the activity pattern of whooper swans and the average winter temperature. Behaviors such as foraging, resting, walking, flighting, and vigilance were positively associated with temperature, while swimming behavior exhibited a negative correlation, underscoring the intricate relationship between wintering waterbird behavior and ambient temperature [23,32]. Winter temperatures also affect bird species’ spring migration and daily activity capabilities, with high temperatures often signaling the spring migration of whooper swans [51]. Our results indicate that the suitable wintering temperature for whooper swans in the Manas region of Xinjiang is around −6 °C.
Temperature and precipitation also impact the distribution of wintering birds [52]. For instance, rain-on-snow events, which lead to rapid freezing and thawing, can increase bird mortality, degrade suitable habitats, and block food source acquisition [53]. In wintering white-winged snowfinch (Montifringilla nivalis nivalis), flock sizes have decreased due to climate warming [54]. Multispecies models have also found that birds tend to select areas with intermediate precipitation levels in winter [55]. These results prove that temperature and precipitation influence wintering bird distribution, and in this study, we also found that these two factors affected the habitat selection of wintering whooper swans.

4.2. Wintering Whooper Swan Habitat Selection at the Daytime Scale

Waterbirds choose different foraging strategies based on various life history stages combined with environmental conditions [50]. Additionally, maximizing energy intake is reflected in waterbirds as they select foraging areas around nighttime sites while minimizing predation risk and human disturbance [56].
During the winter, we found that whooper swans congregate near water bodies and wetlands, with a preference for arable lands adjacent to segmented water bodies for foraging. Some research has also revealed that the foraging ranges of birds are located between food patches within a distance of 100–500 m, and larger groups are observed to favor more isolated food patches, resulting in a disproportionate intensification of food utilization [57].
Low ambient temperatures may diminish open water availability, limiting whooper swan activity. In conditions of sparse natural vegetation and frozen water bodies, swans often transition their foraging and resting to croplands. In Sanmenxia, wintering whooper swans often opt for wetland parks and corn and soybean crops planted along the banks of the Yellow River in Sanwan as their food sources. Some adult swans choose to roost in farmlands near Shengtian Lake, reflecting the need of whooper swans to acquire sufficient energy to meet their migratory energy requirements [32,51].
Due to increased snow cover and reduced unfrozen water surfaces in winter, whooper swans face food scarcity challenges during the winter [56]. The daytime range of whooper swans is primarily influenced by the distribution of food resources [58]. Additionally, areas with reeds, sedge, and bulrush in the wetland park, as well as artificially fixed feeding points, are where whooper swans concentrate their foraging activities [23]. For instance, whooper swans gather at artificial feeding points in Sanmenxia Swan Lake Wetland Park for foraging and primarily feed on aquatic plants at shallow water banks in Canglong Lake [13]. In Manas National Wetland Park, staff regularly feed wintering whooper swans, a behavior that may influence the swans’ habitat selection, increasing their time spent on bare land and mainly foraging within the wetland park, enhancing the utilization wetland park [23].
Artificial feeding diminishes the foraging time of swans, as they swim from water bodies to feeding points for foraging and then return to areas closer to water bodies and wetlands for roosting, thereby influencing swans’ wintering distribution patterns [4,23,32].

4.3. Wintering Whooper Swan Habitat Selection at the Nighttime Scale

The key factors influencing whooper swans’ habitat selection at the nighttime scale are similar to those at the daytime scale. Whooper swans predominantly opt for water bodies in close proximity to wetlands, characterized by minimal human activity, thus offering increased security. These finds align with research conducted on oriental storks (Ciconia boyciana) [27]. During winter, oriental storks choose nighttime locations closely linked to landscape composition, often roosting near lakes and marshes, with a significant overlap between their nighttime and daytime sites [27]. Both the greater white-fronted goose (Anser Albifrons) and the tundra bean goose (A. serrirostris) exhibit a preference for small farmland patches near densely populated water bodies, with habitat selection likelihood diminishing as the distance from water bodies increases, in accordance with central foraging strategies [10]. Studies suggest that variables influencing the nighttime habitats of whooper swans are closely connected to those on the daytime scale, with daytime habitats distributed in proximity to nighttime habitats. Swans tend to select areas nearer wetlands and water bodies for resting during the night, where human disturbances are minimal, offering a higher level of security.

5. Conclusions

Based on the habitat selection characteristics of whooper swans at the landscape, daytime, and nighttime scales, the following recommendations can be made to effectively manage Manas National Wetland Park and the surrounding water bodies and wetlands: (1) ensure the preservation of existing areas of water bodies and wetlands to prevent the loss of wintering habitats for whooper swans; (2) since the nighttime habitat scale of whooper swans is concentrated near wetland parks, it is necessary to enhance the protection of habitats outside the wetland park to reduce human disturbances; (3) considering that whooper swans’ wintering habitats follow central foraging theories, with daytime habitats surrounding nighttime sites, it is advisable to supplement food resources for whooper swans outside the wetland park to ensure their successful wintering.
The impact of artificial feeding on avian populations has been a subject of extensive investigation, revealing both positive and negative implications [58]. Prolonged artificial feeding practices have been shown to alter the behavioral patterns of whooper swans, diminishing their vigilance and alertness levels [59]. Additionally, artificial feeding has led to modifications in the diet composition of whooper swans, resulting in reduced food diversity and compromised foraging capabilities [60]. In light of these findings, we advocate for a revision of current feeding strategies by management authorities to mitigate adverse effects. Recommendations include adjusting the location of feeding points and the quantity of feed, implementing segmented feeding regimes in wetland parks to alleviate population density and competition pressures, and adopting measures to reduce negative impacts on the behavior and foraging ecology of wintering waterbirds.

Author Contributions

Conceptualization, F.X. and W.Y.; methodology, H.Y.; software, H.Y. and X.M.; validation, H.Y., X.M. and F.X.; formal analysis, H.Y. and X.M.; investigation, H.Y. and X.M.; resources, H.Y. and F.X.; data curation, H.Y. and X.M.; writing—original draft preparation, H.Y., X.M. and F.X.; writing—review and editing, H.Y. and F.X.; visualization, H.Y.; supervision, F.X.; project administration, F.X. and W.Y.; funding acquisition, F.X. All authors have read and agreed to the published version of the manuscript.

Funding

This research was funded by the Third Xinjiang Scientific Expedition Program (grant number 2021xjkk0600) and the China Biodiversity Observation Network (Sino-BON).

Institutional Review Board Statement

The animal study protocol was approved by the Animal Protection and Utilization Committee of Xinjiang Institute of Ecology and Geography, Chinese Academy of Sciences (License number: XJEG-2021030.).

Data Availability Statement

The data supporting the results of this study can be found in the manuscript.

Acknowledgments

We express our appreciation to Manas National Wetland Park for their field assistance and support. We also thank Yali Si for her valuable comments on the earlier version of the manuscript.

Conflicts of Interest

The authors declare no conflicts of interest.

References

  1. Reunanen, P.; Monkkonen, M.; Nikula, A. Habitat requirements of the Siberian flying squirrel in northern Finland: Comparing field survey and remote sensing data. Ann. Zool. Fenn. 2002, 1, 7–20. [Google Scholar]
  2. Yang, W.; Zhong, W.; Gao, X. A review of studies on avain habitat selection. Arid Zone Res. 2000, 3, 71–78. [Google Scholar]
  3. McGarigal, K.; Wan, H.Y.; Zeller, K.A.; Timm, B.C.; Cushman, S.A. Multi–scale habitat selection modeling: A review and outlook. Landsc. Ecol. 2016, 6, 1161–1175. [Google Scholar] [CrossRef]
  4. Sun, H.; Yu, H.; Li, Y.; Yu, W.; Gao, R.; Zhang, C.; Zhang, Y.; Hong, J. Habitat selection for the wintering of whooper swan in Sanmenxia. Wetl. Sci. Manag. 2018, 3, 50–53. [Google Scholar]
  5. Kotliar, N.B.; Wiens, J.A. Multiple scales of patchiness and patch structure-a hierarchical framework for the study of heterogeneity. Oikos 1990, 2, 253–260. [Google Scholar] [CrossRef]
  6. Marcolin, F.; Lakatos, T.; Galle, R.; Batary, P. Fragment connectivity shapes bird communities through functional trait filtering in two types of grasslands. Glob. Ecol. Conserv. 2021, 28, e01687. [Google Scholar] [CrossRef]
  7. Neuschulz, E.L.; Brown, M.; Farwig, N. Frequent bird movements across a highly fragmented landscape: The role of species traits and forest matrix. Anim. Conserv. 2013, 2, 170–179. [Google Scholar] [CrossRef]
  8. Jourdan, C.; Fort, J.; Pinaud, D.; Delaporte, P.; Herault, T.; Jankovic, M.; Jomat, L.; Lachaussee, N.; Pineau, P.; Robin, F.; et al. Daytime, tidal amplitude and protected areas influence movements and habitat use on mudflats of wintering black–tailed godwits. Estuar. Coast. Shelf Sci. 2022, 268, 107782. [Google Scholar] [CrossRef]
  9. Joo, S.; Choi, Y.-S.; Lee, S.-Y. Home range and habitat use of the swan goose (Anser cygnoides L. 1758) during wintering in the seocheon tidal flat, south Korea, using gps–based telemetry. Animals 2022, 12, 3048. [Google Scholar] [CrossRef]
  10. Zhang, W.; Li, X.; Yu, L.; Si, Y. Multi–scale habitat selection by two declining east Asian waterfowl species at their core spring stopover area. Ecol. Indic. 2018, 87, 127–135. [Google Scholar] [CrossRef]
  11. Li, X.; Zhang, L.; Cao, L.; Xiong, H.; Zhao, Q. Characteristics of stopover site selection during the migration of swan goose. Acta Ecol. Sin. 2024, 2, 570–578. [Google Scholar]
  12. Chen, H.; Wang, G.; Wang, C.; Xue, F.; Cheng, H.; Zhang, Y.N. Activity rhythms, home range characteristics, and habitat selection of reintroduced red–crowned crane. Acta Ecol. Sin. 2024, 4, 1526–1538. [Google Scholar]
  13. Jia, R.; Gao, R.; Ru, W.; Kong, D.; Ji, Z.; Zhang, G. Using satellite tracking to identify the factors affecting the spring migration timing of whooper swans (Cygnus cygnus). Acta Ecol. Sin. 2021, 41, 6075–6082. [Google Scholar]
  14. Hoodless, A.N.; Hirons, G.J.M. Habitat selection and foraging behaviour of breeding Eurasian woodcock (Scolopax rusticola): A comparison between contrasting landscapes. Ibis 2007, 149, 234–249. [Google Scholar] [CrossRef]
  15. Yang, X.T.; Duan, Z.Z.; Li, S.S.; Zhang, C.X.; Qu, M.; Hua, G.D.; Niu, X.A.; Hu, H.J.; Yu, D.M. Factors driving the abundance of wintering waterbirds in coastal areas of Guangdong province, China. Front. Ecol. Evol. 2022, 9, 808105. [Google Scholar] [CrossRef]
  16. Booth, T.H. Using biodiversity databases to verify and improve descriptions of tree species climatic requirements. For. Ecol. Manag. 2014, 315, 95–102. [Google Scholar] [CrossRef]
  17. Warren, D.L.; Seifert, S.N. Ecological niche modeling in maxent: The importance of model complexity and the performance of model selection criteria. Ecol. Appl. 2011, 2, 335–342. [Google Scholar] [CrossRef] [PubMed]
  18. Zheng, G. Classification and Distribution of Birds in China; Science Publishers: Beijing, China, 2023; pp. 102–106. [Google Scholar]
  19. Soriano-Redondo, A.; Inger, R.; Sherley, R.B.; Rees, E.C.; Abadi, F.; McElwaine, G.; Colhoun, K.; Einarsson, O.; Thorstensen, S.; Newth, J.; et al. Demographic rates reveal the benefits of protected areas in a long–lived migratory bird. Proc. Natl. Acad. Sci. USA 2023, 12, e2212035120. [Google Scholar] [CrossRef] [PubMed]
  20. Lee, J.Y.; Nam, H.K.; Park, J.Y.; Kang, S.G.; Batbayar, N.; Kim, D.W.; Hwang, J.W.; Tsend, O.; Natsagdorj, T.; Nergui, J.; et al. Migration routes and differences in migration strategies of whooper swans between spring and autumn. Avian Res. 2023, 14, 100113. [Google Scholar] [CrossRef]
  21. Yang, L. Status of biodiversity in Manas national wetland park and countermeasures for its conservation. Xinjiang For. 2021, 4, 10–12. [Google Scholar]
  22. Yang, L.; Xie, F.B. Monitoring and analysis of common crane migration patterns in Manas national wetland park. Xinjiang For. 2022, 3, 28–30. [Google Scholar]
  23. Yang, L.; Xie, F.B.; Wang, L. Observation and analysis of the daily behavior of whooper swans during the overwintering period in Manas national wetland park. Xinjiang For. 2022, 6, 22–25. [Google Scholar]
  24. Noonan, M.J.; Martinez-Garcia, R.; Davis, G.H.; Crofoot, M.C.; Kays, R.; Hirsch, B.; Caillaud, D.; Payne, E.; Sih, A.; Sinn, D.L.; et al. Estimating encounter location distributions from animal tracking data. Methods Ecol. Evol. 2021, 7, 1158–1173. [Google Scholar] [CrossRef]
  25. Fleming, C.H.; Fagan, W.F.; Mueller, T.; Olson, K.A.; Leimgruber, P.; Calabrese, J.M. Rigorous home range estimation with movement data: A new autocorrelated kernel density estimator. Ecology 2015, 5, 1182–1188. [Google Scholar] [CrossRef]
  26. Signer, J.; Fieberg, J.; Avgar, T. Animal movement tools (amt): R package for managing tracking data and conducting habitat selection analyses. Ecol. Evol. 2019, 2, 880–890. [Google Scholar] [CrossRef]
  27. Li, J.Y.; Zhang, Y.; Zhao, L.; Deng, W.Q.; Qian, F.W.; Ma, K.M. Scale and landscape features matter for understanding waterbird habitat selection. Remote Sens. 2021, 13, 4397. [Google Scholar] [CrossRef]
  28. Miguet, P.; Jackson, H.B.; Jackson, N.D.; Martin, A.E.; Fahrig, L. What determines the spatial extent of landscape effects on species? Landsc. Ecol. 2016, 6, 1177–1194. [Google Scholar] [CrossRef]
  29. Bellamy, C.; Scott, C.; Altringham, J. Multiscale, presence-only habitat suitability models: Fine-resolution maps for eight bat species. J. Appl. Ecol. 2013, 4, 892–901. [Google Scholar] [CrossRef]
  30. Byrne, M.E.; McCoy, J.C.; Hinton, J.W.; Chamberlain, M.J.; Collier, B.A. Using dynamic Brownian bridge movement modelling to measure temporal patterns of habitat selection. J. Anim. Ecol. 2014, 5, 1234–1243. [Google Scholar] [CrossRef]
  31. Palm, E.C.; Newman, S.H.; Prosser, D.J.; Xiao, X.M.; Ze, L.; Batbayar, N.; Balachandran, S.; Takekawa, J.Y. Mapping migratory flyways in Asia using dynamic Brownian bridge movement models. Mov. Ecol. 2015, 3, 3. [Google Scholar] [CrossRef]
  32. Jia, R.; Li, S.-H.; Meng, W.-Y.; Gao, R.-Y.; Ru, W.-D.; Li, Y.-F.; Ji, Z.-H.; Zhang, G.-G.; Liu, D.-P.; Lu, J. Wintering home range and habitat use of the whooper swans (Cygnus cygnus) in Sanmenxia wetland, China. Ecol. Res. 2019, 5, 637–643. [Google Scholar] [CrossRef]
  33. Hijmans, R.J.; Cameron, S.E.; Parra, J.L.; Jones, P.G.; Jarvis, A. Very high-resolution interpolated climate surfaces for global land areas. Int. J. Climatol. 2005, 15, 1965–1978. [Google Scholar] [CrossRef]
  34. Price, D.T.; McKenney, D.W.; Nalder, I.A.; Hutchinson, M.F.; Kesteven, J.L. A comparison of two statistical methods for spatial interpolation of Canadian monthly mean climate data. Agric. For. Meteorol. 2000, 101, 81–94. [Google Scholar] [CrossRef]
  35. Yang, J.; Huang, X. The 30 m annual land cover dataset and its dynamics in China from 1990 to 2019. Earth Syst. Sci. Data 2021, 8, 3907–3925. [Google Scholar] [CrossRef]
  36. Fardila, D.; Kelly, L.T.; Moore, J.L.; McCarthy, M.A. A systematic review reveals changes in where and how we have studied habitat loss and fragmentation over 20 years. Biol. Conserv. 2017, 212, 130–138. [Google Scholar] [CrossRef]
  37. McKinney, M.L. Urbanization as a major cause of biotic homogenization. Biol. Conserv. 2006, 3, 247–260. [Google Scholar] [CrossRef]
  38. Ethier, K.; Fahrig, L. Positive effects of forest fragmentation, independent of forest amount, on bat abundance in eastern Ontario, Canada. Landsc. Ecol. 2011, 6, 865–876. [Google Scholar] [CrossRef]
  39. Soifer, L.G.; Donovan, S.K.; Brentjens, E.T.; Bratt, A.R. Piecing together cities to support bird diversity: Development and forest edge density affect bird richness in urban environments. Landsc. Urban Plan. 2021, 213, 104122. [Google Scholar] [CrossRef]
  40. Hinsley, S.A.; Bellamy, P.E. The influence of hedge structure, management and landscape context on the value of hedgerows to birds: A review. J. Environ. Manag. 2000, 1, 33–49. [Google Scholar] [CrossRef]
  41. Naimi, B.; Hamm, N.A.S.; Groen, T.A.; Skidmore, A.K.; Toxopeus, A.G. Where is positional uncertainty a problem for species distribution modelling? Ecography 2014, 2, 191–203. [Google Scholar] [CrossRef]
  42. Boria, R.A.; Olson, L.E.; Goodman, S.M.; Anderson, R.P. Spatial filtering to reduce sampling bias can improve the performance of ecological niche models. Ecol. Model. 2014, 275, 73–77. [Google Scholar] [CrossRef]
  43. Aiello-Lammens, M.E.; Boria, R.A.; Radosavljevic, A.; Vilela, B.; Anderson, R.P. Spthin: An r package for spatial thinning of species occurrence records for use in ecological niche models. Ecography 2015, 5, 541–545. [Google Scholar] [CrossRef]
  44. Masto, N.M.; Hsiung, A.C.; Kaminski, R.M.; Ross, B.E.; Kneece, M.R.; Wilkerson, G.L.; Baldwin, R.F.; Hanks, R.D.; Wiggers, E.P.; Folk, T.H.; et al. Waterbird-habitat relationships in South Carolina: Implications for protection, restoration, and management of coastal and inland wetlands. Restor. Ecol. 2023, 31, e13956. [Google Scholar] [CrossRef]
  45. Jia, Q.; Wang, X.; Zhang, Y.; Cao, L.; Fox, A.D. Drivers of waterbird communities and their declines on Yangtze River floodplain lakes. Biol. Conserv. 2018, 218, 240–246. [Google Scholar] [CrossRef]
  46. Zhang, G.; Dong, C.; Lu, J.; Hou, Y. Surveys on the population dynamic of whooper swans Cygnus cygnus at important wintering areas in China. Sichuan J. Zool. 2014, 03, 456–459. [Google Scholar]
  47. Huang, Y.J.; Wang, P.; Yang, Z.Y.; Yu, P.; Ye, T.T.; Guo, Y.M.; Huang, L. Spatiotemporal characteristics and influencing factors for joint events of air pollution wave and cold wave in China. Environ. Int. 2024, 184, 108475. [Google Scholar] [CrossRef]
  48. Brunbjerg, A.K.; Hoye, T.T.; Eskildsen, A.; Nygaard, B.; Damgaard, C.F.; Ejrnæs, R. The collapse of marsh fritillary (Euphydryas aurinia) populations associated with declining host plant abundance. Biol. Conserv. 2017, 211, 117–124. [Google Scholar] [CrossRef]
  49. Duan, H.L.; Pan, Y.W.; Yu, X.B.; Xia, S.X. Effects of habitat change on the wintering waterbird community in China’s largest freshwater lake. Remote Sens. 2023, 18, 4582. [Google Scholar] [CrossRef]
  50. Van den Broeke, M.S. Radar indications of altered foraging behavior during the February 2021 severe north American cold wave. Avain Biol. Res. 2023, 1, 14–20. [Google Scholar] [CrossRef]
  51. Li, S.; Meng, W.; Chen, L.; Li, Y.; Gao, R.; Ru, W.; Sun, M.; Dai, Q.; Zhang, G.; Lu, J. The spring waterbird community and home range of the whooper swan Cygnus cygnus at the upper and middle reaches of yellow river in inner Mongolia, China. Chin. J. Ecol. 2017, 7, 1910–1916. [Google Scholar]
  52. Cotza, A.; Tomassini, O.; Corlatti, L.; Ferretti, F.; Davoli, M.; Bassano, B.; Lovari, S. Reproductive payoffs of territoriality are snow–dependent in a mountain ungulate, the Alpine chamois. J. Zool. 2023, 3, 225–236. [Google Scholar] [CrossRef]
  53. Cohen, J.M.; Fink, D.; Zuckerberg, B. Extreme winter weather disrupts bird occurrence and abundance patterns at geographic scales. Ecography 2021, 8, 1143–1155. [Google Scholar] [CrossRef]
  54. Delgado, M.D.; Arlettaz, R.; Bettega, C.; Brambilla, M.; Hernando, M.D.; España, A.; Fernández–González, A.; Fernandez–Martín, A.; Gil, J.A.; Hernández–Gómez, S.; et al. Spatio–temporal variation in the wintering associations of an alpine bird. Proc. R. Soc. B–Biol. Sci. 2021, 288, 20210690. [Google Scholar] [CrossRef] [PubMed]
  55. Arias, L.N.C.; Wilson, S.; Bayly, N.J. Community modeling reveals the importance of elevation and land cover in shaping migratory bird abundance in the Andes. Ecol. Appl. 2022, 1, e02481. [Google Scholar] [CrossRef]
  56. Cheng, L.; Zhou, L.Z.; Yu, C.; Wei, Z.H.; Li, C.H. Nest habitat distribution and spatio-temporal dynamics based on multi-scale modeling: Implications for the endangered oriental storks (Ciconia boyciana) conservation in China. Glob. Ecol. Conserv. 2023, 43, e02439. [Google Scholar] [CrossRef]
  57. Siriwardena, G.M.; Calbrade, N.A.; Vickery, J.A.; Sutherland, W.J. The effect of the spatial distribution of winter seed food resources on their use by farmland birds. J. Appl. Ecol. 2006, 4, 628–639. [Google Scholar] [CrossRef]
  58. Liu, Y.H.; Lu, Y.; Chen, C.; Zhang, G.W.; Wang, Q.Z.; Xu, Z.; Wang, Z.S. Behavioural responses of the whooper swans Cygnus cygnus to human disturbance and their adaptability to the different habitats in the Rongcheng lagoon of China. Ecohydrology 2018, 7, e2013. [Google Scholar] [CrossRef]
  59. Tian, X.; Lu, Y.; Chen, C.; Liu, Y. A study on distribution and behaviors of whooper swans during the pre-winter period in the swan lake of Rongcheng. Wetl. Sci. Manag. 2017, 13, 29–34. [Google Scholar]
  60. Liu, L.; Gao, L.; Liu, X.; Li, W.; Zhang, J.; Cao, L.; Du, C. Diet and feeding ecology of whooper swan (Cygnus cygnus) and tundra swan (C. columbianus) at the yellow river wetland of Baotou in spring season. Russ. J. Ecol. 2022, 5, 419–425. [Google Scholar] [CrossRef]
Figure 1. The study area.
Diversity 16 00306 g001
Figure 2. Habitat utilization distribution of whooper swans at various scales during the wintering period.
Diversity 16 00306 g002
Figure 3. Receiver operating characteristic curves for the landscape, daytime, and nighttime scales of the habitat suitability model of wintering whooper swans.
Diversity 16 00306 g003aDiversity 16 00306 g003b
Figure 4. Variable importance influencing the habitat selection of wintering whooper swans at the landscape, daytime, and nighttime scales in the MaxEnt model.
Diversity 16 00306 g004
Figure 5. The most important variables for wintering whooper swans at the landscape scale.
Diversity 16 00306 g005
Figure 6. The distribution of suitable habitats for wintering whooper swans at the landscape scale.
Diversity 16 00306 g006
Figure 7. The most important variables for wintering whooper swans at the daytime scale. Notes: The grey line represent mean value of variables and shadow means the stand error.
Diversity 16 00306 g007
Figure 8. The distribution of suitable habitat for wintering whooper swans at the daytime scale.
Diversity 16 00306 g008
Figure 9. The most important variables for wintering whooper swans at the nighttime scale. Notes: The grey line represent mean value of variables and shadow means the stand error.
Diversity 16 00306 g009
Figure 10. The distribution of suitable habitat for wintering whooper swans at the nighttime scale.
Diversity 16 00306 g010
Table 1. Satellite tracking of wintering whooper swans in Xinjiang Manas National Wetland Park in 2021.
No.AgeTracking PeriodTracking SitesTracking Interval (hours)Tracking Days
2199Adult2021/1/28–2021/2/21240224
2196Adult2021/1/28–2021/2/10135214
2239Adult2021/1/28–2021/2/14187217
2123Adult2021/1/28–2021/3/10214240
2108Adult2021/1/28–2021/3/30679260
2193Juvenile2021/1/29–2021/3/22511251
2186Juvenile2021/1/28–2021/3/18436248
2581Juvenile2021/1/28–2021/3/19544249
V40Juvenile2021/1/28–2021/3/25711255
Table 2. Environmental variables and landscape indices of wintering whooper swans’ habitat selection at landscape, daytime, and nighttime scales.
ScaleVariableDescription
Landscape, daytime, and nighttimePercentage of specific land cover type (%)Percentage of focal patch type coverage by landscape type
Shannon’s diversity index (-)Heterogeneity of landscape
Patch density of specific land types (km2)Divides the total area of the specific landscape by the total number of patches
Edge density of specific land types (m/km2)Sum of edge lengths for focal patch type divided by total area
Landscape shape index of focal land cover types (-)Standardized calculation method for focal land type using total landscape area
Mean patch shape index (-)Average shape index for each patch of the focal type
Mean specific patch area (m2)Average area of each patch of focal type
Aggregation index (%)Distribution of focal patch types
Landscape division index (-)Measure of dispersion for specific patch types
Patch cohesion index (-)Connectivity measurement between patches
LandscapeMean temperature (°C)Mean temperature of 1–3 months
LandscapeMean precipitation (mm)Mean precipitation of 1–3 months
Landscape, daytime, and nighttimeDistance to each land cover type (m)Minimum distance to specified land cover type
Table 3. Selection of optimal gradients in multi-scale radii of overwintering whooper swans at the landscape scale, daytime scale, and nighttime scale.
ScaleRadius kmAUCStandard Error
Landscape scale200.9740.0006
150.9760.0007
100.9750.001
Daytime scale80.9780.001
70.9770.001
60.9750.002
Nighttime scale30.9500.002
20.9450.004
10.9350.007
Notes: Optimal models at each scale are highlighted in bold.
Disclaimer/Publisher’s Note: The statements, opinions and data contained in all publications are solely those of the individual author(s) and contributor(s) and not of MDPI and/or the editor(s). MDPI and/or the editor(s) disclaim responsibility for any injury to people or property resulting from any ideas, methods, instructions or products referred to in the content.

