Article

Application of Machine Learning in Ecological Red Line Identification: A Case Study of Chengdu–Chongqing Urban Agglomeration

1
Key Laboratory of Earth Exploration and Information Technology of Ministry of Education, Chengdu University of Technology, Chengdu 610059, China
2
Sichuan Academy of Ecological and Environmental Sciences, Chengdu 610041, China
3
School of Environment and Ecology, Jiangnan University, Wuxi 214122, China
4
Key Laboratory of Mountain Hazards and Earth Surface Process, Institute of Mountain Hazards and Environment, Chinese Academy of Sciences, Chengdu 610041, China
5
University of Chinese Academy of Sciences, Beijing 100049, China
*
Author to whom correspondence should be addressed.
Diversity 2024, 16(5), 300; https://doi.org/10.3390/d16050300
Submission received: 28 March 2024 / Revised: 9 May 2024 / Accepted: 13 May 2024 / Published: 16 May 2024

Abstract

:
China’s Ecological Protection Red Lines (ERLs) policy has proven effective in constructing regional ecological security patterns and protecting ecological space. However, the existing methods for the identification of high conservation value areas (HCVAs) usually use physical models, whose parameters and processes are complex and only for a single service, affecting the ERL delineation. In this study, the data-driven machine learning (ML) models were innovatively applied to construct a framework for ERL identification. First, the One-Class Support Vector Machine (OC-SVM) was used to generate negative samples from natural reserves and ecological factors. Second, the supervised ML models were applied to predict the HCVAs by using samples. Third, by applying the same ecological factors, the traditional physical models were used to assess the ecological services of the study area for reference and comparison. Take Chengdu–Chongqing Urban Agglomeration (CY) as a case study, wherein data from 11 factors and 1822 nature reserve samples were prepared for feasibility verification of the proposed framework. The results showed that the area under the receiver operating characteristic curve (AUC) of all ML models was more than 97%, and random forest (RF) achieved the best performance at 99.57%. Furthermore, the land cover had great contributions to the HCVAs prediction, which is consistent with the land use pattern of CY. High-value areas are distributed in the surrounding mountains of CY, with lush vegetation. All of the above results indicated that the proposed framework can accurately identify HCVAs, and that it is more suitable and simpler than the traditional physical model. It can help improve the effectiveness of ERL delimitation and promote the implementation of ERL policies.

1. Introduction

The ecosystem provides natural conditions and life-supporting benefits for human well-being [1]. However, population growth and socio-economic development have exacerbated the impact of human activities on the ecological environment [2,3]. The issue of ecological security has aroused widespread concern among the public and society. In 2015, China introduced the Ecological Protection Red Lines (ERLs) policy to ensure the sustainable development of the ecosystem. In 2017, “Guidelines for the Delineation of the Ecological Protection Red Lines” was implemented to protect the land with important ecological functions, as well as ecologically sensitive and vulnerable areas, such as water sources, natural reserves, forests, wetlands, grasslands, and so on [4]. From the aspect of the wholeness principle, the “Guidelines” stipulate for consideration of the connectivity of natural boundaries and ecological corridors, such as mountains, rivers, geomorphic units, and vegetation, to prevent habitat fragmentation. However, from the principle of coordination, the ERL should be connected with the current situation of land use, and urban and rural development layout, which leads to the contradiction between ecological construction and economic development. Therefore, using the methods of the “Guidelines” might be affected by subjective human factors [5]. The physical models of ecosystem services (ESs) rarely consider the differences between regions, resulting in ambiguous ecological areas and controversial ERL boundaries [6,7]. To solve those problems, it is necessary to accurately identify the high conservation value areas (HCVAs), in combination with the data on natural reserves and land use, to promote the scientific and reasonable delimitation of the ecological protection red line.
With the development of remote sensing and artificial intelligence technology, machine learning (ML) methods have been applied in earth science. ML is a data-driven method that can analyze the features between factors and targets for classification and prediction. Common ML methods include logical regression (LGR) [8], Support Vector Machine (SVM) [9], random forest (RF) [10], and multi-layer perceptron (MLP) [11]. Compared to physical models, ML can avoid theoretical assumptions and complex parameters by automatically optimizing parameters [12]. In ecological research, ML has been applied for species identification [13], species distribution [14], ecosystem function prediction [15], ecosystem monitoring [16], and so on. ML has been proven to be accurate and effective in the prediction of species or ecosystems based on ecological environment variables as factors [17,18,19]. From the existing research, ML has not been directly applied to the study of ecological protection red line delimitation. Referring to existing achievements, using ML and nature reserves to predict the potential high-value ecological area is expected to improve the accuracy of the ERL delimitation.
The Chengdu–Chongqing double-city economic circle has become a major strategy for national regional development, taking Chengdu and Chongqing as the core cities to drive the coordinated development of Chengdu–Chongqing urban agglomeration (CY) [20,21]. However, in the process of economic and urbanization development, CY has also accumulated some contradictions and problems, such as urban sprawl [22] and serious environmental pollution [23], which have greatly impacted the original ecological and spatial structure of the city and caused the decline of ecological functions. In this case, ecological protection has become a major practical problem for the sustainable development of CY. However, the ecological environment of CY is relatively complex, including a large area of forests, mountains, grasslands, wetlands, water areas, and other ecosystems. Therefore, the delineation of the ERL requires a comprehensive assessment of different ESs and the balance between economic development and ecological protection.
Taking CY as an example, this study discusses the feasibility of using ML to identify HCVAs in the delimitation of ERL. Our work offers three contributions. First, the physical models were used to quantitatively evaluate the ecological service function and spatial distribution of CY by the basic ecological factors. Second, using the same factors, the nature reserve and ML methods were applied to directly identify the important ecological protection area. Third, the contributions of factors to CY HCVAs were analyzed based on data-driven methods. This study establishes a framework to identify HCVAs directly by using ML, which can reduce the complex physical modeling process in the ES function calculation. Furthermore, data on CY were used to verify the feasibility of ML methods in ERL delineation.

2. Materials

2.1. Study Area

The study area of CY is located in the middle of the Sichuan Basin, southwest of China, covering an area of 185,000 km2 (Figure 1). It is an important ecological safety barrier and water source protection area in the upper reaches of the Yangtze River. The mainstream of the Yangtze River runs through the whole territory from southwest to northeast, and the main tributaries include the Minjiang River, Jialing River, and Tuojiang River. The terrain of the CY region is complex and diverse, with the characteristic of high surroundings and a low middle. From west to east, there are Chengdu Plain, hills in central Sichuan, and parallel valleys in eastern Sichuan. CY is the region with the largest urban and population density in southwest China. The urbanization rate has increased from 44.74% to 54.94% in recent years [24], and has become an important platform for the development of Western China.
The natural reserves in the study area exhibit diverse distribution characteristics and other features influenced by factors such as geographical location, topography, biodiversity, and human activities. These reserves encompass a variety of landscapes, including mountains, rivers, forests, and wetlands, and are situated in regions of high ecological significance and biodiversity. Their primary objective is to safeguard unique habitats, endangered species, and ecosystems.

2.2. Data Sources

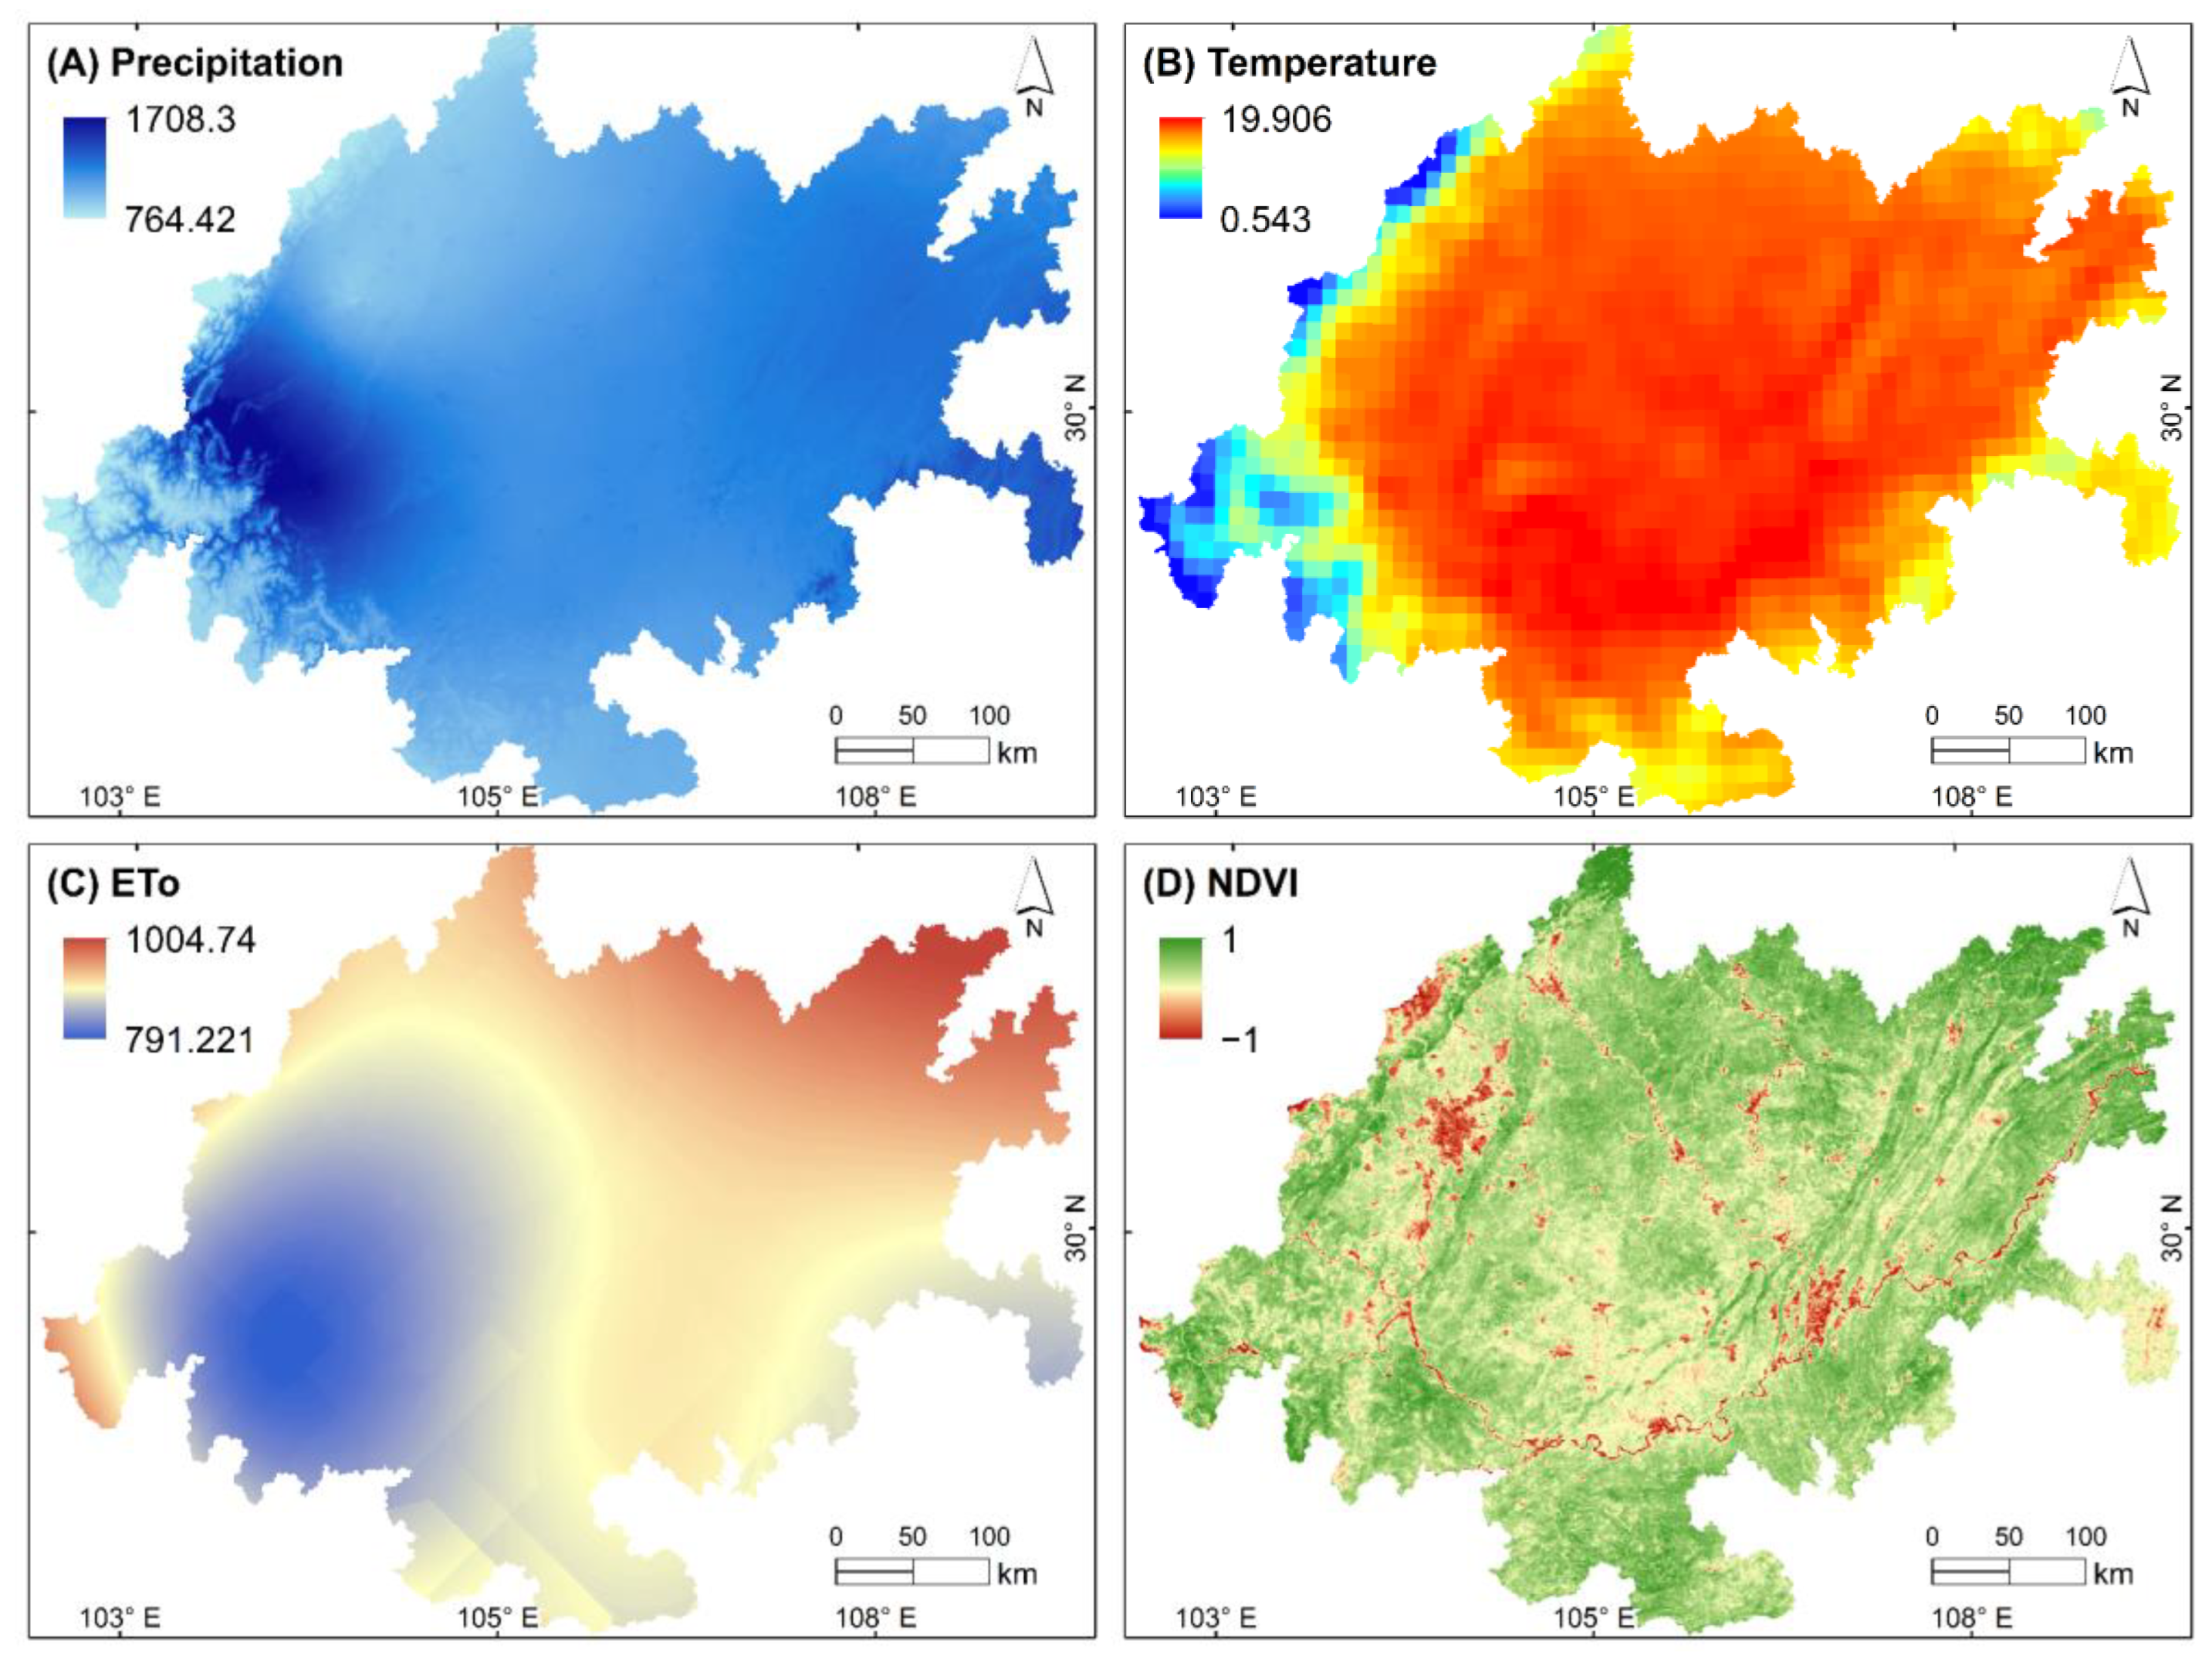
The dataset in this study was derived from Google Earth Engine (GEE) and open-source research websites. Referring to the ES functions and related research [25,26,27,28,29], we collected 11 factors in raster format (Figure 2), including precipitation, temperature, reference evapotranspiration (ETo), elevation, slope length, normalized difference vegetation index (NDVI), net primary productivity (NPP), soil depth, plant available soil water (PASW), soil erodibility, and land use. These factors are annual composite data from the year 2020. The nature reserve data originates from the National Directory of Nature Reserves [30]. The detailed information is in Table 1.

3. Methods

3.1. HCVAs Identification Framework

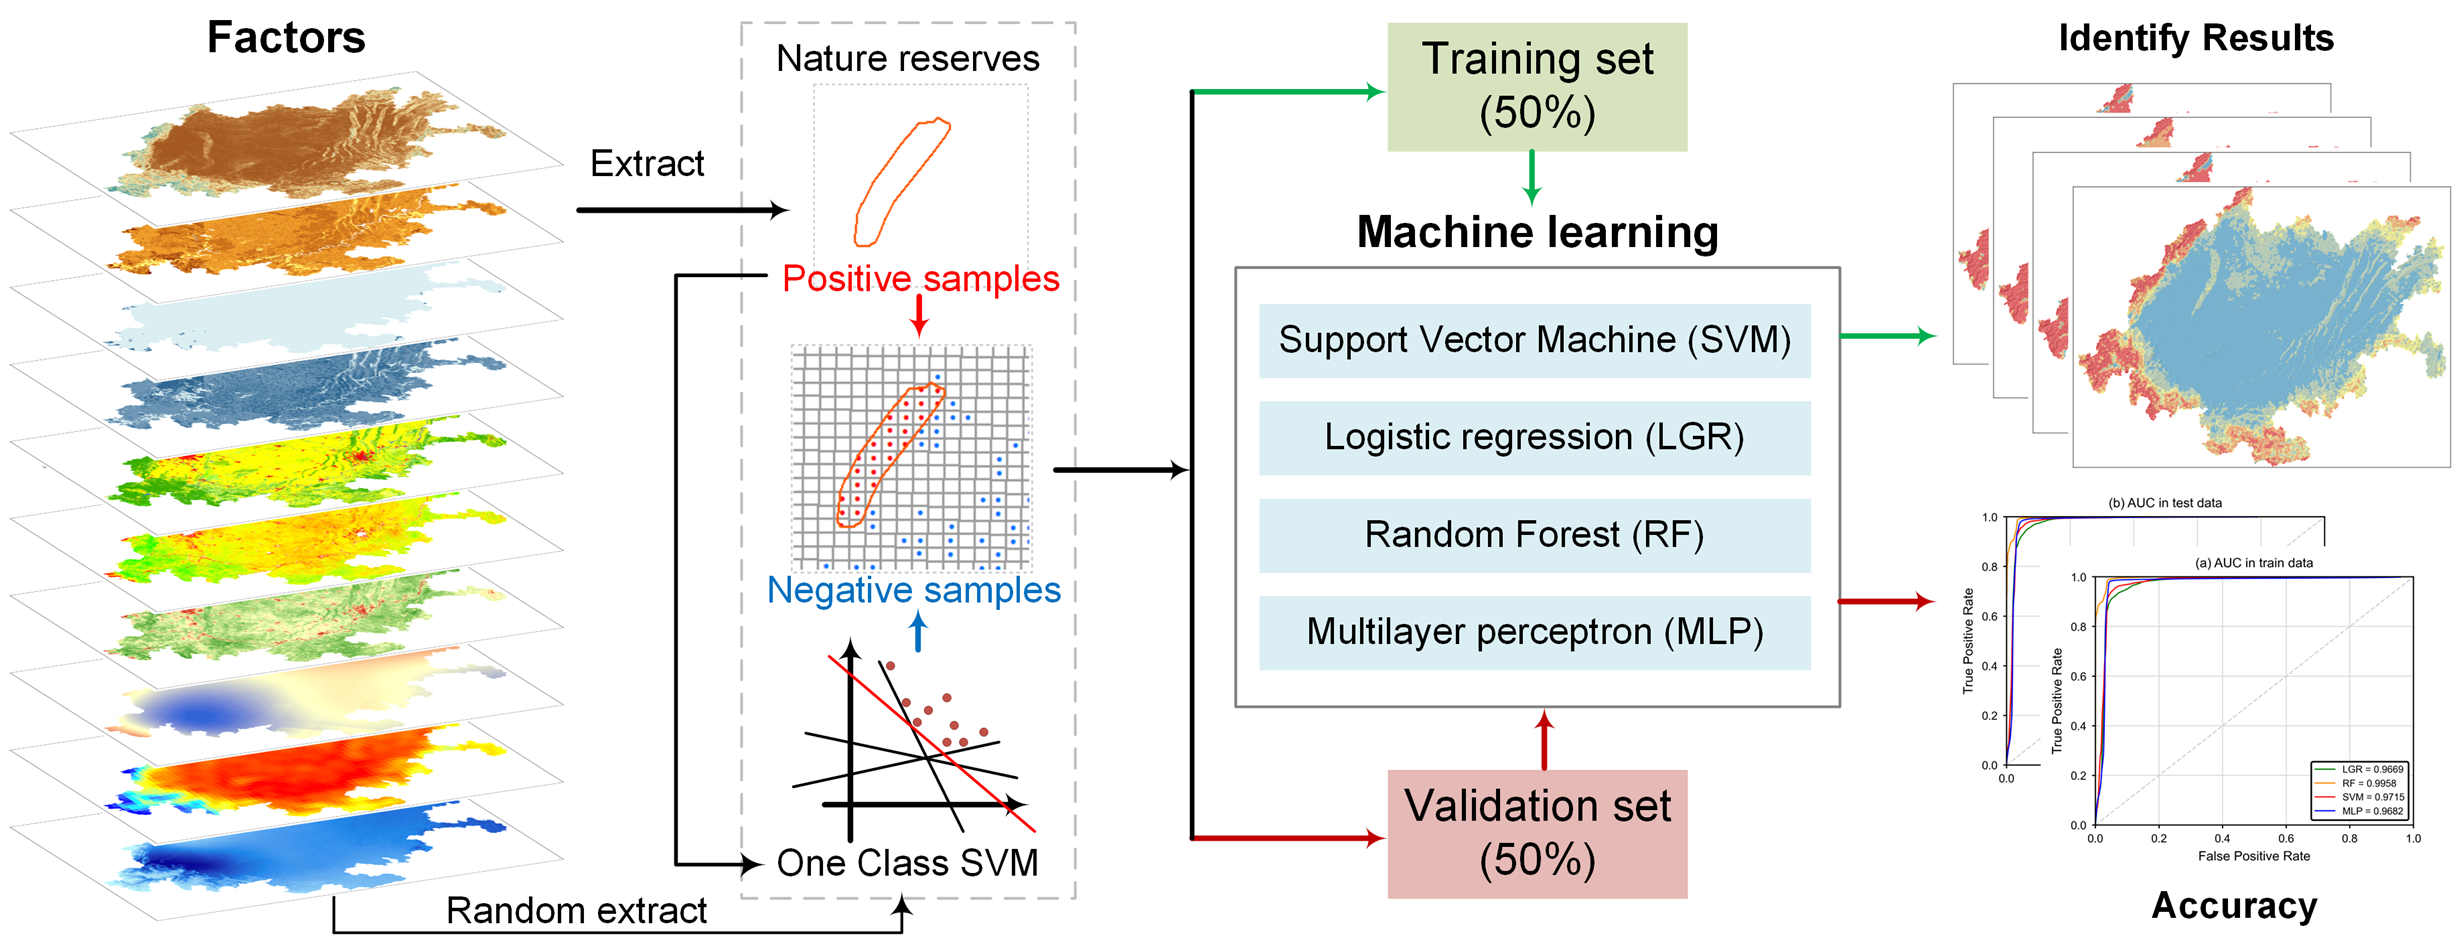
We proposed a framework that uses ML methods to directly identify HCVAs based on nature reserves (Figure 3). First, we divided the research area into grid cells of 2 km × 2 km, with the central points of the grid cells set as the samples for extracting factor values. Points covered by the nature reserve were designated as positive samples. Subsequently, a One-Class SVM (OC-SVM) was trained by using positive samples and the extracted factor values. Then, randomly selected points outside of the nature reserve were input into OC-SVM to calculate similarity, and samples with significant data differences were filtered out as negative sample points. The positive and negative samples, along with the extracted factor values, were randomly divided into nonoverlapping training and validation sets. The ML model was trained using the training set and evaluated for accuracy using the validation set. Finally, the sampled values from the entire area were input into the trained ML model to obtain identification results in point format for the entire area (with a 2 km spacing). Inverse distance interpolation was used to interpolate the results into a 1000-m grid, and subsequently, a natural breaks method was applied to categorize the continuous grid values into five levels.

3.2. Experimental Process and Environment

This study aims to apply data-driven ML methods to directly identify HCVAs, simplifying the complex modeling process. Therefore, the physical model is only used for comparing identification results. The detailed flowchart of our experiment is shown in Figure 4. First, the physical models were used to quantitatively evaluate the four ES functions, then we normalized and added them as the final results. Note that this result was only used for comparison. Next, we used a semi-supervised OC-SVM to generate negative samples and used supervised ML models for HCVAs identification. Significantly, we maintained consistency of the input factors for both the physical model and the ML methods to ensure the fairness of the control experiment.
The above data processing was accomplished by using the Python library Geospatial Data Abstraction Library (GDAL) and ArcGIS 10.8. The physical model used the GDAL and Numpy libraries or InVEST software 3.14.1 for data reading, writing, and computation. The ML model was implemented in the Python 3.9 environment using the Scikit-Learn library.

3.3. Ecosystem Service Functions

Water conservation (WC) refers to the water retained in ecosystems, which plays a significant role in regulating surface runoff, replenishing groundwater, and improving water quality through purification processes [31]. The water production module [32] of the InVEST model is used to simulate the water production service of the study area, and the annual total water production of each grid unit in the study area was calculated based on the Budyko water–heat coupling balance assumption.
Soil erosion protection (Spro) pertains to the capacity of soil to retain essential elements like water and nutrients that are vital for plant growth [33]. The revised general soil loss equation (RUSLE) [34] is used to quantitatively assess soil conservation.
Biodiversity conservation (Sbio) helps to maintain ecosystem functioning, support human livelihoods, and provide basic services such as clean water, air, and food [35]. The NPP quantitative index evaluation method takes NPP and combines the small and easily accessible terrain and climate data for evaluation [36]. It is objective, accurate, and easy to operate, and has been widely used in the evaluation and management of biodiversity maintenance functions.
Carbon storage and oxygen production (CSOP) refers to the long-term storage of carbon in natural reservoirs such as forests, soils, oceans, and geological formations [37]. The InVEST model is widely used in estimating carbon reserves [38] and has low demand for input parameters, which can provide relatively accurate simulation.
The formulas for the four ES functions are shown in Table 2.

3.4. Machine Learning Methods

Support Vector Machine (SVM) is a nonparametric supervised model developed from statistical learning [39]. Its principle is to introduce a kernel function to map the input to a high-dimensional feature space to achieve linear separability. It is also defined as a linear classifier with the largest interval in the feature space.
Logistic regression (LGR) is a statistical method that uses a logistic function to model the relationship between independent variables and a binary dependent variable [40]. By estimating the parameters of this function, the logistic regression model can accurately fit the data and make predictions based on the relationships it has uncovered.
Random forest (RF) is an integrated method based on decision trees [41]. It generates multiple subsets from the original dataset by random sampling and builds a decision tree for each subset to form a forest [42]. The final output result is determined by the majority voting and the degree of convergence of fitting.
Multilayer perceptron (MLP) is composed of an input layer, a hidden layer, and an output layer. Each layer contains one or more neurons [43]. The neurons of each layer are connected by weight [44]. The output of each neuron is obtained by applying an activation function to the weighted sum of inputs. The weights are continuously adjusted during the training process to make the model’s predictions as close to the true values as possible.
The formulas for the four ML functions are shown in Table 3.

3.5. One-Class SVM for Samples

One-Class SVM (OC-SVM) is different from traditional SVM algorithms where data are labeled as positive or negative examples [45]. OC-SVM only deals with the target class and aims to identify outliers or anomalies in the data. The algorithm creates a decision boundary (or hyperplane) to separate the target class from other data. Then, it identifies the points closest to this boundary and considers them as representatives of the target class. OC-SVM is commonly used for outlier detection, data classification, and data clustering. The formula can be written as
m i n ω , ξ i , ρ 1 2 | | ω | | 2 + 1 v N i = 1 N ξ i ρ
s . t . ( ω , Φ ( x i ) ) > ρ ξ i ,   i = 1 , 2 , , n ,   ξ i 0
where ω ,   ρ is the weight and threshold of the support vector; ρ , ξ i is the relaxation variable; and Φ ( x i ) is the mapping function that maps x i to a higher dimension.

3.6. Importance Analysis

Permutation importance (PI) can identify the importance of features in an established ML model. It works by measuring the decreases in the model’s accuracy when each feature’s values are randomly shuffled while holding the other features constant. The formula can be written as
i j = s 1 K k = 1 K s k , j
where i j is the importance of the feature; j , s is the accuracy score calculated from the original data; K is the number of iterations; and s k , j is the score calculated from corrupted data that randomly shuffle column j .

3.7. Collinearity Analysis

The Variance Inflation Factor (VIF) and tolerance (TOL) were used to verify the multi-collinearity between the factors [31]. Collinearity refers to a situation where two or more factors exhibit a strong correlation, indicating their interdependence. TOL and VIF formulas can be written as
TOL = 1 R j 2
V I F = 1 / T O L
where R j 2 represents the coefficient of determination for the regression of explanatory j on all remaining interpretable variables.

3.8. Accuracy Analysis

From a quantitative perspective, we used overall accuracy (OA), precision, sensitivity, specificity, F1-score, kappa, and the area under the receiver operating characteristic curve (AUC) to evaluate the performance of constructed ML models. The closer these indicators are to 1, the better the performance of the model [46,47].
A c c u r a c y = ( T P + T N ) / T P + T N + F P + F N
P r e c i s i o n = T P / ( T P + F P )
S e n s i t i v i t y = T P / ( T P + F N )
S p e c i f i c i t y = T N / ( T N + F P )
K a p p a = ( P o P e ) / ( 1 P e )
where True Positive ( T P ) represents correctly predicted positive instances, while False Positive ( F P ) indicates incorrectly predicted positive instances. True Negative ( T N ) denotes correctly predicted negative instances, and False Negative ( F N ) signifies incorrectly predicted negative instances. P o is the observed accuracy, and P e is the expected accuracy if the classifier’s predictions were completely random.
The A U C is a metric used to evaluate the performance of a binary classification model. The formula can be written as
A U C = 0 1 T P R ( f p r ) d ( f p r )
where T P R ( f p r ) is the True Positive Rate (sensitivity) as a function of False Positive Rate (1—specificity).

4. Results

4.1. Evaluation of Ecosystem Services

According to the evaluation method in Section 3.1, the ESs of CY were obtained, as shown in Figure 5. The distribution of WR shows high concentrations in the southwest and northeast regions. The high-value areas in the southwestern region are centered around Ya’an, Meishan, and Leshan, and spread out to the surrounding cities of Chengdu, Meishan, Ziyang, Neijiang, Zigong, and Yibin. The high-value areas have a semi-circular distribution pattern, which is consistent with the spatial distribution of the Yangtze River Basin. The high-value areas of Spro are mainly distributed in the mountainous and hilly areas on the edge of the Sichuan Basin, with a concentration in the southern part of Leshan, Meishan, and the entire territory of Ya’an. They also form a belt-shaped region in the western part of Chengdu, Deyang, and Mianyang, as well as being discretely distributed in Dazhou, the Four Mountains area of Chongqing, and the Three Gorges Reservoir area. The high-value areas of Sbio are concentrated in the southwest corner of the study area, including Qionglai, Pujiang, Mingshan, Ya’an, and the northern part of Leshan. The vegetation coverage in this area is relatively high, and there is less human disturbance. From the perspective of the distribution of CSOP, the spatial pattern of carbon storage in the study area is highly consistent with the land cover types in the region. It presents an overall distribution feature of “high around, low in the middle”. Specifically, the high-value areas of carbon storage are displayed in the mountainous and hilly areas on the edge of the Sichuan Basin, and in the mountainous areas of the main city of Chongqing.
Finally, we normalized and added the four ES evaluation results to obtain the total ES map as the HCVAs’ results. We used the resampling method (gdal.Warp) to sample the four ES functions at a resolution of 1000 m before conducting calculations. On the grid scale, the data of four ecological services are sampled at a resolution of 1000 m. To avoid the impact of different units of evaluation indicators on the clustering results, the dataset is normalized and converted into dimensionless values. According to the results (Figure 5E), the important ecological areas of CY are mainly distributed in the mountain areas on the outer edge of the Sichuan Basin, including Luzhou, Xuanhan County of Dazhou, Ya’an, Meishan, Leshan, Nanchuan, Jiangjin District of Chongqing City, and other areas, covering an area of 47,982 km2 and accounting for 24.86% of the total study region. We analyzed the delimited nature reserves and the important ecological areas in CY listed above, and the results show that about 87% of the nature reserves are in the important ecological areas.

4.2. One-Class SVM Sample Selections

According to the “Guidelines” and the overlap of nature reserves and important ecological areas, the 1822 points in nature reserves were selected as positive samples. OC-SVM only focuses on the feature learning between the nature reserve and ES factors, so we extracted the factors’ value using positive samples and put them into the OC-SVM model for training. Then, the points outside of the nature reserves were put into trained OC-SVM for predicting value, which was the similarity score based on the features of factors. The points with lower similarity scores as the negative samples in a 1:1 ratio and their spatial distribution are shown in Figure 6 (blue points). According to the land use, in the positive samples generated by the nature reserve, the major land use types are forest (79.73%), grassland (9.34%), cropland (8.49%), and shrub (1.46%). Among the negative samples selected by OC-SVM, the major land use types are impervious (66.95%), cropland (13.96%), and water (6.87%); these areas have relatively low supply capacity.

4.3. Factor Selection

The positive samples and negative samples were combined to extract the value of the ES factors, and the labels were set to one and zero, respectively. Referring to Section 3.7, if the VIF is greater than 10 and the TOL is less than 0.1, it indicates that the collinearity of the factors is high [48].
It can be seen in Table 4 that the collinearity of DEM was high, and it was removed in the subsequent experiments. The weighted least squares (WLS) method was used for statistical testing [49]. The p value is used to assess the significance of parameters in the statistical model, while the standard error is used to measure the precision and stability of estimates. From the results, the p values of the remaining factors were less than 0.1, indicating that at the 90% confidence level, there is a statistical correlation between the factors and samples.

4.4. Prediction Results of ML Models

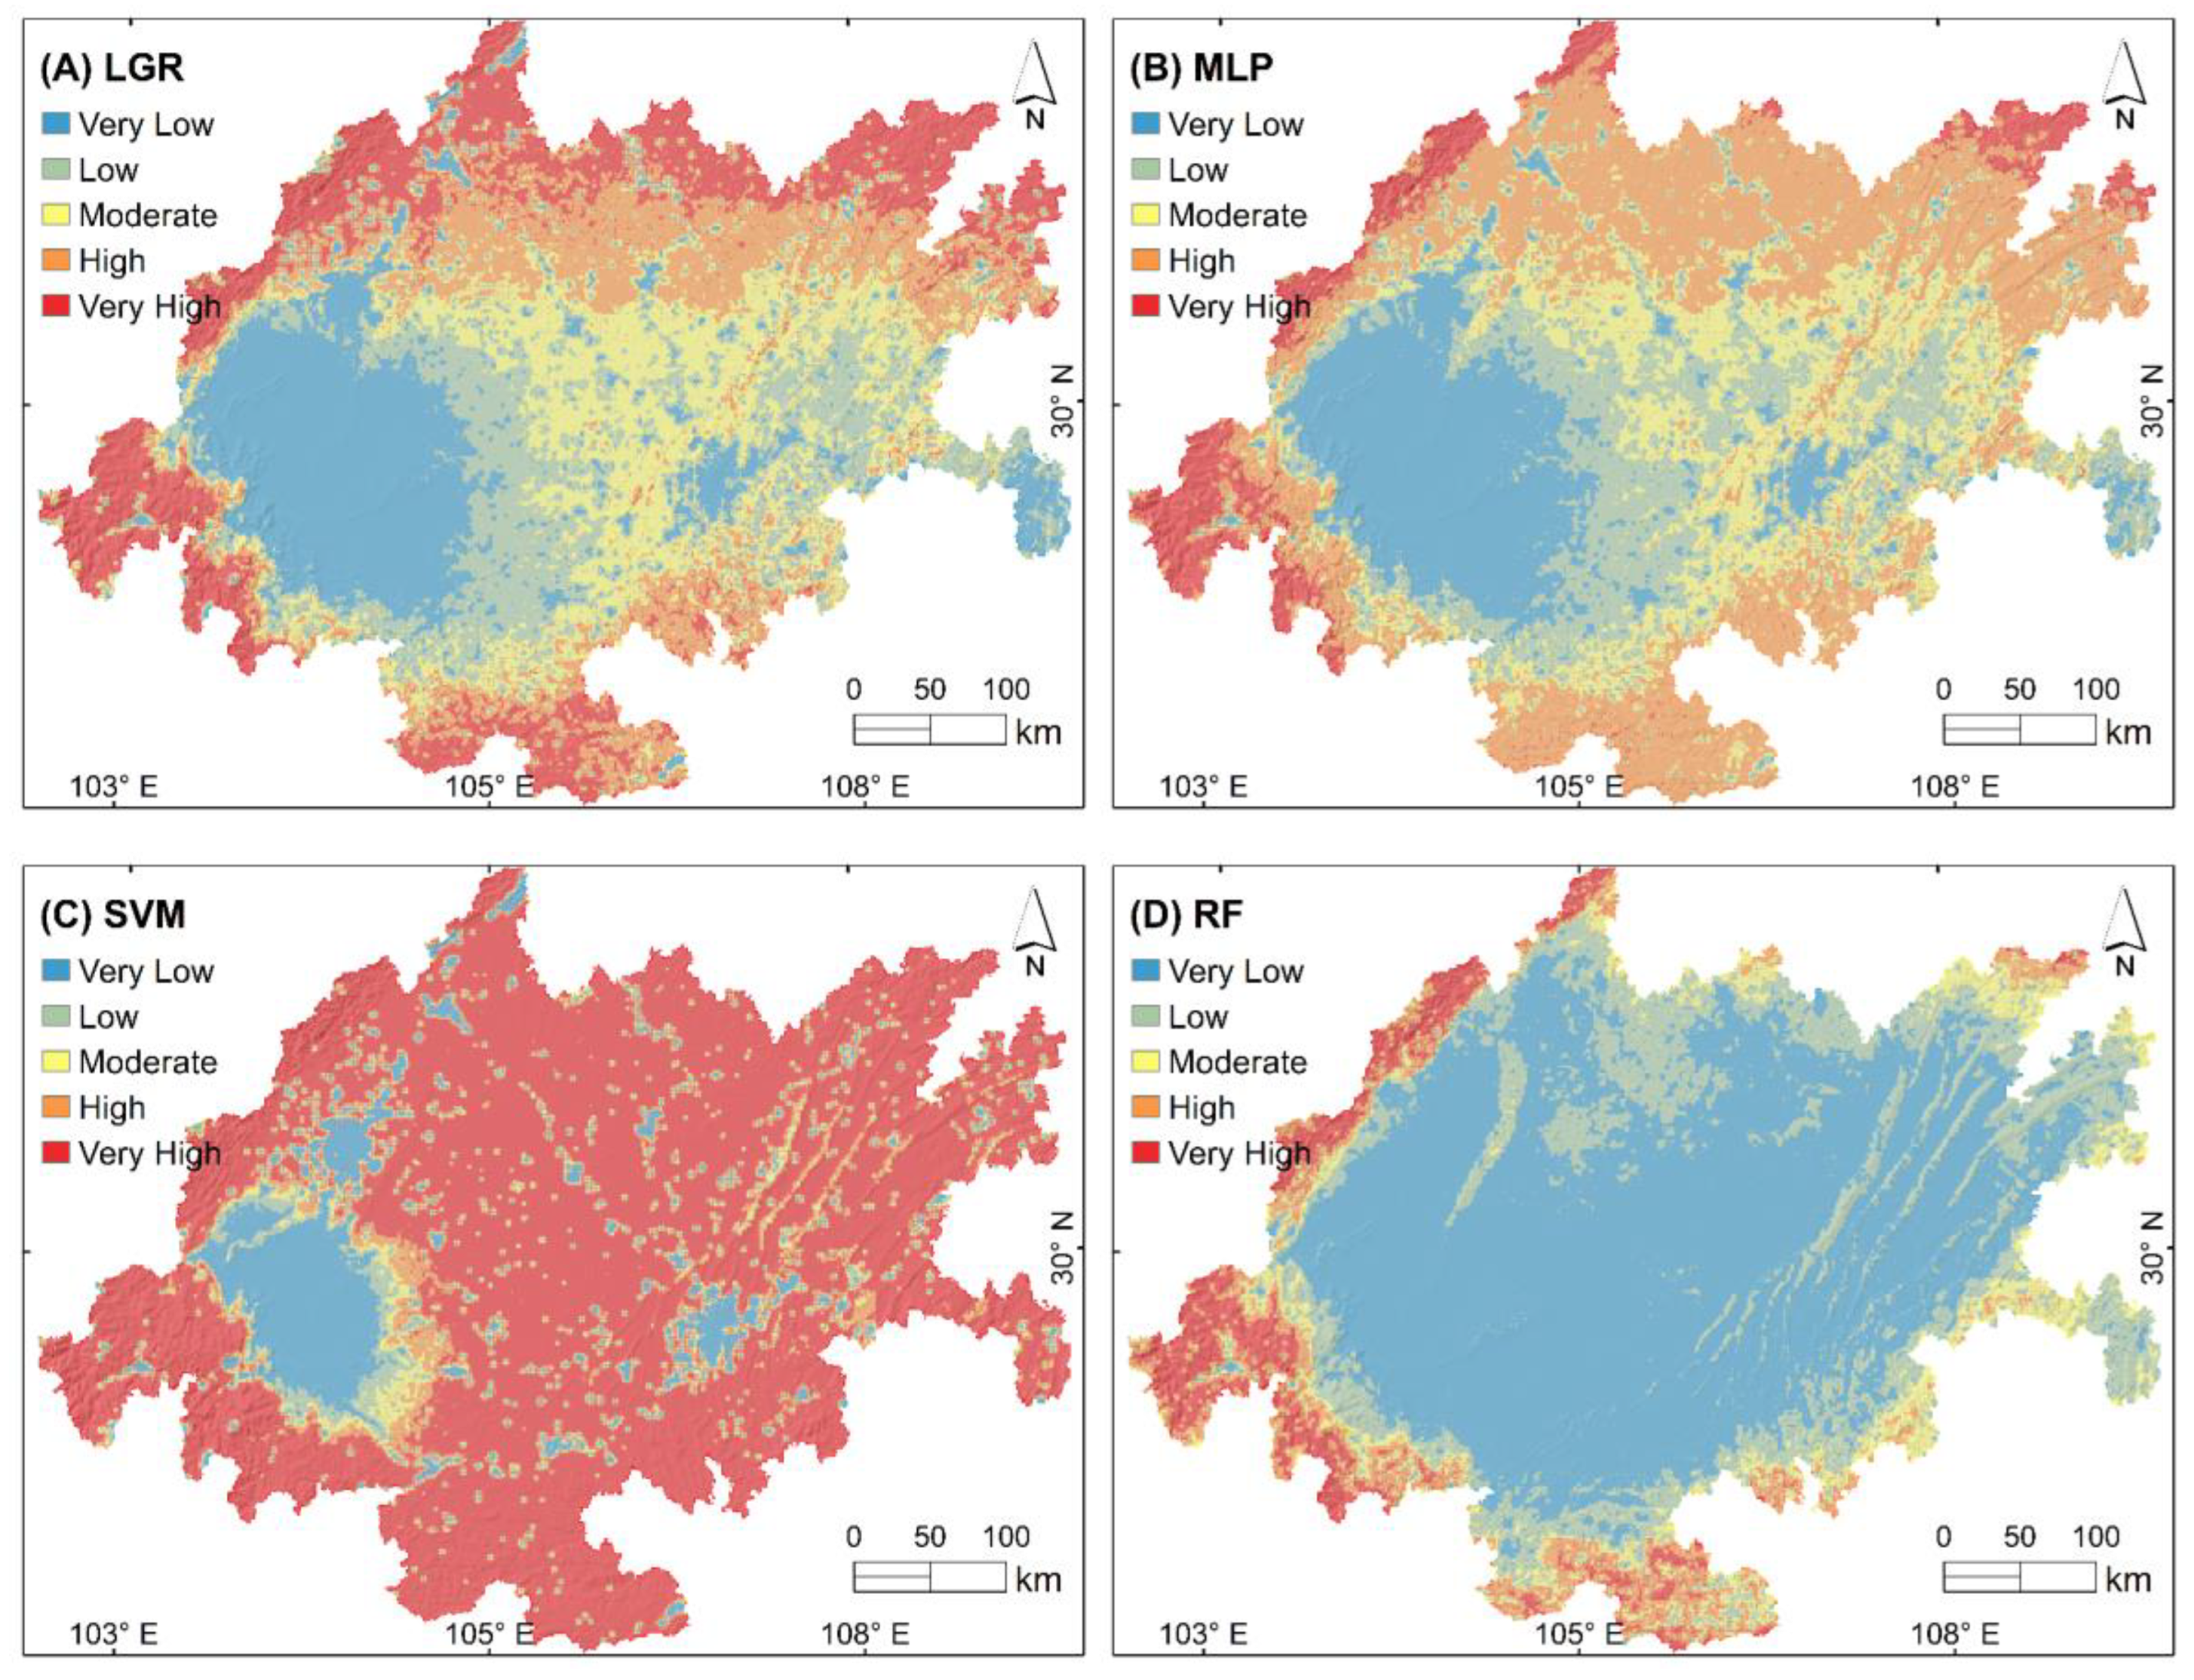
We used a grid search [50] to find the optimal parameters of MLs, which was implemented using Scikit-Learn. For LGR, we adopted L1 regularization and the SAGA optimization function. For SVM, the kernel function was RBF and the C value was 15. For RF, the tree number was 100 and the maximum depth was 3. For MLP, the layer number was 3, each layer had 100 neurons, and the activation function was Logistic. Based on the trained model, the factor value was extracted from all grid-center points in the study area, then put into ML models for prediction. We used the inverse distance weighting method in ArcPy to generate raster maps of 1 km resolution.
Figure 7 shows the visualized predicted results by ML methods. We used the natural breaks method to categorize the continuous predicted results into five levels, designating regions with the very high level as HVCAs. The area (percentage) of HVCAs predicted by RF, LGR, MLP, and SVM models were 12,071 km2 (6.52%), 36,775 km2(19.88%), 14,128 km2 (7.64%), and 105,574 km2(57.06%), respectively. For the four ML methods, the performance of SVM is comparatively poor, as it tends to classify a large portion of the area as high-value regions. On the other hand, RF and MLP yield results that are more similar to the outcomes of the physical model. They identify the surrounding mountains of the CY area as HCVAs, with the main land type being forest land. From the interpretability perspective of the physical model, these areas exhibit importance in all four ES functions. Consequently, the identification results of RF and MLP are considered more accurate.

5. Discussion

5.1. Guidance on the Contribution of ES Factors

In this study, ten impact factors were selected to cover the basic inputs of four ES functions, which are highly related to the ecologies of the CY region. Based on the factors, ML models can obtain good prediction results through relationship fitting. Based on Section 3.6, the PI method was used to quantitatively analyze the importance of all factors in the trained ML models, which is helpful to analyze the leading factors affecting the ecology, and to improve the weight distribution in the regional evaluation.
As the factor analysis results (Figure 8) show, land use, soil depth, slope length, temperature, and precipitation had significant contributions to the identification, among which land cover dominates. For RF, most of the factors make certain contributions. These models predicted the mountainous areas around the basin as HCVAs, wherein the patches with rich vegetation can provide the resources needed for the organisms’ survival [51,52]. It is worth noting that the area with abundant precipitation had a low prediction value and a lack of verification of the nature reserve. The area is located in Ya’an, where topographic rainfall is generated due to the steep rise in altitude [53]. A large amount of precipitation and steep terrain cause soil erosion, and the area is not suitable for ecological protection [54]. Due to the influence of precipitation, LGR, SVM, and MLP have inaccurate prediction results in the northwest of CY.
Referring to physical models, from the results of ES functions and the spatial distribution of factors (Figure 2 and Figure 5), land use, precipitation, temperature, evapotranspiration, and terrain have a significant impact on the calculated spatial trends of ecological service functions. Due to human activities, land use changes may become more frequent and intense, significantly impacting ESs and potentially affecting human well-being [55]. Meteorological factors can be used to predict whether a region has the humidity and temperature required for plant growth [56]. Vegetation cover indicators can serve as evidence of whether an area can provide the resources necessary for plant and animal survival [52]. Changes in climate and landscape patterns may alter hydrological and material cycles, affecting the supply capacity of ES [57].

5.2. Feasibility of Using ML Models for ERL Identification

The physical models are effective in ecological function evaluation, especially in the “Guidelines”. However, physical models usually consider the single ES function, which may lead to low accuracy of the delineation of the red line [58,59,60,61,62,63]. From the perspective of data, the physical models focus on interpolation data, and some used in “Guidelines” have a dependence on NPP. Physical models rarely consider the artificial delimitation of natural reserves. From the perspective of methodology, the parameters of the physical models are complex and lacking in the combination of multiple service factors, while the relationship between ecological factors and HCVAs is usually nonlinear. From the perspective of the region, the physical model is given a weight artificially, which does not apply to a wide range of regions. The nonuniformity between regions leads to the different contributions of factors to the ecology, and the corresponding weights are also different. From the ES evaluation results given by physical models (Figure 4), the spatial distribution of WC and Sbio is significantly different from that of Spro and CSOP. The high-value areas of WC and Sbio are not consistent with the nature reserves in CY. It is difficult to automatically determine which service dominates the functions of important ecological areas. Based on the above analysis and experimental results, the differences between the ESs evaluated by the physical model in CY are large, and the ecological areas identified as important have errors, which is not conducive to the basis and policy implementation of the red line delimitation.
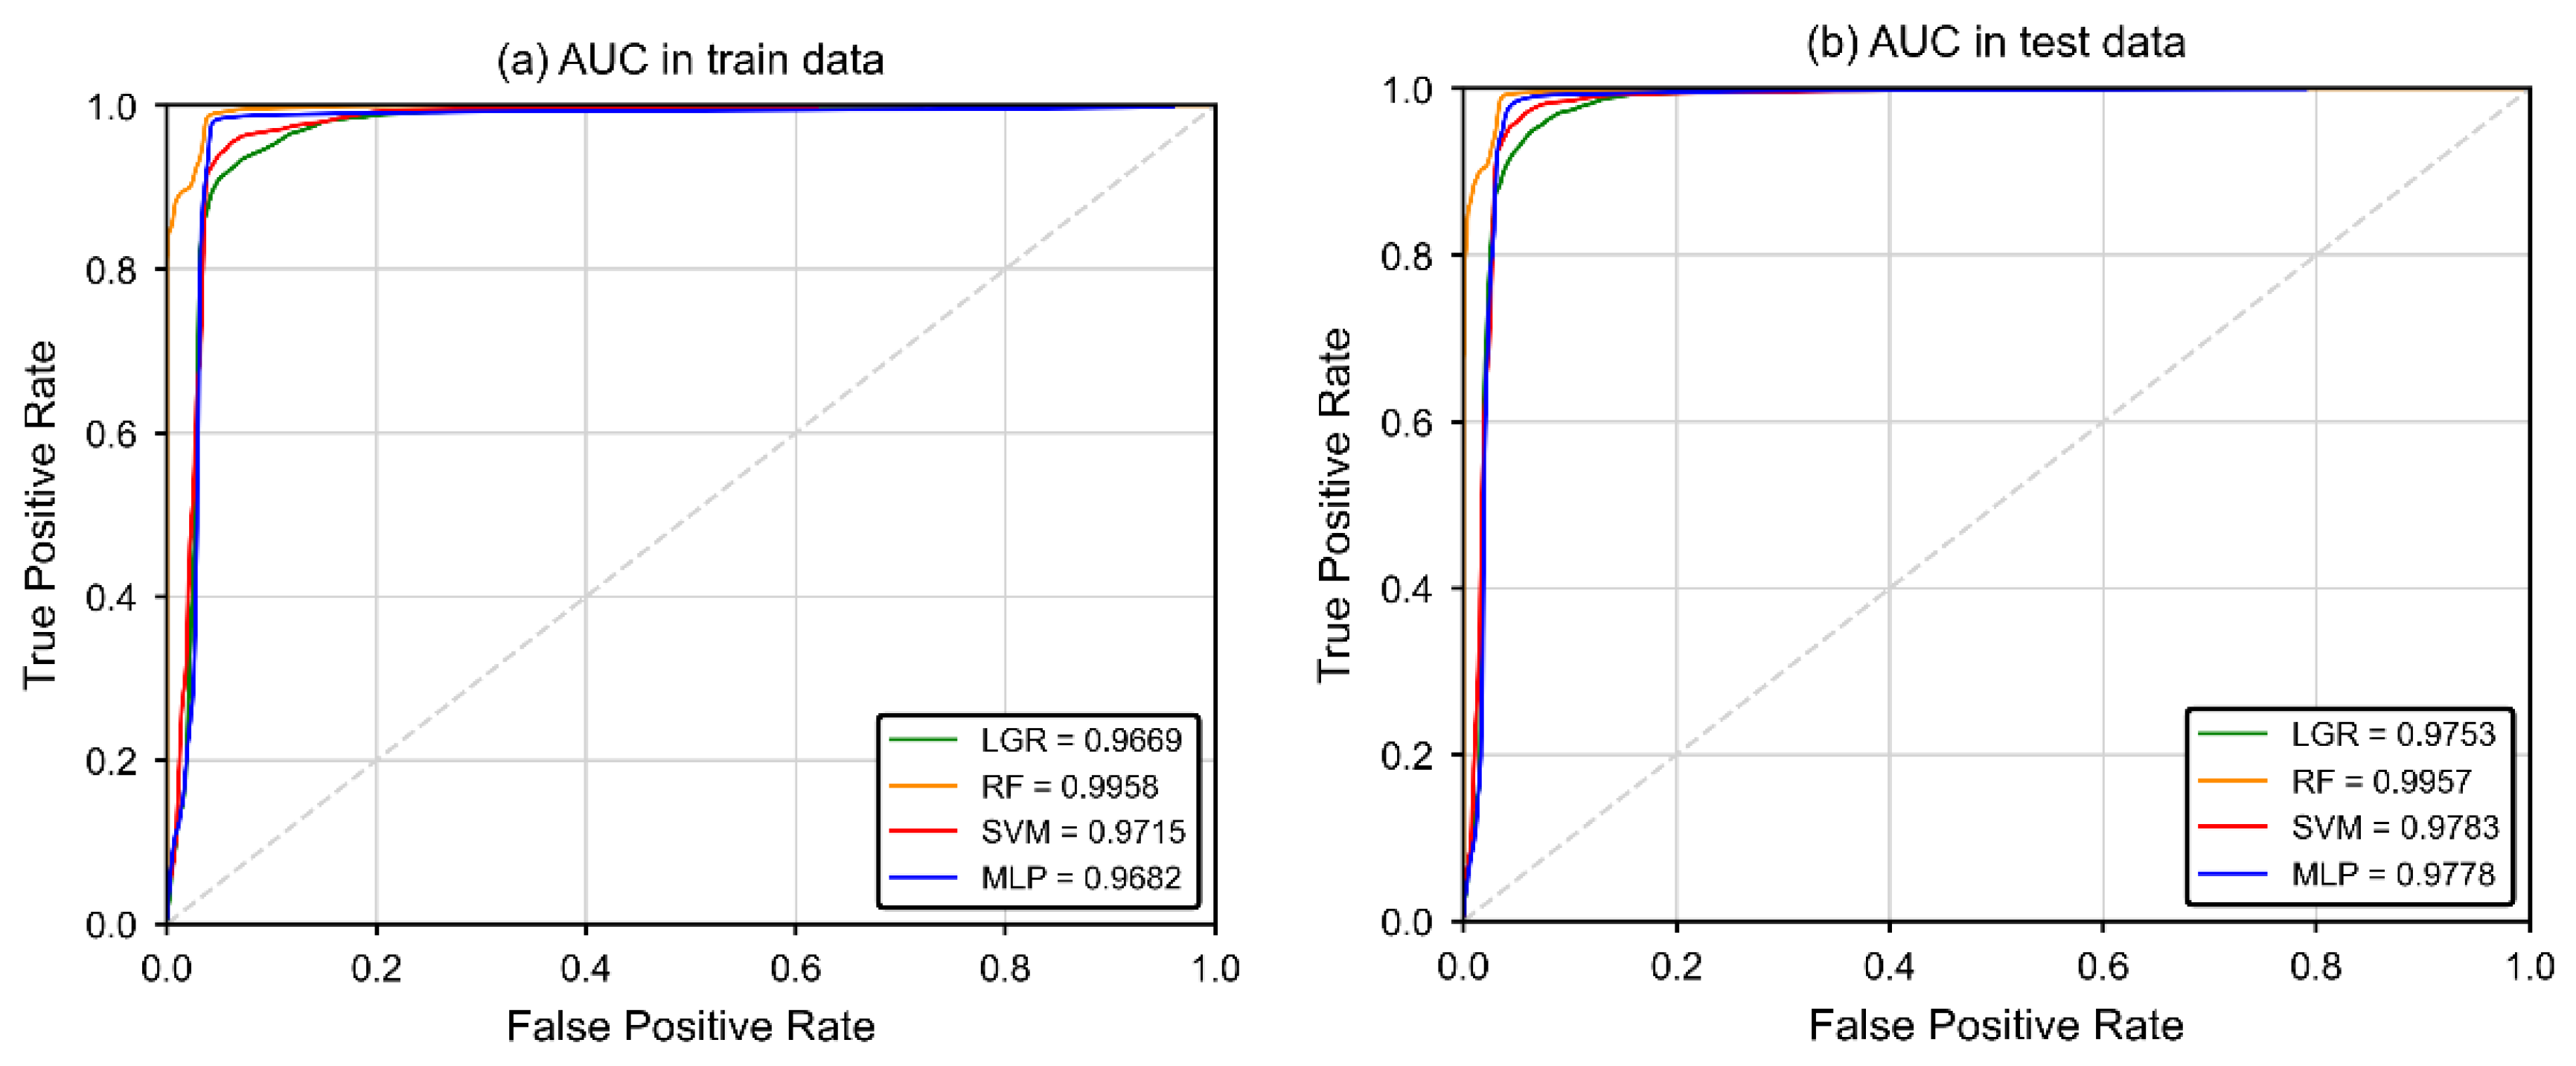
According to the tested results of natural reserves (Figure 5 and Figure 6), the ML models have better accuracy than physical models. Among the identified very high-value areas, the area of natural reserves accounts for 54.45% (LGR), 58.45% (SVM), 71.13% (MLP), and 87.87% (RF), respectively. However, the overlap results of physical models do not cover the natural reserves in the north and south. Because of accuracy (Figure 9), the AUC of all ML models in the test dataset is more than 97%, of which the AUC of the RF model is the highest (99.57%). The kappa coefficient (in Table 5) also shows the stability of ML models.
In general, the case of CY proves that compared to the traditional physical models, the ML can help improve the accuracy of the delimitation of the ecological protection area, and effectively reduce the complex formula calculation. Applying it to the delimitation of the ERL, it can be adapted to local conditions based on data-driven results, and then it can help improve and restore the ecology under the guidance of policies.

6. Conclusions

In this study, we proposed a framework that uses ML methods to directly identify HCVAs based on nature reserves. Unlike traditional physical models, this data-driven framework simplifies the complex process of ecological service computing and improves accuracy. Taking CY as an example, the ecological status of the study area was assessed using physical models of ES functions. Based on natural reserves, the OC-SVM was used to generate the negative sample. The sample results indicated that forest land accounts for 79% of the natural reserve, and impervious land accounts for 66.95% of the negative sample. We explored the feasibility of ML models in potential ecological reserve identification. The accuracy results implied that the AUC of all ML models was more than 97%, and RF achieved the best performance. The above results justified that the framework for ERL delineation with the application of the ML model is effective and convenient. The data-driven method can adapt to local conditions and uncover areas neglected by physical models. Additionally, we analyzed the contribution of impact factors in the identification of HCVAs. According to the results, the land cover showed great contributions; therein, the ERL delimitation needs to be coordinated with the land use pattern. The HCVAs are mainly distributed in the surrounding mountains of CY, which are abundant in vegetation.
Based on the above results and discussion, conclusions can be drawn that the proposed framework can effectively identify potential ecological reserves and provide a reliable and simple solution for ERL delineation. Although the proposed framework is more convenient and accurate compared to existing physical models, data-driven methods are limited to regional features and require more data to train models when applied in large areas. Next, the performance of the framework needs to be tested further in more case studies.

Author Contributions

Conceptualization, J.D. and H.W.; methodology, C.Y. and Y.X.; formal analysis, C.Y.; software and coding, R.W.; validation, J.D. and R.W.; writing—original draft preparation, J.D.; writing—review and editing, H.W., C.Y., R.W. and Y.X.; visualization and writing, H.W.; project administration, H.W.; funding acquisition, H.W. All authors have read and agreed to the published version of the manuscript.

Funding

This research was funded by the Second Tibetan Plateau Scientific Expedition and Research Program (STEP) under Grant 2019QZKK0902, the National Natural Science Foundation of China under Grant 42071411, the Strategic Priority Research Program of the Chinese Academy of Sciences under Grant XDA23090203, and the key research and development program of Sichuan Province (22ZDYF2824).

Data Availability Statement

The datasets used and/or analyzed during the current study are available from the corresponding author on reasonable request.

Conflicts of Interest

The authors declare that they have no known competing financial interests or personal relationships that could have influenced the work reported in this paper.

References

  1. Millennium Ecosystem Assessment (MEA). Ecosystems and Human Well-Being; Island Press: Washington, DC, USA, 2005; Volume 5. [Google Scholar]
  2. Steffen, W.; Richardson, K.; Rockström, J.; Cornell, S.E.; Fetzer, I.; Bennett, E.M.; Biggs, R.; Carpenter, S.R.; de Vries, W.; de Wit, C.A.; et al. Planetary Boundaries: Guiding Human Development on a Changing Planet. Science 2015, 347, 1259855. [Google Scholar] [CrossRef] [PubMed]
  3. Ouyang, X.; Tang, L.; Wei, X.; Li, Y. Spatial Interaction between Urbanization and Ecosystem Services in Chinese Urban Agglomerations. Land Use Policy 2021, 109, 105587. [Google Scholar] [CrossRef]
  4. Bai, Y.; Wong, C.P.; Jiang, B.; Hughes, A.C.; Wang, M.; Wang, Q. Developing China’s Ecological Redline Policy Using Ecosystem Services Assessments for Land Use Planning. Nat. Commun. 2018, 9, 3034. [Google Scholar] [CrossRef]
  5. Chen, D.; Pan, Y.; Jin, X.; Du, H.; Li, M.; Jiang, P. The Delineation of Ecological Redline Area for Catchment Sustainable Management from the Perspective of Ecosystem Services and Social Needs: A Case Study of the Xiangjiang Watershed, China. Ecol. Indic. 2021, 121, 107130. [Google Scholar] [CrossRef]
  6. Gao, J.; Zou, C.; Zhang, K.; Xu, M.; Wang, Y. The Establishment of Chinese Ecological Conservation Redline and Insights into Improving International Protected Areas. J. Environ. Manag. 2020, 264, 110505. [Google Scholar] [CrossRef]
  7. Li, Z.; Liu, Y.; Zeng, H. Application of the MaxEnt Model in Improving the Accuracy of Ecological Red Line Identification: A Case Study of Zhanjiang, China. Ecol. Indic. 2022, 137, 108767. [Google Scholar] [CrossRef]
  8. Huang, F.; Yu, Y.; Feng, T. Hyperspectral Remote Sensing Image Change Detection Based on Tensor and Deep Learning. J. Vis. Commun. Image Represent. 2019, 58, 233–244. [Google Scholar] [CrossRef]
  9. Wei, R.; Ye, C.; Ge, Y.; Li, Y. An Attention-Constrained Neural Network with Overall Cognition for Landslide Spatial Prediction. Landslides 2022, 19, 1087–1099. [Google Scholar] [CrossRef]
  10. Ye, C.M.; Wei, R.L.; Ge, Y.G.; Li, Y.; Junior, J.M.; Li, J. GIS-Based Spatial Prediction of Landslide Using Road Factors and Random Forest for Sichuan-Tibet Highway. J. Mt. Sci. 2022, 19, 461–476. [Google Scholar] [CrossRef]
  11. Wei, R.; Ye, C.; Sui, T.; Ge, Y.; Li, Y.; Li, J. Combining Spatial Response Features and Machine Learning Classifiers for Landslide Susceptibility Mapping. Int. J. Appl. Earth Obs. Geoinf. 2022, 107, 102681. [Google Scholar] [CrossRef]
  12. Meng, C.; Seo, S.; Cao, D.; Griesemer, S.; Liu, Y. When Physics Meets Machine Learning: A Survey of Physics-Informed Machine Learning. arXiv 2022, arXiv:2203.16797. [Google Scholar] [CrossRef]
  13. Wäldchen, J.; Mäder, P. Machine Learning for Image Based Species Identification. Methods Ecol. Evol. 2018, 9, 2216–2225. [Google Scholar] [CrossRef]
  14. Tuia, D.; Kellenberger, B.; Beery, S.; Costelloe, B.R.; Zuffi, S.; Risse, B.; Mathis, A.; Mathis, M.W.; van Langevelde, F.; Burghardt, T.; et al. Perspectives in Machine Learning for Wildlife Conservation. Nat. Commun. 2022, 13, 792. [Google Scholar] [CrossRef] [PubMed]
  15. Scowen, M.; Athanasiadis, I.N.; Bullock, J.M.; Eigenbrod, F.; Willcock, S. The Current and Future Uses of Machine Learning in Ecosystem Service Research. Sci. Total Environ. 2021, 799, 149263. [Google Scholar] [CrossRef]
  16. Zhong, S.; Zhang, K.; Bagheri, M.; Burken, J.G.; Gu, A.; Li, B.; Ma, X.; Marrone, B.L.; Ren, Z.J.; Schrier, J.; et al. Machine Learning: New Ideas and Tools in Environmental Science and Engineering. Environ. Sci. Technol. 2021, 55, 12741–12754. [Google Scholar] [CrossRef]
  17. Pichler, M.; Hartig, F. Machine Learning and Deep Learning—A Review for Ecologists. Methods Ecol. Evol. 2023, 14, 994–1016. [Google Scholar] [CrossRef]
  18. Greener, J.G.; Kandathil, S.M.; Moffat, L.; Jones, D.T. A Guide to Machine Learning for Biologists. Nat. Rev. Mol. Cell Biol. 2022, 23, 40–55. [Google Scholar] [CrossRef]
  19. Christin, S.; Hervet, É.; Lecomte, N. Applications for Deep Learning in Ecology. Methods Ecol. Evol. 2019, 10, 1632–1644. [Google Scholar] [CrossRef]
  20. Zhong, J.; Li, Z.; Sun, Z.; Tian, Y.; Yang, F. The Spatial Equilibrium Analysis of Urban Green Space and Human Activity in Chengdu, China. J. Clean. Prod. 2020, 259, 120754. [Google Scholar] [CrossRef]
  21. Li, Z.; Yang, F.; Zhong, J.; Zhao, J. Self-Organizing Feature Zoning and Multiple Hotspots Identification of Ecosystem Services: How to Promote Ecological Refined Management of Chengdu-Chongqing Urban Agglomeration. J. Urban Plan. Dev. 2023, 149, 04022049. [Google Scholar] [CrossRef]
  22. Zhang, H. The Impact of Urban Sprawl on Environmental Pollution: Empirical Analysis from Large and Medium-Sized Cities of China. Int. J. Environ. Res. Public Health 2021, 18, 8650. [Google Scholar] [CrossRef] [PubMed]
  23. Wang, Z.; Yang, J.; Jiang, J. Urban Sprawl and Haze Pollution: Based on Raster Data of Haze PM2.5 Concentrations in 283 Cities in Mainland China. Front. Environ. Sci. 2022, 10, 983. [Google Scholar] [CrossRef]
  24. Luo, Q.; Zhou, J.; Li, Z.; Yu, B. Spatial Differences of Ecosystem Services and Their Driving Factors: A Comparation Analysis among Three Urban Agglomerations in China’s Yangtze River Economic Belt. Sci. Total Environ. 2020, 725, 138452. [Google Scholar] [CrossRef]
  25. Lyu, R.; Clarke, K.C.; Zhang, J.; Feng, J.; Jia, X.; Li, J. Spatial Correlations among Ecosystem Services and Their Socio-Ecological Driving Factors: A Case Study in the City Belt along the Yellow River in Ningxia, China. Appl. Geogr. 2019, 108, 64–73. [Google Scholar] [CrossRef]
  26. Zhang, Z.; Liu, Y.; Wang, Y.; Liu, Y.; Zhang, Y.; Zhang, Y. What Factors Affect the Synergy and Tradeoff between Ecosystem Services, and How, from a Geospatial Perspective? J. Clean. Prod. 2020, 257, 120454. [Google Scholar] [CrossRef]
  27. Li, X.; Yu, X.; Wu, K.; Feng, Z.; Liu, Y.; Li, X. Land-Use Zoning Management to Protecting the Regional Key Ecosystem Services: A Case Study in the City Belt along the Chaobai River, China. Sci. Total Environ. 2021, 762, 143167. [Google Scholar] [CrossRef] [PubMed]
  28. Chen, D.; Jiang, P.; Li, M. Assessing Potential Ecosystem Service Dynamics Driven by Urbanization in the Yangtze River Economic Belt, China. J. Environ. Manag. 2021, 292, 112734. [Google Scholar] [CrossRef]
  29. Zhang, X.; Zhang, G.; Long, X.; Zhang, Q.; Liu, D.; Wu, H.; Li, S. Identifying the Drivers of Water Yield Ecosystem Service: A Case Study in the Yangtze River Basin, China. Ecol. Indic. 2021, 132, 108304. [Google Scholar] [CrossRef]
  30. Tonghui, M.; Cai, L.; Guangchun, L. The Spatial Overlapping Analysis for China’s Natural Protected Area and Countermeasures for the Optimization and Integration of Protected Area System. Biodivers. Sci. 2019, 27, 758. [Google Scholar] [CrossRef]
  31. Dou, J.; Yunus, A.P.; Merghadi, A.; Shirzadi, A.; Nguyen, H.; Hussain, Y.; Avtar, R.; Chen, Y.; Pham, B.T.; Yamagishi, H. Different Sampling Strategies for Predicting Landslide Susceptibilities Are Deemed Less Consequential with Deep Learning. Sci. Total Environ. 2020, 720, 137320. [Google Scholar] [CrossRef]
  32. Li, M.; Liang, D.; Xia, J.; Song, J.; Cheng, D.; Wu, J.; Cao, Y.; Sun, H.; Li, Q. Evaluation of Water Conservation Function of Danjiang River Basin in Qinling Mountains, China Based on InVEST Model. J. Environ. Manag. 2021, 286, 112212. [Google Scholar] [CrossRef]
  33. Spanò, M.; Leronni, V.; Lafortezza, R.; Gentile, F. Are Ecosystem Service Hotspots Located in Protected Areas? Results from a Study in Southern Italy. Environ. Sci. Policy 2017, 73, 52–60. [Google Scholar] [CrossRef]
  34. Taner San, B. An Evaluation of SVM Using Polygon-Based Random Sampling in Landslide Susceptibility Mapping: The Candir Catchment Area (Western Antalya, Turkey). Int. J. Appl. Earth Obs. Geoinf. 2014, 26, 399–412. [Google Scholar] [CrossRef]
  35. Li, S.; Liu, Y.; Yang, H.; Yu, X.; Zhang, Y.; Wang, C. Integrating Ecosystem Services Modeling into Effectiveness Assessment of National Protected Areas in a Typical Arid Region in China. J. Environ. Manag. 2021, 297, 113408. [Google Scholar] [CrossRef] [PubMed]
  36. Liao, G.; He, P.; Gao, X.; Lin, Z.; Fang, C.; Zhou, W.; Xu, C.; Deng, L. Identifying Critical Area of Ecosystem Service Supply and Demand at Different Scales Based on Spatial Heterogeneity Assessment and SOFM Neural Network. Front. Environ. Sci. 2021, 9, 714874. [Google Scholar] [CrossRef]
  37. Zhao, M.; He, Z.; Du, J.; Chen, L.; Lin, P.; Fang, S. Assessing the Effects of Ecological Engineering on Carbon Storage by Linking the CA-Markov and InVEST Models. Ecol. Indic. 2019, 98, 29–38. [Google Scholar] [CrossRef]
  38. Li, K.; Cao, J.; Adamowski, J.F.; Biswas, A.; Zhou, J.; Liu, Y.; Zhang, Y.; Liu, C.; Dong, X.; Qin, Y. Assessing the Effects of Ecological Engineering on Spatiotemporal Dynamics of Carbon Storage from 2000 to 2016 in the Loess Plateau Area Using the InVEST Model: A Case Study in Huining County, China. Environ. Dev. 2021, 39, 100641. [Google Scholar] [CrossRef]
  39. Haas, J.; Ban, Y. Mapping and Monitoring Urban Ecosystem Services Using Multitemporal High-Resolution Satellite Data. IEEE J. Sel. Top. Appl. Earth Obs. Remote Sens. 2017, 10, 669–680. [Google Scholar] [CrossRef]
  40. Hu, X.; Luo, H.; Guo, M.; Wang, J. Ecological Technology Evaluation Model and Its Application Based on Logistic Regression. Ecol. Indic. 2022, 136, 108641. [Google Scholar] [CrossRef]
  41. Mandal, I.; Pal, S. Assessing the Impact of Ecological Insecurity on Ecosystem Service Value in Stone Quarrying and Crushing Dominated Areas. Environ. Dev. Sustain. 2022, 24, 11760–11784. [Google Scholar] [CrossRef]
  42. Huang, N.; Lu, G.; Xu, D. A Permutation Importance-Based Feature Selection Method for Short-Term Electricity Load Forecasting Using Random Forest. Energies 2016, 9, 767. [Google Scholar] [CrossRef]
  43. Vidal-Espitia, U.; Serrano-Rubio, J.P.; Ruiz, M.D.M.; Herrera-Guzman, R. Cloud Landscape Images Segmentation Using Artificial Neural Networks and Amazon Web Services for Ecological Applications. In Proceedings of the 2021 IEEE International Conference on Systems, Man, and Cybernetics (SMC), Melbourne, Australia, 17–20 October 2021; pp. 2063–2068. [Google Scholar] [CrossRef]
  44. Wang, J.; Zhang, Q.; Gou, T.; Mo, J.; Wang, Z.; Gao, M. Spatial-Temporal Changes of Urban Areas and Terrestrial Carbon Storage in the Three Gorges Reservoir in China. Ecol. Indic. 2018, 95, 343–352. [Google Scholar] [CrossRef]
  45. Ye, C.; Tang, R.; Wei, R.; Guo, Z.; Zhang, H. Generating Accurate Negative Samples for Landslide Susceptibility Mapping: A Combined Self-Organizing-Map and One-Class SVM Method. Front. Earth Sci. 2023, 10, 2049. [Google Scholar] [CrossRef]
  46. Li, J.; Fan, G.; He, Y. Predicting the Current and Future Distribution of Three Coptis Herbs in China under Climate Change Conditions, Using the MaxEnt Model and Chemical Analysis. Sci. Total Environ. 2020, 698, 134141. [Google Scholar] [CrossRef] [PubMed]
  47. Smeraldo, S.; Bosso, L.; Salinas-Ramos, V.B.; Ancillotto, L.; Sánchez-Cordero, V.; Gazaryan, S.; Russo, D. Generalists yet Different: Distributional Responses to Climate Change May Vary in Opportunistic Bat Species Sharing Similar Ecological Traits. Mammal Rev. 2021, 51, 571–584. [Google Scholar] [CrossRef]
  48. Merghadi, A.; Yunus, A.P.; Dou, J.; Whiteley, J.; ThaiPham, B.; Bui, D.T.; Avtar, R.; Abderrahmane, B. Machine Learning Methods for Landslide Susceptibility Studies: A Comparative Overview of Algorithm Performance. Earth-Sci. Rev. 2020, 207, 103225. [Google Scholar] [CrossRef]
  49. Altmann, A.; Toloşi, L.; Sander, O.; Lengauer, T. Permutation Importance: A Corrected Feature Importance Measure. Bioinformatics 2010, 26, 1340–1347. [Google Scholar] [CrossRef] [PubMed]
  50. Bergstra, J.; Bengio, Y. Random Search for Hyper-Parameter Optimization. J. Mach. Learn. Res. 2012, 13, 281–305. [Google Scholar]
  51. Alemu I, J.B.; Richards, D.R.; Gaw, L.Y.F.; Masoudi, M.; Nathan, Y.; Friess, D.A. Identifying Spatial Patterns and Interactions among Multiple Ecosystem Services in an Urban Mangrove Landscape. Ecol. Indic. 2021, 121, 107042. [Google Scholar] [CrossRef]
  52. Radeloff, V.C.; Dubinin, M.; Coops, N.C.; Allen, A.M.; Brooks, T.M.; Clayton, M.K.; Costa, G.C.; Graham, C.H.; Helmers, D.P.; Ives, A.R.; et al. The Dynamic Habitat Indices (DHIs) from MODIS and Global Biodiversity. Remote Sens. Environ. 2019, 222, 204–214. [Google Scholar] [CrossRef]
  53. Chen, B.; Li, Z.; Zhang, C.; Ding, M.; Zhu, W.; Zhang, S.; Han, B.; Du, J.; Cao, Y.; Zhang, C.; et al. Wide Area Detection and Distribution Characteristics of Landslides along Sichuan Expressways. Remote Sens. 2022, 14, 3431. [Google Scholar] [CrossRef]
  54. Bao, F.; Qiu, J. Ecological Vulnerability Assessment of the Ya’an-Qamdo Section along the Southern Route of the Sichuan-Tibet Transportation Corridor. J. Mt. Sci. 2022, 19, 2202–2213. [Google Scholar] [CrossRef]
  55. Huang, A.; Xu, Y.; Sun, P.; Zhou, G.; Liu, C.; Lu, L.; Xiang, Y.; Wang, H. Land Use/Land Cover Changes and Its Impact on Ecosystem Services in Ecologically Fragile Zone: A Case Study of Zhangjiakou City, Hebei Province, China. Ecol. Indic. 2019, 104, 604–614. [Google Scholar] [CrossRef]
  56. Berdugo, M.; Delgado-Baquerizo, M.; Soliveres, S.; Hernández-Clemente, R.; Zhao, Y.; Gaitán, J.J.; Gross, N.; Saiz, H.; Maire, V.; Lehman, A.; et al. Global Ecosystem Thresholds Driven by Aridity. Science 2020, 367, 787–790. [Google Scholar] [CrossRef]
  57. Wang, Z.; Guo, J.; Ling, H.; Han, F.; Kong, Z.; Wang, W. Function Zoning Based on Spatial and Temporal Changes in Quantity and Quality of Ecosystem Services under Enhanced Management of Water Resources in Arid Basins. Ecol. Indic. 2022, 137, 108725. [Google Scholar] [CrossRef]
  58. Hu, T.; Peng, J.; Liu, Y.; Wu, J.; Li, W.; Zhou, B. Evidence of Green Space Sparing to Ecosystem Service Improvement in Urban Regions: A Case Study of China’s Ecological Red Line Policy. J. Clean. Prod. 2020, 251, 119678. [Google Scholar] [CrossRef]
  59. Chunye, W.; Delu, P. Zoning of Hangzhou Bay Ecological Red Line Using GIS-Based Multi-Criteria Decision Analysis. Ocean. Coast. Manag. 2017, 139, 42–50. [Google Scholar] [CrossRef]
  60. Zhang, H.; Pang, Q.; Hua, Y.; Li, X.; Liu, K. Linking Ecological Red Lines and Public Perceptions of Ecosystem Services to Manage the Ecological Environment: A Case Study in the Fenghe River Watershed of Xi’an. Ecol. Indic. 2020, 113, 106218. [Google Scholar] [CrossRef]
  61. Lin, J.; Li, X. Large-Scale Ecological Red Line Planning in Urban Agglomerations Using a Semi-Automatic Intelligent Zoning Method. Sustain. Cities Soc. 2019, 46, 101410. [Google Scholar] [CrossRef]
  62. Lu, W.H.; Liu, J.; Xiang, X.Q.; Song, W.L.; McIlgorm, A. A Comparison of Marine Spatial Planning Approaches in China: Marine Functional Zoning and the Marine Ecological Red Line. Mar. Policy 2015, 62, 94–101. [Google Scholar] [CrossRef]
  63. Xu, X.; Yang, G.; Tan, Y. Identifying Ecological Red Lines in China’s Yangtze River Economic Belt: A Regional Approach. Ecol. Indic. 2019, 96, 635–646. [Google Scholar] [CrossRef]
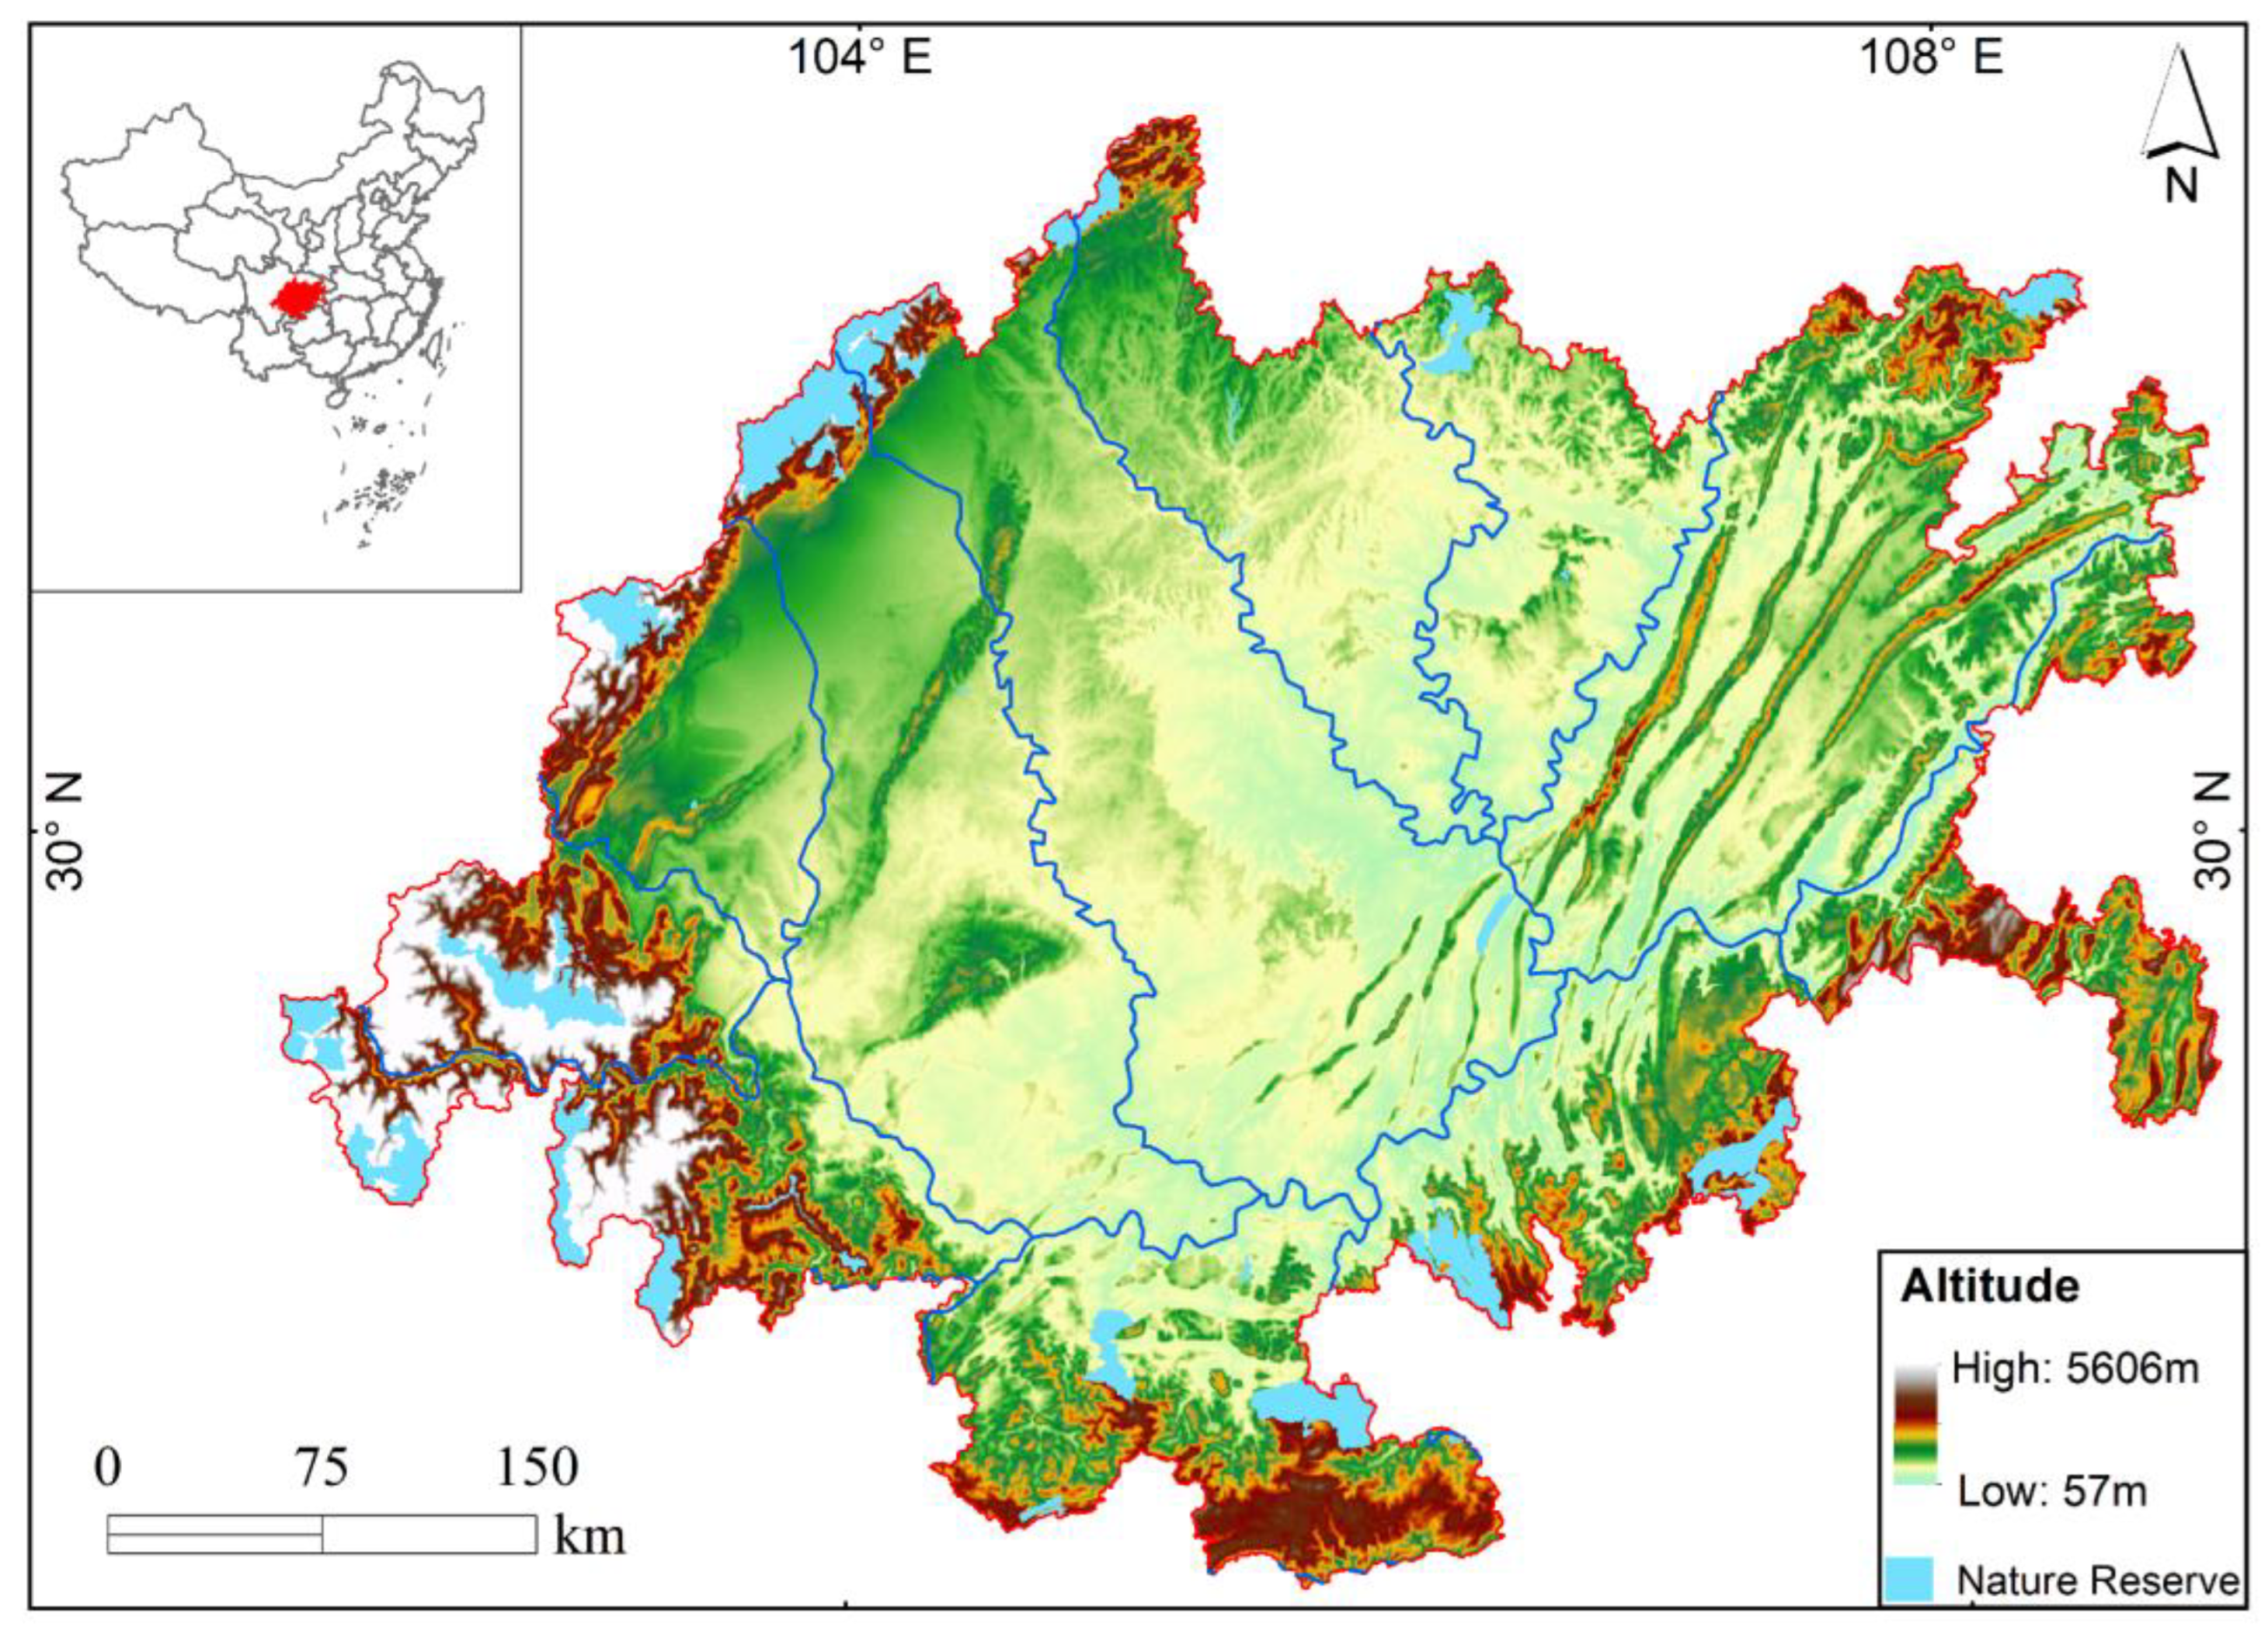
Figure 1. The geographical location and terrain of the study area. The research area covers most of the Sichuan Basin and some areas in the upper reaches of the Yangtze River. The blue area represents the boundaries of the nature reserve in this study.
Diversity 16 00300 g001
Figure 2. The input factors for ML and physical models of the study area. (A) Precipitation, (B) temperature, (C) ETo, (D) NDVI, (E) NPP, (F) land use, (G) PASW, (H) soil depth, (I) soil erodibility, (J) slope length.
Diversity 16 00300 g002aDiversity 16 00300 g002b
Figure 3. The framework of using ML methods and nature reserves for HCVAs identification.
Diversity 16 00300 g003
Figure 4. The flowchart of this study. The same factors are separately inputted into ML and physical models, and the obtained results are compared.
Diversity 16 00300 g004
Figure 5. (AD) Evaluation map of four ecosystem services using physical models. (E) The HCVAs result from total ecosystem services map.
Diversity 16 00300 g005
Figure 6. Samples from nature reserve and OC-SVM. (a) The total samples, (b) the nature reserve sample, (c) the fishnet and generated positive samples, (d) the negative samples.
Diversity 16 00300 g006
Figure 7. HCVAs prediction map of the CY study area from four ML models.
Diversity 16 00300 g007
Figure 8. The box plot of factor importance from four ML models. We repeated 20 importance calculations, with the blue box representing the first and third quartiles of all results, and the orange line representing the average of the results.
Diversity 16 00300 g008
Figure 9. The ROC curve of four ML models. The AUC in (a) training dataset and (b) testing dataset.
Diversity 16 00300 g009
Table 1. The initial selection of impact factors.
FactorsDataResolution/m
ClimatePrecipitationDataset of annual rainfall in Tibet 11000
TemperatureTerraClimate 21000
TopographyEToChina’s Surface climate data 31000
ElevationSRTM Digital Elevation 30 m 290
Slope lengthSRTM Digital Elevation 30 m 290
VegetationNDVINDVI Landsat 8 8-Day NDVI Composite 2250
NPPMOD17A2/Terra Net Photosynthesis 8-day L4 2250
SoilSoil depthWorld Soil Database 41000
PASWWorld Soil Database 41000
Soil erodibilityWorld Soil Database 4500
Land coverLand useFROM-GLC10 530
1 http://data.tpdc.ac.cn/ (accessed on 1 January 2020), 2 https://developers.google.com/earth-engine/datasets (accessed on 1 January 2016), 3 https://data.cma.cn/ (accessed on 21 January 2020), 4 https://www.ncdc.ac.cn/ (accessed on 1 January 2008), 5 http://data.ess.tsinghua.edu.cn/ (accessed on 1 January 2017).
Table 2. Evaluation functions of ESs.
Ecosystem ServicesFormulaeParameters
Water conservation (WC) W Y x = ( 1 A E T x P ( x ) ) × P ( x )
A E T x P ( x ) = 1 + P E T x P ( x ) [ 1 + ( A E T x P ( x ) ) W ( x ) ] 1 W ( x )
P E T x = K C ( x ) × E T O ( x )  
W ( x ) = A W C x × Z P x + 1.25
W Y x is the annual water production depth of grid x (mm);
P ( x ) is the average annual precipitation;
A E T x is the actual evapotranspiration (mm);
P E T x is the annual potential evapotranspiration (mm);
K C ( x ) is the vegetation evapotranspiration coefficient;
E T O ( x ) is the reference crop evapotranspiration;
Z is the seasonal parameter;
A W C x is the effective water content of soil (mm).
Soil erosion protection (Spro) A c = A p A r  
A p = R n K n L S n  
A r = R n K n L S n C n P n
A c is the soil conservation (t·hm−2·a−1);
A p is the potential soil erosion (t·hm−2·a−1);
A r is the actual soil erosion (t·hm−2·a−1);
R n is the rainfall erosion factor (MJ·mm·hm−2·h−1·a−1);
K n is the soil erodibility (t·hm−2·h·hm−2·MJ−1·mm−1);
L S n is the gradient slope and slope length;
C n is the vegetation cover management factor;
P n is the water and soil conservation measures.
Biodiversity conservation (Sbio) S b i o = N P P m e a n × F p r e × F t e m × ( 1 F a l t ) N P P m e a n is the net primary productivity gC/(m2·year);
F p r e is the average annual precipitation;
F t e m is the annual average temperature;
F a l t is the altitude.
Carbon storage and oxygen production (CSOP) C i = C i _ a b o v e + C i _ b e l o w + C i _ s o i l + C i _ d e a d  
C t o t a l = C i × A i
C i _ a b o v e is the aboveground unit carbon sequestration;
C i _ b e l o w is the underground unit carbon sequestration;
C i _ s o i l is the soil unit carbon sequestration;
C i _ d e a d is the dead organisms’ unit carbon;
C i is the Carbon density of land use type i ;
A i is the area of land use i ;
Table 3. Functions of MLs.
MLFormulaeParameters
Support Vector Machine (SVM) L = 1 2 | | w | | 2  
L ( w , b , a i ) = 1 2 | | w | | 2 i = 1 n a i ( y i ( w x i + b ) 1 )
L is the edge distance;
{ x i ,   y i } are positive and negative samples;
| | w | | is the norm of the hyperplane normal vector;
b is the distance bias.
a i 0 is the Lagrange coefficient.
Logistic regression (LGR) p = 1 1 + e y  
y = b 0 + b 1 x 1 + b 2 x 2 + + b n x n
where b 0 is the bias;
b 1 ,   b 2 , b n are regression coefficients;
x 1 ,   x 2 , x n are explanatory variables.
Random forest (RF) Gini ( d , v i ) = i = 1 p a i n s I ( d u i )  
I ( d u i ) = 1 i = 0 c ( n c i a i ) 2
I ( d u i ) is the Gini impurity;
p is the number of positive samples at node d ;
n s is the number of eigenvectors used for training;
n c i is the number of values u i belonging to class c i ;
a i is the number of values u i at node d .
Multilayer perceptron (MLP) y ( x ) = f m ( f 2 ( w 2 T f 1 ( w 1 T x + b 1 ) + b 2 ) + b m )  
f ( z i ) = ( 1 + e z i ) 1  
Loss = - 1 n i = 1 n [ y i log ( y ^ i ) + ( 1 y i ) log ( 1 y ^ i ) ]
x are inputs; w and b are the weights and bias between neurons;
f is the activation function;
m is the number of network layers;
n is the number of input samples;
y i and y ^ i are the true value and predicted value of the i -th sample, respectively.
Table 4. Collinearity and statistical analysis of factors.
FactorsTOLVIFp ValueStd Err
DEM0.068 14.709 --
Temperature0.226 4.424 0.0940.029
NDVI0.266 3.766 00.037
NPP0.282 3.546 00.048
Slope length0.340 2.941 00.027
Precipitation0.357 2.802 0.0980.024
Land use0.416 2.404 00.015
ETo0.576 1.737 00.020
Soil depth0.775 1.289 00.016
PASW0.838 1.194 00.020
Soil erodibility0.908 1.101 00.030
Table 5. The accuracy of four ML models.
TPTNFPFNAUCOAPreSenSpeF1kappa
LGR84382352480.975 0.943 0.942 0.946 0.941 0.944 0.887
RF8858393660.996 0.976 0.961 0.993 0.959 0.977 0.952
SVM85783045340.978 0.955 0.950 0.962 0.949 0.956 0.911
MLP83184728600.978 0.950 0.967 0.933 0.968 0.950 0.900
Pre: precision, Rec: recall, Sen: sensitivity, Spe: specificity, F1: F1-score.
Disclaimer/Publisher’s Note: The statements, opinions and data contained in all publications are solely those of the individual author(s) and contributor(s) and not of MDPI and/or the editor(s). MDPI and/or the editor(s) disclaim responsibility for any injury to people or property resulting from any ideas, methods, instructions or products referred to in the content.