Article

Gradient Analysis of Spatial-Temporal Change and Conservation Effectiveness in Different Ecological Protected Areas

1
Satellite Application Center for Ecology and Environment, Ministry of Ecology and Environment, Beijing 100094, China
2
Chinese Research Academy of Environmental Sciences, Beijing 100012, China
3
College of Life and Environmental Sciences, Central South University of Forestry and Technology, Changsha 410004, China
4
Faculty of Geo-Information Science and Earth Observation, University of Twente, 7522 NH Enschede, The Netherlands
*
Authors to whom correspondence should be addressed.
Diversity 2024, 16(5), 265; https://doi.org/10.3390/d16050265
Submission received: 26 November 2023 / Revised: 17 April 2024 / Accepted: 19 April 2024 / Published: 30 April 2024
(This article belongs to the Section Biodiversity Conservation)

Abstract

:
The protection of ecological systems is currently a trending topic. Numerous countries have implemented various measures to safeguard ecosystems. Evaluating the effectiveness of regional ecological protection and cooperative conservation is of paramount importance. In this paper, Hainan Island, China, was taken as an example to construct an evaluation framework of the ecosystem change characteristics and conservation effects of different types of protected areas. In this way, the study evaluated the ecological status of important protected areas and the effects of collaborative management and control, and it discussed the changes in ecological status and protection effects. The results revealed the following. (1) Important protected areas occupy a large proportion of natural ecological space, reaching 76.33%, more than twice the proportion of ecological space on Hainan Island. In the past 20 years, the ecological space retention rate has increased by 0.57%. (2) The contribution of excellent-quality and good-quality ecosystems is the greatest, accounting for 82.65% of the whole island. In the past 20 years, the ec7osystem quality has improved in more than 80% of the areas. The proportion of excellent-quality and good-quality ecosystems is as high as 96.75% in these conservation areas, and their contribution to Hainan Island is 44.29%, while conservation areas only account for about 38%. (3) The ecosystem services of Hainan Island have improved and become stable in the past 20 years. The contribution of all types of protected areas to the ecosystem services of Hainan Island is more than 53.22%. In general, the ecological quality and service function has increased in Hainan Island, and the ecological space tends to be stable. Different types of protected areas have effectively protected various ecosystems on Hainan Island with different protection and management mechanisms.

1. Introduction

To combat the global challenge of ecosystem degradation and biodiversity reduction, nature reserves have become one of the most effective strategies to protect and restore natural ecosystems and biodiversity, widely accepted by governments worldwide. By 2021, up to 15.73% of global land area has been designated as nature reserves [1]. In order to support ecosystem management and scientific decision-making concerning nature reserves, quantitative assessment of ecosystem changes and protection effects has become a popular topic in ecological research [2]. Related studies can be summarized into two categories: assessments based on the biological community and on the ecosystem scale.
Based on the scale of the biological communities, the protection effectiveness of nature reserves is usually evaluated by analyzing changes in protected species and their habitats [3,4,5,6,7]. Two categories can be summarized based on the assessment scope and key contents. One relies on the specific species and their habitat, which takes the changes in a single nature reserve as the assessment scope, and these cases mainly focus on the changes in species and population number, spatial distribution patterns and scope [5,8,9,10,11]. Another one takes the network of nature reserves and the potential distribution area of species populations as the assessment scope, focusing on the effectiveness and vacancy of specific species populations and their habitat protection [12,13,14].
Based on the ecosystem scale, the effectiveness evaluation mainly focuses on two aspects: the disturbance caused by human activities and the change in ecosystem quality. Firstly, regarding human disturbance, some effectiveness evaluations focus on limiting the coefficients of man-made damage, reducing human interference and changing land use patterns. Although the specific indicators differ in different research cases, the selected indicators mainly include land use or land cover change and ecological land area change [15,16,17,18]. Other indicators that assess human interference include the human footprint and human activity stress indexes [19,20,21,22], or landscape indexes such as the patch density, aggregation index, and development intensity index [23,24,25]. Secondly, regarding the change in ecosystem quality, vegetation indexes and net primary productivity are mainly used to evaluate the restoration or degradation of natural vegetation [26,27,28,29]. The ecosystem quality index, based on vegetation parameters, is used to evaluate the protection effectiveness [30]. Nevertheless, these methods also have some limitations [31]. To compensate for the lack of spatial dimension information, some researchers compared the differences in ecological changes inside and outside the nature reserve from the ecosystem scale to evaluate the effectiveness of the nature reserve [26,32,33,34,35,36,37], or by extending a certain buffer zone in the nature reserve to compare and analyze the differences inside and outside the nature reserve [15]. This paper comprehensively analyzes the changes in the ecosystem type, vegetation ecological quality and ecosystem services. Additionally, it evaluates the restoration of vegetation ecological quality and the stability of ecosystem services. In contrast to the use of a single indicator in traditional ecosystem assessments, this study proposes a multi-indicator evaluation system, which provides a more comprehensive approach. Furthermore, expanding the protected area to encompass the entire geographical unit enhances the comparability of the ecosystem change results.
In order to promote natural ecosystem protection and enhance the capacity for sustainable development, the Chinese government issued and implemented the policy of main functional zones in 2010, designating some key ecological spaces as prohibited and restricted development zones. Actually, a prohibited development zone is called a nature reserve, and a restricted development zone is called a key ecological function zone. In 2015, the environmental protection law of the People’s Republic of China proposed to delimit and strictly observe the ecological protection of red-line areas, and to control the ecological protection of red-line areas in accordance with the policy of prohibiting development zones. This policy shows that China’s ecological space protection has formed a control system, with nature reserves as the core and key ecological functional zones as the supplement. In other words, multiple sub-regions with control policies of different degrees of strictness are constructed in a geographical region. The new system can generate different impacts on ecosystem protection and restoration, which has attracted the attention of relevant scholars [36,38,39,40]. Therefore, it is of positive significance for improving regional ecological protection policies and enriching the evaluation methods regarding ecological protection effectiveness to explore the changes in ecosystems and the differences in protection effectiveness at different management and control levels.

2. Study Region, Methods and Datasets

2.1. Study Region

Hainan Island is a tropical island in southern China, which provides rich biological resources, especially the tropical rainforest in the central mountainous area. The tropical rainforest on the island is well preserved, which is the most concentrated distribution and the largest contiguous tropical rainforest in China. In the central mountainous area of Hainan Island, there are various valuable protected areas, including nature reserves, ecological protection red-line areas, and key ecological functional zones (Figure 1). Nature reserves are the areas with the strictest ecological protection, such as the core and buffer areas, where any human activities are prohibited; since 1960, 32 national or provincial nature reserves have been established on the island. Ecological protection red-line areas, established in 2015, are areas providing essential ecosystem services and important water sources, which are prohibited development zones. Key ecological functional zones are the restricted development zones established in 2010, generating soil and water conservation services for human society.

2.2. Assessment Framework and Indicators

In this study, Hainan Island is taken as the basic geographical unit, while the ecosystem structure and service assessment are paid more attention to, based on the ecological parameters and the most basic characteristics of the ecosystem that can be obtained by remote-sensing technology. By analyzing the temporal and spatial characteristics of ecosystems in different ecological protection areas with different control measures, the differences in the protection effectiveness in these areas are explained. The assessment framework is shown in Figure 2.
In the framework, the ecosystem pattern, ecosystem quality and ecosystem services are the core assessment contents, reflecting the ecosystem basic features. Regarding the ecosystem pattern, based on the analysis of the type composition and distribution of the ecosystem, and taking the natural ecological space retention rate as the index, this paper compares the impact and effectiveness of the protection of natural ecological space in different ecological protection areas with varying measures of control. Parameters such as the vegetation structure, vegetation coverage, leaf area index, and gross primary productivity are mainly considered in terms of the ecosystem quality. The last three parameters are used to construct the vegetation ecological quality index, and the effects of different levels of ecological protection management and control measures on the quality protection of the vegetation ecosystem are analyzed. Regarding the ecosystem services, according to the dominant ecosystem services in Hainan Island, two types of water and soil conservation services are mainly considered.
To assess the ecosystem protection effectiveness and its differences, multiple assessment indexes are calculated, including the contribution degree of ecological security, ecosystem stability and change trends. Based on the expansion of the spatial and temporal dimensions, the ecological protection effect in the protection area can be identified; then, the difference in the protection effect can be estimated by comparing the different types of protection areas. The contribution degree of ecological security is mainly evaluated from the spatial dimension. Due to that, the protection area is placed in the natural geographical region and expands the spatial scale, while the role of the protection area in protecting regional ecological security is evaluated by the ecological space, ecological quality and ecological services. A high contribution can represent great effectiveness. The stability and change trends of the ecosystem are mainly evaluated from the time dimension and within a certain period by analyzing the ecological space, ecological quality, and ecological service inside and outside the protected area. Compared with outside areas, the rising stability in the protection area may indicate an improvement trend, causing a better protection effect.

2.3. Methods

The methods of water conservation in terrestrial ecosystems mainly include precipitation storage, runoff coefficient, and water balance methods. The precipitation storage method mainly considers the interception effect of vegetation on precipitation [41]; the runoff coefficient method depends on the accuracy of the runoff coefficient measurement; and the water balance method mainly considers rainfall and evapotranspiration [42,43]. In this study, the water conservation capacity in the study area was calculated using the water balance method (Table 1).
The Universal Soil Loss Equation (USLE) was proposed by Wischmeier in the 1960s. Taking advantage of the actual physical significance of parameter factor interpretation, the equation is widely used by scholars worldwide [44,45]. Therefore, the Revised Universal Soil Loss Equation (RUSLE) is used to calculate and obtain the soil conservation values in the study area [41,46]. The formula is given in Table 1.
The ecosystem quality index (EQI) reflects the growth of vegetation in the region, which is constructed based on the vegetation coverage, leaf area index, and relative density of total primary productivity [47], and the formula is given in Table 1. The relevant technical specifications for the specific treatment methods referred to [47]. According to the ecosystem quality classification method, the ecological quality of Hainan Island is divided into five grades: excellent (EQI ≥ 75%), good (55% ≤ EQI < 75%), medium (35% ≤ EQI < 55%), low (20% ≤ EQI < 35%) and bad (EQI < 20%).

2.4. Datasets

Data from multiple sources are utilized in this study, including ecosystem types, meteorological data, elevation data and soil data. Th ecosystem type data are interpreted from remote-sensing image data, mainly Landsat TM/ETM, GF-1 CCD, GF-2 CCD images from 2000, 2010 and 2020. The interpretation basis is image feature information such as the color tone, texture, geometric shape, etc. Ecosystems are classified into seven land types, including forests, shrubs, grasslands, wetlands, farmland, towns, and other land types. According to the classification of land space, forests, shrubs, wetlands, and others are merged into ecological space; farmland ecosystems such as paddy fields and dry lands are merged into agricultural space; and urban ecosystems such as cities, rural residential areas, and industrial and mining land are merged into urban space.
The ecological parameter data used for the ecosystem quality are obtained from the website of the National Aeronautics and Space Administration (NASA) (http://modis.gsfc.nasa.gov/data/) (accessed on 1 January 2022). The MODIS product is used in this research. The Fractional Vegetation Cover (FVC) is based on the pixel binary model inversion [48]. The Leaf Area Index (LAI) is derived from the inversion of the relationship model from preprocessed data, MOD09A1, to the LAI value, generated from an artificial neural network [49,50]. The Gross Primary Productivity (GPP) is estimated based on the Bayesian multi-algorithm integration method, combining eight mainstream GPP algorithms. By checking the simulation accuracy of various light energy utilization models and using the observation data of 155 vortex-related carbon flux stations worldwide, the simulation accuracy of the eight light energy utilization models involved in the algorithm is calculated [51,52,53,54]. The data utilized in this research have a resolution of 500 m, a time resolution of one year, and cover the period from 2000 to 2020.
In addition, among other data required for the ecosystem services assessment, meteorological data are obtained from the China Meteorological science data-sharing service network; elevation data are obtained from the geospatial data cloud; and soil data are obtained from the 1:1,000,000 soil types of the Chinese Academy of Sciences [41]. The boundary of important ecological protection areas is obtained from the satellite environmental application center of the Ministry of Ecological Environment. Finally, the data are preprocessed by splicing and fusion, resampling, and unified coordinates.

3. Results

3.1. Natural Ecological Space

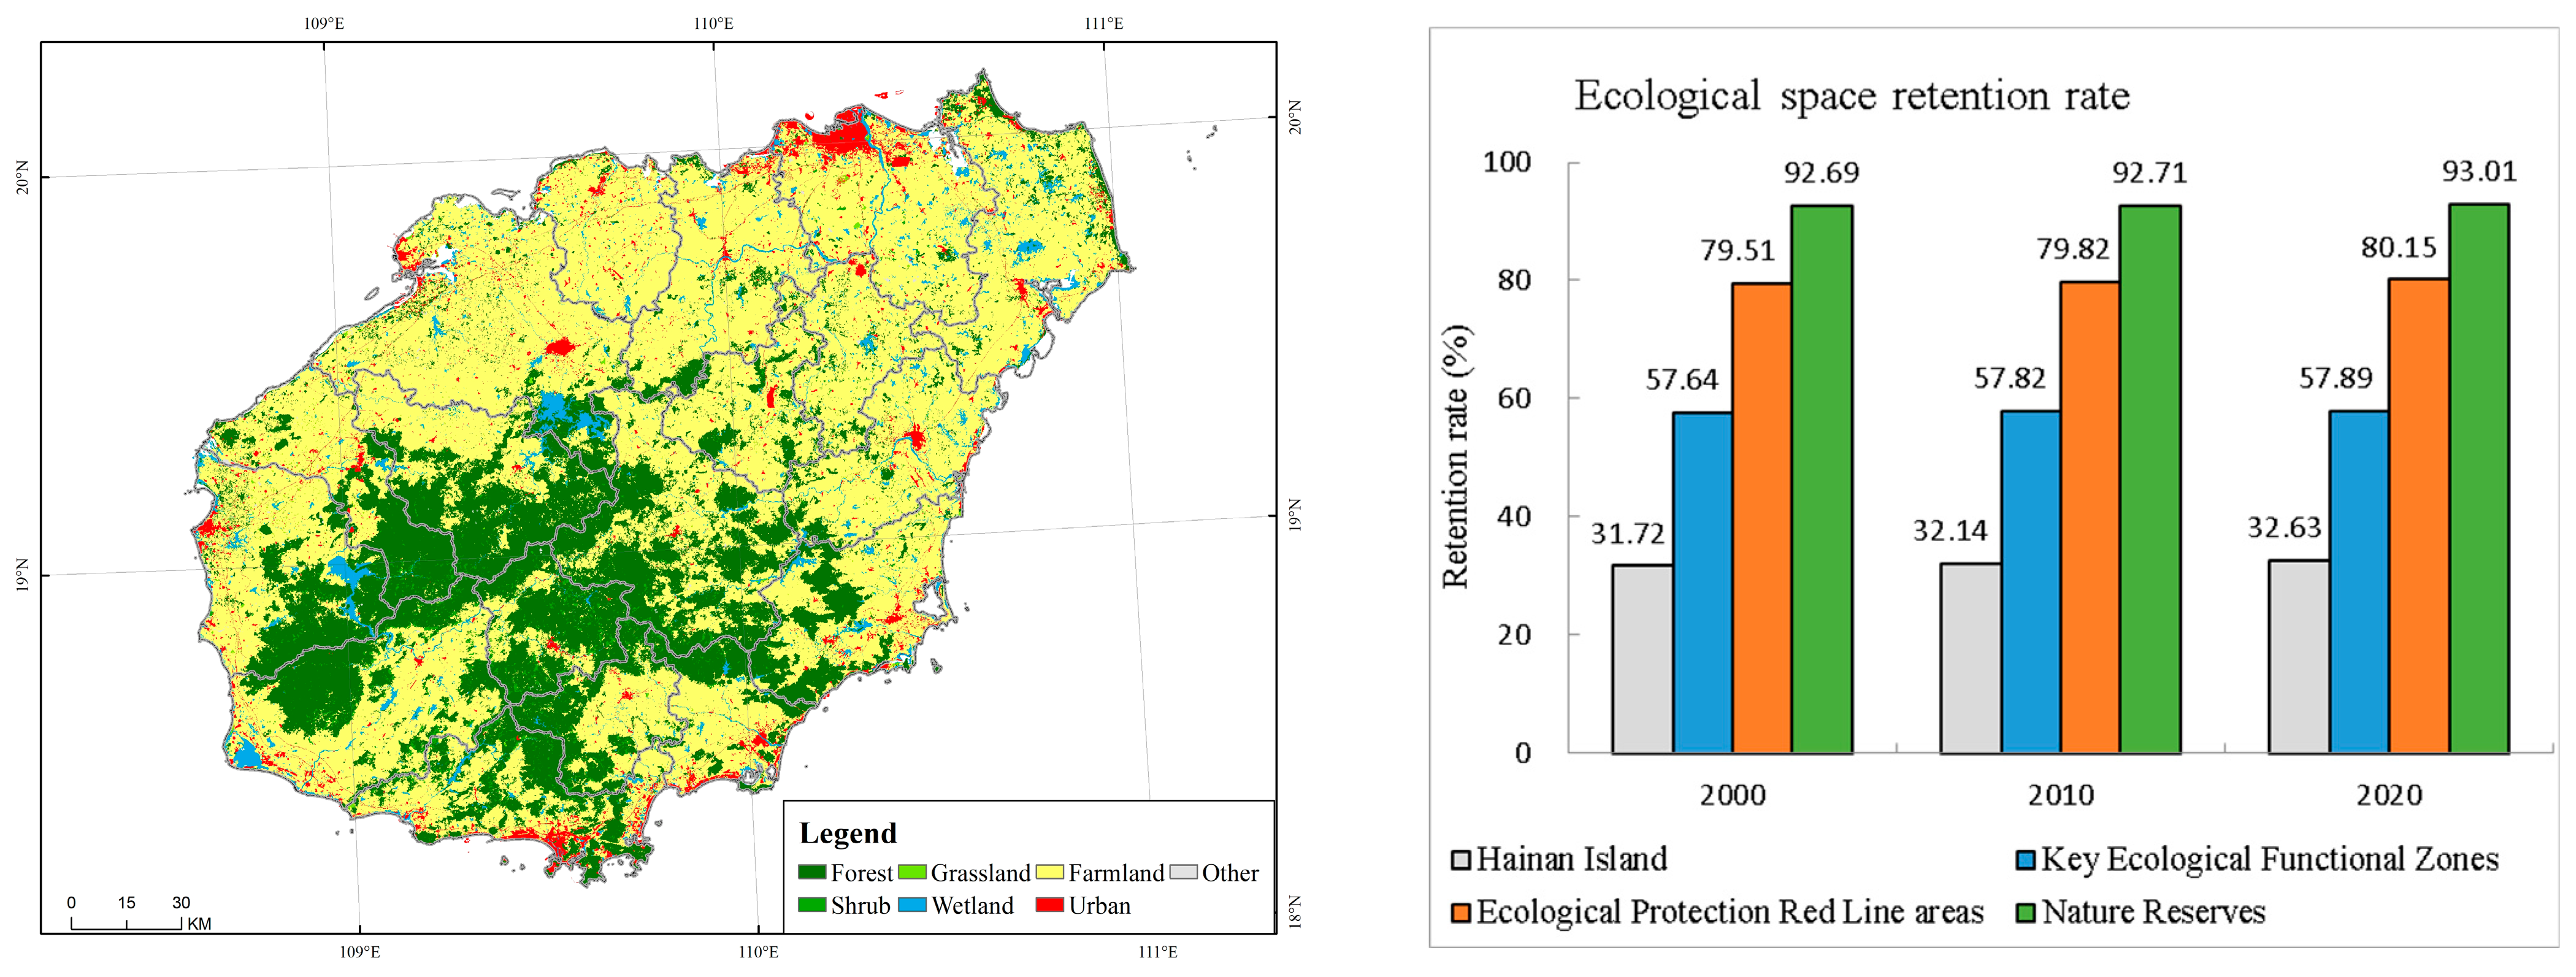
Natural ecological space includes forests, shrubs, grasslands and wetlands, and the proportion is the basic parameter of the regional ecosystem protection effect. Thus, the higher the proportion of natural ecological space, the better the effect of ecological protection. In 2020, natural ecological space accounted for 32.63% of the total area of Hainan Island. The forest ecosystem is the largest, accounting for 27.26% of the total area of Hainan Island. Protection regions generally protect 76.33% of the total natural ecological space, and the natural ecological space retention rates are 93.01%, 80.15% and 57.89% in the nature reserves, ecological protection red-line areas and key ecological functional zones, respectively. From 2000 to 2020, the retention rate of the natural ecological space increased from 65.27% to 65.84% in these protection regions and also increased in every type of conservation region. This indicates that protection regions prevent the loss of natural ecological space and restore natural ecological space (Figure 3).

3.2. Ecosystem Quality

The proportion of ecosystems with different quality levels and their areas directly reflect the quality of regional ecosystems. The higher the proportion of high-quality ecosystems, the better the quality of regional ecosystems. On the whole island, the proportion of ecosystem area with excellent and good grades is approximately 82.65%. In the past 20 years, the ecosystem quality has generally improved. Namely, more than 80% of the regional ecosystems achieved an improvement (Figure 4b). Compared with the first decade from 2000 to 2010, the ecosystem quality increased by 5.5% and the variance increased by 0.0015 in the second decade from 2010 to 2020. Contrary to the declining trend of ecosystem stability, the quality of the ecosystem exhibited a positive trend, primarily due to the implementation of various ecological protection and restoration measures. These measures encompass activities such as tree planting, afforestation, soil erosion management, and mine restoration.
From the central mountainous area to the surrounding coast, the ecosystem quality increased (Figure 4a). Excellent-quality and good-quality ecosystems are concentrated in the middle and southwest of the island. These areas are mainly covered with nature reserves, ecological protection red-line areas and key ecological functional zones, which contribute greatly to the ecological quality of the island. In these protection regions, the proportion of excellent-quality and good-quality ecosystems is up to 96.75%, which is 44.29% of the excellent-quality and good-quality ecosystems on the whole island, while the area of protected zones only accounts for 38% of the island. Therefore, 38% of the land area protects 45% of the excellent-quality and good-quality ecosystems, which shows that the protection effect is better.
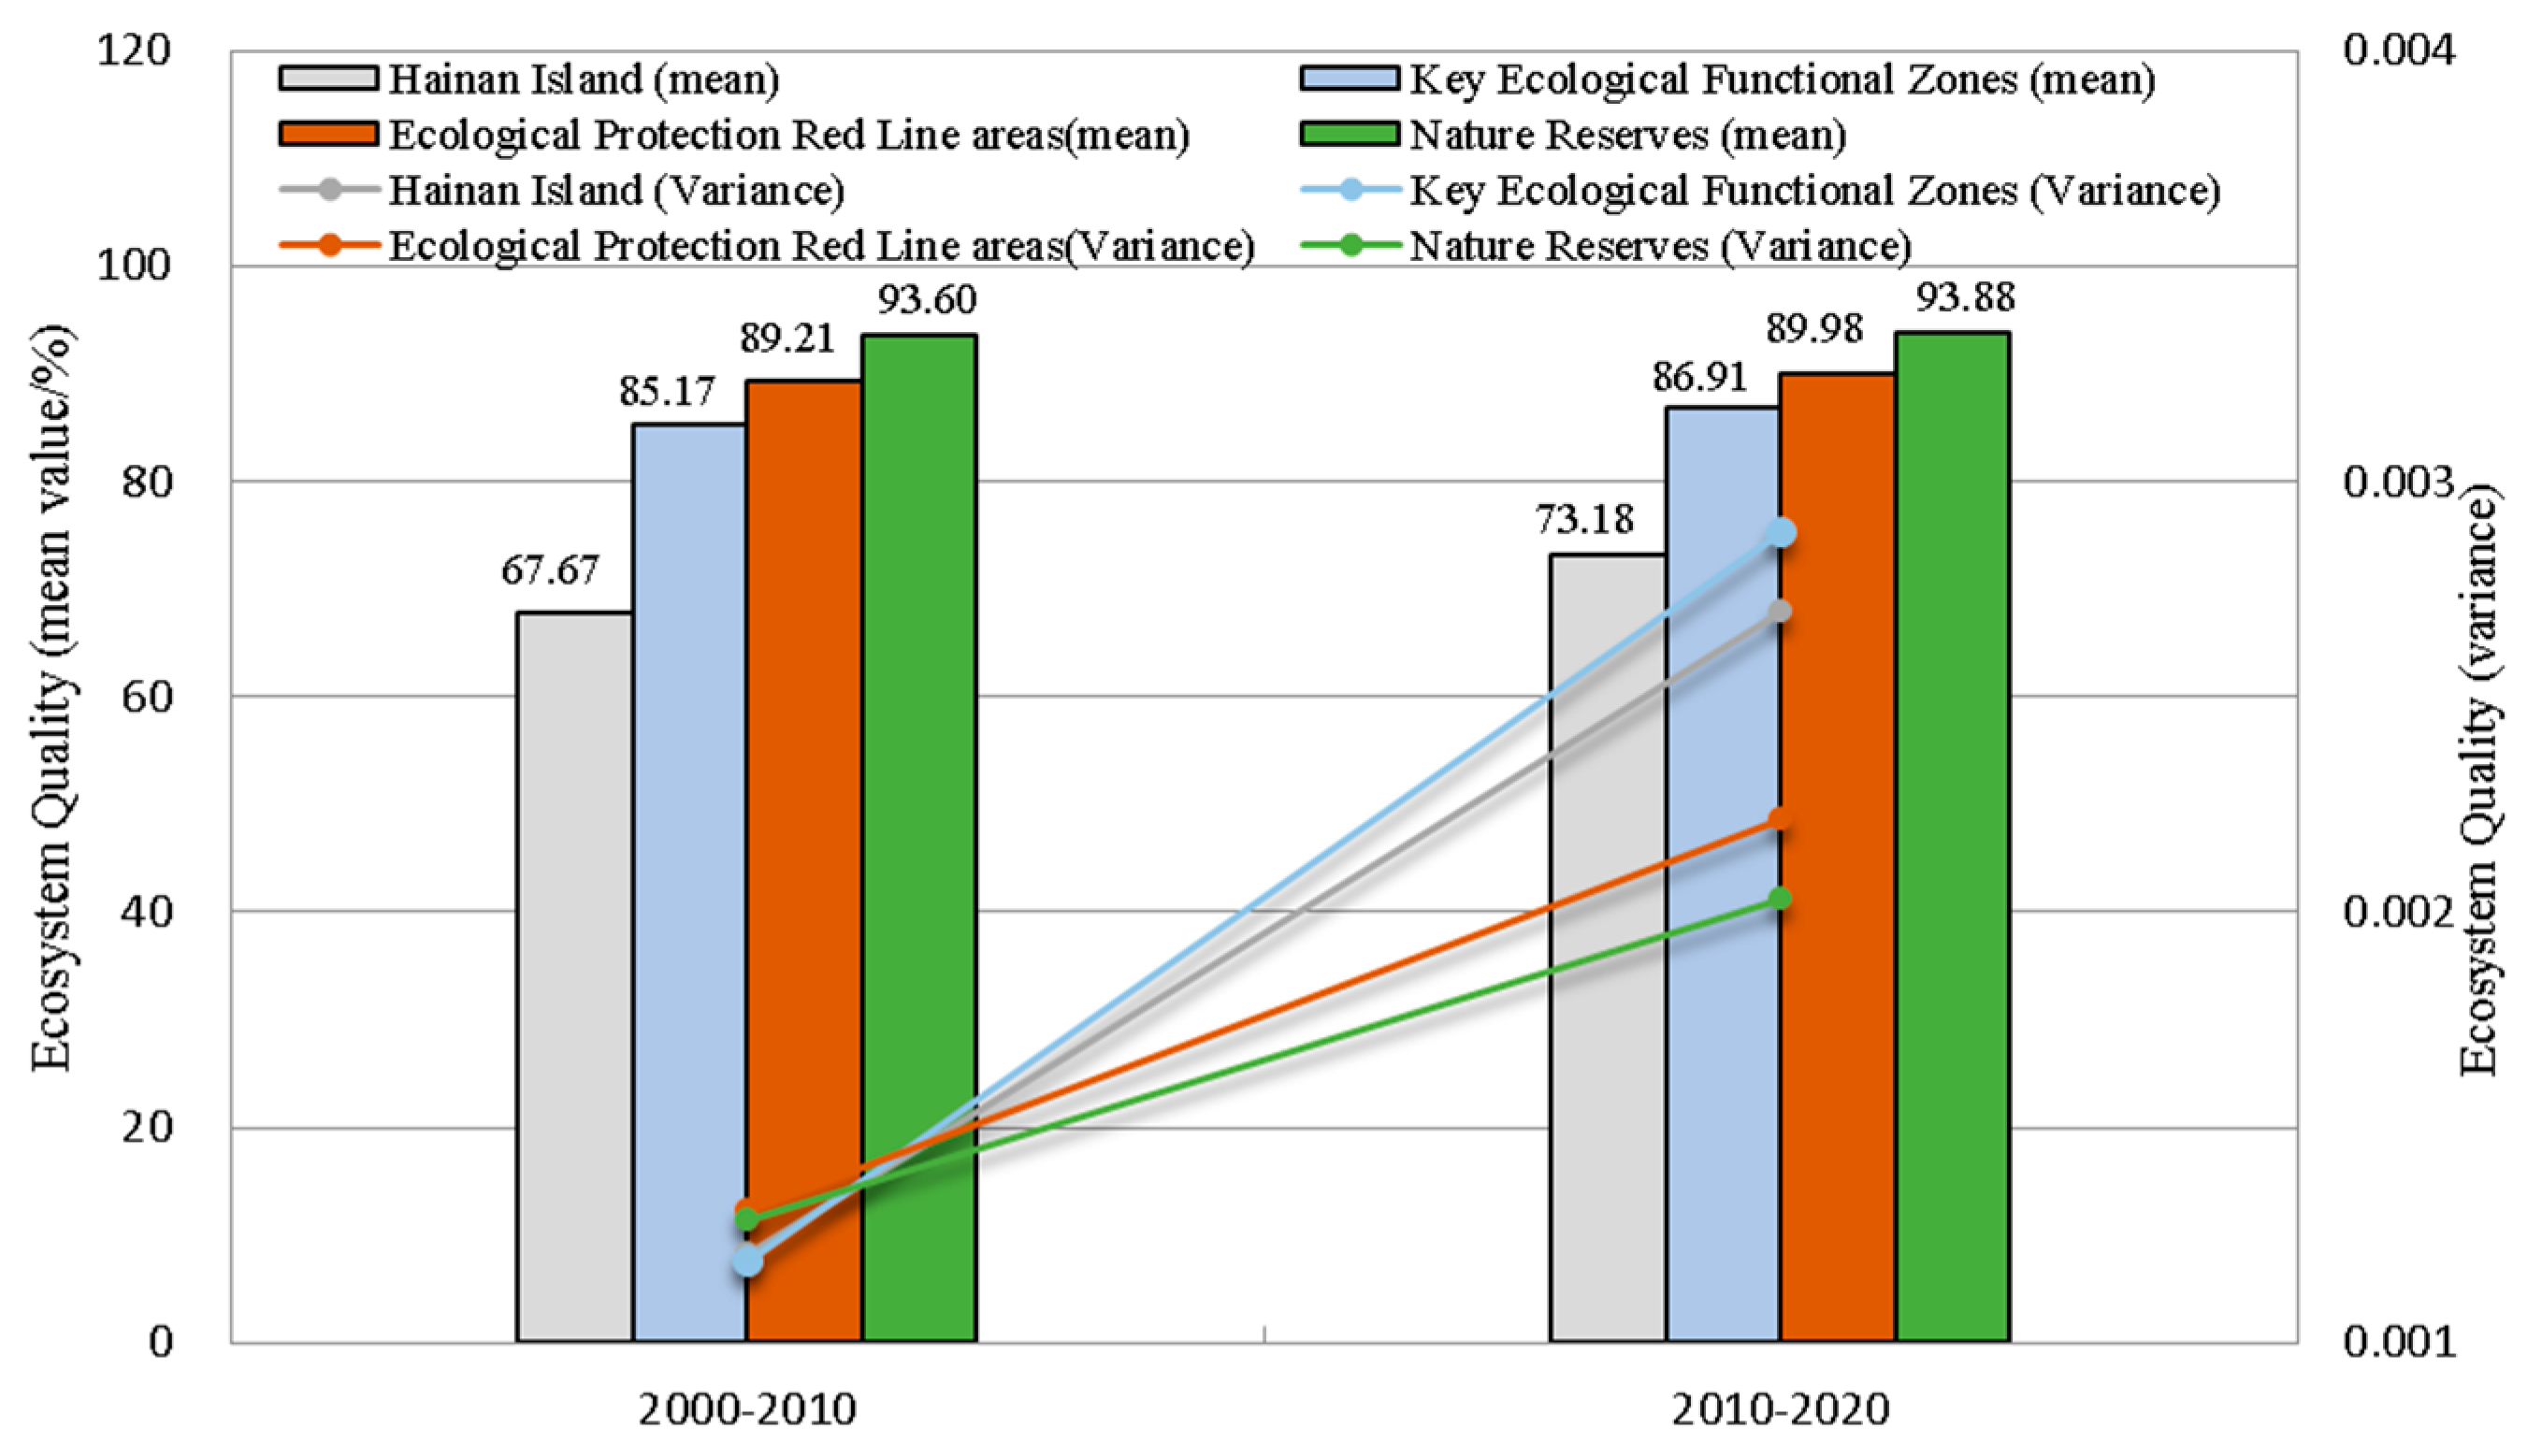
The ecosystem quality increased from the key ecological functional zones over the ecological protection red-line to natural reserves (Figure 5). In the past 20 years, the quality of the ecosystem increased in all the protection regions. And that of the ecological protection red-line area has the most prominent positive trend and the most remarkable change; the natural reserves have the smallest positive trend, the smallest variance and the most stable. Compared with the first decade from 2000 to 2010, in the second decade from 2010 to 2020, the ecosystem quality in key ecological functional zones increased by 1.74% and the variance increased by 0.0017; the ecological protection red-line areas increased by 0.77% and the variance increased by 0.0009; and the natural reserves increased by 0.28% and the variance increased by 0.0007 (Figure 5). In general, the ecosystem quality of Hainan Island nature reserve has been the most stable protected region in the past 20 years.

3.3. Ecosystem Services

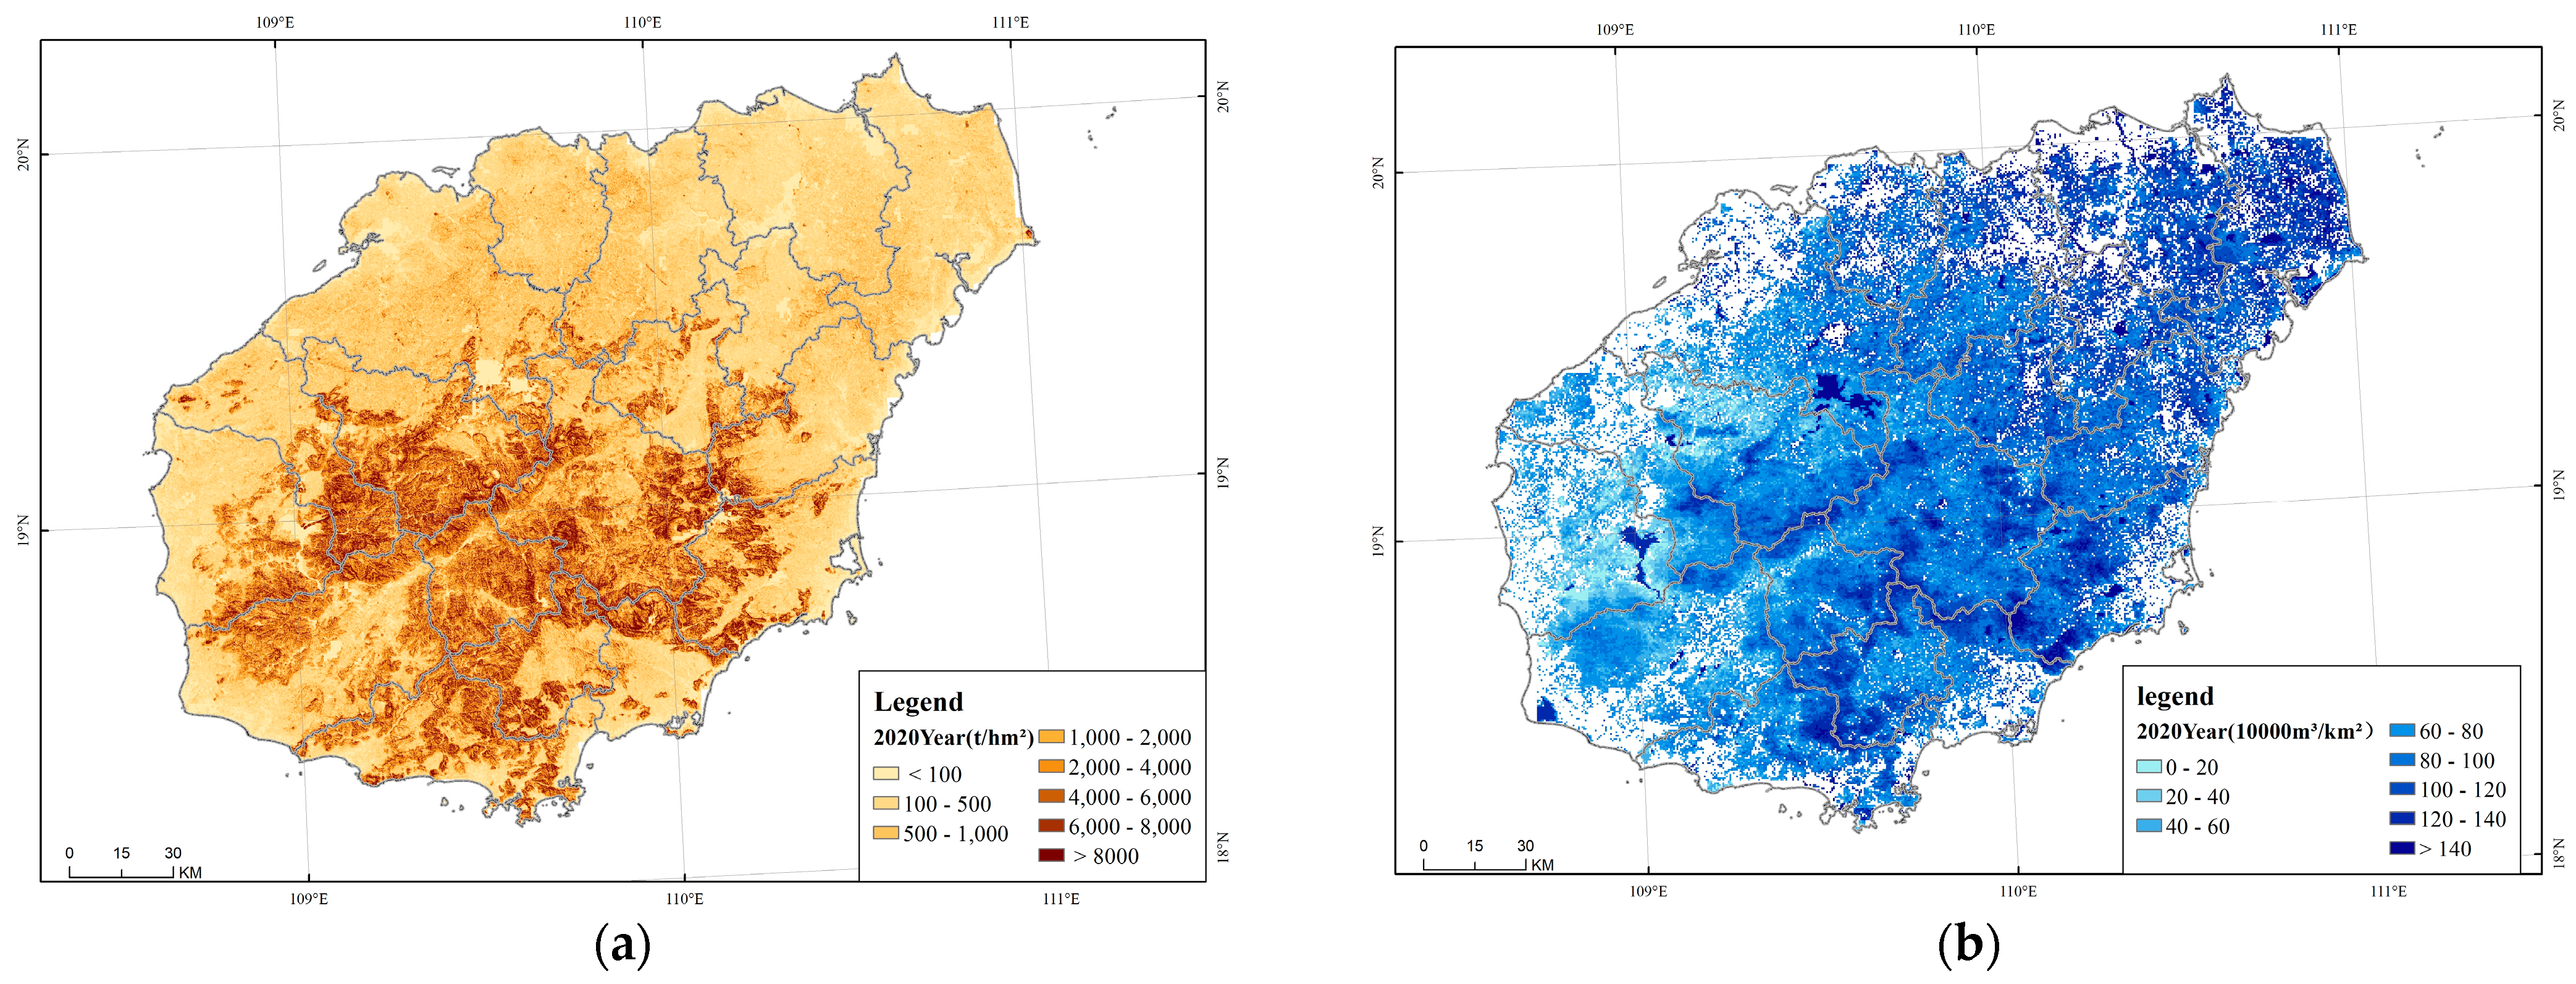
Ecosystem services are closely related to regional ecological security and human well-being. The greater the amount of ecosystem services, the higher the contribution to ecological security. In 2020, the total amount of soil conservation on Hainan Island was 59.23 × 10⁸ t, and the soil conservation per unit area was 1748.2 t/hm2. The total amount of water conservation was 218.10 × 10⁸ m3, and the water conservation capacity per unit area was 64.37 × 10⁴ m3/km2. In the past 20 years, the ecosystem services have increased on Hainan Island. The annual ecosystem services have increased from 2010 to 2020, the soil conservation per unit area has increased by 0.34 t/hm2, and the water conservation per unit area has increased by 1.14 × 10⁴ m3/km2. With the improvement in vegetation quality, the ecosystem services improved on the whole island, and it contributed to the ecosystem services of the whole of Hainan Island.
Ecosystem services increase from the central mountain to the surrounding coast of the whole island. As Figure 6a,b show, in the central and southwest of the island, the ecosystem services are relatively stronger because the protection regions are relatively concentrated. In these protection regions, the amount of water conservation per unit area is mostly 40 × 104 m3/km2, and the amount of soil conservation per unit area is mostly 2000 t/hm2, which is higher than that of the outside of these protection regions. On the other hand, in these protection regions, the contribution of conservation to the island area is 76.65%, and the contribution of water conservation is 53.22%. In the different conversion regions, the ecosystem services of the key ecological functional zones, ecological protection red-line areas and natural reserves are gradually improving, consistent with their management measures. Compared with the first decade, from 2010 to 2020, the ecosystem services improved.
As to the different protection regions, there are different change features. In the nature reserves, the soil conservation per unit area increased by 0.01 t/hm2, the water conservation per unit area increased by 4.70 × 10⁴ m3/km2, and its variance decreased by 2.66, which indicated that protection improved both ecosystem services’ stability and soil conservation. In the key ecological functional zones, the soil conservation increased by 0.06 t/hm2 and its variance increased by 1.31, and water conservation increased by 1.18 × 10⁴ m3/km2, and its variance increased by 30.32, which indicated that protection improved the ecosystem services, but their stability was not improved. In the ecological protection red-line areas, the soil conservation decreased by 0.31 t/hm2, water conservation increased by 2.6 × 10⁴ m3/km2. Similar to the situation with key ecological functional zones, the variance of water conservation in the ecological protection red-line areas increased by 6.82. In general, the ecosystem services in the nature reserves improved and became more stable in the last ten years, and the protection effectiveness was apparent (Figure 7).

4. Conclusions

By taking the ecosystem pattern, ecosystem quality and ecosystem services as the core assessment contents, and by analyzing the contribution degree, ecosystem stability and change trends with the expansion of the spatial and temporal dimensions, the ecological protection effects in different protection areas can be identified in this study. In general, there is an obvious protection effectiveness gradient in the different protection regions of Hainan Island; that is, the protection effectiveness is more and more obvious from the key ecological functional zones to the ecological protection red-line areas and to the nature reserves.
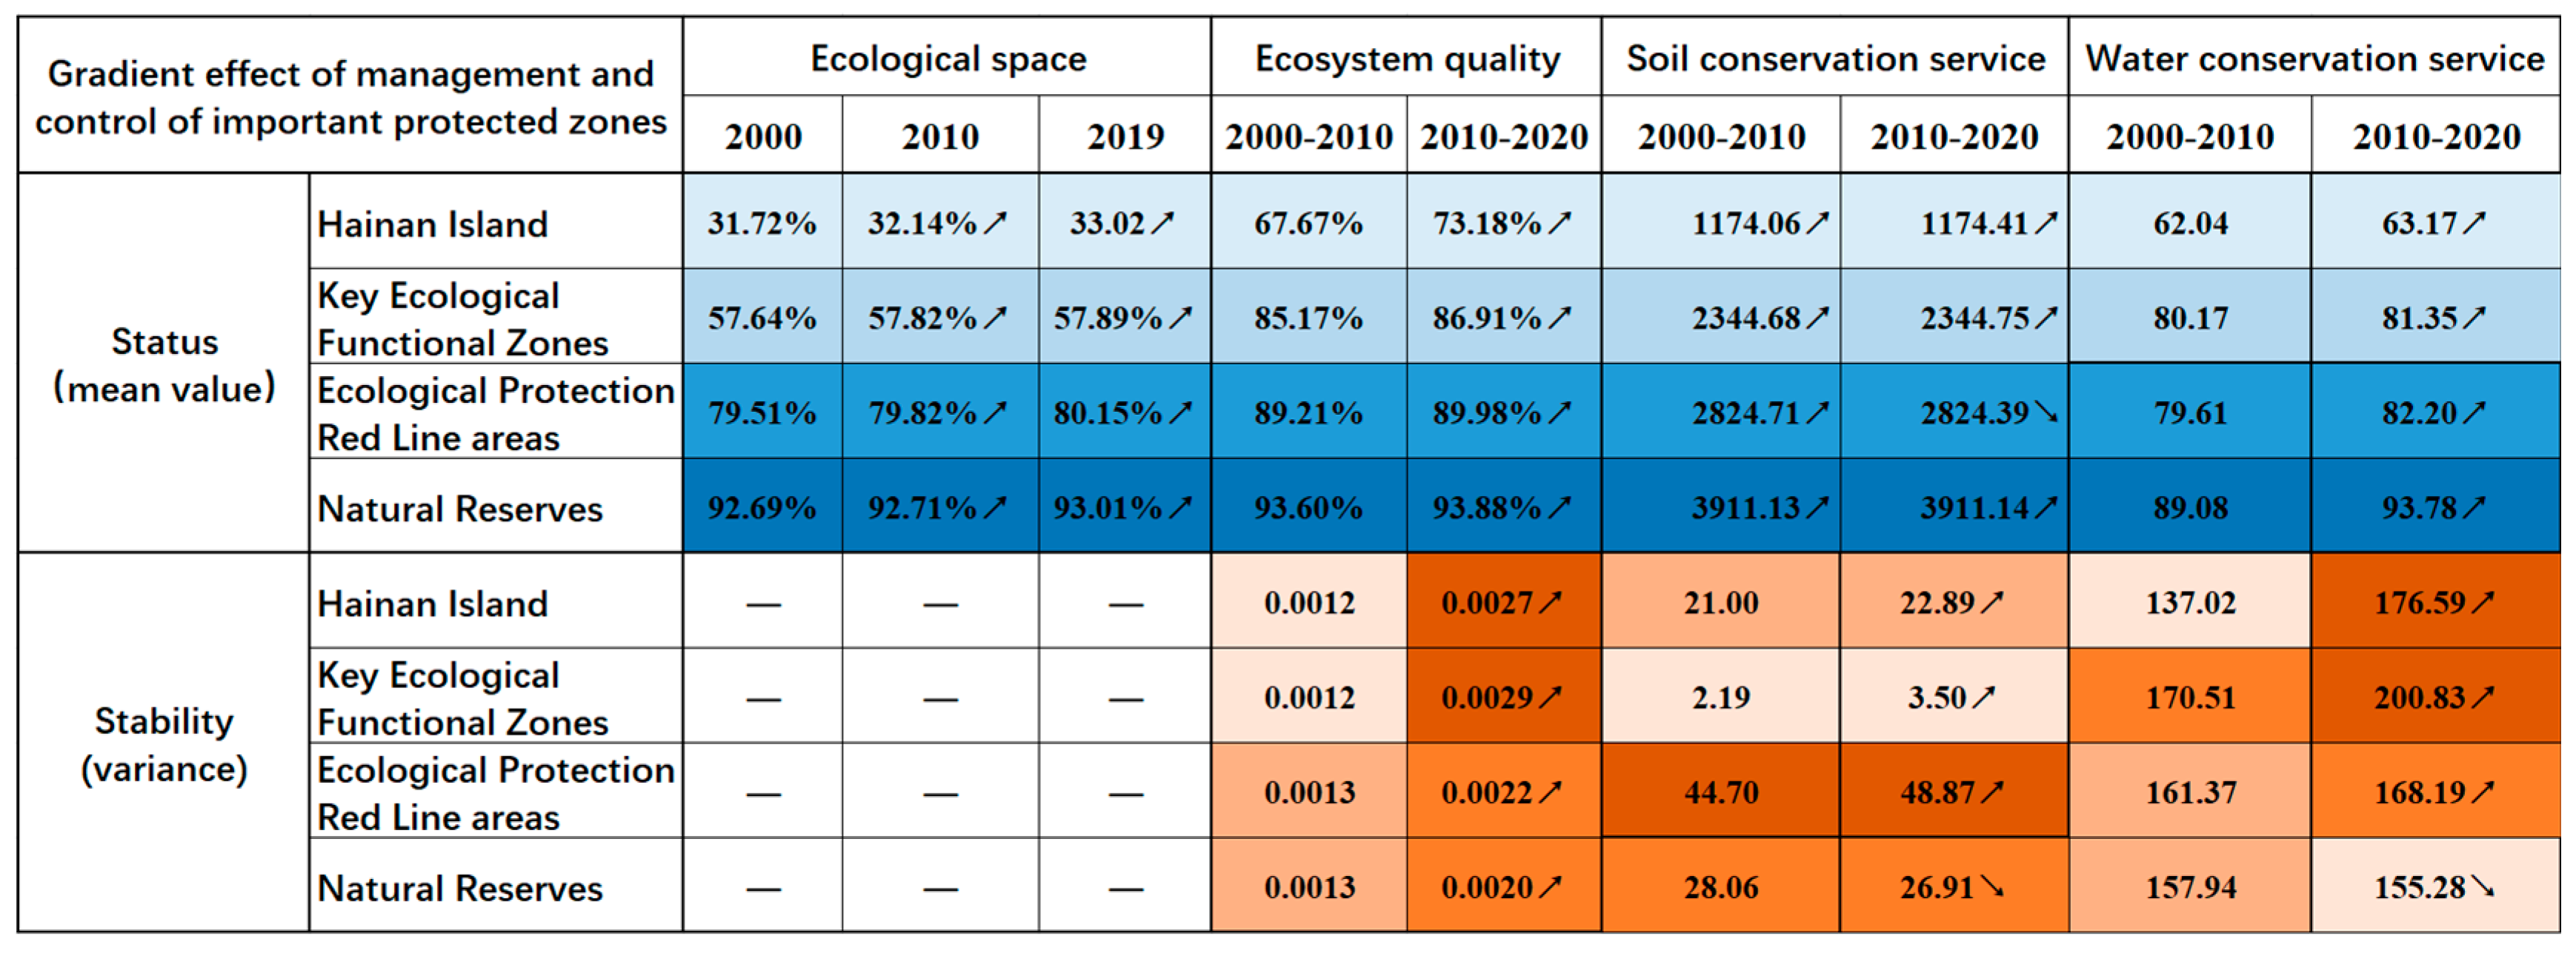
Compared with the first decade from 2000 to 2010, the ecological space, ecosystem quality and soil conservation services of the nature reserves, ecological protection red-line areas and key ecological functional zones increased to different degrees in the second decade from 2010 to 2020, as shown in Figure 8. The function of the key ecological functional zone is to limit large-scale urbanization and exploitation in order to coordinate protection and development and achieve sustainable development. Its protection measures are the weakest, and the natural background is weaker when compared with the nature reserves and the ecological protection red-line areas. The management measures of the ecological protection red-line areas are stricter, and the ecological benefits are higher than those of the key ecological functional zones. The nature reserves have the strictest control measures, which are less affected by human activities and have the highest ecosystem benefits.
In general, the ecological status of the nature reserves is the best, and the ecological changes in the past 20 years are the most stable, protecting the most important ecosystem of Hainan Island. The contribution to the spatial and restoration trend or stability matches with the management measures in different protection regions, which explains the protection effectiveness in the different regions. In addition, the variance of the ecosystem quality and the ecosystem services on Hainan Island, nature reserves, ecological protection red-line areas and key ecological functional zones has generally increased, indicating an increase in the intensity of the ecological improvement. The variance of the ecosystem services in the nature reserves decreased, and the ecological status became more stable.
This study mainly used remote-sensing materials, so shortcomings need to be addressed in the future with the help of many datasets from ground observation and ecological experiments. Under the joint influence of climate change and human activities, ecosystem change is a comprehensive representation of the zonal rules of ecosystems. In order to understand the causes of ecosystem changes, many scholars have conducted quantitative analysis of climate change and human activities on ecosystem changes using residual methods [55], geographic detector model [56], factor control methods [57], etc. However, the quantitative identification of the spatiotemporal dynamic correlation characteristics between different protection systems, different restoration measures, and ecosystem changes is limited. Similarly, this paper analyzes the changes in the ecological conditions and protection effects from a macro perspective, and it lacks an in-depth analysis of the driving force behind the ecological change at the micro level, and it lacks an in-depth interpretation of the ecological protection measures affecting the mechanism of ecological change. In the follow-up research, it will be important to comprehensively evaluate the quantitative relationship between regional ecological protection and control measures and ecological change from the macro to the micro level, and to suggest targeted policy ideas such as ecological protection and control measures.

Author Contributions

P.H., conceptualization, methodology, formal analysis, and writing—original draft; H.Z. and J.Z. (Jun Zhai), conceptualization, methodology, writing—review and editing, supervision, and project administration; Y.C., D.J., Y.L., X.W. and J.Z. (Jiajun Zhao), investigation, data curation. All authors discussed the results and conclusion. All authors have read and agreed to the published version of the manuscript.

Funding

This work was supported by the National Key R&D Program of China (Grant No. 2021YFF0703903) and the Regular Remote Sensing Survey and Assessment of National Ecological Status of China (Grant No. 22110499001001).

Data Availability Statement

The data presented in this study are available in this article.

Conflicts of Interest

The authors declare no conflict of interest.

References

  1. UNEP-WCMC 2021. IUCN. Protected Planet Report. 2020. Available online: https://www.unep.org/resources/protected-planet-report-2020 (accessed on 1 January 2022).
  2. Jacqualyn, E.; Alison, B.; James, F.; Sandra, O.; Prawestari, W.; Ruth, G. What is the evidence documenting the effects of marine or coastal nature conservation or natural resource management activities on human well-being in South East Asia? A systematic map. Environ. Int. 2021, 151, 106397. [Google Scholar]
  3. Brooks, T.M.; Bakarr, M.I.; Boucher, T.; Da Fonseca GA, B.; Hilton-Taylor, C.; Hoekstra, J.M.; Moritz, T.; Olivieri, S.; Parrish, J.; Pressey, R.L. Coverage provided by the global protected-area system: Is it enough? Bioscience 2001, 54, 1081–1091. [Google Scholar] [CrossRef]
  4. Jenkins, C.N.; Houtan, K.V.; Pimm, S.L.; Saxton, J.O. US protected lands mismatch biodiversity priorities. Proc. Natl. Acad. Sci. USA 2015, 112, 5081–5086. [Google Scholar] [CrossRef] [PubMed]
  5. Ben-Said, M.; Lin, J.C.; Carreira, J.A.; Taïqui, L. Spatial patterns and species coexistence in mixed Abies marocana-Cedrus atlantica forest in Talassemtane National Park. For. Ecol. Manag. 2022, 506, 119967. [Google Scholar] [CrossRef]
  6. Bai, J.J.; Hou, P.; Jin, D.D.; Zhai, J.; Ma, Y.T.; Zhao, J.J. Habitat Suitability Assessment of Black-Necked Crane (Grus nigricollis) in the Zoige Grassland Wetland Ecological Function Zone on the Eastern Tibetan Plateau. Diversity 2022, 14, 579. [Google Scholar] [CrossRef]
  7. Hou, P.; Bai, J.J.; Chen, Y.; Hou, J.; Zhao, J.J.; Ma, Y.; Zhai, J. Analysis on the hotspot characteristics of bird diversity distribution along the continental coastline of China. Front. Mar. Sci. 2022, 9, 1007442. [Google Scholar] [CrossRef]
  8. Guan, B.; Cui, G.F.; Piao, Z.J. A Review of Assessment of Wildlife Conservation Effectiveness in Nature Reserve. World For. Res. 2012, 25, 40–45. [Google Scholar]
  9. Kang, D.W.; Lv, J.; Li, S.; Chen, X.Y.; Wang, X.R.; Li, J.Q. Community change characteristics of Abies faxoniana: A case study in the Wanglang Nature Reserve. Ecol. Indic. 2019, 107, 105594. [Google Scholar] [CrossRef]
  10. Xue, H.L.; Zhou, Y.L.; Cheng, H.L.; Qing, W.; Annah, Z.; Dong Li Ya, J.L.; Zhuo, T. The development of ecological impact assessment in China. Environ. Int. 2015, 85, 46–53. [Google Scholar] [CrossRef]
  11. Yan, Y.Y.; Deng, J.; Zhang, Z.Q.; Zhou, X.Y.; Yang, D.D. Research progress in the protection efficacy evaluation of wildlife nature reserves. Chin. J. Ecol. 2014, 33, 1128–1134. [Google Scholar]
  12. Adams, V.M.; Setterfield, S.A.; Douglas, M.M.; Kennard, M.J.; Ferdinands, K. Measuring benefits of protected area management: Trends across realms and research gaps for freshwater systems. Philos. Trans. R. Soc. Lond. 2015, 370, 20140274. [Google Scholar] [CrossRef]
  13. Yang, H.B.; Viña, A.; Winkler, J.A.; Chung, M.G.; Dou, Y.; Wang, F.; Zhang, J.D.; Tang, Y.; Connor, T.; Zhao, Z.Q. Effectiveness of China’s protected areas in reducing deforestation. Environ. Sci. Pollut. Res. 2019, 26, 18651–18661. [Google Scholar] [CrossRef] [PubMed]
  14. Huang, Z.D.; Bai, Y.; Alatalo, J.M.; Yang, Z.Q. Mapping biodiversity conservation priorities for protected areas: A case study in Xishuangbanna Tropical Area, China. Biol. Conserv. 2020, 249, 108741. [Google Scholar] [CrossRef]
  15. Geldmann, J.; Barnes, M.; Coad, L.; Craigie, I.D.; Hockings, M.; Burgess, N.D. Effectiveness of terrestrial protected areas in reducing biodiversity and habitat loss. Biol. Conserv. 2013, 161, 230–238. [Google Scholar] [CrossRef]
  16. Gao, J.X.; Liu, X.M.; Wang, C.; Wang, Y.; Fu, Z.; Hou, P.; Lv, N. Evaluating changes in ecological land and effect of protecting important ecological spaces in China. Acta Geogr. Sin. 2021, 76, 1708–1721. [Google Scholar] [CrossRef]
  17. Heredia, R.M.; Torres, B.; Cabrera-Torres, F.; Torres, E.; Díaz-Ambrona CG, H.; Pappalardo, S.E. Land Use and Land Cover Changes in the Diversity and Life Zone for Uncontacted Indigenous People: Deforestation Hotspots in the Yasuní Biosphere Reserve, Ecuadorian Amazon. Forests 2021, 12, 1539. [Google Scholar] [CrossRef]
  18. Riechers, M.; Balázsi, Á.; Abson, D.J.; Fischer, J. The influence of landscape change on multiple dimensions of human–nature connectedness. Ecol. Soc. 2020, 25, 3. [Google Scholar] [CrossRef]
  19. Anderson, E.; Mammides, C. The role of protected areas in mitigating human impact in the world’s last wilderness areas. Ambio 2020, 49, 434–441. [Google Scholar] [CrossRef] [PubMed]
  20. David, M.H.; Agustin, G.-M.; Jessy, A.; Sallie, D.D.; Shane, M. Understanding migration to protected area buffer zones in Costa Rica utilizing cultural consensus analysis. Ecol. Soc. 2022, 27, 16. [Google Scholar]
  21. Gao, Y.J. Evaluation of Human Activity Intensity in Danxia Mountain Scenic Area of Guangdong Province Based on Human Impact Index (HII) Model; South China University of Technology: Guangzhou, China, 2020. [Google Scholar]
  22. Zhang, H.; Li, X.; Shi, H.; Liu, X.J. An assessment of the effectiveness of China’s nature reserves for mitigating anthropogenic pressures based on propensity score matching. Acta Geogr. Sin. 2021, 76, 680–693. [Google Scholar]
  23. Wang, C.L.; Zang, Z.H.; Qiu, Y.; Deng, S.Y.; Feng, Z.Y.; Xie, Z.Q.; Xu, W.T.; Liu, L.; Chen, Q.S.; Shen, G.Z. The effectiveness of Shennongjia National Nature Reserve in conserving forests and habitat of Sichuan snub-nosed monkey. Biodivers. Sci. 2017, 25, 504–512. [Google Scholar] [CrossRef]
  24. Yin, Z.H.; Zhen, Y.; Yang, X.Q.; Wu, Z.P.; Kang, J.T.; Fan, Z. Spatial-temporal Evolution Analysis of Landscape Pattern of Yancheng National Rare Birds Nature Reserve from 1997 to 2017. Geomat. Spat. Inf. Technol. 2021, 44, 63–67+71. [Google Scholar]
  25. Guo, Z.L.; Zhang, M.L.; Liu, W.W.; Liu, Z.J.; Zhang, Y.G. Landscape Pattern and Conservation Efficacy Analysis of Hengshui Lake National Nature Reserve, Hebei during Three Periods. Wetl. Sci. 2021, 19, 170–177. [Google Scholar]
  26. Zhang, Y.L.; Hu, Z.J.; Qi, W.; Wu, X.; Bai, W.Q.; Li, L.H.; Ding, M.J.; Liu, L.S.; Wang, Z.F.; Zheng, D. Assessment of protection effectiveness of nature reserves on the Tibetan Plateau based on net primary production and the large-sample-comparison method. Acta Geogr. Sin. 2015, 70, 1027–1040. [Google Scholar]
  27. Song, C.; Yu, Q.Y.; Xing, S.H.; Wu, Z.J.; Li, Y.X.; Ren, Z.H.; Liu, Y.S. Climate effects on NDVI change of upland meadow in Dahaituo Nature Reserve over 30 years. Acta Ecol. Sin. 2018, 38, 2547–2556. [Google Scholar]
  28. Qiu, C.; Hu, J.M.; Yang, F.L. Analysis of conservation effectiveness of nature reserves based on NDVI in Yunnan Province. Acta Ecol. Sin. 2020, 40, 7312–7322. [Google Scholar]
  29. Zhang, Y.; Yuan, F.H.; Wang, A.Z.; Guan, D.X.; Dai, G.H.; Wu, J.B. Variation characteristics of NDVI and its response to climatic change in the growing season of Changbai Mountain Nature Reserve during 2001 and 2018. Chin. J. Appl. Ecol. 2020, 31, 1213–1222. [Google Scholar]
  30. Han, Y.M.; Zou, M.L.; Ye, B. Assessment on the protection effectiveness of ecological conservation redline in Zhaoqing based on remote sensing. Environ. Ecol. 2021, 3, 8–12. [Google Scholar]
  31. Fuller, C.; Ondei, S.; Brook, B.W.; Buettel, J.C. First, do no harm: A systematic review of deforestation spillovers from protected areas. Glob. Ecol. Conserv. 2019, 18, e00591. [Google Scholar] [CrossRef]
  32. Andam, K.S.; Ferraro, P.J.; Pfaff, A.; Sanchez-Azofeifa, G.A.; Robalino, J.A. Measuring the effectiveness of protected area networks in reducing deforestation. Proc. Natl. Acad. Sci. USA 2008, 105, 16089–16094. [Google Scholar] [CrossRef]
  33. Gray, C.L.; Hill SL, L.; Newbold, T.; Hudson, L.N.; Börger, L.; Contu, S.; Hoskins, A.J.; Ferrier, S.; Purvis, A.; Scharlemann JP, W. Local biodiversity is higher inside than outside terrestrial protected areas worldwide. Nat. Commun. 2016, 7, 12306. [Google Scholar] [CrossRef]
  34. Eguiguren, P.; Fischer, R.; Günter, S. Degradation of ecosystem services and deforestation in landscapes with and without incentive-based forest conservation in the Ecuadorian Amazon. Forests 2019, 10, 442. [Google Scholar] [CrossRef]
  35. Cao, M.; Li, J.S.; Wang, W.; Xia, J.Y.; Feng, C.T.; Fu, G.; Huang, W.J.; Liu, F.Z. Assessing the effectiveness of water retention ecosystem service in Qinling National Nature Reserve based on InVEST and propensity score matching model. Biodivers. Sci. 2021, 29, 617–628. [Google Scholar] [CrossRef]
  36. Hou, P.; Chen, Y.; Zhai, J.; Hou, J.; Yang, M.; Jin, D.D.; Zhu, H.S.; Gao, H.F.; Wan, H.W.; Fu, Z. Natural Ecological Background of Terrestrial Vegetation in China: Identification Methods and Spatial Differentiation Characteristics. Sens. Mater. 2021, 33, 4659–4680. [Google Scholar] [CrossRef]
  37. Hou, P.; Zhai, J.; Jin, D.; Hou, Y.; Chen, Y.; Gao, H.F. Assessment of Changes in Key Ecosystem Factors and Water Conservation with Remote Sensing in the Zoige. Diversity 2022, 14, 552. [Google Scholar] [CrossRef]
  38. Chen, Y.; Hou, P.; Wang, Y.; Peng, K.F.; Zhai, J.; Xu, H.T.; Zhu, H.S.; Sun, C.X. Evaluation of protection effect of coordinated management of different kinds of Nature Reserves. J. Nat. Resour. 2020, 35, 779–787. [Google Scholar]
  39. Hou, P.; Wang, Q.; Fang, Z.; Wang, C.Z.; Wei, Y.C. Satellite-based monitoring and appraising vegetation growth in national key regions of ecological protection. Acta Ecol. Sin. 2013, 33, 780–788. [Google Scholar]
  40. Wang, H.; Hou, P.; Jiang, J.B.; Xiao, R.L.; Zhai, J.; Fu Zo Hou, J. Ecosystem Health Assessment of Shennongjia National Park, China. Sustainability 2020, 12, 7672. [Google Scholar] [CrossRef]
  41. Cao, W.; Liu, L.L.; Wu, D.; Huang, L. Spatial and temporal variations and importance of hierarchy of ecosystem functions in the Three-river-source National Park. Acta Ecol. Sin. 2019, 39, 1361–1374. [Google Scholar]
  42. Shi, X.L.; Zhang, Y. Review of forest water conservation. Resour. Dev. Mark. 2015, 31, 332–336. [Google Scholar]
  43. Jiang, W.L. Theory and method to accounting value of forest water conservative. J. Soil Water Conserv. 2003, 34–36+40. Available online: https://api.semanticscholar.org/CorpusID:133506301 (accessed on 1 January 2022).
  44. Wischmeier, W.H. A soil erodibility nomograph for farmland and construction sites. J. Soil Water Conserv. 1971, 26, 189–193. [Google Scholar]
  45. Cai, C.F.; Ding, S.W.; Shi, Z.H.; Huang, L.; Zhang, G.Y. Study of applying USLE and geographic information system IDRISI to predict soil erosion in small watershed. J. Soil Water Conserv. 2000, 19–24. Available online: https://api.semanticscholar.org/CorpusID:131032428 (accessed on 1 January 2022).
  46. Xiao, Y.; Xie, G.D.; An, K.; The function and economic value of soil conservation of ecosystems in Qinghai-Tibet Plateau. Acta Ecol. Sin. 2003, 2367–2378. Available online: https://api.semanticscholar.org/CorpusID:89165779 (accessed on 1 January 2022).
  47. Ministry of Ecology and Environment. Technical Specification for Investigation and Assessment of National Ecological Status—Ecosystem Quality Assessment (HJ 1172—2021). 2021. Available online: https://www.mee.gov.cn (accessed on 1 January 2022).
  48. Hu, H.T.; Chang, Y.F.; Wang, K.B. Multi-Scale analysis of spatiotemporal change of vegetation coverin Shaanxi Province from 2000 to 2020. Res. Soil Water Conserv. 2023, 30, 345–352. [Google Scholar] [CrossRef]
  49. Xiao, Z.Q.; Liang, S.L.; Wang, J.D.; Chen, P.; Yin, X.J.; Zhang, L.Q.; Song, J.L. Use of General Regression Neural.Networks for Generating the GLASS Leaf Area Index Product from Time Series MODIS Surface. Reflectance. IEEE Trans. Geosci. Remote Sens. 2014, 52, 209–223. [Google Scholar] [CrossRef]
  50. Xiao, Z.Q.; Liang, S.L.; Wang, J.D.; Xiang, Y.; Song, J.L. Long-time-series global land surface satellite leaf area index product derived from MODIS and AVHRR surface reflectance. IEEE Trans. Geosci. Remote Sens. 2016, 54, 5301–5318. [Google Scholar] [CrossRef]
  51. Li, X.; Liang, S.; Yu, G.; Yuan, W.; Cheng, X.; Xia, J.; Zhao, T.; Feng, J.; Ma, Z.; Ma, M.; et al. Estimation of gross primary production over the terrestrial ecosystems in China. Ecol. Model. 2013, 261, 80–92. [Google Scholar] [CrossRef]
  52. Yuan, W.; Cai, W.; Xia, J.; Chen, J.; Liu, S.; Dong, W.; Merbold, L.; Law, B.; Arain, A.; Beringer, J.; et al. Global comparison of light use efficiency models for simulating terrestrial vegetation gross primary production based on the LaThuile database. Agric. For. Meteorol. 2014, 192, 108–120. [Google Scholar] [CrossRef]
  53. Yuan, W.; Liu, S.; Zhou, G.; Zhou, G.; Tieszen, L.L.; Baldocchi, D.; Bernhofer, C.; Gholz, H.; Goldstein, A.H.; Goulden, M.L.; et al. Deriving a light use efficiency model from eddy covariance flux data for predicting dailygross primary production across biomes. Agric. For. Meteorol. 2007, 143, 189–207. [Google Scholar] [CrossRef]
  54. Yuan, W.; Liu, S.; Yu, G.; Bonnefond, J.M.; Chen, J.; Davis, K.; Desai, A.R.; Goldstein, A.H.; Gianelle, D.; Rossi, F.; et al. Global estimates of evapotranspiration and gross primary production based on MODIS and global meteorology data. Remote Sens. Environ. 2010, 114, 1416–1431. [Google Scholar] [CrossRef]
  55. Cui, L.; Chen, Y.; Yuan, Y.; Luo, Y.; Huang, S.; Li, G. Comprehensive evaluation system for vegetation ecological quality: A case study of Sichuan ecological protection redline areas. Front. Plant Sci. 2023, 14, 1178485. [Google Scholar] [CrossRef]
  56. Liu, C.; Zou, L.; Xia, J.; Chen, X.; Zuo, L.; Yu, J. Spatiotemporal Heterogeneity of Water Conservation Function and Its Driving Factors in the Upper Yangtze River Basin. Remote Sens. 2023, 15, 5246. [Google Scholar] [CrossRef]
  57. Han, G.; Zhou, G.; Xu, Z.; Yang, Y.; Liu, J.; Shi, K. Biotic and abiotic factors controlling the spatial and temporal variation of soil respiration in an agricultural ecosystem. Soil Biol. Biochem. 2007, 39, 418–425. [Google Scholar] [CrossRef]
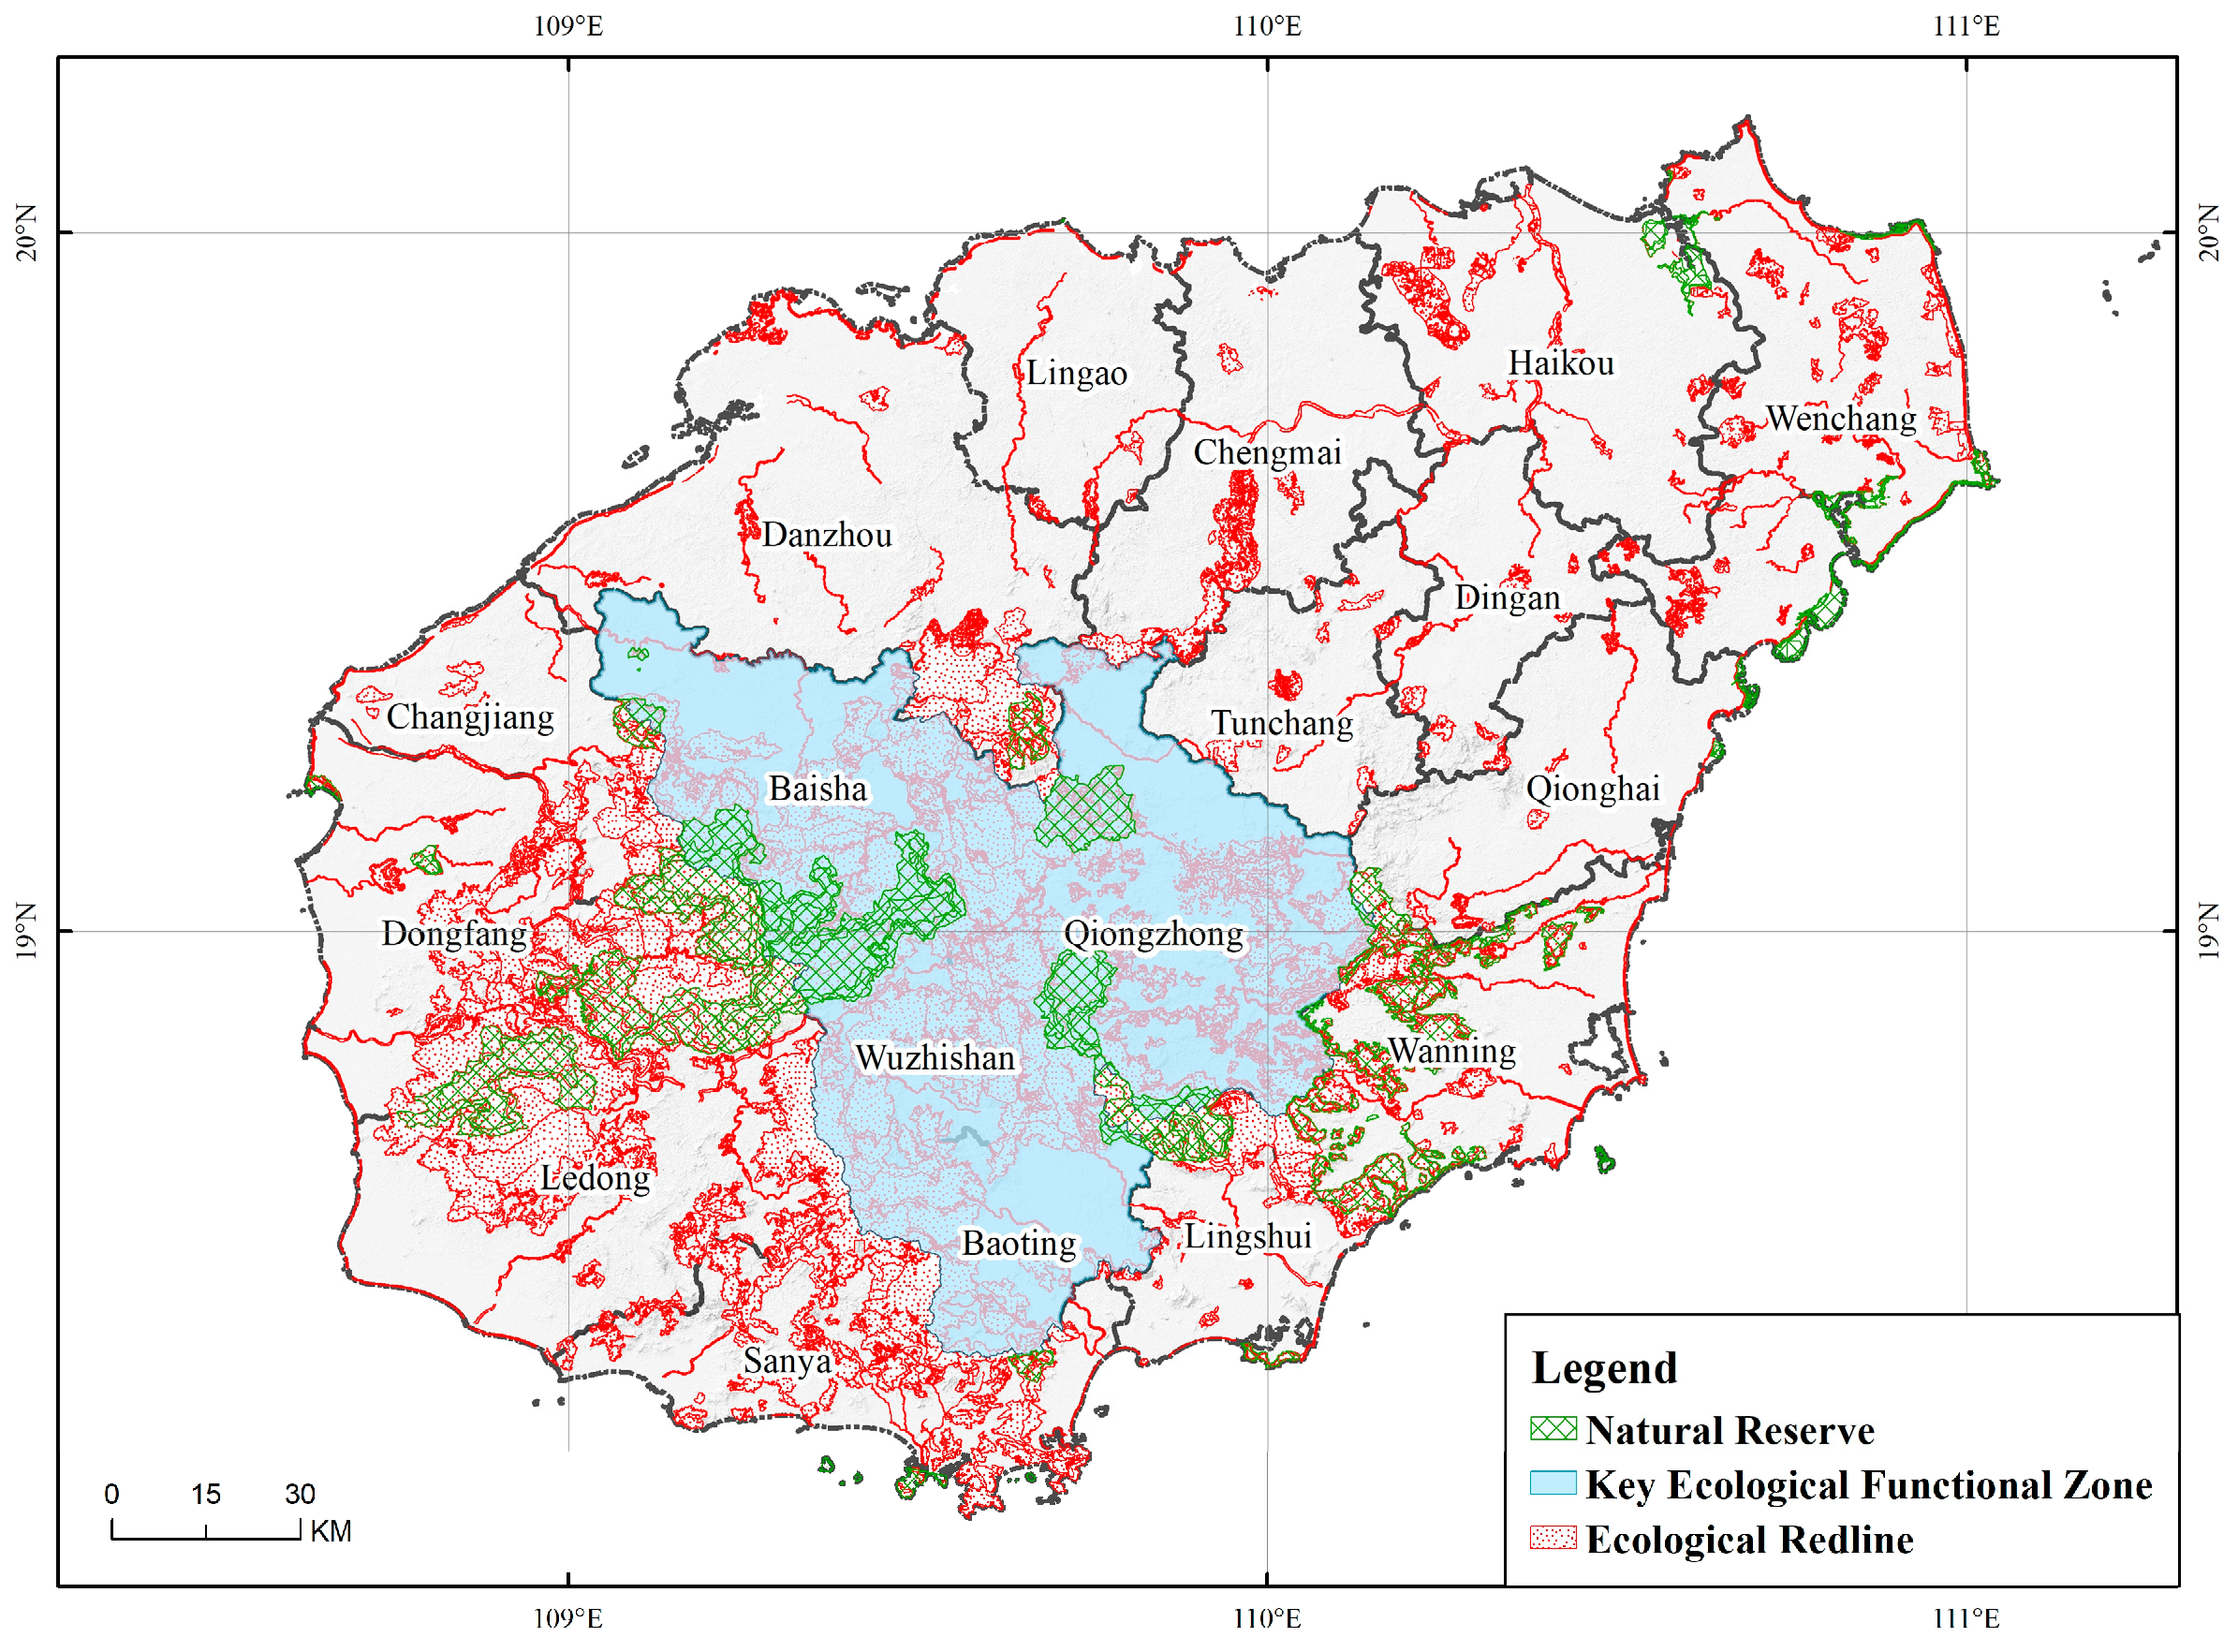
Figure 1. Spatial distribution of various important nature reserves on Hainan Island.
Diversity 16 00265 g001
Figure 2. Evaluation framework of ecological status, collaborative management, and control effectiveness of important protected areas.
Diversity 16 00265 g002
Figure 3. Spatial distribution of ecosystems in 2020 and statistical characteristics in protection regions.
Diversity 16 00265 g003
Figure 4. Spatial distribution in 2020 (a) and change from 2000 to 2020 (b) in the ecosystem quality on Hainan Island.
Diversity 16 00265 g004
Figure 5. Changes in ecosystem quality in Hainan and different ecological protection areas from 2000 to 2020.
Diversity 16 00265 g005
Figure 6. Spatial distribution and change in soil conservation (a) and water conservation benefits (b) on Hainan Island.
Diversity 16 00265 g006
Figure 7. Changes in soil conservation (a) and water conservation (b) in different ecological protection zones from 2000 to 2020.
Diversity 16 00265 g007
Figure 8. Characteristics and protection effects of ecosystem changes on Hainan Island and different ecological protection zones. * The color matching standard in the figure is as follows: the mean indicator is the green band, and the stability indicator is the orange band. The value of each ecological indicator was divided into 8 equal parts and colored. The darker the color, the greater the value. The “↘” arrow indicates a decrease, while the “↗” arrow indicates an increase.
Diversity 16 00265 g008
Table 1. Methods and input parameters concerning ecosystems quality and ecosystem services.
Evaluation ContentsEcosystem QualityEcosystem Services
Water ConservationSoil Conservation
Methods E Q I i , j = L A I i , j + F V C i , j + G P P i j 3 × 100 % Q w r = i = 1 n A i × P i R i E T i × 10 3 Q s r = Q s e _ p Q s e _ a
Q s e _ p = R × K × L × S
Q s e _ a = R × K × L × S × C × P
Input
Parameters
EQIi,j: ecosystem quality of division J in the i-th year;
LAIi,j: relative density of leaf area index in division j in the i-th year;
FVCi,j: relative density of vegetation coverage in division j in the i-th year;
GPPi,j: relative density of total primary productivity in division j in the i-th year.
Qwr: water conservation capacity;
i: ecosystem type i;
n: total number of ecosystem types;
Ai: area of class i ecosystem;
Pi: rainfall capable of producing running water;
Ri: surface runoff;
ETi: evapotranspiration.
Qsr: soil retention;
Qse_p: amount of potential soil erosion;
Qse_a: actual amount of soil erosion;
R: rainfall erosivity factor;
K: soil erodibility factor;
L: slope length factor;
S: slope factor;
C: vegetation cover factor;
P: factor of soil conservation measures.
Disclaimer/Publisher’s Note: The statements, opinions and data contained in all publications are solely those of the individual author(s) and contributor(s) and not of MDPI and/or the editor(s). MDPI and/or the editor(s) disclaim responsibility for any injury to people or property resulting from any ideas, methods, instructions or products referred to in the content.