Abstract
In urban and agricultural streams, assessing aquatic ecosystem health is critical due to widespread pollution. Traditional methods for evaluating attached diatoms crucial for ecosystem monitoring face limitations such as species misidentification and sample damage. This study was conducted in the Miho River within the Geum River system and highlights the effectiveness of environmental DNA (eDNA) techniques for more accurate and efficient genetic-based analysis than conventional microscopic analysis methods. When eDNA-based assessments were compared with traditional microscopic methods, this study found that eDNA analysis often revealed poorer ecosystem health. Notably, eDNA assessments showed a stronger correlation with phosphorus concentrations, underlining their precision and importance in ecological studies. These findings suggest that eDNA has potential as a valuable tool for comprehensive biomonitoring. However, the use of international genetic barcode databases in eDNA analysis could lead to the identification of unrecorded species in Korea. Therefore, this study recommends developing a localized genetic barcode database and constructing eDNA information through meta-barcoding, focusing on native species. This approach is crucial for enhancing the accuracy and applicability of eDNA-based health assessments in national biomonitoring efforts.
1. Introduction
The physicochemical method for assessing water quality can only evaluate the quality of a specific sample during the assessment, indicating its limitation in accurately representing the real-time variability of water quality. In other words, analyzing numerous pollutants in the water using chemical methods is highly inefficient. Assessing corresponding increase in harm associated with increased concentrations of pollutants is even more challenging [1,2]. However, biological methods utilizing indicator organisms can provide an estimation of the average water quality during a specific period, which allows for the assessment of past pollutant outflows and takes into account cumulative effects of pollutants. Indicator organisms living in the water reflect a synthetic and cumulative state of physicochemical water quality and habitat status. Thus, biological evaluation using indicator organisms ultimately reflects the health of the aquatic ecosystem [3,4].
The diatoms are the primary producers in the stream ecosystem, accounting for a significant proportion of the ecosystem’s metabolism and trophic level [5,6]. In particular, these organisms are useful for determining water quality because its recovery rate for disturbances their very quick compared to other biota. In addition, its changes in biomass due to environmental changes are clear [7]. In addition, since it lives attached to a substrate, it can be used to identify cumulative changes in the water system [8]. The current practice of assessing water quality using diatoms is based on ‘Trophic Diatom Index (TDI)’ [9,10]. Calculation of TDI relies on the utilization of pollution sensitivity and weighting of the index based on occurrence frequency and relative density of diatoms. Thus, the community structure of diatoms has a significant impact on the calculation of TDI [11]. Therefore, it can be stated that the accuracy of community structure analysis is directly related to the accuracy of water quality assessment utilizing diatoms.
Currently, the method for identifying diatoms and analyzing communities is based on morphological characteristics observed with optical microscopes or electron microscopes. Such morphological characteristics for identifying diatoms are very detailed, including the shape and length of diatom shell valves, the arrangement and spacing of holes in the striae present on the shell, the shape of the apex, the shape of the tip of the raphe, and the length of the stigma, which shows a wide variation, with differences ranging from 3 to 10 μm, or more [12,13,14]. These morphological differences can primarily be distinguished using optical microscopes with a 1000× magnification, while finer variations can be observed with an electron microscope. As a result, identifying certain large genera such as Cymbella, Navicula, and Nitzschia can be easily done using an optical microscope set at 1000× magnification, accurately observing features of the striae and central area. However, identifying small species such as Acnanthes and some Navicular, Fragillaria, and Nitzschia species becomes challenging at the optical microscope level [15,16]. Additionally, the ambiguity surrounding the distinction between the arrangement of striae and the shape of the end of the raphe can result in different identifications depending on the observer, which can lead to varying results when identifying diatom species, depending on the observer’s expertise in identification and the equipment used.
To reduce ambiguity in morphological identification criteria and minimize variance in results among different observers, species identification begins to rely on gene sequencing through a metabarcoding process of environmental DNA (eDNA) [17,18]. Environmental DNA (eDNA) refers to DNA derived from organisms present in the water, soil, and atmosphere. It contains genetic information from various organisms living in the environment. In addition, eDNA metabarcoding is a method that can disassemble genomes into countless pieces and read each piece simultaneously. It is a new sequencing analysis method used in a wide variety of fields such as medical diagnosis, forensic science, and genomics [19,20,21,22,23]. Since one researcher can quickly analyze a vast amount of genetic information, eDNA metabarcoding can minimize variations in analysis by observers and shorten the time required for analysis [24,25]. In addition, microbial communities present in samples collected from a specific environment can be analyzed with great precision and comprehensiveness. Through nucleotide sequence analysis, rare species that might have been overlooked during microscopic analysis can be identified [26,27].
In this study, metabarcoding using eDNA present in stream substrates of various sizes was performed and a community of diatoms was identified based on gene sequences. In addition, health assessment of diatoms was conducted using eDNA metabarcoding and the applicability of eDNA-based diatom health assessment was determined by comparing results with existing microscope-based health assessment results.
2. Materials and Methods
2.1. Sampling Sites and Biofilm Sampling
Biofilms (Figure S1) attached to substrates were collected four times throughout the year—in March, May, July, and September—at 12 different samples sites along the Mihogang River, which flows into the Geumgang River basin (Figure 1). Biofilms were collected following the guidelines stated in the National Biomonitoring Survey and Assessment Manual [10]. Biofilms collected from rapids of the stream at survey sites can represent changes in the underwater environment through horizontal cross-sections. Collected biofilms consisted of 3 to 6 pebbles or boulders with flat surfaces, ranging from 10 to 20 cm in diameter, that were submerged in the water. The substrate was collected within a 100 cm2 area in a quadrat at the site scraped by a toothbrush. It was then placed in a wide-mouthed bottle using distilled water, stored at a low temperature, and transported to the laboratory.
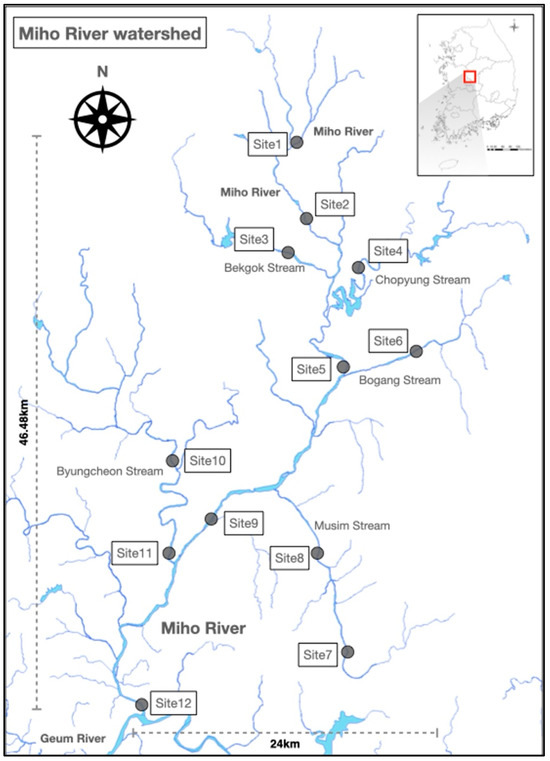
Figure 1.
Distribution of survey sites in this study. The red rectangle indicates the watershed of the Mihogang River.
2.2. Extraction of Biofilm eDNA and PCR
Extraction of eDNA from the biofilm of substrate was carried out according to the extraction method presented by the eDNA Society of Japan [28]. Utilizing a disposable brush and tertiary distilled water, biofilm from a 5 cm × 5 cm area was collected and transported to the laboratory. In the laboratory, the biofilm was filtered onto GF/F filter paper (47 mm, Whatman, Maidstone, UK), and environmental DNA (eDNA) was concentrated. The eDNA from the filter paper was then extracted by placing it into a Salivette tube (Sarstedt, Nordrhein-Westfalen, Germany). The extraction of eDNA was performed using the Blood and Tissue kit (Qiagen, Hilden, Germany), following the method outlined by the eDNA Society of Japan [28], involving the mixing of Proteinase K and Buffer AL, which was injected into the filter paper for eDNA extraction. The extracted eDNA was purified using the kit’s mini column, and finally, the purified eDNA was eluted in Buffer AE. The extracted DNA sample was stored in a deep freezer (−80 °C) before analysis. Metabarcoding analysis was conducted using an Illumina MiSeq platform to determine the diatom community present in the biofilm of the substrate. Primers developed based on the rbcL gene of the diatom [29] (rbcL-646F: ATG CGT TGG AGA GAR CGT TTC, rbcL-998R: GAT CAC CTT CTA ATT TAC CWA CAA CTG) were used in the primary PCR to amplify the rbcL gene of diatom in the eDNA present in the biofilm. For metabarcoding, primers were employed with the attachment of Nextera consensus and sequencing adaptors (Forward: TCG TCG GCA GCG TC-A GAT GTG TAT AAG AGA CAG, Reverse: GTC TCG TGG GCT CGG-AGA TGT GTA TAA GAG ACA G). Primary PCR was performed with the following conditions: heating at 95 °C for 3 min, 35 cycles of 30 s at 95 °C, 30 s at 64 °C, and 30 s at 72 °C, followed by heating at 72 °C for 5 min. Amplified fragments were subjected to 2% agarose gel electrophoreses using an E-gelTM Power Snap Electrophoresis system (Thermo Fisher Scientific, Waltham, MA, USA) and then identified in 352 bp with an E-gelTM Power Snap Camera (Thermo Fisher Scientific, Waltham, MA, USA).
2.3. Meta-Barcoding for Diatom Community Analysis
Amplified fragment of the primary PCR had Illumina MiSeq barcode attached using the Nextra XT Index Kit V2. The secondary PCR was performed with the following conditions: heating at 95 °C for 3 min; 8 cycles of 30 s at 95 °C, 30 s at 55 °C, and 30 s at 72 °C; and followed by heating at 72 °C for 5 min to attach a barcode. Samples with barcodes attached through the secondary PCR were analyzed by an agency specializing in sequencing (Metagenome Bio Life Science Inc., Waterloo, ON, Canada) with an Illumina platform through the paired-end method. Species identified based on the rbcL gene sequence, which analyzed approximately 35,000 reads per sample using the IdTaxa classifier (ver. 2.26.0) [30] of the DECIPHER package (ver. 2.26.0) [31]. We used the Genbank database to identify diatom species. And, contigs that were not identified at the species level were selectively chosen for BLAST analysis, and the determination was made at the genus level whenever possible.
2.4. Diatom Community Analysis Using a Microscope
The Diatom community within the biofilm, analyzed using a microscope, underwent a preprocessing procedure following the methods outlined in the ‘Biomonitoring Survey and Assessment Manual’ [10]. Subsequently, permanent slide mounts were prepared, and attached diatom species were analyzed based on microscopic observations. A brief description of the Manual’s methodology is as follows: To facilitate observation of the shell of diatoms, organic matter was removed by acid washing and permanent specimen was created using a mount media solution (Wako, Tokyo, Japan) after a sufficient dilution process using distilled water. The permanent specimen produced was identified with 1000× magnification using an optical microscope (Leica DM 2500, Wetzlar, Germany). To obtain more accurate data, a minimum of 200 or more valvesper samples were counted. Diatoms were identified through literature sources [32,33,34,35,36]. Their morphological characteristics were classified based on Simonsen’s morphology [37].
2.5. Assessment of Diatom Ecological Health
Trophic diatom index (TDI) for assessing biological health of aquatic ecosystems by utilizing a community of diatoms identified through a microscope was calculated using the following formula [11]:
where Ai was the population of species i, Si was the sensitivity value of species i (1 ≤ S ≤ 5), and Vi was the indicator value of species i (1 ≤ V ≤ 3).
TDI was calculated using sensitivity values, indicator values, and populations of species. It was used to determine five grades according to the national Biomonitoring Survey and Assessment Manual: Very good (grade A), Good (grade B), Fair (grade C), Poor (grade D), and Very Poor (grade E) [10].
In this study, different sensitivity and indicator values were utilized following diatom analysis. Sensitivity and indicator values used in the analysis using a microscope were obtained from the Biomonitoring Survey and Assessment Manual [10]. For health assessment using eDNA, recalculated diatom sensitivity and indicator values of eDNA based on the assessment conducted by Kim [38] were used.
2.6. Statistical Analysis
To investigate the correlation between the Trophic Diatom Index (TDI) derived from both microscopy and environmental DNA (eDNA) methods in this study and water quality, bivariate correlations between each index and concentrations of total phosphorus and phosphate were analyzed. The correlation analysis included the presentation of a 95% confidence interval, and Spearman correlation coefficients (r values) were calculated, validating statistical significance at the 0.001 and 0.05 levels. Statistical analyses were conducted using IBM SPSS Statistics (version 29.0.1.0, IBM, Armonk, NY, USA), and Plot graphs with 95% confidence intervals were displayed using DataGraph (version 5.2, Visual Data Tools, Inc., Chapel Hill, NC, USA).
3. Results
3.1. Difference of Diatom Community between Morphology and Biofilm eDNA Analyses
Dominant and subdominant species as a result of conducting analysis using a microscope four times at 12 different survey points are shown in Table 1. In the fourth survey, dominant and subdominant species among all identified species were shown to be Nitzschia inconspicua and Navicula subminuscula (relative density: 48.6% and 8.1%, respectively), with the relative density of N. inconspicua being nearly six times higher than that of N. subminuscula. In March and May surveys conducted before seasonal rainfall, N. inconspicua (20.3%), N. cryptocephala (14.3%), Fragilaria elliptica (13.9%), and N. inconspicua (13.8%) were identified as dominant and subdominant species, respectively. At certain survey points, F. elliptica mostly found in low PO4-P concentrations exhibited dominance. However, in the July survey conducted after the rainfall, N. inconspicua and N. subminuscula were found to dominate and subdominate, accounting for 24.0% and 23.4%, respectively. In the September survey, which shows a decrease in the frequency and intensity of rainfall, N. inconspicua and Nanicula minima were found to be dominant and subdominant species with relative densities of 35.2% and 18.3%, respectively.

Table 1.
Dominance and subdominance of diatom species based on light microscope (LMS).
When analyzing the diatom community based on eDNA collected from the same biofilm at the same survey point, most of the four surveys showed similar results in microscopic analysis of dominant and subdominant taxa of diatoms (Table 2). In microscopic analysis, Navicula subminuscula, Navicula minima, Achnanthes minutissima, Nitzschia inconspicua, and Nitzschia palea, which accounted for significant proportions, were dominant and subdominant species in eDNA analysis. However, some survey points showed that Melosira varians, Fragilaria flavovirens (Gedaniella flavovirens), Gomphonema minutum, and Diatoma tenuis diatoms, which did not account for a significant proportion in microscopic analysis, accounted for a substantial proportion in eDNA analysis (Figure 2). In the March survey, Navicula subminuscula dominated and Diatoma tenuis subdominated in all survey points. However, after March, D. tenuis did not account for a large proportion in any survey points. In the May survey, N. palea and N. subminuscula were dominant and subdominant, respectively. In the July survey conducted after the rainfall, N. palea exhibited a significant dominance. In the September survey, microscope-based analysis revealed that small N. inconspicua or N. subminuscula dominated. However, in the eDNA-based analysis, a significant number of contigs of M. varians with large cell sizes were found, indicating that M. varians dominated. In results of eDNA metabarcoding analysis, no diatoms were identified as species (sp.) in March or May survey. However, from the July survey, Navicula sp. contigs that were difficult to identify at the species level accounted for a large proportion. They dominated in July and September surveys.
Table 2.
Dominance and subdominance of diatom species based on eDNA metabarcoding (eDNA).
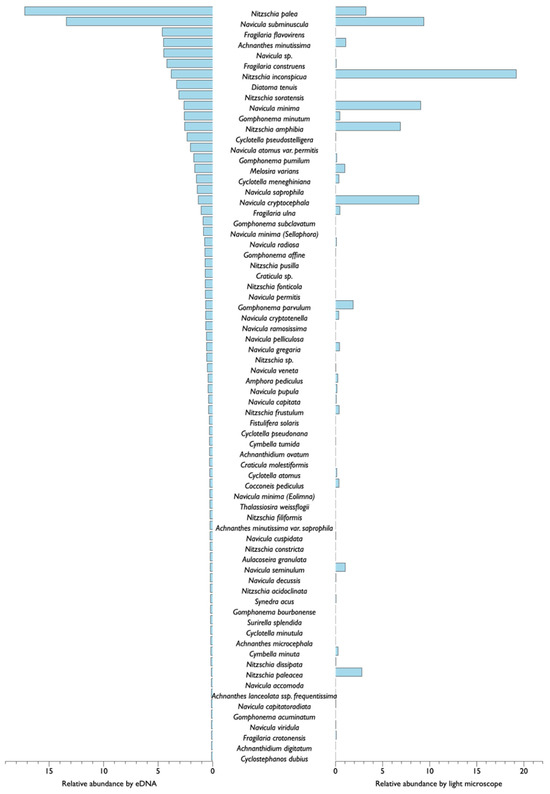
Figure 2.
Taxonomic differences in benthic diatom species occurrence based on diatom species identification methods: eDNA metabarcoding (left bar) and light microscope (right bar). Diatom species targeted over 0.1% relative abundance in eDNA metabarcoding.
3.2. Differences of Ecological Health Assessment between Microscope and Metabarcoding
In the four assessments of 12 survey points, the average trophic diatom index (TDI) analyzed based on microscopic assessment was 59.9 points, which was evaluated as a ‘C grade’ (Figure 3A). There was no significant change after rainfall. However, from the March survey to the September survey, the health of the diatoms tended to gradually improve (Figure 3B). In addition, surveys conducted in March and May prior to the rainfall indicated that the health of diatoms in the mainstream of the Mihogang River was lower than that found in the inflow stream. However, after the rainfall, those found in the mainstream were found to be healthier than those in the inflow stream. The average trophic diatom index (TDI) for the March survey was 49.8 points, resulting in a D grade. However, the average TDI for the May survey slightly increased to 57.5 points, indicating a C grade. July and September surveys indicated improvement, with health scores of 59.3 points (grade C) and 72.9 points (grade B), respectively. In the March survey, there was a significant difference (9.5 to 90.3) in TDI among survey points. In the May survey and the July survey, the deviation between survey points decreased when compared to the March survey. In the September survey, the deviation between survey points was the lowest. All points, ranging from C to B, failed to show significant differences in TDI.
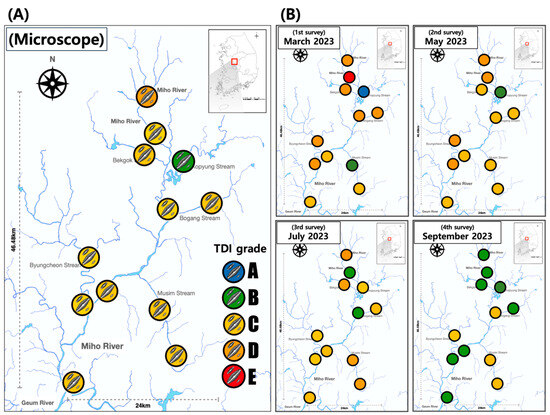
Figure 3.
Assessment of ecological health for benthic diatom based on light microscope. (A) Averaged during research period. (B) Assessment on each survey. In the TDI assessment results, the colors inside the circles represent the following: Blue: Very good, Green: Good, Yellow: Moderate, Orange: Poor, Red: Very bad.
The health assessment value of diatom evaluated using eDNA was lower than that of the microscope-based assessment of diatom at most survey points (Figure 4A). In the eDNA-based assessment, all survey points were evaluated to be below the average C grade in the four assessments, with more than 50% of survey points assessed as a grade of D or E (Figure 4B). However, in the microscope-based assessment, all but some survey points (site 1, site 6) were evaluated as a C grade on average. In particular, site 1 and site 2, both located upstream, had the lowest health with an E grade at both points in the eDNA-based assessment. However, they were evaluated to be better as C and D grades in the microscope-based assessment. In the pre-rainfall surveys (March and May), there was a significant disparity in health based on the analysis technique at several points. However, in the second survey conducted immediately after the rainfall, most of the survey points displayed a significant disparity between eDNA and microscopic analysis. In a survey conducted in July immediately after the rainfall, site 1 and site 5, both located upstream, of the mainstream received a rating of B indicating good health. However, in the eDNA-based health evaluation, the majority of mainstream points were rated as E. In the September survey, which experienced stabilization after rainfall, the majority of mainstream points were assessed as D grade according to eDNA, with site 12 located downstream receiving an evaluation of E grade.
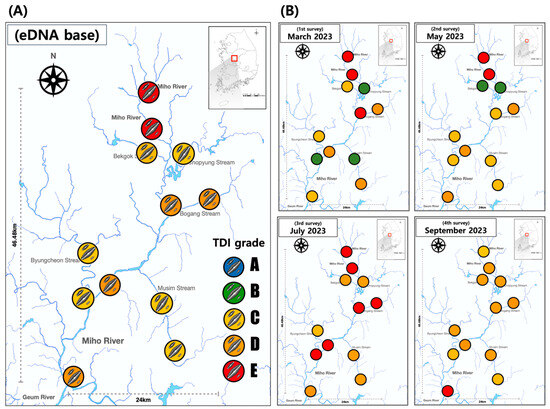
Figure 4.
Assessment of ecological health for benthic diatom based on eDNA metabarcoding. (A) Averaged during research period. (B) Assessment on each survey. In the TDI assessment results, the colors inside the circles represent the following: Blue: Very good, Green: Good, Yellow: Moderate, Orange: Poor, Red: Very bad. In the TDI assessment using eDNA, no A-grade was detected.
In four assessments at 12 survey points, results of eDNA-based health assessment of diatom and existing microscope-based health assessment of diatom varied depending on the survey point. There were no differences in grades among the five survey points with a score difference of less than 10 points. However, there was a difference of 20 points or more in TDI evaluation values at seven survey points. There were occasions with a difference of 1 grade or more. In particular, the eDNA-based health assessment of diatom at site 1 in the upper stream was assessed as E grade with an average of 28.9 points. However, in the microscope-based health assessment of diatom, it was evaluated as a C grade with 52.3 points, indicating a difference of two grades. Site 9, a downstream site, exhibited the largest difference, with a gap of 31.2 points between eDNA-based diatom health assessment value (average of 34.3 points) and microscope-based assessment value (average of 65.5 points), although the difference in grade was not significant due to the score range.
3.3. Correlation with Water Quality (Total Phosphorus, TP; Phosphate, PO4-P)
To confirm the accuracy of the health assessment value of diatom using eDNA, the concentration and correlation (Spearman’s rho) of phosphate (PO4-P) and total phosphate (TP) were determined and compared with the existing health assessment value of diatom using a microscope (Figure 5). Only eDNA-based health assessment values of diatoms in both PO4-P and TP showed statistically significant correlations, with a correlation coefficient being nearly twice as high as that obtained from microscopic-based health assessment. Results of the eDNA-based health assessment for diatoms showed correlations with PO4-P and TP (coefficients of −0.603 and −0.609, respectively), all of which showed a statistical significance (p < 0.001). However, microscope-based health assessment values for attached stoma showed relatively lower correlation coefficients with PO4-P and TP (−0.267 and −0.286, respectively), although these corrections were not statistically significance (p > 0.50).
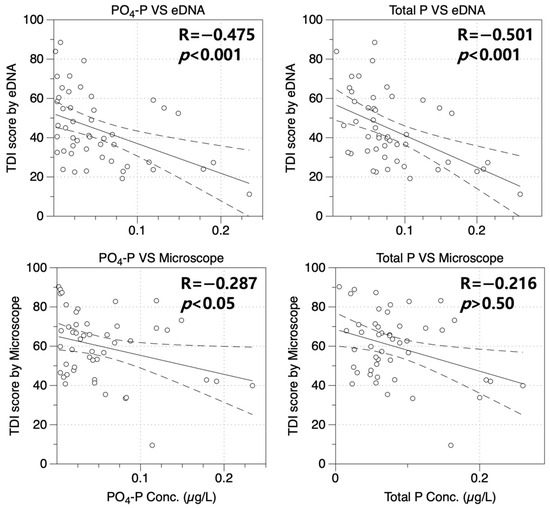
Figure 5.
Correlations with water quality indicators PO4-P and TP (Total Phosphorus) according to ecological health assessment method. The solid line represents the slope of the correlation coefficient, while the dashed line indicates the 95% confidence interval. The white circles denote TDI scores corresponding to the respective P concentrations.
4. Discussion and Conclusions
When comparing results of analyses of diatom using eDNA and conventional microscopes, the largest difference was observed in species that appeared. In particular, dominant and subdominant species, as indicated by microscopic analysis and eDNA metabarcoding analysis, were found to be different. In addition, several unrecorded diatoms not previously reported in Korea were discovered through eDNA analysis. This discrepancy was primarily caused by differences in the criteria utilized for species listing and an insufficient sequence database [39,40]. The list of diatom species based on microscopic observations is currently derived from the diatom species record of the “National List of Species of Korea” [10,41]. However, the gene sequence database based on eDNA relies on species names entered by researchers worldwide. These entries are updated to reflect the latest modification of the species name at the time of input [42]. As a result, the most recent species names are mixed up with the gene sequence database from the past. For example, Eolina subminuscula, which emerged as a prominent dominant species in the eDNA analysis results, was previously known as Navicula subminuscula. It is listed in the National List of Species [10,42]. Rather than assuming that the species had actually appeared, the unrecorded species found in eDNA analysis could be judged as an error caused by misidentification resulting from an insufficient gene sequence database or BLAST of non-specific amplified products (PCR products) [43,44,45]. Currently, not all diatoms have information in the gene sequence database existing in the widely used GenBank of the National Centre of Biological Information (NCBI). Most notably, the Achananthes conversion, which is most dominant in Korea, is a prominent species in both Korea and Asia. However, it is currently absent from GenBank’s gene sequence database [46]. In this study, since the gene sequence information of Cymbella silesiaca, which was identified as a subdominant species in microscopic analysis, did not exist in GenBank, it could be concluded that it belongs to another diatom with similar gene sequences.
In addition, in the case of large-sized diatoms (e.g., Melosira varians, Eunotia pectinalis var. undulata, Cymbella cistula, Cymbella aspera, etc.), the cell envelope might be physically damaged during the process of collecting diatoms, which might result in omission of species identification and counting based on shape from microscopic analysis [47]. However, even if the shell of diatoms is physically destroyed, the DNA of all diatoms still exists in the sample collected from the field. Thus, it can be analyzed using eDNA, which is believed to enable a more accurate community analysis, including taxa that might have been omitted from the current process of field collection.
The use of this analysis technique can lead to differences in the diatom community, which in turn affects health assessment results of diatoms. Existing microscope-based health assessment is performed by treating biofilms collected from the substrate of the site with acid to remove organic matter, followed by identifying and counting species based on the shell of diatoms [48,49,50]. This acid treatment aims to enhance the accuracy of the identification process by enabling a clearer observation of the shell of the diatom. However, during the acid treatment process and creation of permanent specimen, shells of diatoms may be physically destroyed [48,51]. In addition, it is not possible to determine whether diatoms collected at the site are living or dead cells. However, since eDNA-based health assessment of diatoms relies on DNA present in cells, species identification and contig calculation are typically performed under the assumption of the presence of living cells. Therefore, the difference between microscope-based and eDNA-based structures of diatom communities cannot be disregarded, potentially resulting in variations in the assessment of the health of diatoms.
Additionally, there exists a significant difference in the analytical scale between eDNA analysis and microscopic analysis. Currently, the ‘Biomonitoring Survey and Assessment Manual’ [10] recommends counting a minimum of 200 valves when analyzing diatom communities under a microscope. However, in this paper, the eDNA analysis involved the examination of 30,000 reads, which can be considered equivalent to counting over 30,000 valves based on microscopic standards. The robust analytical power of eDNA analysis allows for the detection of many rare species that are challenging to identify through microscopic analysis. Consequently, eDNA analysis consistently reveals a higher number of diatom species compared to microscopic analysis. Furthermore, the diatom species list and atlas [10,32,33,34,35,36] used in the National biomonitoring network do not reflect the latest diatom classification system. However, eDNA-based analysis results incorporate the most recent diatom classification system, potentially leading to the discovery of a relatively more diverse assemblage of diatoms.
In the health assessment of diatoms, eDNA demonstrated a stronger correlation with water quality than the existing microscope-based assessment method. Thus, it has a higher utility value as an assessment standard to provide important information that can help us gain a clearer understanding of changes occurring in the aquatic ecosystem. However, in cases where the difference from the microscope is clear, it cannot be said that the health assessment of diatom using eDNA has a high utility value. eDNA metabarcoding offers the advantage of analyzing numerous locations across broad regions and allows for the identification of challenging species without significant variation among analysts. However, in small-scale monitoring scenarios (e.g., fewer than five sites), microscopic analysis can yield faster results, and the taxonomic identification at the genus level may exhibit minimal variation among analysts, even with lower expertise in benthic diatom morphology analysis. Furthermore, the absence of DNA sequences for certain species does not preclude their identification at the genus level through phylogenetic analysis in eDNA-based approaches. It is anticipated that, during regional development, water quality assessment using diatoms may be applicable to narrow areas beyond the national biomonitoring network, with fewer than three sampling sites. For these reasons, microscopic analysis methods can continue to be employed. Therefore, by generating genus-level diatom indicators from eDNA and subsequently applying them to microscopic analysis, the trends observed in microscopic analysis results are expected to align with those derived from eDNA analysis. In other words, obtaining indicators for the entire diatom community at the species level using precise eDNA analysis and then presenting indicators at the genus level could contribute to the utilization of diatoms in biological water quality assessment across diverse research fields, such as ecological modeling.
Supplementary Materials
The following supporting information can be downloaded at: https://www.mdpi.com/article/10.3390/d16010008/s1, Figure S1: The biofilm attached to the gravel substrate found in the river during field surveys.
Author Contributions
Conceptualization, K.K.; Methodology, H.C.; Software, K.K.; Validation, H.C.; Formal analysis, K.K.; Investigation, H.C., H.J. and Y.-M.Y.; Data curation, J.-H.K.; Writing—original draft preparation, K.K.; Writing—review and editing, H.C.; Visualization, K.K.; Supervision, M.-H.J.; Project administration, H.-G.J.; Funding acquisition, M.-H.J., J.-H.K. and H.-G.J. All authors have read and agreed to the published version of the manuscript.
Funding
This work was carried out with the support of a R&D research project (NIER-2023-01-01-178) funded by National Institute of Environmental Science, Republic of Korea.
Institutional Review Board Statement
Not applicable.
Data Availability Statement
The data presented in this study are available in this article and supplementary material.
Conflicts of Interest
Author Jeong-Hui Kim was employed by the company EcoResearch Inc. The remaining authors declare that the research was conducted in the absence of any commercial or financial relationships that could be construed as a potential conflict of interest.
References
- Kelly, M.; Juggins, S.; Guthrie, R.; Pritchard, S.; Jamieson, J.; Rippey, B.; Hirst, H.; Yallop, M. Assessment of ecological status in UK rivers using diatoms. Freshw. Biol. 2008, 53, 403–422. [Google Scholar] [CrossRef]
- Kim, N.-Y. Study on the Improvement of Biological Water Quality Assessment Method Using the Distribution of Benthic Diatoms in Korea Stream. Ph.D. Thesis, Konkuk University, Seoul, Republic of Korea, 2012. [Google Scholar]
- Hynes, H.B.N. The Biology of Polluted Waters; Liverpool University Press: Liverpool, UK, 1960. [Google Scholar]
- Environmental Protection Agency (EPA). Biological Assessments and Criteria: Crucial Components of Water Quality Programs; Office of Water, United States Environmental Protection Agency: Washington, DC, USA, 2002.
- Gaiser, E. Periphyton as an indicator of restoration in the Florida Everglades. Ecol. Indic. 2009, 9, S37–S45. [Google Scholar] [CrossRef]
- Ewe, S.M.; Gaiser, E.E.; Childers, D.L.; Iwaniec, D.; Rivera-Monroy, V.H.; Twilley, R.R. Spatial and temporal patterns of aboveground net primary productivity (ANPP) along two freshwater-estuarine transects in the Florida Coastal Everglades. Hydrobiologia 2006, 569, 459–474. [Google Scholar] [CrossRef]
- Allan, J.D.; Castillo, M.M.; Capps, K.A. Stream Ecology: Structure and Function of Running Waters; Springer: Dordrecht, The Netherlands, 2021. [Google Scholar]
- McCormick, P.V.; Stevenson, R.J. Periphyton as a tool for ecological assessment and management in the Florida Everglades. J. Phycol. 1998, 34, 726–733. [Google Scholar] [CrossRef]
- Choi, J. Research Study on Development of Comprehensive Water Environment Assessment Method (Ⅲ) Final Report; Korean Environment Institute, Ministry of Environment: Seoul, Republic of Korea, 2006. [Google Scholar]
- NIER. Biomonitering Survey and Assessment Manual; Office of Water and Environmental Engineering, National Institute of Environmental Research: Seoul, Republic of Korea, 2019; p. 129. [Google Scholar]
- Kelly, M.; Whitton, B.A. The trophic diatom index: A new index for monitoring eutrophication in rivers. J. Appl. Phycol. 1995, 7, 433–444. [Google Scholar] [CrossRef]
- Vasselon, V.; Rimet, F.; Domaizon, I.; Monnier, O.; Reyjol, Y.; Bouchez, A. Assessing pollution of aquatic environments with diatoms’ DNA metabarcoding: Experience and developments from France Water Framework Directive networks. Metabarcoding Metagenom. 2019, 3, 101–115. [Google Scholar] [CrossRef]
- Kawecka, B.; Olech, M. Diatom communities in the Vanishing and Ornithologist Creek, King George Island, South Shetlands, Antarctica. In Proceedings of the Twelfth International Diatom Symposium, Renesse, The Netherlands, 30 August–5 September 1992. [Google Scholar]
- Round, F.E.; Crawford, R.M.; Mann, D.G. Diatoms: Biology and Morphology of the Genera; Cambridge University Press: Cambridge, UK, 1990. [Google Scholar]
- Yoon, S.-K. A Taxonomic Study on the Genus Synedra (Bacillariophyceae) in Korea. Master’s Thesis, Catholic University, Washington, DC, USA, 2001. [Google Scholar]
- Cho, K. Algal Flora of Korea; National Institute of Biological Resource, Ministry of Environment: Sejong, Republic of Korea, 2010.
- Ramadan, H.; Baeshen, N.A. Biological Identifications through DNA Barcodes. In Biodiversity Conservation and Utilization in a Diverse World; IntechOpen: London, UK, 2012; pp. 109–128. [Google Scholar]
- Mann, D.G.; Sato, S.; Trobajo, R.; Vanormelingen, P.; Souffreau, C. DNA barcoding for species identification and discovery in diatoms. Cryptogam. Algol. 2010, 31, 557–577. [Google Scholar]
- Schlötterer, C.; Kofler, R.; Versace, E.; Tobler, R.; Franssen, S. Combining experimental evolution with next-generation sequencing: A powerful tool to study adaptation from standing genetic variation. Heredity 2015, 114, 431–440. [Google Scholar] [CrossRef]
- Shokralla, S.; Spall, J.L.; Gibson, J.F.; Hajibabaei, M. Next-generation sequencing technologies for environmental DNA research. Mol. Ecol. 2012, 21, 1794–1805. [Google Scholar] [CrossRef]
- Snyder, T.M.; Khush, K.K.; Valantine, H.A.; Quake, S.R. Universal noninvasive detection of solid organ transplant rejection. Proc. Natl. Acad. Sci. USA 2011, 108, 6229–6234. [Google Scholar] [CrossRef]
- Fan, H.C.; Gu, W.; Wang, J.; Blumenfeld, Y.J.; El-Sayed, Y.Y.; Quake, S.R. Non-invasive prenatal measurement of the fetal genome. Nature 2012, 487, 320–324. [Google Scholar] [CrossRef] [PubMed]
- Weber-Lehmann, J.; Schilling, E.; Gradl, G.; Richter, D.C.; Wiehler, J.; Rolf, B. Finding the needle in the haystack: Differentiating “identical” twins in paternity testing and forensics by ultra-deep next generation sequencing. Forensic Sci. Int. Genet. 2014, 9, 42–46. [Google Scholar] [CrossRef] [PubMed]
- Brenner, S.; Johnson, M.; Bridgham, J.; Golda, G.; Lloyd, D.H.; Johnson, D.; Luo, S.; McCurdy, S.; Foy, M.; Ewan, M. Gene expression analysis by massively parallel signature sequencing (MPSS) on microbead arrays. Nat. Biotechnol. 2000, 18, 630–634. [Google Scholar] [CrossRef] [PubMed]
- Margulies, M.; Egholm, M.; Altman, W.E.; Attiya, S.; Bader, J.S.; Bemben, L.A.; Berka, J.; Braverman, M.S.; Chen, Y.-J.; Chen, Z. Genome sequencing in microfabricated high-density picolitre reactors. Nature 2005, 437, 376–380. [Google Scholar] [CrossRef] [PubMed]
- Faust, K.; Raes, J. Microbial interactions: From networks to models. Nat. Rev. Microbiol. 2012, 10, 538–550. [Google Scholar] [CrossRef]
- Kim, K.H.; Yoon, Y.; Hong, W.-Y.; Kim, J.; Cho, Y.-C.; Hwang, S.-J. Application of metagenome analysis to characterize the molecular diversity and saxitoxin-producing potentials of a cyanobacterial community: A case study in the North Han River, Korea. Appl. Biol. Chem. 2018, 61, 153–161. [Google Scholar] [CrossRef]
- Minamoto, T.; Miya, M.; Sado, T.; Seino, S.; Doi, H.; Kondoh, M.; Nakamura, K.; Takahara, T.; Yamamoto, S.; Yamanaka, H. An illustrated manual for environmental DNA research: Water sampling guidelines and experimental protocols. Environ. DNA 2021, 3, 8–13. [Google Scholar] [CrossRef]
- Kelly, M.; Boonham, N.; Juggins, S.; Kille, P.; Mann, D.; Pass, D.; Sapp, M.; Sato, S.; Glover, R.; Walsh, K. A DNA Based Diatom Metabarcoding Approach for Water Framework Directive Classification of Rivers; Department for Environment, Food & Rural Affairs: Bristol, UK, 2018; p. 157.
- Murali, A.; Bhargava, A.; Wright, E.S. IDTAXA: A novel approach for accurate taxonomic classification of microbiome sequences. Microbiome 2018, 6, 140. [Google Scholar] [CrossRef]
- Wright, E.S. Using DECIPHER v2. 0 to analyze big biological sequence data in R. R J. 2016, 8, 352–359. [Google Scholar] [CrossRef]
- Krammer, K.; Lange-Bertalot, H. Süßwasserflora von Mitteleuropa, Bd 2/1. Bacillariophyceae. 1. Teil: Bacillariaceae, Epithemiaceae, Surirellaceae; Gustav Fischer: Jena, Germany, 1988. [Google Scholar]
- Krammer, K.; Lange-Bertalot, H.; Pascher, A.; Ettl, H. Bacillariophyceae 3/4: Centrales, Fragilariaceae, Eunotiaceae; Gustav Fischer: Jena, Germany, 1991. [Google Scholar]
- Krammer, K.; Lange-Bertalot, H.; Pascher, A.; Ettl, H. Bacillariophyceae 4/4: Achnanthaceae, kritische Ergänzungen zu Navicula (Lineolatae) und Gomphonema Gesamtliteraturverzeichnis; Gustav Fischer: Jena, Germany, 1991. [Google Scholar]
- Krammer, K.; Lange-Bertalot, H. Süßwasserflora von Mitteleuropa, Bd 2/2. Bacillariophyceae. 2. Teil: Bacillariaceae, Epithemiaceae, Surirellaceae; Gustav Fischer: Jena, Germany, 1988. [Google Scholar]
- Watanabe, T.; Ohtsuka, T.; Tuji, A.; Houki, A. Picture Book and Ecology of the Freshwater Diatoms; Uchida-Rokakuho: Tokyo, Japan, 2005; pp. 1–666. [Google Scholar]
- Simonsen, R. The diatom system: Ideas on phylogeny. Bacillaria 1979, 2, 9. [Google Scholar]
- Kim, K.; Kim, N.-y.; No, S.; Park, J.; Hwang, S.-j. Diatom community analysis and Trophic diatom index assessment by eDNA in stream biofilm. In Proceedings of the Korean Society of Limnology Annual Conference, Research center of K-Water, Daejeon, Republic of Korea, 14–18 October 2019; p. 8. [Google Scholar]
- Rimet, F.; Aylagas, E.; Borja, A.; Bouchez, A.; Canino, A.; Chauvin, C.; Chonova, T.; Ciampor, F., Jr.; Costa, F.O.; Ferrari, B.J. Metadata standards and practical guidelines for specimen and DNA curation when building barcode reference libraries for aquatic life. Metabarcoding Metagenom. 2021, 5, 17–33. [Google Scholar] [CrossRef]
- Kim, D.-K.; Park, K.; Jo, H.; Kwak, I.-S. Comparison of water sampling between environmental DNA metabarcoding and conventional microscopic identification: A case study in Gwangyang Bay, South Korea. Appl. Sci. 2019, 9, 3272. [Google Scholar] [CrossRef]
- Park, J.; An, J.-H.; Kim, Y.; Kim, D.; Yang, B.-G.; Kim, T. Database of National Species List of Korea: The taxonomical systematics platform for managing scientific names of Korean native species. J. Species Res. 2020, 9, 233–246. [Google Scholar] [CrossRef]
- Guiry, M.D.; Guiry, G. AlgaeBase; National University of Ireland: Galway, Ireland, 2008. [Google Scholar]
- Stoeck, T.; Breiner, H.W.; Filker, S.; Ostermaier, V.; Kammerlander, B.; Sonntag, B. A morphogenetic survey on ciliate plankton from a mountain lake pinpoints the necessity of lineage-specific barcode markers in microbial ecology. Environ. Microbiol. 2014, 16, 430–444. [Google Scholar] [CrossRef] [PubMed]
- Santoferrara, L.F.; Grattepanche, J.-D.; Katz, L.A.; McManus, G.B. Patterns and processes in microbial biogeography: Do molecules and morphologies give the same answers? ISME J. 2016, 10, 1779–1790. [Google Scholar] [CrossRef] [PubMed]
- Harvey, J.B.; Johnson, S.B.; Fisher, J.L.; Peterson, W.T.; Vrijenhoek, R.C. Comparison of morphological and next generation DNA sequencing methods for assessing zooplankton assemblages. J. Exp. Mar. Biol. Ecol. 2017, 487, 113–126. [Google Scholar] [CrossRef]
- Benson, D.A.; Karsch-Mizrachi, I.; Lipman, D.J.; Ostell, J.; Rapp, B.A.; Wheeler, D.L. GenBank. Nucleic Acids Res. 2000, 28, 15–18. [Google Scholar] [CrossRef] [PubMed]
- Patil, J.S.; Anil, A.C. Quantification of diatoms in biofilms: Standardisation of methods. Biofouling 2005, 21, 181–188. [Google Scholar] [CrossRef]
- Taylor, J.; Harding, W.; Archibald, C. A Methods Manual for the Collection, Preparation and Analysis of Diatom Samples, TT 281/07; Water Research Commission: Pretoria, South Africa, 2007; p. 60. [Google Scholar]
- Bahls, L. Cymbellafalsa, Cymbopleura and Delicatophycus (Bacillariophyta)—Taxonomy, Ecology, Biogeography; Independent Publisher, The Montana Diatom Collection: Helena, MT, USA, 2019. [Google Scholar]
- Hasle, G.R.; Fryxell, G.A. Diatoms: Cleaning and mounting for light and electron microscopy. Trans. Am. Micros. Soc. 1970, 89, 469–474. [Google Scholar] [CrossRef]
- Coello-Camba, A.; Agustí, S. Acidification counteracts negative effects of warming on diatom silicification. Biogeosci. Discuss 2016, 1–5. [Google Scholar]
Disclaimer/Publisher’s Note: The statements, opinions and data contained in all publications are solely those of the individual author(s) and contributor(s) and not of MDPI and/or the editor(s). MDPI and/or the editor(s) disclaim responsibility for any injury to people or property resulting from any ideas, methods, instructions or products referred to in the content. |
© 2023 by the authors. Licensee MDPI, Basel, Switzerland. This article is an open access article distributed under the terms and conditions of the Creative Commons Attribution (CC BY) license (https://creativecommons.org/licenses/by/4.0/).