Article

Genetic Variation among Aeluropus lagopoides Populations Growing in Different Saline Regions

by
Basharat A. Dar
,
Abdullah A. Al-Doss
,
Abdulaziz M. Assaeed
,
Muhammad M. Javed
,
Abdelhalim I. Ghazy
,
Saud L. Al-Rowaily
and
Ahmed M. Abd-ElGawad
*
Plant Production Department, College of Food & Agriculture Sciences, King Saud University, P.O. Box 2460, Riyadh 11451, Saudi Arabia
*
Author to whom correspondence should be addressed.
Diversity 2024, 16(1), 59; https://doi.org/10.3390/d16010059
Submission received: 25 November 2023 / Revised: 12 January 2024 / Accepted: 15 January 2024 / Published: 16 January 2024
(This article belongs to the Special Issue Population Genetics of Animals and Plants)

Abstract

:
Aeluropus lagopoides is a halophytic grass growing in different sabkhas of Saudi Arabia. In this study, 14 inter-simple sequence repeat (ISSR) and 15 sequence-related amplified polymorphism (SRAP) molecular markers were selected to investigate the genetic diversity within and among five natural populations of A. Lagopiodes. The genetic diversity varied within and among populations. ISSR markers were slightly more efficient than SRAP markers in evaluating genetic diversity. Average polymorphism information content, effective number of alleles, Nei’s genetic diversity, and Shannon’s information index values of ISSR markers were higher than SRAP. Analysis of molecular variance revealed about 40% genetic variation among the population and 60% within the population. Overall, the genetic diversity was lowest in Jouf (40%), while the Qaseem populations were the highest (60%). Jizan populations were highly dissimilar to other regions. A Mantel test indicated a positive correlation between geographic and genetic distance. The cluster analysis showed three groups; the first group comprises Jouf and Salwa populations, the second group comprises Qareenah and Qaseem, and the third group comprises the Jizan population. This observation matched the geographic distribution of the species. These findings can help in the conservation of a diverse population of A. lagopoides in saline regions as well as rehabilitation of these degraded unique habitats.

1. Introduction

Halophytes are salt-tolerant plants that grow naturally in saline habitats, lowland coastal flats, inland salt marshes, and seashores which constitute about 7–10% of the world’s land area [1]. They are naturally adapted to large areas of salt-affected rangelands [2], often creep, and act as sand binders [3], thus significantly protecting saline habitats and maintaining ecological stability. Also, various palatable halophytic species like Atriplex spp., Suaeda foliosa, and Distichlis spp. which grow well in highly saline soil around the world can replace traditional crops as potential sources of fodder [4] and can serve as reserves to fill the gap of annual fodder storage within the grazing management scheme [5]. Among various halophytic palatable species around the globe, Aeluropus lagopoides (L.) Thwaites is a perennial salt-secreting halophytic grass extended along North Africa, the Middle East, the Arabian Peninsula, and Central Asia. The plant largely inhabits coastal areas, inland salt marshes, sabkha edges, or saline soil around cultivated areas [6,7]. It also occurs in some inundated coastal habitats of eastern and southern and in the saline arid inland sabkhas of the central and northern regions of Saudi Arabia [8,9]. Due to its value as a forage plant [10] and its ability to prevent soil erosion by forming a dense, vigorous root network [7,11], A. lagopoides attracts the attention of researchers. As a perennial grass, A. lagopoides is considered a good candidate for salt-affected agriculture lands [10], and it could be integrated into sustainable landscaping of urban green areas in arid regions [3]. A. lagopoides mainly propagates as mono-specific stands through rhizomes or colonizes open niches through seeds [12]. The plant has various functional traits that enable its resistance to harsh environmental conditions, including vegetative propagation via stolon and rhizomes, excessive seed production, strong root system, small leaves, epicuticular wax, and salt-secreting glands [13].
Different coastal and inland regions of Saudi Arabia exhibit considerable variations in environmental conditions in terms of soil moisture, salinity, light, and temperature [14,15]. Usually, A. lagopoides populations in coastal habitats are subject to harsher environmental conditions compared to populations in inland sabkhas; such environmental stresses have a negative effect on A. lagopoides seed germination and in consequence its colonization [12,16]. Due to its overexploitation such as intense grazing in summer with harsh environmental conditions, this plant is under tremendous stress. As such, adaptive plasticity and vegetative propagation are the only means to maintain the population of A. lagopoides under such stressful environmental conditions [12,17]; however, these approaches could decrease its fitness and genetic diversity [18].
Genetic resources are among the most treasured resources of any country. Genetic variability present among/within the population of species or individuals is the fundamental element of biological polymorphism and species diversity [19]. The genetic diversity of species forms the main basis of the adaptation and evolution of species to different environments [20,21]. Genetic variability helps to build up the rich gene pool of the species that show heterozygosity in their tolerance/resistance to both biotic and abiotic stress [22]. Studying genetic diversity in plant populations has significance from different dimensions. Determining the genetic diversity of any plant population helps researchers in managing, collecting, conserving, maintaining, and specifying the plants as well as their usage [23]. Several methods are employed to assess genetic diversity, where morphological trait measurement is the most commonly used index for simple quantification of genetic variation and an assessment of genotypic performance under normal growing climatic conditions [24]. However, when plant populations are growing under different environmental conditions, it is difficult to use phenotypic variations to assess genetic variation [25]. Molecular markers have become a common method of determining genetic diversity in plants growing under different environmental conditions. In scientific research, the application of molecular markers has created new opportunities for identifying and manipulating specific genes. Molecular markers have become increasingly significant in assessing species diversity and evolutionary relationships. DNA-based PCR molecular markers provide higher polymorphism and are not prone to environmental influence [26,27].
Halophytes and their habitats attract the attention of nature conservationists, particularly in Central Europe [28]. However, few studies have used molecular markers to assess the genetic variability of halophytes between different habitats [29,30]. Recently, using a combination of ISSR-AFLPs, Aeluropus ecotypes have shown significant variation [31]. Among the different molecular markers, SRAP and ISSR have been broadly used to evaluate species genetic diversity [32,33] due to their cost-effectiveness, simplicity, and versatility without requiring sequencing information [34] and the requirement of minimal starting DNA templates [35]. The PCR-based ISSR marker is an attractive strategy for anchoring SSR by using a single primer to amplify DNA fragments between identical microsatellite repeat regions in both directions [35,36]. They provide high genome coverage, high effectiveness, time effectiveness, and cost-effectiveness. The analysis of genetic diversity using ISSR markers has been successfully evaluated in several species, such as Lolium [37,38,39], Paspalum rawitscheri (Parodi) Chase ex G.H.Rua and Valls [40], and Cenchrus ciliaris L. [41]. SRAP is a PCR-based dominant marker and can amplify open reading frames (ORFs) [42], as well as being a simple, reliable, moderate throughput ratio, and it reveals co-dominant markers [43] and has proven to be more informative for detecting genetic diversity than other PCR-based markers [44]. Recently, SRAP has been successfully used to study genetic variability patterns in plenty of grasses such as Elymus breviaristatus Keng ex Keng f. [20], Stenotaphrum secundatum (Walter) Kuntze [45], Buchloe dactyloides (Nutt.) Engelm. [46], Dactylis glomerata L. [47], and Cynodon dactylon (L.) Pers. [48].
Although RAPD markers have been used to investigate the genetic diversity of A. lagopoides populations [49], there is no report on the application of ISSR or SRAP markers in its genetic diversity assessment. Since A. lagopoides is an economical, multipurpose halophyte, studies about its genetic diversity can prove helpful for its conservation strategies and breeding programs. Although several reports are available on the ecological and physiological aspects of A. lagopoides [50], the genetic diversity of A. lagopoides populations from different regions of Saudi Arabia using molecular markers has not been explored so far. The present study aims to analyze the genetic diversity among/within the population of A. lagopoides growing in different eco-geographical regions of Saudi Arabia using ISSR and SRAP markers.

2. Materials and Methods

2.1. Plant Materials

Young fresh leaf tissues of A. lagopoides plants were randomly collected from five different eco-regions of Saudi Arabia, viz., Riyadh, Qaseem, Northern Plains of Jouf, Salwa, and Jizan. These selected different eco-regions have a geographical distance of more than 200 km from each other. Large-scale vegetation patterns of this species were considered during the collection of the plant samples. GPS positions of all population patches were recorded and listed in Table 1 and Figure S1.
Since A. lagopoides grows in the form of vegetation patches in each region with narrow distinction, five randomly distinct patches/quadrats were selected for sample collection at each location. In total, we targeted 25 populations of A. lagopoides (5 regions × 5 populations form each region). From each patch/quadrat, young leaf tissues from five plants of A. lagopoides were collected in plastic bags containing silica gel and mixed in equal proportions as a single individual for DNA extraction, and the process was repeated twice in order to increase detected signal intensity. So, a total of 5 composite samples were collected from each location. All the collected samples were washed, dried, duly labeled, and stored at −80 °C.

2.2. DNA Extraction

Two grams of leaf tissues from each stored sample were ground into powder in liquid nitrogen and kept at −80 °C until DNA isolation. DNA was extracted from each leaf tissue using the CTAB method [51]. The concentration of the extracted DNA was estimated using Nanodrop N.D 1000 (V.3.3.0, Thermo Scientific, Waltham, MA, USA), and the quantity and quality of DNA was determined on 1% agarose gels [52]. The qualified DNA was diluted to 5 ng/μL and stored at −20 °C for SRAP and ISSR reactions.

2.3. Sequence-Related Amplified Polymorphism Analysis (SRAP)

Twenty-four combinations of forward and reverse primers were selected for SRAP analysis according to the method of [42], out of which fifteen combinations listed in Table 2 generated strong and clear amplified bands. The polymerase chain reaction (PCR) was performed in a 20 µL volume with 25 ng DNA template, 1U Taq DNA polymerase, 2 µL 10× buffer, 0.6 µM of each forward and reverse primer, and water. The PCR amplification was performed using the following thermal profile: an initial denaturalization at 94 °C for 5 min; followed by five cycles of 1 min at 94 °C (denaturation), 1 min at 35 °C (annealing), and (denaturation), 1 min at 50 °C (annealing), and 1 min at 72 °C (elongation); followed by a final extension at 72 °C for 7 min. The samples were analyzed by agarose gel electrophoresis (2%) with staining by ethidium bromide (C21H20BrN3), and the bands were envisioned using a gel documentation system.

2.4. Inter-Simple Sequence Repeat (ISSR) Analysis

A total of 20 ISSR primers were used for the samples’ initial screening, and among them, 14 primers are listed in Table 2 and produced clear and reproducible sharp bands. PCR amplification was performed with a total volume of 20 µL containing 25 ng DNA template, 1U Taq DNA polymerase, 2 µL 10× buffer, 0.2 mM dNTPs, 0.5 µM primer, and water. PCR amplification was carried out at an initial denaturation of 94 °C for 4 min followed by 34 cycles of 1 min at 94 °C, primer-specific annealing temperature for 45 s, and initial extension for 1 min at 72 °C, followed by a final incubation for 8 min at 72 °C. The products of amplification were lastly assessed on agarose gel (1.5%) with C21H20BrN3, and the bands were envisioned using a gel documentation system.

2.5. Data Scoring and Molecular Analysis

To perform the multilocus analysis on molecular data, visible and clear amplified bands were scored for both SRAP and ISSR markers as 1 (presence) or 0 (absence) for all samples, and a binary data matrix was generated. The genetic similarity was calculated based on Jaccard similarity coefficients [53]. The distance matrix and dendrogram were constructed using the PAST 4.03 version software package. The resulting presence/absence data matrix was assessed for genetic diversity. Basic genetic parameters like Nei’s gene diversity (He) [54], Shannon’s information index (I) [55], and the polymorphic percentage loci (PPL) were calculated from the data using GenAlEx software, version 6.5. The number of polymorphic bands (A), polymorphism percentage (P%), polymorphic information content (PIC), and discriminating power (DP) were calculated used MS-Excel 2016.
Analysis of molecular variance (AMOVA) and principal coordinate analysis (PCoA) were calculated based on the genetic distance matrix that was generated for the ISSR and SRAP dataset from GenAlEx v6.5 software [56]. AMOVA was used to analyze the amount of genetic variation among and within the population and the extent of population genetic differentiation based on (PhiPT) values, an analogue of Fst. Furthermore, the PCoA plot represented the samples based on the eigenvalues in the two-dimensional graph with respect to the first two principal coordinates. On the basis of the latitude and longitude coordinates of the central sample of each population, geographic distances between the regions were calculated using Google Earth (https://www.earthol.com/ (accessed on 15 March 2023)).
Mantel test [57] was carried out to evaluate the correlation between the matrices of Nei’s genetic distances (generated by GENALEX 6.5 software using ISSR and SRAP datasets) and the geographical distances of the population using the PAST version software (999 permutations). A Mantel test was performed to estimate the correlation between similarity matrices generated by ISSR and SRAP datasets. This Mantel analysis was also performed for the combined ISSR and SRAP data. Using a single marker to evaluate the genetic relationships among and between populations can leave many open questions. Since both ISSR and SRAP markers have some limitations in practical application. SRAP marker usually develops 5 to 12 bands. Still, it may have false positive and negative results due to competitive reaction and low annealing temperature. At the same time, ISSR markers have been exhibited to be less productive for polymorphism detection with respect to some primer combinations [58]. Genetic diversity assessments using a combination of ISSR and SRAP would be more accurate and reliable. Therefore, clustering based on the combination of ISSR and SRAP markers was performed for clustering individuals from the same population on the same branch, which is more effective than single.

3. Results

3.1. Polymorphism Analysis

For ISSR markers, a total of 20 ISSR primers were used in the PCR reaction to analyze polymorphic patterns among A. lagopoides populations from five different saline regions of Saudi Arabia. However, 14 ISSR primers amplified 158 scorable bands (Table 3), most of which were polymorphic, accounting for 100% polymorphism. The highest number of polymorphic bands (20) in the ISSR primers was obtained with FBISSR-9 followed by (19) with the ISSR 15 primer, and the lowest (03) was with FBISSR-10. The polymorphism information content (PIC) and discriminating power (DP) for ISSR primers ranged from 0.60 and 1.92 (FBISSR-10) to 0.93 and 12.82 (FBISSR-9) with an average of 0.86 and 6.67 per primer, respectively.
For SRAP primers, 24 combinations were utilized to analyze polymorphic banding patterns, out of which 15 combinations showed reproducible and polymorphic patterns. A total of 108 bands with an average of 7.20 bands per primer combination were generated, most of which accounted for 100% polymorphism (Table 4). The number of polymorphic bands detected with each primer combination ranged from 4 (SRAP19F/SRAP4R) to 10 (SRAP9F/SRAP1R, 22 SRAPF/SRAP2R, and 9 SRAPF/SRAP31R). The polymorphism information content for SRAP primers ranged from 0.69 (SRAP22F/SRAP1R) to 0.87 (SRAP22F/SRAP2R) with an average of 0.80 per primer that could develop high loci polymorphism. Moreover, discriminating power (DP) for the SRAP primer ranged from 3.70 (SRAP19F/SRAP4R) to 9.26 (SRAP9F/SRAP1R, SRAP22F/SRAP2R, and SRAP9F/31R) with an average of 6.67 per primer.
The binary data generated by both ISSR and SRAP primers indicate that the genetic variability of A. lagopoides is highlighted. More bands (158) were produced by the 14 ISSR primers than 15 SRAP primer pairs (108). However, a high polymorphism percentage of 100% was obtained with both ISSR and SRAP primers. The results showed that both ISSR and SRAP markers effectively reveal the polymorphism within and among the population. The Mantel tests for the correlation of genetic distance for both ISSR and SRAP data with geographic distances revealed a high correlation (r = 0.73, p = 0.04 for ISSR and r = 0.80, p = 0.04 for SRAP). Interestingly, the correlation for the combined ISSR and SRAP with geographic distance is the same as that of the ISSR dataset (r = 0.73, p = 0.04). Furthermore, the Mantel correlation coefficient (r) of the A. lagopoides population based on the genetic distance matrices between ISSR and SRAP markers were highly and significantly correlated (r = 0.71, p = 0.01).
The analysis of molecular variance (AMOVA) (based on all populations as a region) was calculated to evaluate the percentage of genetic variability within and among the population of A. lagopoides with respect to both the ISSR and SRAP markers (alone and combined datasets). The results of SRAP marker AMOVA showed 59% of genetic variability within the population, and 41% was attributed to the genetic divergence among the population with a PhiPT value of 0.397 (p < 0.001), while AMOVA based on ISSR makers alone and ISSR + SRAP combined showed 60% of genetic variability within a population and 40% genetic divergence among the population with a PhiPT value of 0.407 and 0.401 (p < 0.001), respectively (Table 5). The genetic diversity within the population of the Qaseem region was maximum for both SRAP and ISSR markers, while for the Jouf region, it was lowest (Figure 1).

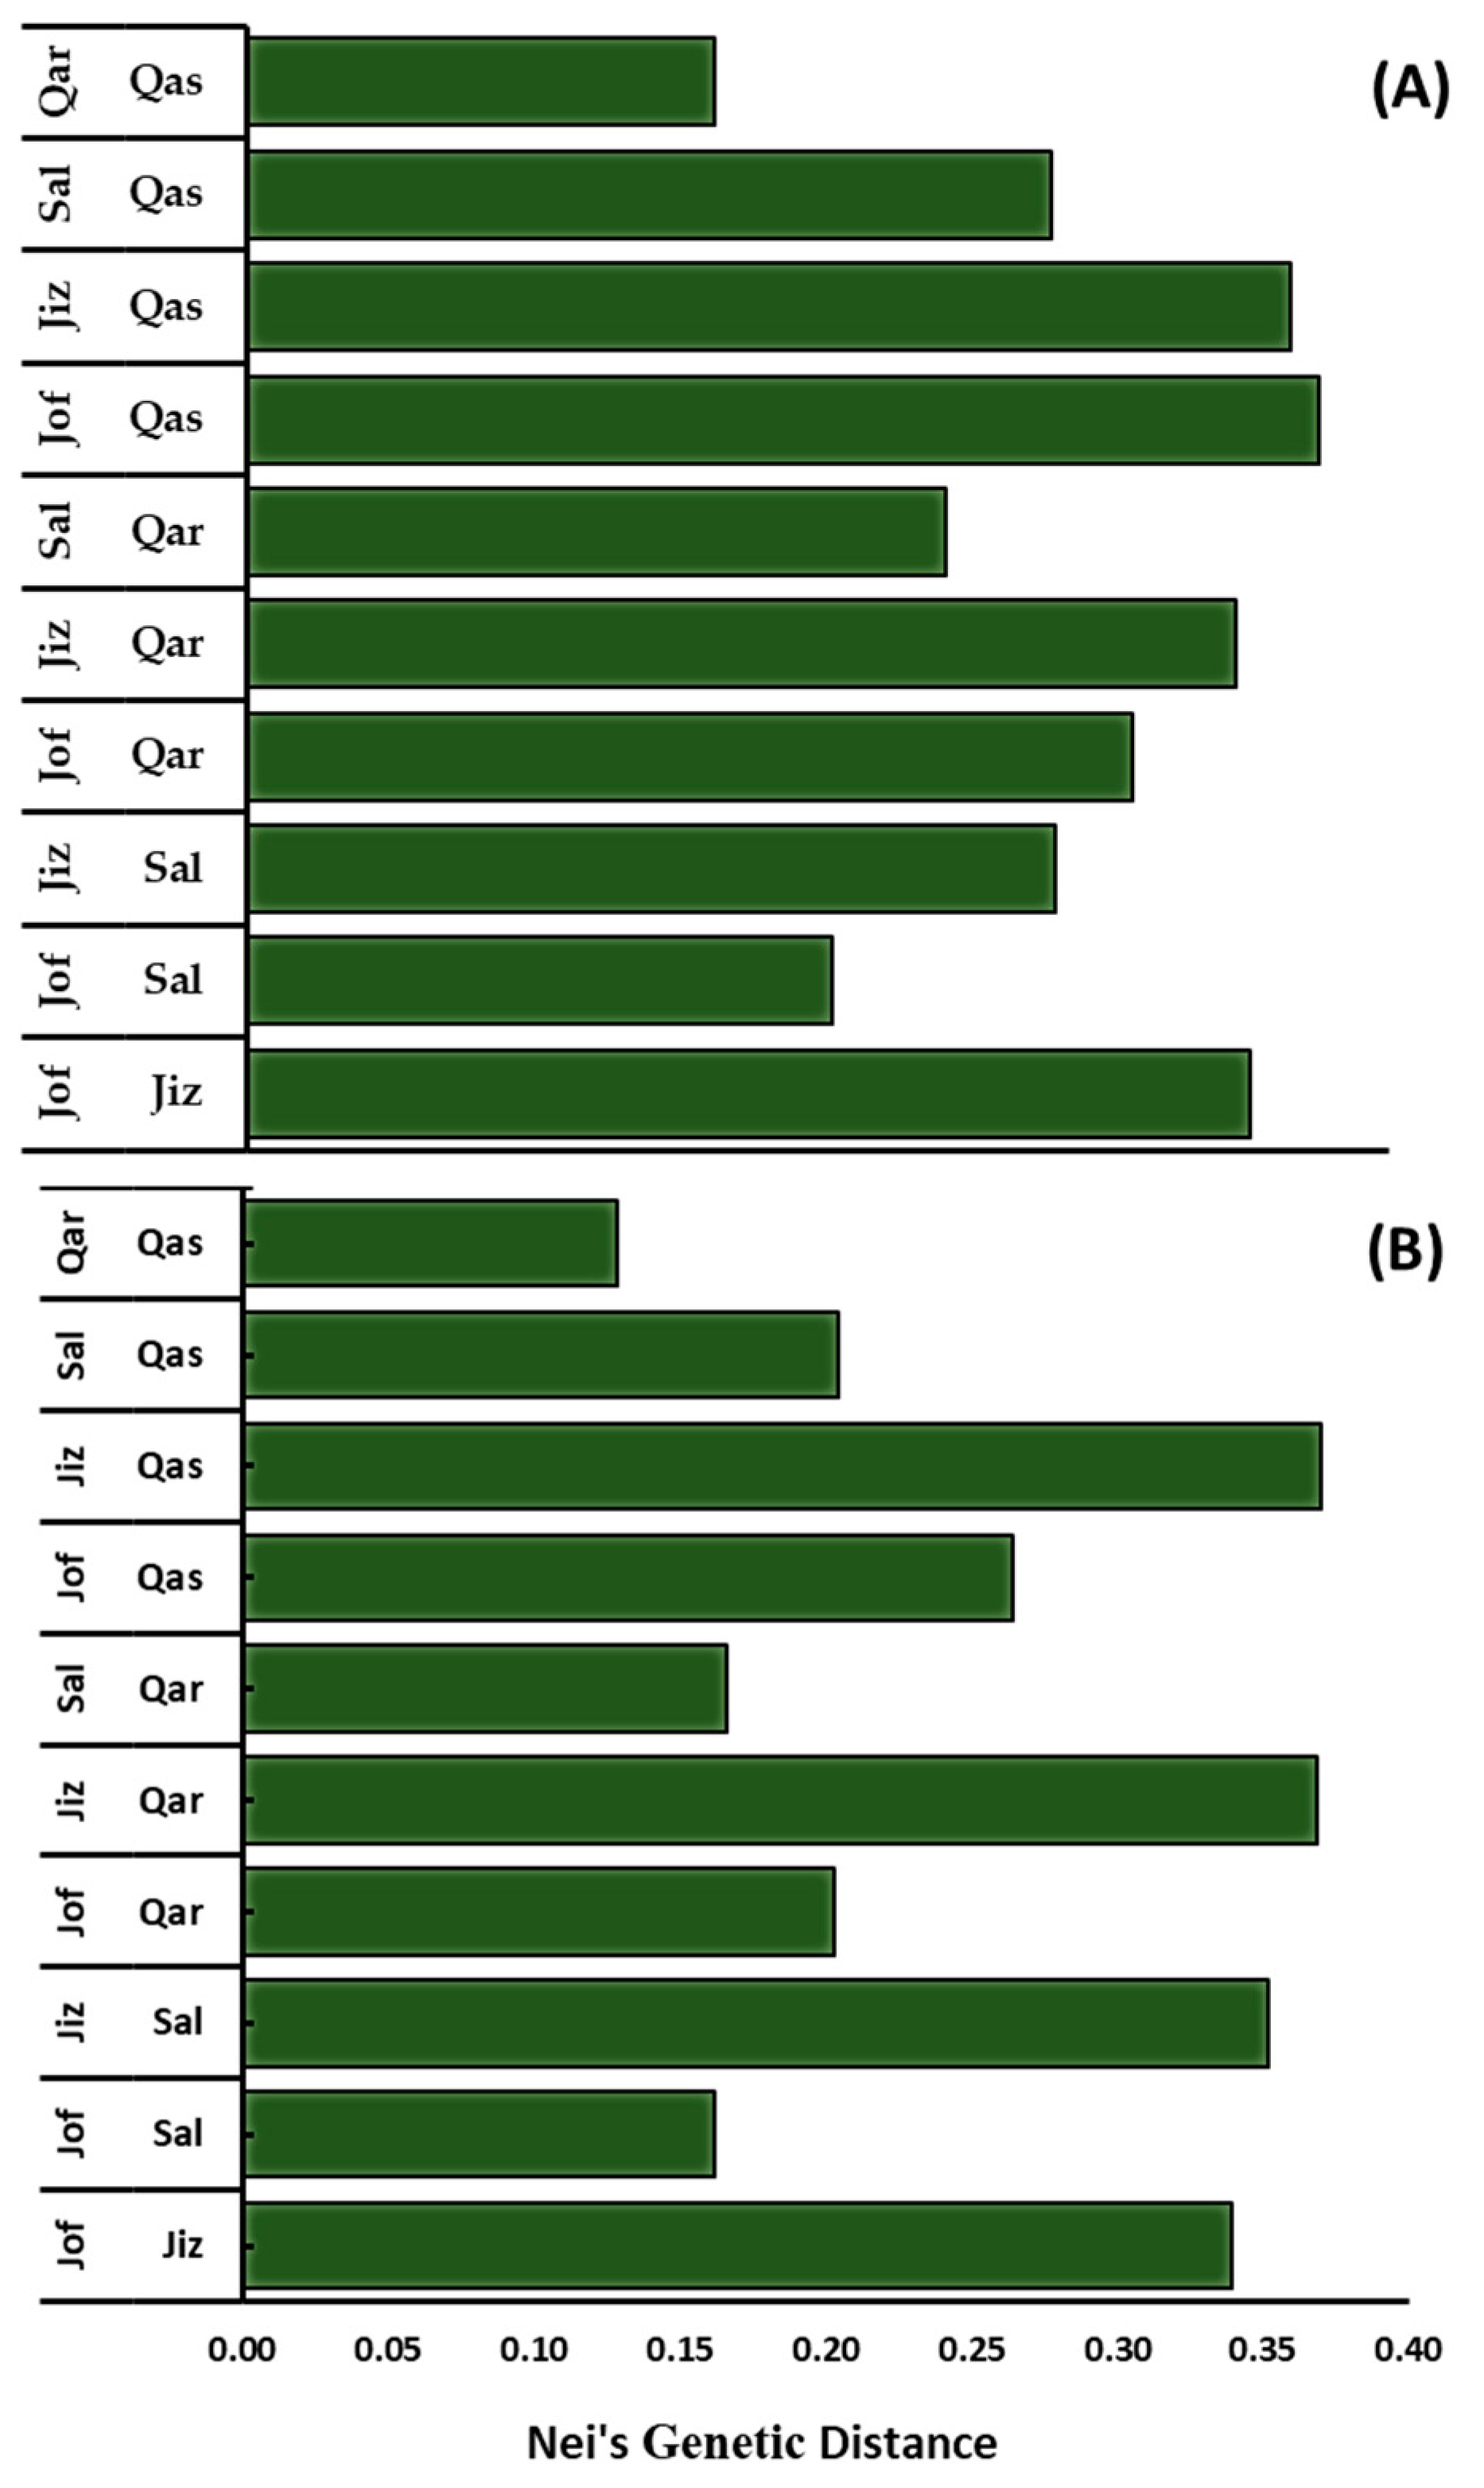
3.2. Genetic Diversity

A summary of the genetic diversity of A. lagopoides from each location based on ISSR and SRAP markers is given in Table 6.
For the ISSR analysis, assuming a Hardy–Weinberg equilibrium, the effective number of alleles per locus (ne) ranged from 1.274 to 1.361 with an average of 1.330, Nei’s genetic diversity (h) ranged from 0.243 to 0.323 with an average of 0.281, Shannon’s information index (1) ranged from 0.163 to 0.220 with an average of 0.191, and PPB ranged from 43.04% to 55.70% with an average of 48.23%. The number of alleles (Na) ranged from 1.013 to 1.082, with an average of 1.065 for the ISSR dataset. For the SRAP analysis, the effective number of alleles per locus (ne) ranged from 1.260 to 1.379 with an average of 1.289, Nei’s gene diversity (h) ranged from 0.151 to 0.219 with an average of 0.168, Shannon’s information index (1) ranged from 0.223 to 0.321 with an average of 0.247, and the PPB% ranged from 38.53 to 55.05% with an average of 42.57%, respectively (Figure 1B). The number of alleles (Na) ranged from 0.827 to 1.239, with an average of 0.980 for the SRAP dataset.

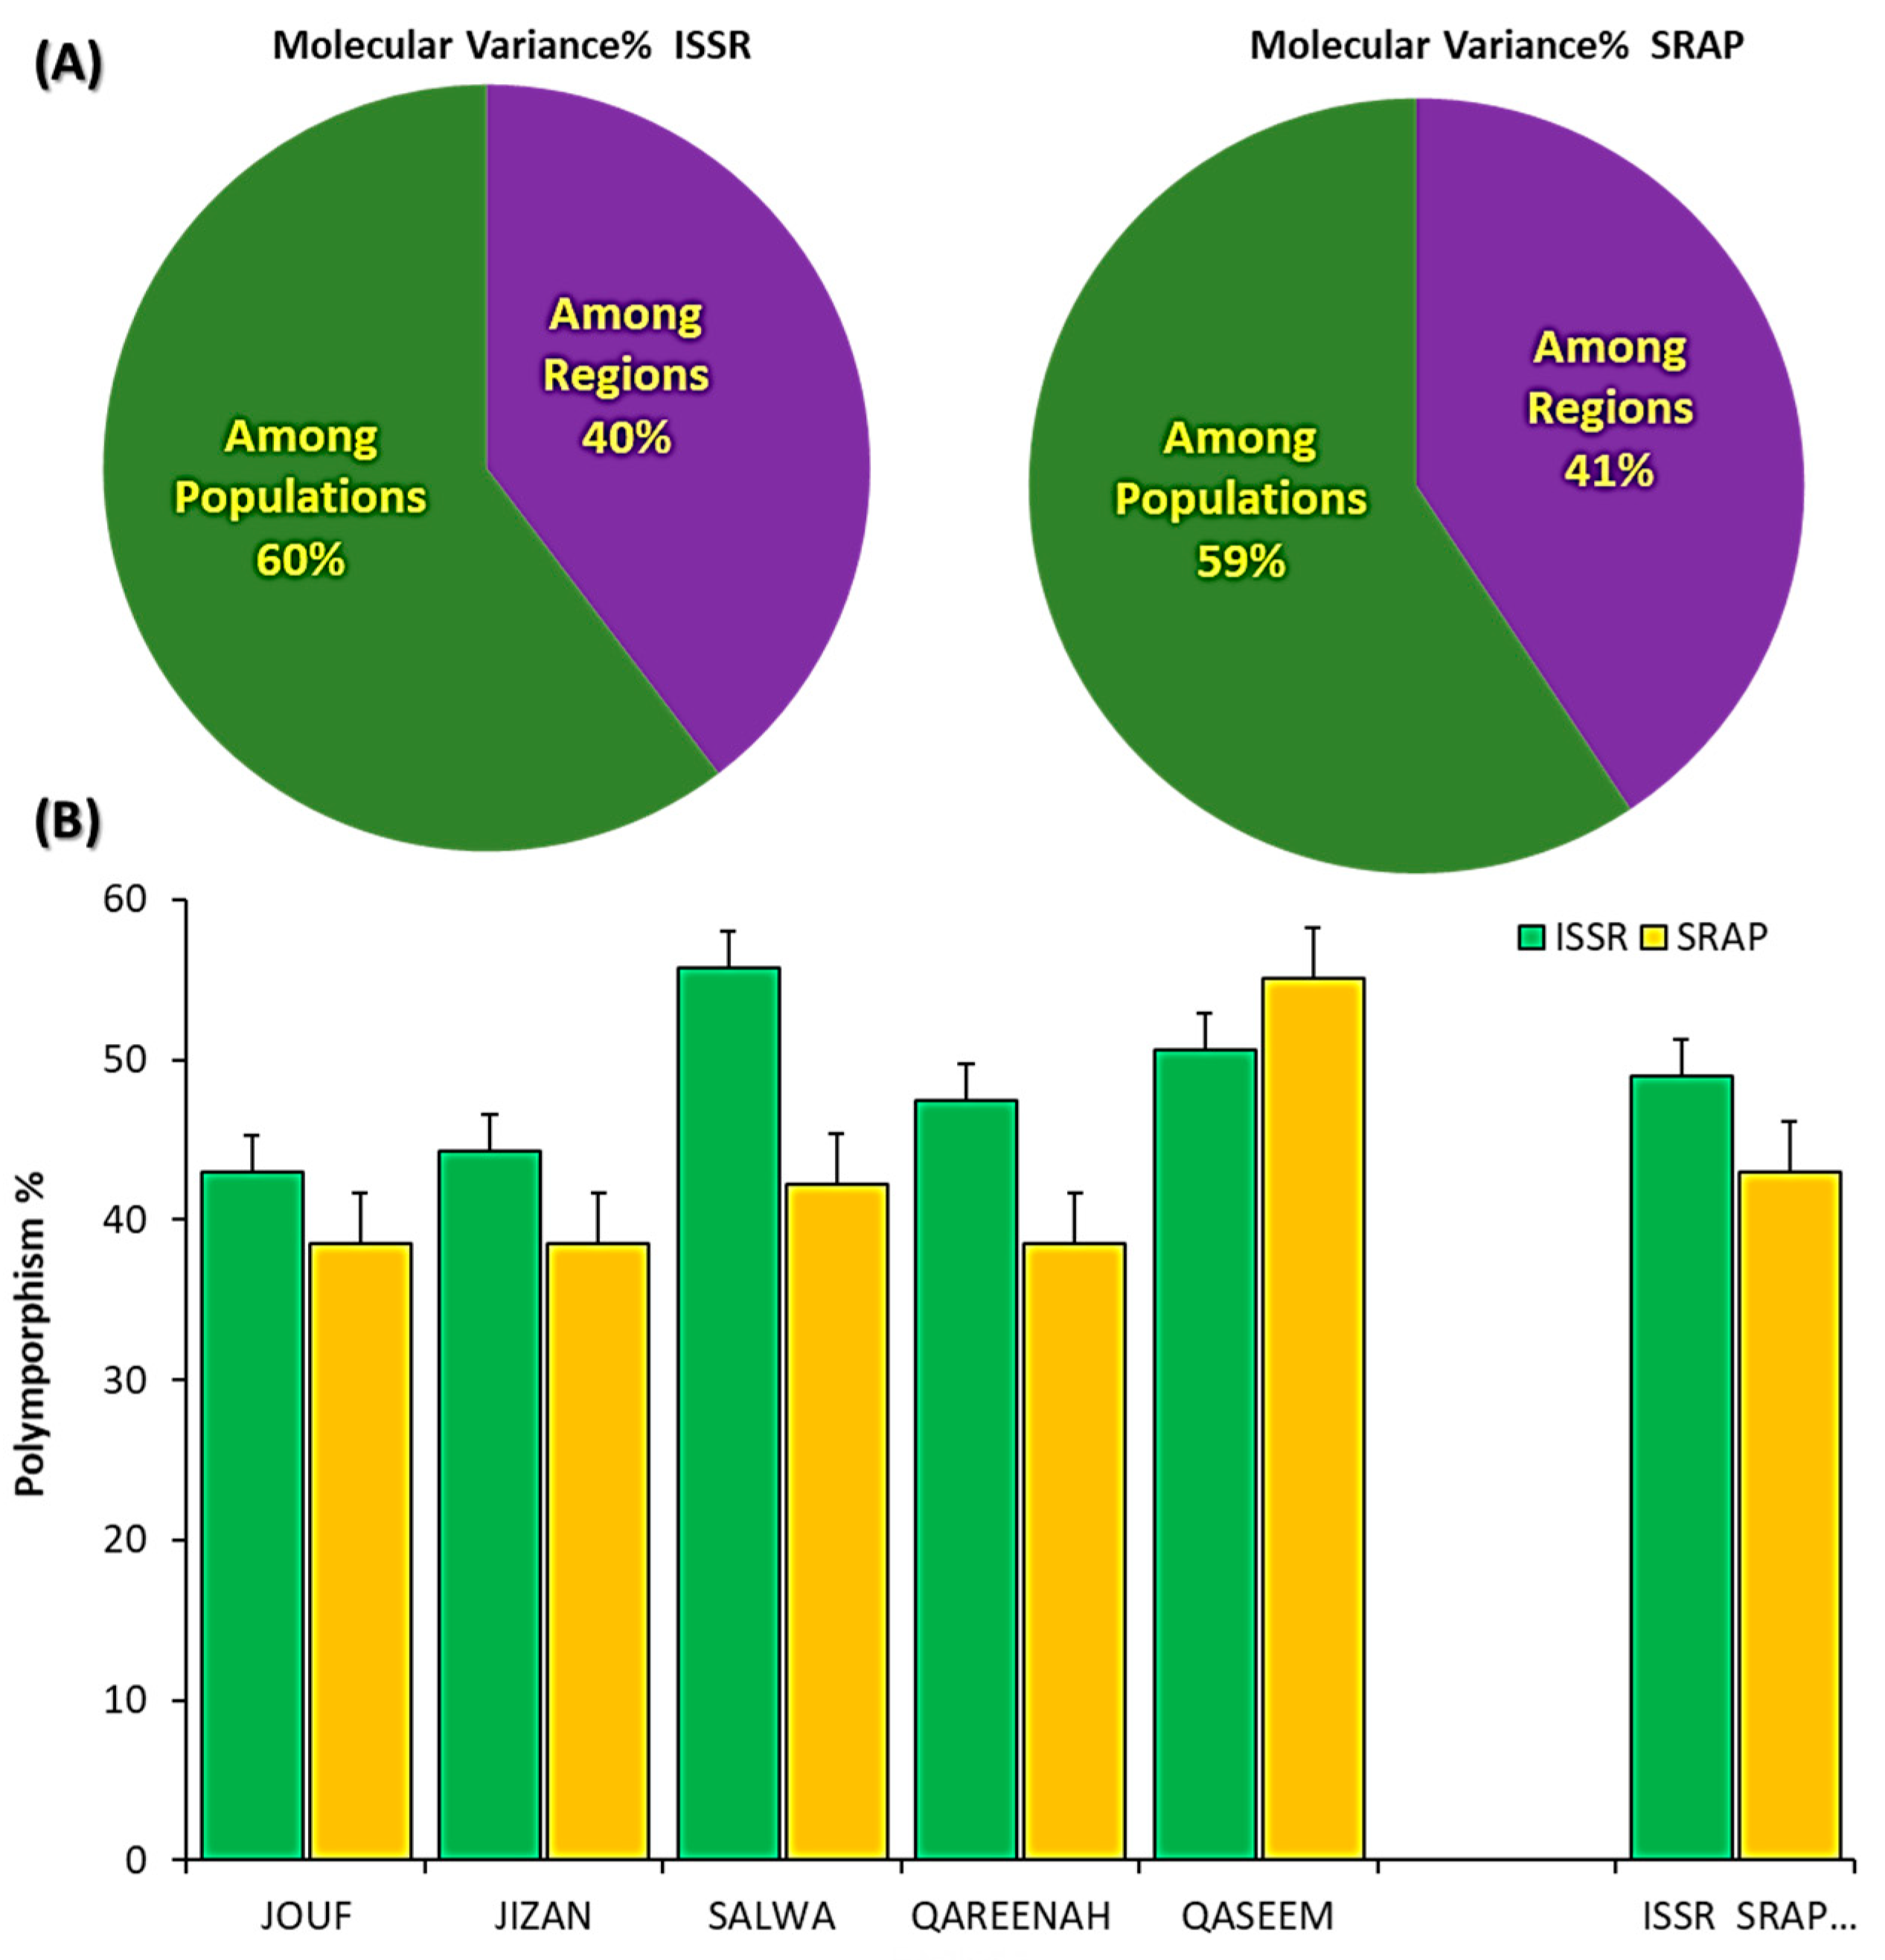
3.3. Molecular Variance and Polymorphism within and among A. lagopoides Population Based on 14 ISSR and 15 SRAP Markers

The pairwise genetic distance calculated using ISSR markers between the A. lagopoides populations collected from different regions ranged from 0.164 to 0.375 (Figure 2A). The highest genetic distance was estimated between the A. lagopoides populations of the Jouf and Qaseem regions (0.375), while the lowest was between the Qareenah and Qaseem regions (0.164). For the accession/sample level, the highest genetic distance was estimated between samples of Jouf 3/Qaseem 2, Jouf 4/Qaseem 2/Jizan 5, and Qaseem 4, while the lowest was between Salwa 1/Salwa 2 (Table S1).
Similarly, the genetic distance calculated using SRAP primers between the A. lagopoides populations collected from different geographical regions ranged from 0.129 to 0.370 (Figure 2B). The highest genetic distance value was estimated between the populations of A. lagopoides of the Jizan and Qaseem regions (0.370), while the lowest one was between Qareenah/Qaseem populations (0.129). For the accession/sample level, the highest genetic distance was estimated between samples of Jizan1/Qareenah 1 and Jizan 1/Qaseem 3, while the lowest was between Salwa 1/Salwa 2 (Table S1).

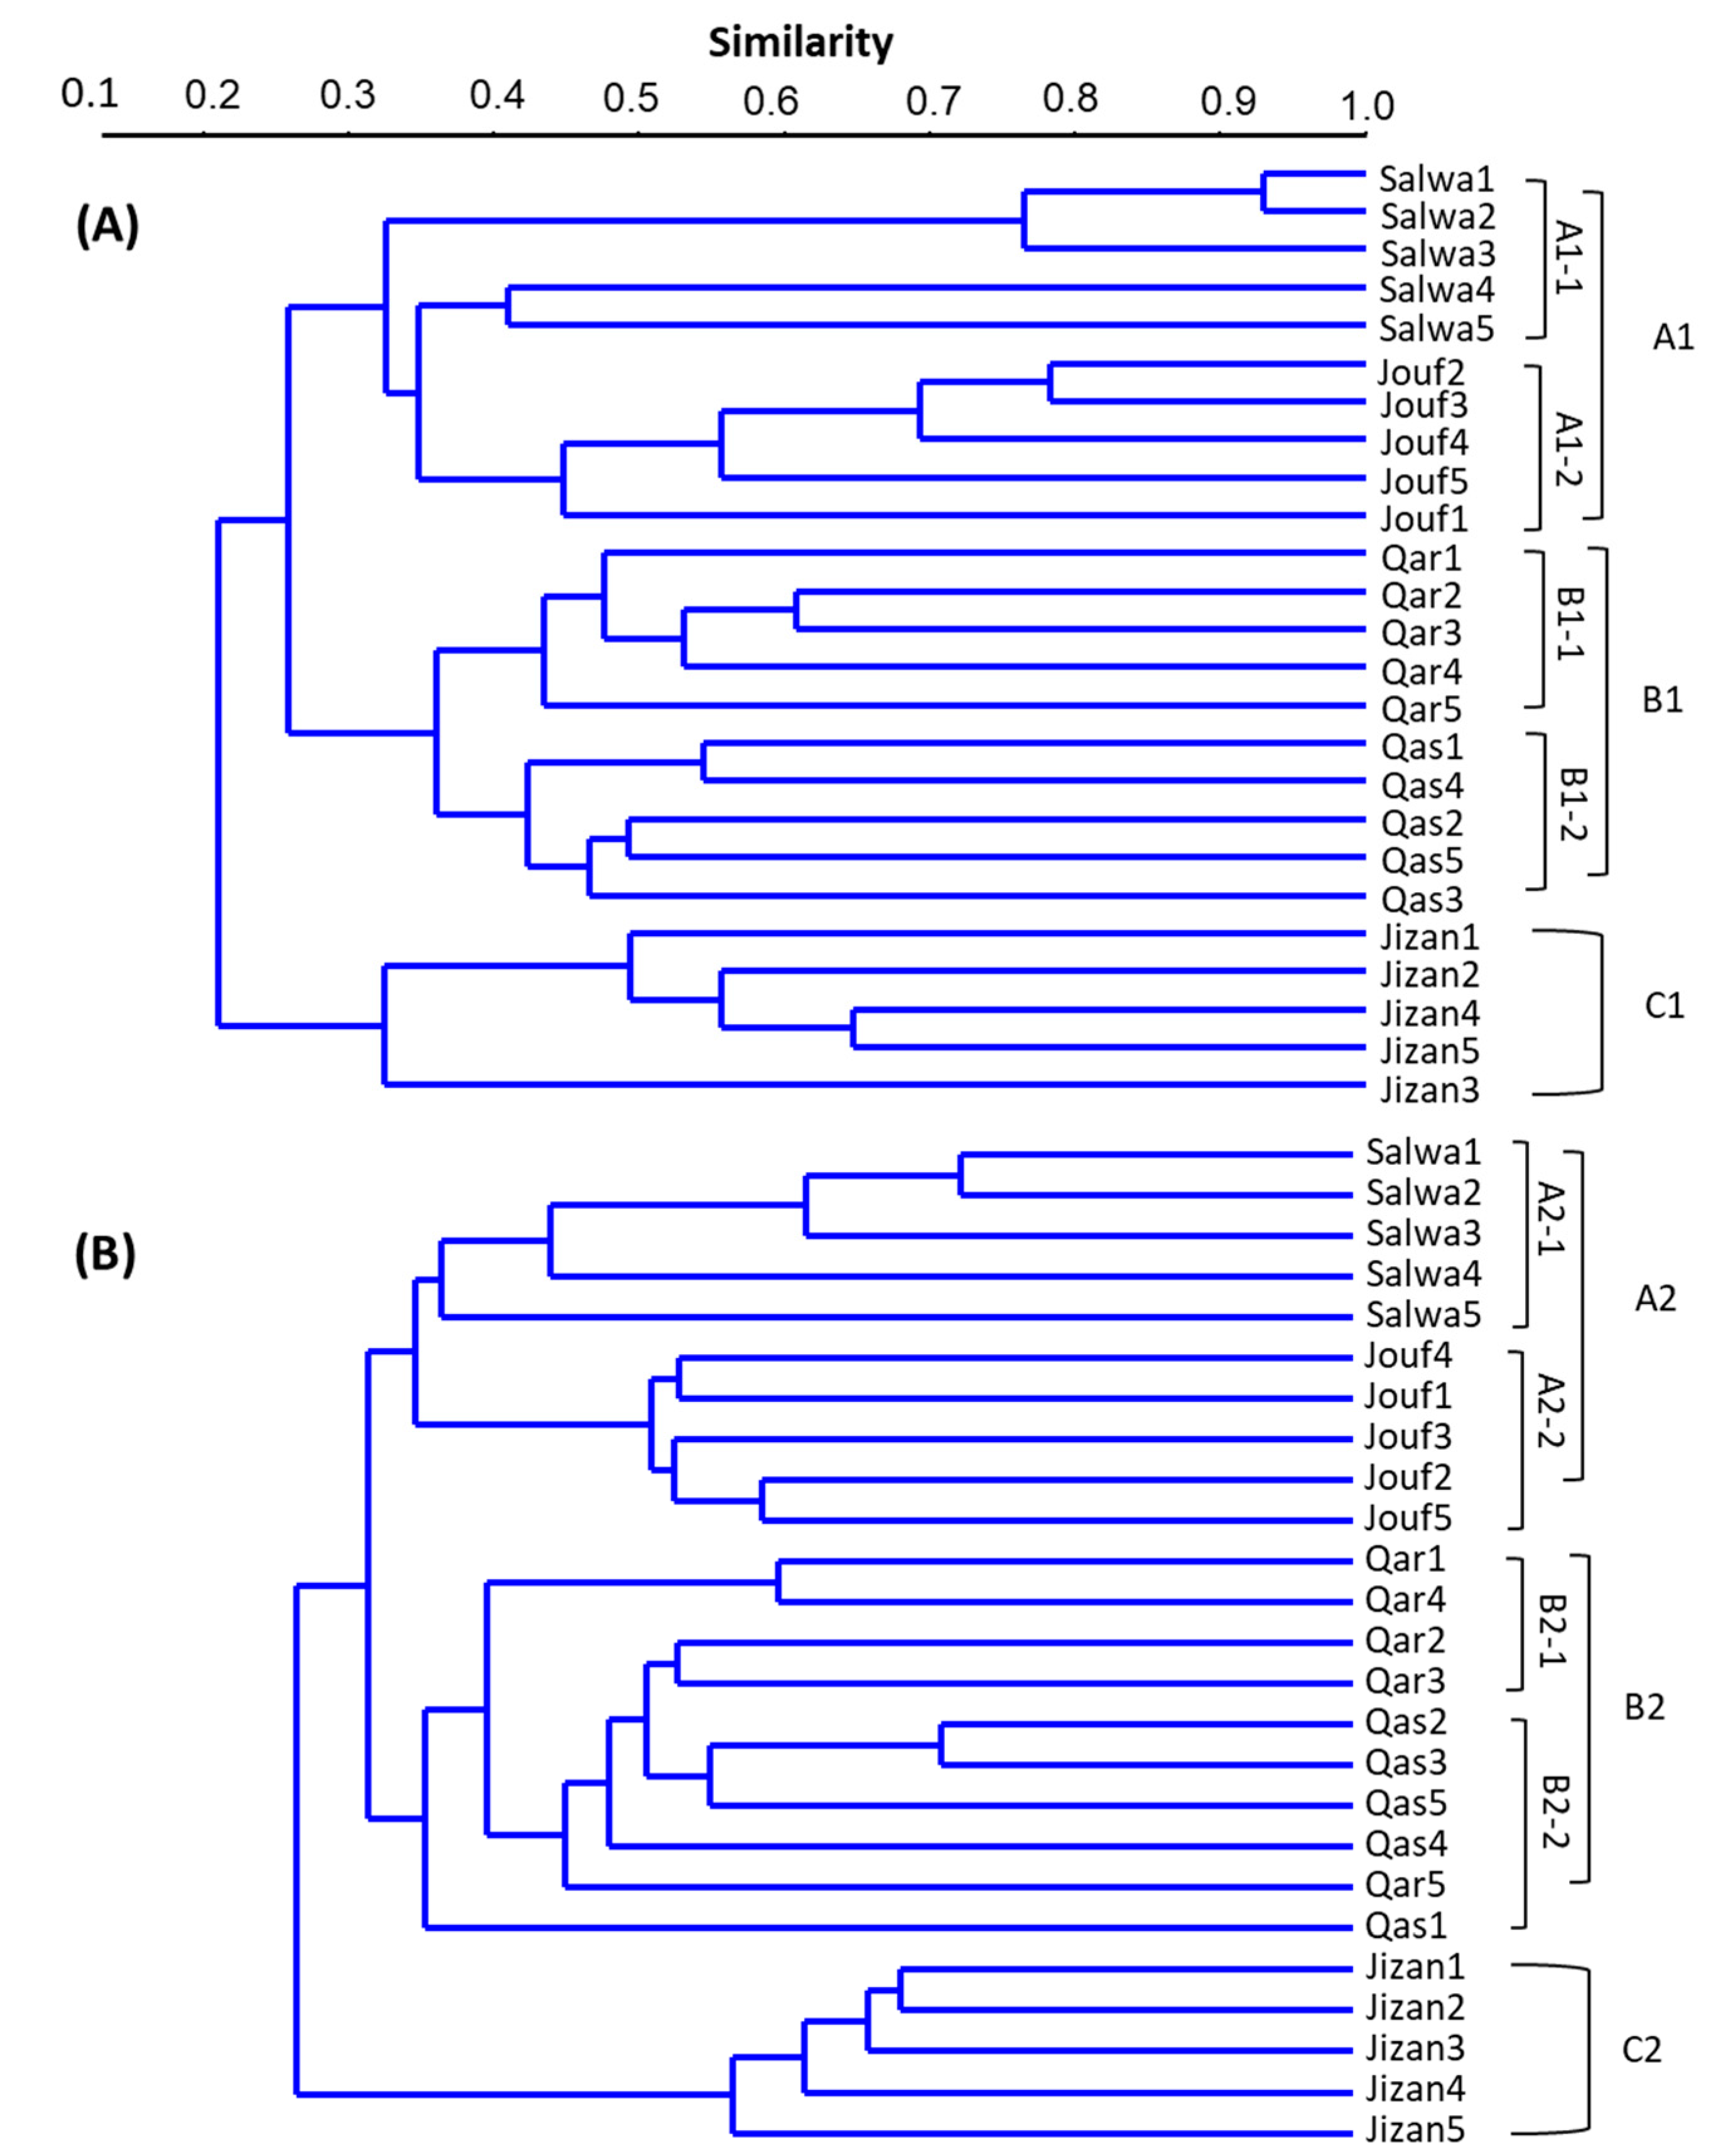
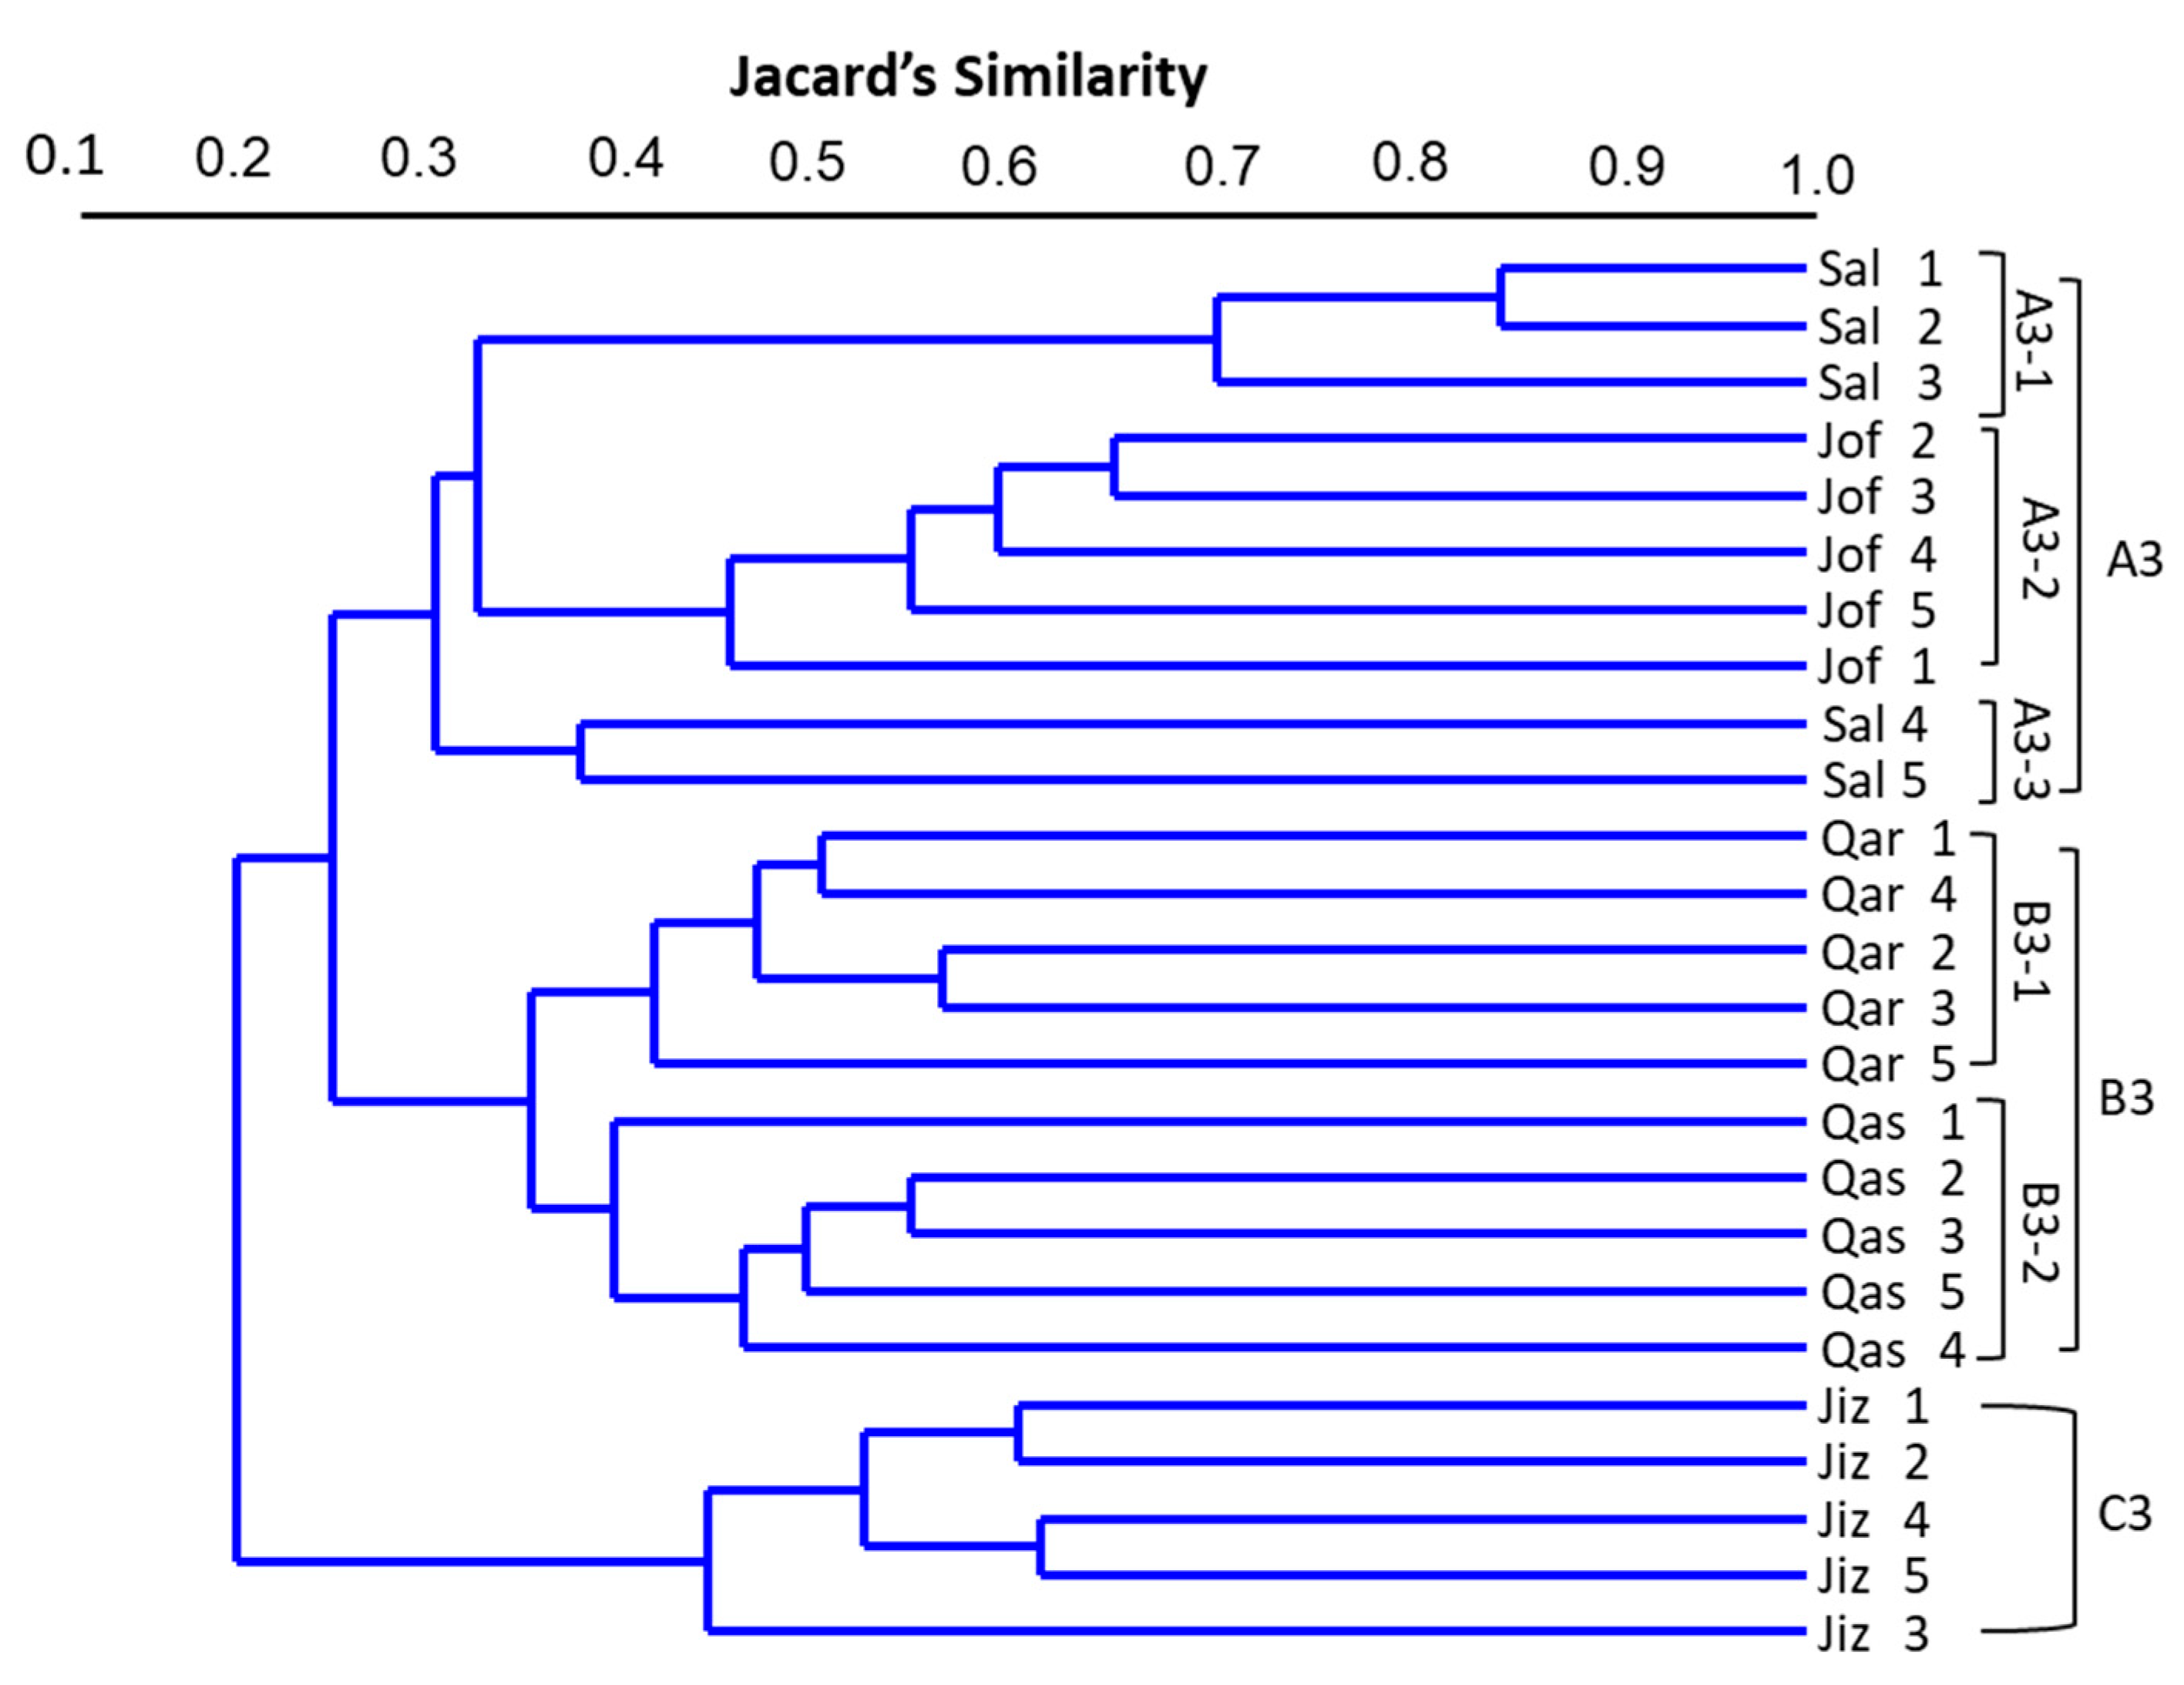
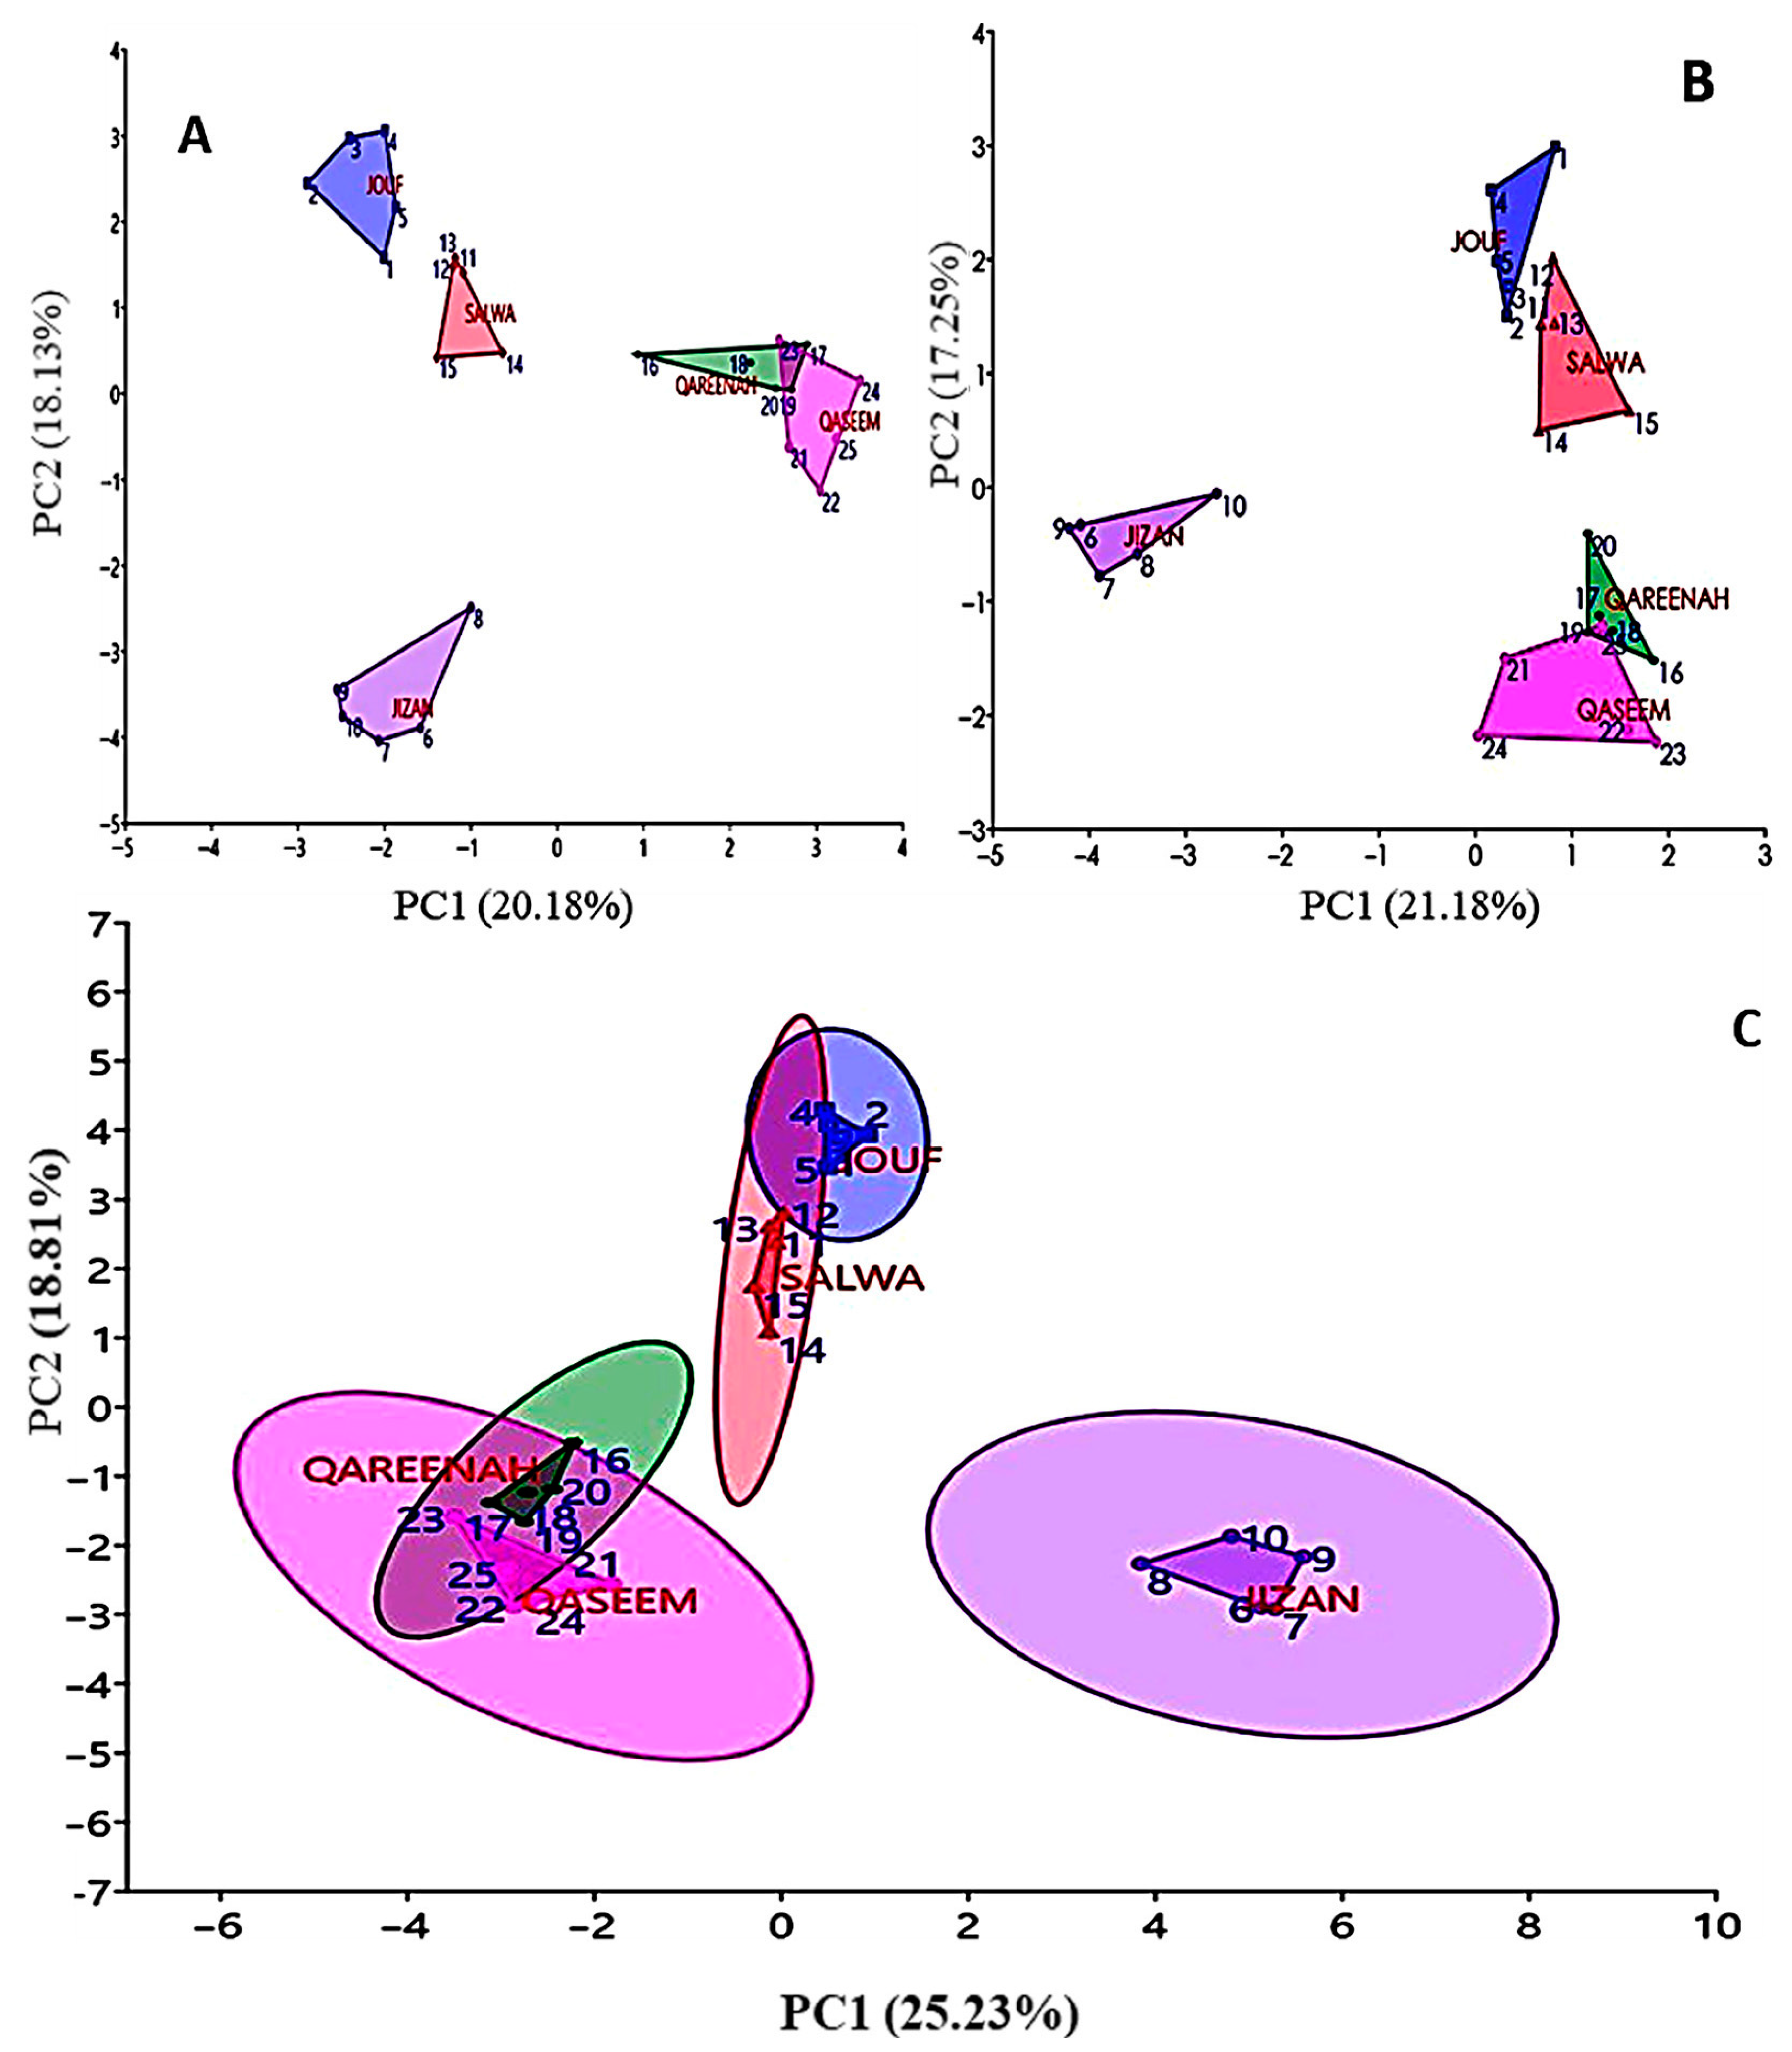
3.4. Cluster Analysis

A dendrogram using a UPGMA analysis based on Jaccard’s similarity index for ISSR markers of A. lagopoides populations collected from different geographical regions of Saudi Arabia is shown in Figure 3A.
The A. lagopoides populations were clustered into three groups corresponding to their geographic locations (Group A1, B1, and C1). Group A1 consisted of all of the A. lagopoides populations of the coastal sabkha of Salwa and inland sabkha of Jouf regions, distributed in the eastern and northern regions of Saudi Arabia. Two sub-groups, A1-1 (Salwa 1, 2, 3, 4. and 5) and A1-2 (Jouf 1, 2, 3, 4, and 5 accessions) were identified within Group A1. Group B1 consisted of A. lagopoides populations of Qareenah and Qaseem regions which are distributed along inland sabkhas of the Qareenah and Qaseem (central) regions of Saudi Arabia. Group B1 was further split into two sub-groups, B1-1 and B1-2. The populations of Qar1 to Qar5 were identified within sub-group B1-1, while Qas1 to Qas5 were within sub-group B1-2. Group C consisted of A. lagopoides populations of Jizan (Jiz 1 to Jiz5), which is uniquely separated from the rest of other groups, distributed in coastal Sabkha of the southern region of Saudi Arabia.
The dendrogram generated using a cluster analysis based on SRAP data divided the populations of A. lagopoides into three main groups (A2, B2, and C2) (Figure 3B). Group A2 consisted of Salwa (Sal1 to Sal5) and Jouf populations (Jof1 to Jof5). Group B2 consists of Qareenah and Qaseem populations, while Group C2 identified the population of the Jizan region. However, sub-groups A2-1 and A2-2 were formed within Group B2. Sub-group A2-1 consisted of Sal1, Sal2, Sal3, Sal4, and Sal5 populations, while Jof4, Jof1, Jof3, Jof2, and Jof5 fell into the A2-2 sub-group. Similarly, Group B2 was further divided into two sub-groups (Group B2-1 and B2-2). Sub-group B2-1 consisted of populations Qar1, Qar4, Qar2, and Qar3, while sub-group B2-2 consisted of Qas2, Qas3, Qas5, Qas4, Qar1, and Qas1 populations. Group C2 consisted of all of the populations of Jizan (Jiz1, Jiz2, Jiz3, Jiz4, and Jiz5).
The relationship between the populations of A. lagopoides from different geographical regions was revealed through UPGMA and NJ-based genetic distance (GD) using combined SRAP and ISSR data (Figure 4).
Both UPGMA cluster analysis and NJ-based genetic distance divided the 25 A. lagopoides populations into three major groups. The generated dendrogram was consistent with that of ISSR data except for sub-dividing Group A3 into three sub-groups (A3-1, A3-2, and A3-3), wherein sub-group A3-1 consisted of three populations of Salwa (Sal1, Sal2, and Sal3), sub-group A3-2 consisted of all the populations of Jouf Region (Jof1, Jof2, Jof3, Jof4, and Jof5), and sub-group A3-3 consisted of two populations of the Salwa region (Sal4 and Sal5), respectively.
A principal coordinate analysis (PCoA) was used to construct a 2D eigenvector scale using the PAST 3 software to confirm the findings collected by the cluster analysis (Figure 5). According to the PCoA of ISSR and SRAP data alone, the 25 populations of A. lagopoides were divided into four groups (Jizan, Qaseem and Qareenah, Jouf, and Salwa) based on geographic location/origin (Figure 5A,B). However, similar to the cluster analysis, in the PCoA based on combined ISSR and SRAP, the populations of A. lagopoides were divided into three main clusters corresponding to their geographic locations (Figure 5C). The three separate clusters of A. lagopoides populations are the Jizan region, Qaseem/Qareenah, and the Jouf/Salwa regions, respectively.

4. Discussion

In conservation genetics, genetic variability is the primary study content. It is also an outcome of a long period of development, adaptation, and biological evolution. The genetic diversity of plants varies due to their evolutionary history and ecological geography [59] and is a prerequisite for the conservation of genetic resources [60]. Various factors such as seed dispersal, successional stages, geographical distribution range, adult density, mating system, colonization history, and natural selection can influence genetic variability within and among the plant populations [61]. The use of molecular marker technology is an effective method for studying genetic diversity. Genetic variability of A. lagopiodes has been conducted using RAPD [49]. Despite being simple and convenient, RAPD marker usage is restricted due to its low stability and reproducibility. Therefore, in this work, ISSR and SRAP markers were used to study the genetic variability of A. lagopoides collected from different eco-geographical regions of Saudi Arabia.
DNA analysis using ISSR and SRAP markers has proven to be an efficient and inexpensive way to provide molecular data for genetic diversity assessment [42,62]. To our knowledge, this is the first comprehensive study to evaluate the genetic diversity of A. lagopoides populations based on inter-simple sequence repeats (ISSR) and sequence-related amplified polymorphism (SRAP) markers.
In this study, 14 ISSR and 15 SRAP primers were employed for genetic variability among populations of A. lagopoides samples collected from five different eco-geographical regions of Saudi Arabia (Jouf, Jizan, Salwa, Qareenah, and Qaseem region). The implemented primer pairs have produced clear, visible, and optimal bands for obtaining the binary matrix, as well as the genetic diversity parameters and population genetic structure. Our results showed that both the ISSR and SRAP markers effectively revealed the genetic variability among A. lagopoides populations. However, the parameters of genetic variability such as the polymorphic bands (A = 156), average polymorphism information content (PIC = 0.34), average Nei’s gene diversity (ne = 1.330), and Shannon’s information index (I = 0.281) based on ISSR markers have slightly higher values than SRAP markers (A = 109, PIC = 0.31 ne = 1.289, and I = 0.247) in different A. lagopoides populations.
The genetic diversity revealed by the combination of SRAP and ISSR markers was highly consistent in earlier studies [63,64,65]. Similar results were also reported in Amomum tsao-ko Crevost and Lemarie [66], Galega officinalis L. [60], Auricularia auricula [67], and Salvia miltiorrhiza Bge [68]. A possible explanation for these slight differences was that the ISSR markers tend to be scattered throughout the genome, which revealed the diversity of the entire genome [35], while the SRAP markers amplified functional regions of the open reading frame [42].
As in our findings, ISSR markers were more informative than the SRAP markers in the same way as in the genetic diversity assessment of the Salvia miltiorrhiza Bunge [68], Pinellia Ten. Species [69], and Dioscorea L. species [70] when using these two types of markers. However, in several other studies, SRAP proved to be more informative in assessing the genetic diversity of the Magnolia wufengensis Pamp. [71], Helianthus tuberosus L. [72], and Ocimum species [71] than the ISSR markers. These differences may be due to the fact that these two marker techniques target different portions of the genome, i.e., ISSR markers scattered throughout the genome, thus revealing the entire genome diversity, while SRAP markers amplified the target regions of the open reading frames(ORF), the functional groups only [42]. These variations may also be due to marker sampling errors or polymorphism levels, emphasizing the significance of the loci count and genome coverage for accurately estimating genetic relationships among the populations [73]. Dendrograms based on a UPGMA analysis using ISSR and SRAP data gave similar results. The Mantel test correlation revealed a strong correlation between genetic distance and geographical distance between combined analyses (r = 0.69), similar to ISSR analyses (0.73) and slightly lower than SRAP (0.80), indicating highly reliable results from the combined analysis. Similar results were reported in a study of Codonopsis tangshen (Oliv.) D.Y. Hong [74]. Our findings revealed that both SRAP and ISSR markers were effective and reliable, as well as accurately assessed, and revealed the genetic variability of A. lagopoides.
Aeluropus lagopoides is predominantly a rhizomatous perennial grass that produces numerous seeds but maintains a transient seed bank. Vegetative propagation has been considered a short-term survival strategy. For a long-term strategy to maintain fitness, numerous viable seeds may, from time to time, colonize the nearest open spaces (formed due to human disturbance of frequent cutting and grazing) during years of higher-than-average precipitation [12]. The results of molecular variance showed the genetic variability of A. lagopoides was higher (>50) within the studied populations but varied with regions (Qaseem and Salwa 55% and Jouf 38%). A similar higher genetic diversity was also reported within Phragmites australis (Cav.) Steud. [75] and Aeluropus littoralis (Gouan) Parl. Populations [31], which also propagates vegetatively in marshy conditions. Among the five eco-geographical regions, Salwa and Qaseem populations had higher genetic diversity based on the ISSR marker analysis. For Salwa, PPB = 56% and ne = 1.380, followed by Qaseem, with PPB = 51% and ne = 1.361. At the same time, SRAP markers showed lower values.
A higher genetic diversity was found in the Qaseem region (PPB = 51% and ne = 1.379), followed by Salwa (PPB = 42% and ne = 1.261). The maximum genetic diversity found in the Qaseem region may be due to high soil fertility due to diverse vegetation, profuse seed production of A. lagopoides, out-crossing through wind pollination, and frequent rainfall, all of which set the conditions for seed germination and establishment.
Based on our field research, it could be confirmed that individuals within populations of the Qaseem region have different morphological traits because A. lagopoides grows in a variety of distinct patches and has spikes with a good number of seeds. Similar results of higher levels of genetic diversity within the population were reported in the study of Hertia cheirifolia (L.) [76], Akebia trifoliata [77], and Glycine tabacina [78].
The low genetic variation in Jouf region may be due to soil nutrient deficiency and soil erosion, which are not conducive to seed germination/establishment. Populations in the Jouf region may be less diverse because they are geographically or ecologically isolated from those in the Central and Eastern regions due to the presence of several wadis, such as Wadi Arar, Wadi Aba al-Qur, etc., that pass through limestone hills and could be linked to low gene flow. The AMOVA for both ISSR and SRAP revealed that the genetic variation within the population was 60%, indicating higher genetic variability within the region, while 40% genetic variation among the population indicates a weak population structure along the regions.
The dendrograms based on Jaccard’s similarity coefficient were constructed on the ISSR and SRAP datasets to analyze genetic relationships among different A. lagopoides populations, which were similar despite minor inconsistencies in the clustering of some subgroups. These results demonstrated that the 25 A. lagopoides populations were positively correlated with their geographical distribution. Most of the A. lagopoides populations originating from similar regions, such as those from Jouf, were clustered in the same group and had a high level of similarity. However, the populations from Qaseem and Qareenah regions were clustered in the same group. This can be explained by the short geographic distance between the two regions (Tables S2 and S3).
However, one of the limitations of using non-specific primers (which also includes ISSR and SRAP) and generating multilocus band patterns is the inherent nature of the studied loci being biallelic (i.e., a band is present or absent for a particular allele). Consequently, efforts to differentiate between heterozygotes (individuals with two different alleles) and homozygotes (individuals with two identical alleles) based on band intensity have not proven feasible. Thus, DNA bands are dominantly inherited markers. For the five populations studied, the obtained values of the genetic diversity parameters may have different results if the study is repeated because these parameters are sensitive to the number of individuals from each population as well as to the number of marker combinations used. The percentage of polymorphic loci may vary as more individuals are considered or more marker combinations are used, and the error value will be lower. Further research is needed to explore the standard population genetics models to evaluate the among- and within-population diversity by utilizing more marker combinations or advanced-marker molecular markers like SSR SNIPs and validate our findings.

5. Conclusions

It can be concluded that the present study showed a high percentage of polymorphism revealed using ISSR and SRAP markers and elegantly showed high genetic diversity among the A. lagopoides populations from different regions. The cluster analysis demonstrated that the accessions’ grouping was well correlated with their geographic region of origin. Most of the populations from the central regions of Saudi Arabia (Qareenah and Qaseem) were classified as one cluster. Most of the other regions were classified as distinct clusters, except for Salwa (eastern region), which was close to the northern region of Jouf. This evaluation of genetic diversity is an important step toward the characterization of A. lagopoides and helps restore and conserve its diversity in saline regions of deserts in their rehabilitation plans.

Supplementary Materials

The following supporting information can be downloaded at: https://www.mdpi.com/article/10.3390/d16010059/s1, Figure S1: Map of different A. lagopoides sampled locations of Saudi Arabia; Table S1: Pairwise comparison of population based on geographical distance and Nei’s genetic distance; Table S2: Sample-wise genetic distance of A. lagopoides population collected from different regions using ISSR Markers; Table S3: Sample-wise genetic distance of A. lagopoides population collected from different regions using SRAP markers.

Author Contributions

Conceptualization, B.A.D., A.M.A. and A.A.A.-D.; validation, A.M.A.-E., B.A.D., A.A.A.-D. and A.M.A.; formal analysis, B.A.D., A.M.A.-E., M.M.J., A.A.A.-D. and A.M.A.; investigation, B.A.D., A.M.A., A.M.A.-E., A.A.A.-D., A.I.G., S.L.A.-R. and M.M.J.; writing—original draft preparation, B.A.D., A.M.A.-E. and A.M.A.; writing—review and editing, B.A.D., A.A.A.-D., A.M.A., M.M.J., A.I.G., S.L.A.-R. and A.M.A.-E.; visualization, A.M.A.-E. and B.A.D. All authors have read and agreed to the published version of the manuscript.

Funding

The research was supported by the King Saud University via the Researchers Supporting Project number RSPD2024R676.

Institutional Review Board Statement

Not applicable.

Data Availability Statement

Data are contained within the article and Supplementary Materials.

Acknowledgments

The authors extend their appreciation to the Researchers Supporting Project number (RSPD2024R676) King Saud University, Riyadh, Saudi Arabia.

Conflicts of Interest

The authors declare no conflicts of interest.

References

  1. Dudal, R.; Purnell, M. Land resources: Salt affected soils. Reclam. Reveg. Res. 1986, 5, 1–9. [Google Scholar]
  2. Assaeed, A.M.; Dar, B.A.; Al-Doss, A.A.; Al-Rowaily, S.L.; Malik, J.A.; Abd-ElGawad, A.M. Phenotypic plasticity strategy of Aeluropus lagopoides grass in response to heterogenous saline habitats. Biology 2023, 12, 553. [Google Scholar] [CrossRef] [PubMed]
  3. Phondani, P.C.; Bhatt, A.; Elsarrag, E.; Alhorr, Y.M.; El-Keblawy, A. Criteria and indicator approach of global sustainability assessment system for sustainable landscaping using native plants in Qatar. Ecol. Indic. 2016, 69, 381–389. [Google Scholar] [CrossRef]
  4. Lokhande, V.H.; Suprasanna, P. Prospects of halophytes in understanding and managing abiotic stress tolerance. In Environmental Adaptations and Stress Tolerance of Plants in the Era of Climate Change; Ahmad, P., Prasad, M.N.V., Eds.; Springer: New York, NY, USA, 2012; pp. 29–56. [Google Scholar]
  5. Saleem, H.; Khurshid, U.; Sarfraz, M.; Tousif, M.I.; Alamri, A.; Anwar, S.; Alamri, A.; Ahmad, I.; Abdallah, H.H.; Mahomoodally, F.M. A comprehensive phytochemical, biological, toxicological and molecular docking evaluation of Suaeda fruticosa (L.) Forssk.: An edible halophyte medicinal plant. Food Chem. Toxicol. 2021, 154, 112348. [Google Scholar] [CrossRef] [PubMed]
  6. Cope, T. Flora of Pakistan, No. 143: Poaceae; Pakistan Agricultural Research Council: Islamabad, Pakistan; University of Karachi: Karachi, Pakistan, 1982; p. 678. [Google Scholar]
  7. Gulzar, S.; Khan, M.A.; Ungar, I.A. Salt tolerance of a coastal salt marsh grass. Commun. Soil Sci. Plant Anal. 2003, 34, 2595–2605. [Google Scholar] [CrossRef]
  8. Basahi, R.A. Plant diversity of the coastal regions of Gulf of Aqaba, Saudi Arabia. Annu. Res. Rev. Biol. 2018, 26, 1–11. [Google Scholar] [CrossRef]
  9. Dar, B.A.; Assaeed, A.M.; Al-Rowaily, S.L.; Al-Doss, A.A.; Abd-ElGawad, A.M. Vegetation composition of the halophytic grass Aeluropus lagopoides communities within coastal and inland sabkhas of Saudi Arabia. Plants 2022, 11, 666. [Google Scholar] [CrossRef] [PubMed]
  10. Torbatinezhad, N.; Maghsoodlowrad, H.; Gharahbash, A. Nutritive value of Aeluropus littoralis and Aeluropus logopoides in sheep. J. Agric. Sci. Nat. Resour. 2000, 7, 31–46. [Google Scholar]
  11. Tewari, A. A note on the value of Sporobolus coromandelianus (Trin). Kunth and Aeluropus lagopoides (Linn.) as feed and soil binder. Plant Sci. 1970, 2, 135–136. [Google Scholar]
  12. Khan, M.A.; Gulzar, S. Light, salinity, and temperature effects on the seed germination of perennial grasses. Am. J. Bot. 2003, 90, 131–134. [Google Scholar] [CrossRef] [PubMed]
  13. Mohsenzadeh, S.; Malboobi, M.; Razavi, K.; Farrahi-Aschtiani, S. Physiological and molecular responses of Aeluropus lagopoides (Poaceae) to water deficit. Environ. Exp. Bot. 2006, 56, 314–322. [Google Scholar] [CrossRef]
  14. Vincent, P. Saudi Arabia: An Environmental Overview; CRC Press: London, UK, 2008. [Google Scholar]
  15. Abd-ElGawad, A.M.; Assaeed, A.M.; Al-Rowaily, S.L.; Dar, B.M.; Malik, J.A. Moisture and salinity drive the vegetation composition of Wadi Hargan, Riyadh, Saudi Arabia. Diversity 2021, 13, 587. [Google Scholar] [CrossRef]
  16. Gulzar, S.; Khan, M.A. Seed germination of a halophytic grass Aeluropus lagopoides. Ann. Bot. 2001, 87, 319–324. [Google Scholar] [CrossRef]
  17. Matesanz, S.; Gianoli, E. Global change and the evolution of phenotypic plasticity in plants. Ann. N. Y. Acad. Sci. 2010, 2, 35–55. [Google Scholar] [CrossRef] [PubMed]
  18. Hensen, I.; Oberprieler, C. Effects of population size on genetic diversity and seed production in the rare Dictamnus albus (Rutaceae) in central Germany. Conserv. Genet. 2005, 6, 63–73. [Google Scholar] [CrossRef]
  19. Brown, A.H.D.; Weir, B.S. Measuring genetic variability in plant populations. In Developments in Plant Genetics and Breeding; Tanksley, S.D., Orton, T.J., Eds.; Elsevier: Amsterdam, The Netherlands, 1983; Volume 1, pp. 219–239. [Google Scholar]
  20. Yu, Q.; Liu, Q.; Xiong, Y.; Xiong, Y.; Dong, Z.; Yang, J.; Liu, W.; Ma, X.; Bai, S. Genetic diversity and population divergence of a rare, endemic grass (Elymus breviaristatus) in the southeastern Qinghai-Tibetan plateau. Sustainability 2019, 11, 5863. [Google Scholar] [CrossRef]
  21. Lousada, J.M.; Lovato, M.B.; Borba, E.L. High genetic divergence and low genetic variability in disjunct populations of the endemic Vellozia compacta (Velloziaceae) occurring in two edaphic environments of Brazilian campos rupestres. Braz. J. Bot. 2013, 36, 45–53. [Google Scholar] [CrossRef]
  22. Mujeeb-Kazi, A.; Munns, R.; Rasheed, A.; Ogbonnaya, F.C.; Ali, N.; Hollington, P.; Dundas, I.; Saeed, N.; Wang, R.; Rengasamy, P. Breeding strategies for structuring salinity tolerance in wheat. Adv. Agron. 2019, 155, 121–187. [Google Scholar]
  23. Quilot, B.; Kervella, J.; Génard, M.; Lescourret, F. Analysing the genetic control of peach fruit quality through an ecophysiological model combined with a QTL approach. J. Exp. Bot. 2005, 56, 3083–3092. [Google Scholar] [CrossRef]
  24. Fu, X.; Ning, G.; Gao, L.; Bao, M. Genetic diversity of Dianthus accessions as assessed using two molecular marker systems (SRAPs and ISSRs) and morphological traits. Sci. Hortic. 2008, 117, 263–270. [Google Scholar] [CrossRef]
  25. Wang, H.-Z.; Wu, Z.-X.; Lu, J.-J.; Shi, N.-N.; Zhao, Y.; Zhang, Z.-T.; Liu, J.-J. Molecular diversity and relationships among Cymbidium goeringii cultivars based on inter-simple sequence repeat (ISSR) markers. Genetica 2009, 136, 391–399. [Google Scholar] [CrossRef]
  26. Santhosh, W.; Shobha, D.; Melwyn, G. Assessment of genetic diversity in cashew germplasm using RAPD and ISSR markers. Sci. Hortic. 2009, 120, 411–417. [Google Scholar]
  27. Massa, A.; Larson, S.; Jensen, K.; Hole, D.J. AFLP variation in Bromus section Ceratochloa germplasm of Patagonia. Crop Sci. 2001, 41, 1609–1616. [Google Scholar] [CrossRef]
  28. Weising, K.; Freitag, H. Phylogeography of halophytes from European coastal and inland habitats. Zool. Anz. A J. Comp. Zool. 2007, 246, 279–292. [Google Scholar] [CrossRef]
  29. Lambracht, E.; Westberg, E.; Kadereit, J.W. Phylogeographic evidence for the postglacial colonization of the North and Baltic Sea coasts from inland glacial refugia by Triglochin maritima L. Flora 2007, 202, 79–88. [Google Scholar] [CrossRef]
  30. Assaeed, A.M.; Al-Faifi, S.A.; Migdadi, H.M.; El-Bana, M.I.; Al Qarawi, A.A.; Khan, M.A. Evaluation of genetic diversity of Panicum turgidum Forssk from Saudi Arabia. Saudi J. Biol. Sci. 2018, 25, 123–129. [Google Scholar] [CrossRef] [PubMed]
  31. Shamasbi, F.V.; Nasiri, N.; Shokri, E. Genetic diversity of Persian ecotypes of Indian walnut (Aeluropus littoralis (Gouan) Pari.) by AFLP and ISSR markers. Cytol. Genet. 2018, 52, 222–230. [Google Scholar] [CrossRef]
  32. Lin, X.C.; Ruan, X.S.; Lou, Y.F.; Guo, X.Q.; Fang, W. Genetic similarity among cultivars of Phyllostachys pubescens. Plant Syst. Evol. 2009, 277, 67–73. [Google Scholar] [CrossRef]
  33. Uysal, H.; Fu, Y.-B.; Kurt, O.; Peterson, G.W.; Diederichsen, A.; Kusters, P. Genetic diversity of cultivated flax (Linum usitatissimum L.) and its wild progenitor pale flax (Linum bienne Mill.) as revealed by ISSR markers. Genet. Resour. Crop Evol. 2010, 57, 1109–1119. [Google Scholar] [CrossRef]
  34. Williams, J.G.; Kubelik, A.R.; Livak, K.J.; Rafalski, J.A.; Tingey, S.V. DNA polymorphisms amplified by arbitrary primers are useful as genetic markers. Nucleic Acids Res. 1990, 18, 6531–6535. [Google Scholar] [CrossRef]
  35. Zietkiewicz, E.; Rafalski, A.; Labuda, D. Genome fingerprinting by simple sequence repeat (SSR)-anchored polymerase chain reaction amplification. Genomics 1994, 20, 176–183. [Google Scholar] [CrossRef] [PubMed]
  36. Wolff, K.; Zietkiewicz, E.; Hofstra, H. Identification of chrysanthemum cultivars and stability of DNA fingerprint patterns. Theor. Appl. Genet. 1995, 91, 439–447. [Google Scholar] [CrossRef]
  37. Hu, T.; Li, H.; Li, D.; Sun, J.; Fu, J. Assessing genetic diversity of perennial ryegrass (Lolium perenne L.) from four continents by intersimple sequence repeat (ISSR) markers. Afr. J. Biotechnol. 2011, 10, 19365–19374. [Google Scholar]
  38. Amin, A.K.; El-Fayoumi, H.H.; Mohamed, N.H.; Tawfik, R.S.; Allam, M.; Karam, M.A. Relationships among some regional species of the genus Lolium L. based on morphological and molecular markers. Int. J. Curr. Res. 2017, 3, 1333–1363. [Google Scholar]
  39. Tabaripour, R.; Keshavarzi, M. Interspecific Molecular Variation of Lolium L. Based on ISSR, SCoT and ITS. Iran. J. Sci. Technol. Trans. A Sci. 2021, 45, 1263–1272. [Google Scholar] [CrossRef]
  40. de Freitas, J.M.B.; Essi, L.; Tedesco, S.B. Genetic diversity and population structure of natural populations of the endangered grass Paspalum rawitscheri (Parodi) Chase ex GH Rua & Valls (Paspaleae, Poaceae). Braz. J. Bot. 2021, 44, 401–409. [Google Scholar]
  41. Al-Soqeer, A.; Al-Otayk, S.M.; Motawei, M.I. Molecular characterization of new Buffelgrass (Cenchrus ciliaris) genotypes. Plant Omics 2020, 13, 104–107. [Google Scholar] [CrossRef]
  42. Li, G.; Quiros, C.F. Sequence-related amplified polymorphism (SRAP), a new marker system based on a simple PCR reaction: Its application to mapping and gene tagging in Brassica. Theor. Appl. Genet. 2001, 103, 455–461. [Google Scholar] [CrossRef]
  43. Ai, P.-F.; Zhen, Z.-J.; Jin, Z.-Z. Genetic diversity and relationships within sweet kernel apricot and related Armeniaca species based on sequence-related amplified polymorphism markers. Biochem. Syst. Ecol. 2011, 39, 694–699. [Google Scholar] [CrossRef]
  44. Budak, H.; Shearman, R.; Parmaksiz, I.; Gaussoin, R.; Riordan, T.; Dweikat, I. Molecular characterization of buffalograss germplasm using sequence-related amplified polymorphism markers. Theor. Appl. Genet. 2004, 108, 328–334. [Google Scholar] [CrossRef]
  45. Luo, Y.; Zhang, X.; Xu, J.; Zheng, Y.; Pu, S.; Duan, Z.; Li, Z.; Liu, G.; Chen, J.; Wang, Z. Phenotypic and molecular marker analysis uncovers the genetic diversity of the grass Stenotaphrum secundatum. BMC Genet. 2020, 21, 86. [Google Scholar] [CrossRef] [PubMed]
  46. Wu, F.; Chen, J.; Wang, J.; Wang, X.; Lu, Y.; Ning, Y.; Li, Y. Intra-population genetic diversity of Buchloe dactyloides (Nutt.) Engelm (buffalograss) determined using morphological traits and sequence-related amplified polymorphism markers. 3 Biotech 2019, 9, 97. [Google Scholar] [CrossRef]
  47. Zeng, B.; Zhang, X.-Q.; Lan, Y.; Yang, W.-Y. Evaluation of genetic diversity and relationshipsin orchardgrass (Dactylis glomerata L.) germplasm based on SRAP markers. Can. J. Plant Sci. 2008, 88, 53–60. [Google Scholar] [CrossRef]
  48. Zheng, Y.; Xu, S.; Liu, J.; Zhao, Y.; Liu, J. Genetic diversity and population structure of Chinese natural bermudagrass [Cynodon dactylon (L.) Pers.] germplasm based on SRAP markers. PLoS ONE 2017, 12, e0177508. [Google Scholar] [CrossRef] [PubMed]
  49. Ahmed, M.Z.; Gilani, S.A.; Kikuchi, A.; Gulzar, S.; Khan, M.A.; Watanabe, K.N. Population diversity of Aeluropus lagopoides: A potential cash crop for saline land. Pak. J. Bot. 2011, 43, 595–605. [Google Scholar]
  50. Waghmode, A.; Hegde, B. Effect of sodium chloride on pyruvate orthophosphate dikinase of a saline grass Aeluropus lagopoides (Linn.) Trin. ex Thw. Biovigyanam 1984, 10, 209–210. [Google Scholar]
  51. Doyle, J.J. Isolation of plant DNA from fresh tissue. Focus 1990, 12, 13–15. [Google Scholar]
  52. Patel, M.P.; Parmar, D.J.; Kalola, A.D.; Kumar, S. Morphological and molecular diversity patterns in castor germplasm accessions. Ind. Crop. Prod. 2017, 97, 316–323. [Google Scholar]
  53. Jaccard, P. Nouvelles recherches sur la distribution florale. Bull. Société Vaudoise Sci. Nat. 1908, 44, 223–270. [Google Scholar]
  54. Nei, M. Analysis of gene diversity in subdivided populations. Proc. Natl. Acad. Sci. USA 1973, 70, 3321–3323. [Google Scholar] [CrossRef]
  55. Shannon, C.E.; Weaver, W. The Mathematical Theory of Com-Munication; University of Illinois Press: Urbana, IL, USA, 1949; Volume 96. [Google Scholar]
  56. Peakall, R.; Smouse, P.E. GENALEX 6: Genetic analysis in Excel. Population genetic software for teaching and research. Mol. Ecol. Notes 2006, 6, 288–295. [Google Scholar] [CrossRef]
  57. Mantel, N. The detection of disease clustering and a generalized regression approach. Cancer Res. 1967, 27, 209–220. [Google Scholar]
  58. Nguyen, H.T.; Wu, X. Molecular Marker Systems for Genetic Mapping. In The Handbook of Plant Genome Mapping; Meksem, K., Kahl, G., Eds.; WILEY-VCH Verlag GmbH & Co. KGaA: Weinheim, Germany, 2005; pp. 23–52. [Google Scholar]
  59. Hamrick, J.L.; Godt, M.W. Effects of life history traits on genetic diversity in plant species. Philos. Trans. R. Soc. Lond. Ser. B Biol. Sci. 1996, 351, 1291–1298. [Google Scholar]
  60. Wang, Z.; Wang, J.-E.; Wang, X.-M.; Gao, H.-W.; Dzyubenko, N.I.; Chapurin, V.F. Assessment of genetic diversity in Galega officinalis L. using ISSR and SRAP markers. Genet. Resour. Crop Evol. 2012, 59, 865–873. [Google Scholar] [CrossRef]
  61. Nybom, H. Comparison of different nuclear DNA markers for estimating intraspecific genetic diversity in plants. Mol. Ecol. 2004, 13, 1143–1155. [Google Scholar] [CrossRef]
  62. Li, A.; Ge, S. Genetic variation and clonal diversity of Psammochloa villosa (Poaceae) detected by ISSR markers. Ann. Bot. 2001, 87, 585–590. [Google Scholar] [CrossRef]
  63. Wu, Y.-G.; Guo, Q.-S.; He, J.-C.; Lin, Y.-F.; Luo, L.-J.; Liu, G.-D. Genetic diversity analysis among and within populations of Pogostemon cablin from China with ISSR and SRAP markers. Biochem. Syst. Ecol. 2010, 38, 63–72. [Google Scholar] [CrossRef]
  64. Peng, X.; Ji, Q.; Fan, S.; Zhang, Y.; Zhang, J. Genetic diversity in populations of the endangered medicinal plant Tetrastigma hemsleyanum revealed by ISSR and SRAP markers: Implications for conservation. Genet. Resour. Crop Evol. 2015, 62, 1069–1078. [Google Scholar] [CrossRef]
  65. Yan, W.; Li, J.; Zheng, D.; Friedman, C.; Wang, H. Analysis of genetic population structure and diversity in Mallotus oblongifolius using ISSR and SRAP markers. PeerJ 2019, 7, e7173. [Google Scholar] [CrossRef]
  66. Ma, M.; Wang, T.; Lu, B. Assessment of genetic diversity in Amomum tsao-ko Crevost & Lemarié, an important medicine food homologous crop from Southwest China using SRAP and ISSR markers. Genet. Resour. Crop. Evol. 2021, 68, 2655–2667. [Google Scholar]
  67. Tang, L.; Xiao, Y.; Li, L.; Guo, Q.; Bian, Y. Analysis of genetic diversity among Chinese Auricularia auricula cultivars using combined ISSR and SRAP markers. Curr. Microbiol. 2010, 61, 132–140. [Google Scholar] [CrossRef] [PubMed]
  68. Song, Z.; Li, X.; Wang, H.; Wang, J. Genetic diversity and population structure of Salvia miltiorrhiza Bge in China revealed by ISSR and SRAP. Genetica 2010, 138, 241–249. [Google Scholar] [CrossRef]
  69. Liu, L.; Yang, Z.; Wei, S.; Ouyang, Z.; Wu, K.; Peng, Z. ISSR and SRAP markers in the genetic relationship analysis among Pinellia in China. J. Med. Plants Res. 2012, 6, 3596–3602. [Google Scholar]
  70. Wu, Z.G.; Li, X.X.; Lin, X.C.; Jiang, W.; Tao, Z.M.; Mantri, N.; Fan, C.Y.; Bao, X.Q. Genetic diversity analysis of yams (Dioscorea spp.) cultivated in China using ISSR and SRAP markers. Genet. Resour. Crop Evol. 2014, 61, 639–650. [Google Scholar] [CrossRef]
  71. Chen, S.-Y.; Dai, T.-X.; Chang, Y.-T.; Wang, S.-S.; Ou, S.-L.; Chuang, W.-L.; Chuang, C.-Y.; Lin, Y.-H.; Lin, Y.-Y.; Ku, H.-M. Genetic diversity among ‘Ocimum’ species based on ISSR, RAPD and SRAP markers. Aust. J. Crop Sci. 2013, 7, 1463–1471. [Google Scholar]
  72. Wangsomnuk, P.P.; Khampa, S.; Jogloy, S.; Srivong, T.; Patanothai, A.; Fu, Y.-B. Assessing genetic structure and relatedness of jerusalem artichoke (Helianthus tuberosus L.) germplasm with RAPD, ISSR and SRAP markers. Am. J. Plant Sci. 2011, 2, 753–764. [Google Scholar] [CrossRef]
  73. Loarce, Y.; Gallego, R.; Ferrer, E. A comparative analysis of the genetic relationships between rye cultivars using RFLP and RAPD markers. Euphytica 1996, 88, 107–115. [Google Scholar] [CrossRef]
  74. Chen, D.; Peng, R.; Li, L.; Sun, N.; Zhong, G.; Cai, Y. Study on genetic diversity of Codonopsis tangshen by SRAP and ISSR markers. Zhongguo Zhong Yao Za Zhi 2009, 34, 255–259. [Google Scholar]
  75. Lambertini, C.; Gustafsson, M.H.; Frydenberg, J.; Speranza, M.; Brix, H. Genetic diversity patterns in Phragmites australis at the population, regional and continental scales. Aquat. Bot. 2008, 88, 160–170. [Google Scholar] [CrossRef]
  76. Rahali, N.; Yangui, I.; Boussaid, M.; Messaoud, C. Assessment of genetic diversity and population structure of the endemic Hertia cheirifolia (L.) Kuntze based on ISSR and SRAP molecular markers. Biologia 2022, 77, 3429–3439. [Google Scholar] [CrossRef]
  77. Zhang, Z.; Yang, Q.; Niu, Y.; Zhang, Y.; Dong, S.; Zhang, W.; Wang, Z. Diversity analysis and establishment of core collection among Akebia trifoliata (Thunb.) Koidz. in Qinba mountain area of China using ISSR and SRAP markers. Genet. Resour. Crop Evol. 2021, 68, 1085–1102. [Google Scholar] [CrossRef]
  78. Wang, X.-D.; Li, X.-H.; Zhang, Z.-W.; Wang, K.-J. Genetic diversity and genetic structure of natural populations in an extremely narrowly distributed perennial species Glycine tabacina (Labill.) Benth. on the southeast islands in China. Genet. Resour. Crop Evol. 2019, 66, 989–1008. [Google Scholar] [CrossRef]
Figure 1. Molecular variance (A) and polymorphism percentage (B) based on 14 ISSR and 15 SRAP markers both within and among the populations of A. lagopoides collected from different eco-geographical regions of Saudi Arabia (within region d.f. = 4, among population d.f. = 24). ISSR: inter-simple sequence repeat; and SRAP: sequence-related amplified polymorphism.
Diversity 16 00059 g001
Figure 2. Pairwise comparison of A. lagopoides populations Nei’s distance and identity matrix using ISSR (A) and SRAP (B) markers. Qar: Qareenah; Qas: Qaseem; Jiz: Jizan; Jof: Jouf; and Sal: Salwa.
Diversity 16 00059 g002
Figure 3. UPGMA cluster for 25 populations of A. lagopoides growing in different geographical regions of Saudi Arabia based on (A) inter-simple sequence repeat (ISSR) and (B) sequence-related amplified polymorphism (SRAP) marker data. Qar: Qareenah; and Qas: Qaseem.
Diversity 16 00059 g003
Figure 4. UPGMA cluster for 25 populations of A. lagopoides growing in different eco-geographical region-combined sequence-related amplified polymorphism (SRAP) and inter-simple sequence repeat (ISSR) marker data. Qar: Qareenah; Qas: Qaseem; Jiz: Jizan; Jof: Jouf; and Sal: Salwa.
Diversity 16 00059 g004
Figure 5. Principal coordinates analysis (PCoA) for 25 populations of A. lagopoides growing in different geographical regions from the binary data obtained by using (A) sequence-related amplified polymorphism (SRAP), (B) inter-simple sequence repeat (ISSR), and (C) a combination of both SRAP and ISSR data markers. PC: principal component.
Diversity 16 00059 g005
Table 1. Location and salinity levels of the different regions of the sampled A. lagopoides populations in Saudi Arabia.
RegionLocationPopulationCoordinatesElevationm a.s.lEC (dS.m−1)
NE
JoufInland sabkha in Domat AljandalJouf129°49.200039°58.3935659.39 ± 1.432 *
Jouf229°49.270039°58.457563
Jouf329°49.850039°58.931558
Jouf429°49.085039°58.149519
Jouf529°49.169039°57.494525
JizanCoastal sabkha on the Southern Coastal RegionJizan116°58.102042°33.8491510.69 ± 3.76
Jizan216°58.122042°33.7079
Jizan316°58.137042°33.6676
Jizan416°58.144042°34.0824
Jizan516°58.114042°34.0164
SalwaCoastal sabkha as lowland on the coast of the Arabian GulfSalwa124°45.392050°45.225−1029.59 ± 1.409
Salwa225°43.664050°08.274−9
Salwa325°43.759050°08.045−8
Salwa424°45.071050°45.348−11
Salwa525°43.664050°08.274−9
QareenahInland sabkha in wadi Hargan, Riyadh Region,Qar125°03.995046°10.79583312.37 ± 1.026
Qar225°03.975046°10.802824
Qar325°03.944046°10.824816
Qar425°03.923046°10.852812
Qar525°03.890046°10.897810
QaseemInland sabkha of the Al-Aushazia locationQas126°03.29544°08.16859024.82 ± 1.024
Qas226°03.30944°08.253654
Qas326°03.236044°08.220621
Qas426°03.770044°08.272603
Qas526°03.351044°08.144595
* values are average ± standard error; EC: electric conductivity; Qar: Qareenah; and Qas: Qaseem.
Table 2. List of inter-simple sequence repeat (ISSR) and sequence-related amplified polymorphism (SRAP) primer sequences used for genetic analysis.
ISSR Markers SRAP Markers
Primer NameSequencesAnnealing Temp.Primer NameForward (5′-3′)Primer NameReverse (5′-3′)
FBISSR6(GTT)7C54 °CSRAP9FTGAGTCCAAAACGGTAGSRAP1RGACTGCGTACGAATTAAC
FBISSR7(GTT)7A53 °CSRAP15:TGAGTCCAAACCGGTTGSRAP2RGACTGCGTACGAATTAAT
FBISSR8(GTT)7T53 °CSRAP7FTGAGTCCAAACCGGTGASRAP3RGACTGCGTACGAATTACA
FBISSR9CACACACACACACACACACAG57 °CSRAP22FTGAGTCCAAACCGGTAGSRAP4RGACTGCGTACGAAATACG
FBISSR10CACACACACACACACACACAC57 °CSRAP21FTGAGTCCAAACCGGTGCSRAP7RGACTGCGTACGAATTCAC
FBISSR11CACACACACACACACACACAA57 °CSRAP5FTGAGTCCAAACCGGTCASRAP31RGACTGCGTACGAATTTCA
FBISSR12CACACACACACACACACACAT57 °CSRAP30FTGAGTCCAAACCGGAAG
FBISSR13TGTGTGTGTGTGTGTGTGTGG57 °CSRAP19FTGAGTCCAAACCGGTGC
FBISSR15TGTGTGTGTGTGTGTGTGTGA57 °CSRAP29FTGAGTCCAAACCGGACC
FBISSR16TGTGTGTGTGTGTGTGTGGTG57 °C
ISSR15GAGAGAGAGAGAGAGAC50 °C
UBC815CTCTCTCTCTCTCTCTG50 °C
UBC816CACACACACACACACAT50 °C
UBC823TCTCTCTCTCTCTCTCC50 °C
Table 3. The amplification result of A. lagopoides population with inter-simple sequence repeat (ISSR).
Primer NameNo. of Amplified BandsNo. of Polymorphic BandsPolymorphism %Total BandsDP%PIC
FBISSR-677100204.490.15
FBISSR-777100214.490.15
FBISSR-888100765.130.40
FBISSR-9202010014212.820.35
FBISSR-1033100151.920.30
FBISSR-111313100958.330.34
FBISSR-121010100796.410.34
FBISSR-139889975.770.39
FBISSR-1512121001517.690.47
FBISSR-1611111001507.050.40
ISSR 15191910017912.180.33
UBC81513131001048.330.35
UBC81615151001149.620.37
UBC8239889785.770.38
Total156156 13211004.73
Avg/Primer11.1411.14 94.367.140.34
DP: discriminatory power; PIC: polymorphic information content.
Table 4. The amplification result of A. lagopoides population with sequence-related amplified polymorphism (SRAP).
Primer Name (F/R)Amplified Bands No.Polymorphic Bands No.Polymorphism %Total BandsDP%PIC
SRAP9F/SRAP1R1010100919.260.35
SRAP15F/SRAP2R77100466.480.27
SRAP7F/SRAP3R77100656.480.40
SRAP7F/SRAP1R66100615.560.39
SRAP22F/SRAP2R1010100839.260.38
SRAP21F/SRAP3R88100817.410.38
SRAP5F/SRAP1R76861056.480.33
SRAP30F/SRAP3R66100365.560.32
SRAP19F/SRAP4R4410063.700.15
SRAP22F/SRAP1R66100365.560.29
SRAP30F/SRAP1R99100658.330.28
SRAP5F/SRAP3R66100595.560.30
SRAP9F/SRAP31R1010100909.260.31
SRAP29F/SRAP7R66100375.560.28
SRAP9F/SRAP7R6583185.560.20
Total108108 8791004.63
Avg/Primer7.207.20100.0058.606.670.31
DP: discriminatory power; PIC: polymorphic information content.
Table 5. Analysis of molecular variance (AMOVA) within/among A. lagopoides populations using ISSR and SRAP primers.
SourcedfSSDMSDEst. Var.Total%PhiPTp Value
For SRAP
Among Regions4202.40050.6007.83641%
Within Populations20228.40011.42011.42059%
Total24430.800 19.256100%0.3970.001
For ISSR
Among Regions4323.04080.76012.38440%
Within Populations20376.80018.84018.84060%
Total24699.840 31.224100%0.4070.001
For (ISSR + SRAP)
Among Regions4525.440131.36020.22040%
Within Populations20605.20030.26030.26060%
Total241130.640 50.480100%0.4010.001
df: degrees of freedom; SSD, sum of squared deviation; MSD: mean squared deviation; Est. Var.: estimated variance; and PhiPT: population differentiation.
Table 6. Analysis of genetic diversity of A. lagopoides among populations of different geographical regions based on ISSR and SRAP markers, respectively.
Geographical RegionsNaNeIHuhPPB%
ISSRSRAPISSRSRAPISSRSRAPISSRSRAPISSRSRAPISSRSRAP
Jouf1.010 ± 0.07 *0.881 ± 0.091.27 ± 0.031.269 ± 0.030.24 ± 0.020.226 ± 0.030.16 ± 0.020.154 ± 0.020.20 ± 0.020.193 ± 0.0243.0438.53
Jizan0.968 ± 0.080.982 ± 0.091.31 ± 0.031.260 ± 0.030.26 ± 0.020.223 ± 0.030.18 ± 0.020.151 ± 0.020.22 ± 0.020.189 ± 0.0244.3038.53
Salwa1.209 ± 0.070.927 ± 0.091.380 ± 0.031.261 ± 0.030.323 ± 0.020.235 ± 0.030.220 ± 0.120.157 ± 0.020.275 ± 0.020.196 ± 0.0255.7042.20
Qareenah1.051 ± 0.080.872 ± 0.091.321 ± 0.031.277 ± 0.040.275 ± 0.020.229 ± 0.030.186 ± 0.020.157 ± 0.020.233 ± 0.020.196 ± 0.0247.4738.53
Qaseem1.082 ± 0.081.239 ± 0.091.361 ± 0.031.379 ± 0.040.300 ± 0.020.321 ± 0.030.206 ± 0.020.219 ± 0.020.257 ± 0.020.273 ± 0.0250.6355.05
Average1.065 ± 0.030.980 ± 0.041.330 ± 0.011.289 ± 0.020.281 ± 0.010.247 ± 0.010.191 ± 0.010.168 ± 0.010.238 ± 0.010.210 ± 0.0148.23 ± 2.2942.57 ± 3.20
* values are means ± standard error. Na: number of different alleles; Ne: number of effective alleles; H: Nei’s gene diversity; I: Shannon’s information index; uh = unbiased diversity; PPB: percentage of polymorphism bands. ISSR: inter-simple sequence repeat; and SRAP: sequence-related amplified polymorphism.
Disclaimer/Publisher’s Note: The statements, opinions and data contained in all publications are solely those of the individual author(s) and contributor(s) and not of MDPI and/or the editor(s). MDPI and/or the editor(s) disclaim responsibility for any injury to people or property resulting from any ideas, methods, instructions or products referred to in the content.

