Article

Plant Diversity Distribution along an Urbanization Gradient and Relationships with Environmental Factors in Urban Agglomerations of Henan Province, China

1
College of Landscape Architecture and Art, Henan Agricultural University, No. 63 Agricultural Road, Zhengzhou 450002, China
2
College of Life Sciences, Henan Agricultural University, No. 63 Agricultural Road, Zhengzhou 450002, China
*
Author to whom correspondence should be addressed.
Diversity 2024, 16(1), 53; https://doi.org/10.3390/d16010053
Submission received: 5 December 2023 / Revised: 11 January 2024 / Accepted: 12 January 2024 / Published: 15 January 2024
(This article belongs to the Special Issue Plant Diversity Hotspots in the 2020s)

Abstract

:
Urbanization induces rapid plant environmental modifications, leading to alterations in plant diversity distribution patterns and plant homogenization. However, how plant diversity is distributed along urbanization gradients in regional urban agglomerations and its relationship with environmental factors are not well defined. In three nearby Henan Province Chinese cities—Zhengzhou, Kaifeng, and Zhongmu—along an urbanization gradient, the distribution pattern of plant diversity was quantified. Both native and non-native plants found in urban green spaces were taken into consideration. A total of 176 plant quadrats were selected and separated into three urbanization gradient types using space-constrained hierarchical clustering: urban core, urban suburb, and urban outskirt. Polynomial fitting was used to characterize the spatial distribution patterns of plants along the urbanization gradient, and Pearson correlation and the Mantel test were employed to examine the effects of environmental factors, including longitude, latitude, altitude, distance from the urban center, temperature, and illumination, on plant diversity. A total of 313 vascular plant species, comprising 137 woody species and 176 herbaceous species, were examined. Along the three urbanization gradients, remarkable variations in plant diversity for woody and herbaceous species were observed. The spatial patterns of plant diversity were consistent across cities, whereas woody plants and herbaceous plants displayed the opposite behavior. Distance to the city center and temperature were the most substantial environmental effect factors for the diversity of woody plants, whereas light factors had a major impact on herbaceous plants. These findings show different life-type plants are affected differently by urbanization, and they offer managers and planners a recommendation for increasing urban plant diversity by executing various interventions throughout the urban gradient.

1. Introduction

With the rapid expansion of global cities, urbanization has had a profound impact on plants, in terms of ecological patterns and processes, seasonal cycles, and the timing of major events in reproductive and nutritional cycles [1,2]. In cities, owing to artificial planting and species selection, plant communities become more similar and plant density is lower than in natural habitat [3,4]. Additionally, because urban environmental elements such as light, temperature, precipitation, soil, and others change, plants’ growth and development are constantly impacted. Sometimes the effect of these changes on plants is noticeable, but sometimes it is insignificant [5,6,7,8,9]. Forecasting how urbanization will affect plants is challenging because these effects vary by region or even by city [10].
The gradient approach can be used to study the effects of urbanization [11]. This approach has been shown to be an effective method for estimating the level of anthropogenic disturbance in cities [12], and it has been widely used in the study of how various biota—especially plants, birds, insects, and fish—respond to urbanization [13,14,15,16,17]. According to the gradient approach, the most intense “urban” environment occurs in the city center; with distance from the center, the “urban” effect gradually weakens [18]. The gradient approach is constrained by starting from a single urban center and is therefore inapplicable to polycentric regional urban agglomerations [19]. As a result, the majority of research on the effects of urbanization on the biome is centered on a single city, making conducting a regional-scale study impossible and resulting in inconsistent findings [20]. In 2022, Guillaume Guénard and Pierre Legendre presented space-constrained hierarchical clustering, which is based on quadrat clustering and designed to be subject to spatial continuity limitations [21]. The impacts of urbanization on plants can be studied at a regional urban agglomeration scale, and more universal results can be obtained by dividing the quadrats from various cities into the same gradients within space-constrained hierarchical clustering. This approach will provide us with new insight into managing regional green spaces.
Urban planners are aware that prioritizing the distribution patterns of urban plant communities according to local conditions is crucial to increasing the diversity of urban plants [22]. Plant diversity was frequently used in earlier research on distribution patterns in urban plant communities to assess the health of the plant community, and the results varied considerably in different cities. Plant diversity may be highest in urban centers [23,24], in urban suburbs [25,26,27,28], or on the outskirts of a few cities [29,30]. The studies also found that within cities the planning and construction of urban green spaces give priority to species with ornamental value; distinct distribution patterns for woody plants and herbaceous plants exist depending on the degree of urbanization [31,32]. However, in some cities, the woody plant diversity increased while the herb diversity index dropped. In certain cities, the woody plant diversity climbed while the herb plant diversity increased with the urbanization gradient [33,34,35]. The lack of consensus is attributed to the multiple impacts of urbanization on plant ecosystems, including changes in plant growth, landscape patterns, environmental factors, and hydrological cycles [36,37,38,39]. On the other hand, people focus on the value of ornamental species and pay more attention to non-native species in urban plantations, which brings risks of biological invasion and reduces the diversity of related birds, insects, reptiles, etc. [40,41,42].
In the capitals or megacities of Asian, European, and North American nations, the effects of urbanization on biodiversity have primarily been researched [43,44]. The highest species richness was found in the central region of Japan with high levels of urbanization [45]; species diversity significantly decreased as urbanization intensity increased in Southeast Asia [46]; megacity urbanization in Africa hinders the conservation of threatened species [47]; and an Indian study also found that urbanization enhanced the seasonal dynamics of plant–pollutant interactions [48]. These large cities often have high, static levels of urbanization, but studies on smaller cities, which experience fast urbanization, are rare. This paper mainly studies the following issues: (1) What compositional differences exist among plants in urban agglomerations along the gradient of urbanization? (2) What differences in the plant diversity index exist between cities of different sizes, and how does it correspond to the gradient shift inside cities? (3) Which environmental factors influence plant diversity indices across different urbanization gradients?

2. Materials and Methods
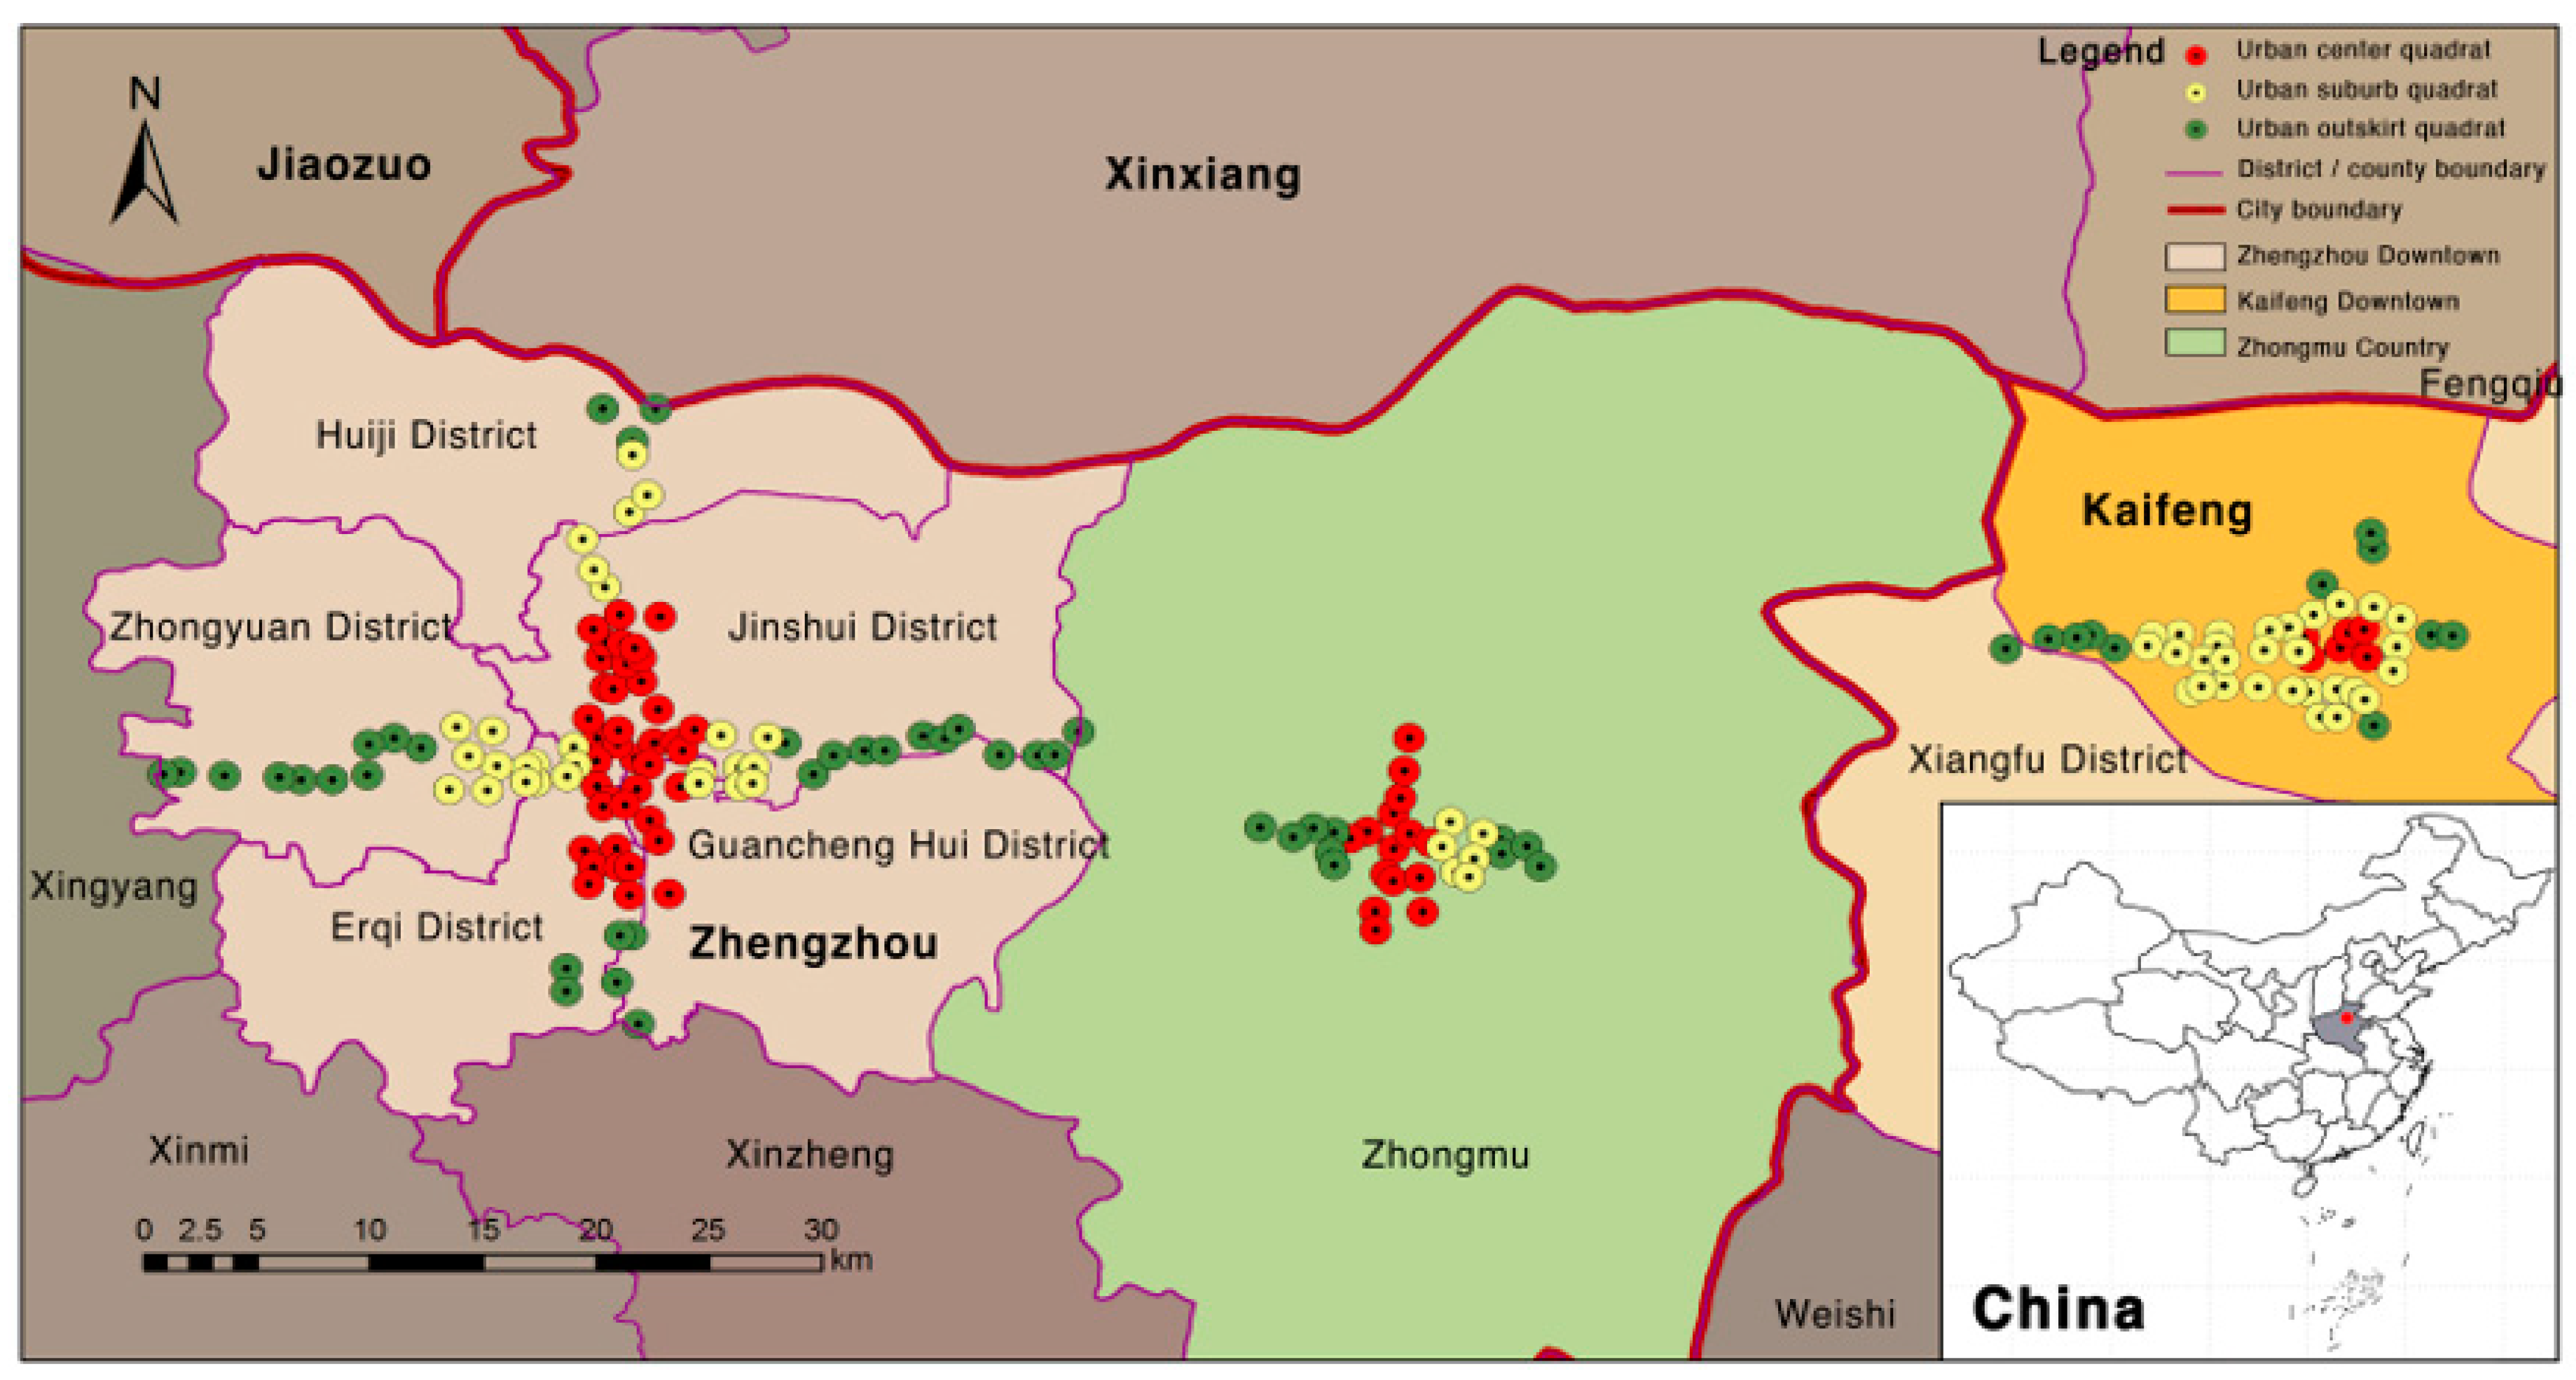
2.1. Study Area

The study is focused on Henan Province’s urban agglomeration, which has grown quickly in recent years in China’s central area. Henan is the province with the greatest population in China and is guided by multiple national policies. The urban agglomerations in Henan are excellent locations to undertake research on whether the impacts of urbanization on plant variety are constant for cities of various sizes in the same region. This work was conducted in Zhengzhou, Kaifeng, and Zhongmu County, the central urban agglomeration of Henan Province. The economy of the urban agglomerations with Zhengzhou as the center has grown quickly, and urbanization is happening more rapidly due to the policy of collaborative development of regional urban agglomerations. Zhengzhou, Kaifeng, and Zhongmu County are geographically close and have similar climates; they belong to the warm temperate continental monsoon climate. The largest difference among the three cities is size. Zhengzhou is the capital of Henan Province, has a resident population of 12.74 million, and is the only megacity with an area of 7567 km2 and an urban area of 744.15 km2. Kaifeng is a prefecture-level city in Henan Province, and it has a resident population of 4.82 million, an area of 6239 km2, and an urban area of 151 km2. Zhongmu County is a county-level city in Henan Province, under the jurisdiction of Zhengzhou, located between Zhengzhou and Kaifeng, and it has a 708 thousand resident population, a 917 km2 land area, and a 75.7 km2 urban area. Our study was focused in and around the three cities’ urban centers, which has been the area most considerably impacted by urbanization in recent years.

2.2. Sampling Design and Plant Survey

Two 3 km wide cross-sections were established along the north-south and east-west axes of each of the three urban agglomeration city centers, considering the scale of the cities. Each cross-section was divided into 1 km × 1 km grids. Based on satellite imagery from Google Maps, we selected 176 grid cells containing large green patches. Each grid cell defined one quadrat, with the requirement that the same distance grid in each direction be sampled at least once. The spatial distance to the city center and the intensity of urbanization are directly correlated; the closer to the city center one is, the higher the level of regional urbanization [29,49]. Considering differences in size among the cities, it is not practicable to classify the quadrat using a single spatial distance from the city center. Therefore, we use spatial constraints to bind the quadrat of three cities in relation to their respective city centers. All quadrats were stratified into three levels according to the results of space-constrained hierarchical clustering: the “urban center” represented the urban core with a high urbanization level and completed construction in the urban agglomeration, the “urban suburb” represented the urban expansion area with construction in the urban agglomeration, and the “urban outskirt” represented the underdeveloped areas with a low urbanization level in the urban agglomeration. Figure 1 depicts the precise quadrat distribution in each level area.
Each 1 km × 1 km grid’s largest green ground patches were chosen for the study, and a random sample of 10 m × 10 m quadrat was taken inside each patch to conduct a plant survey. Plant field surveys of the quadrats were carried out in the summer of 2021 (June–August). All woody plants in the quadrat were measured in height and chest diameter, and counted for each species. Four 1 m × 1 m sub-quadrats were arranged at the four corners of each quadrat. Herbaceous plants in the sub-quadrats were covered by area statistics. Recording all woody plant species within the quadrat and all herbaceous species within the sub-quadrats, all plant species were identified according to the Flora of China. Plants are classified into native species and non-native species based on the Flora of Henan Province. The natural species in Henan were classified as native species; the foreign, non-provincial species, and cultivated species were classified as non-native species.

2.3. Plant Diversity

The calculation of plant diversity included all species surveyed within the quadrats. Plant diversity was compared in urban centers, urban suburbs, and urban outskirt quadrats using the indices of abundance, species richness, Shannon–Wiener diversity, Simpson diversity, and evenness [50,51].

2.4. Environmental Data

Nine types of environmental factor data were gathered for each quadrat from three perspectives: space, temperature, and illumination, to describe the environmental status of quadrats adequately. The 176 quadrats’ spatial factors included longitude, latitude, and altitude, and were located using portable GPS. The temperature factor selected was the mean temperature of the warmest month, which was obtained from the WorldClim database (http://worldclim.org/version2, accessed on 18 July 2022) with a spatial resolution of 30 s (~1 km2). The quadrats’ illumination factors included the total transmittance ratio (VisSky), tree-crown projected area (GndCover), leaf area index (LAI), and mean leaf angle (MLA). Every quadrat of illumination data was collected together with the plant field survey. At the middle of each quadrat, 1.3 m above the ground, a Canon 7D camera (EOS60D, Canon, Japan) and an ultra-wide-angle fish-eye lens (F2.8 EX DC, SIGMA, Japan) were used to take hemispherical pictures. In order to avoid the impact of direct sunlight on the photo result, the photos were taken in the morning (06:30–08:30) and afternoon (16:30–18:30), while recording the time, quadrat number, and photo number. The photos with the best contrast and the least exposure were selected as valid photos. HemiView’s canopy illumination analysis system calculated the canopy illumination factor data from these hemispherical pictures [52].

2.5. Data Analyses

The urban quadrat gradient was divided using the space-constrained hierarchical clustering method, which can reduce spatial autocorrelation between clusters’ self-relevance, highlighting the importance of plant species. In this paper, the urban centers, urban suburbs, and urban outskirt quadrats were clustered at three levels using space-constrained hierarchical clustering. Space-constrained hierarchical clustering was performed with the “adespatial” function in R [21]. The variation in vegetation between the urban centers, urban suburbs, and urban outskirt was demonstrated using Principal Co-ordinates Analysis (PCoA). The PCoA analysis was completed by the “betadisper” function in R [53]. Woody plants and herbaceous plants were classified and analyzed along the 1 km gradient quadrats in various cities, considering the considerable differences in plants in the three urbanization gradients and the dissimilar modifications different life forms have. The plant diversity indices were polynomially fitted with the distance (the distance between the survey quadrat and the cross-section intersection quadrat) using a linear-regression model, facilitating the quantitative spatial distribution of various plant life forms along the gradient of urbanization. The analysis was based on the “ggplot2” package in R [54]. The autocorrelation between nine environmental parameters, including quadrat spatial factors, temperature factors, and illumination factors, was examined using the Pearson correlation strategy. Five plant diversity indices, namely, abundance, richness, Shannon–Wiener diversity, Simpson diversity, and evenness, were correlated with nine environmental parameters along urbanization gradients, and this correlation was examined using the Mantel test [55]. The Pearson correlation method and Mantel test were based on the “ggcor” package (version 0.9.8.1) in R (https://github.com/houyunhuang/ggcor, accessed on 18 July 2022).

3. Results

3.1. General Plant Species Composition

A total of 313 vascular plant species belonging to 246 genera and 106 families were found in 176 quadrats. A total of 137 species of woody plants were discovered, and the majority were in suburban areas. A total of 176 species of herbaceous plants were observed, and most of them were in urban centers. The species composition of woody plants and herbaceous plants at three urbanization gradient levels is shown in Figure 2. This survey found 201 native species and 112 non-native species. Of them, 130 are native species and 70 are non-native species found in urban centers; 129 are native species found in urban suburbs and 69 are non-native species; 115 are native species and 56 are non-native species found in urban outskirts. The differences between native species and non-native species in three urbanization gradients are shown in Figure 3.

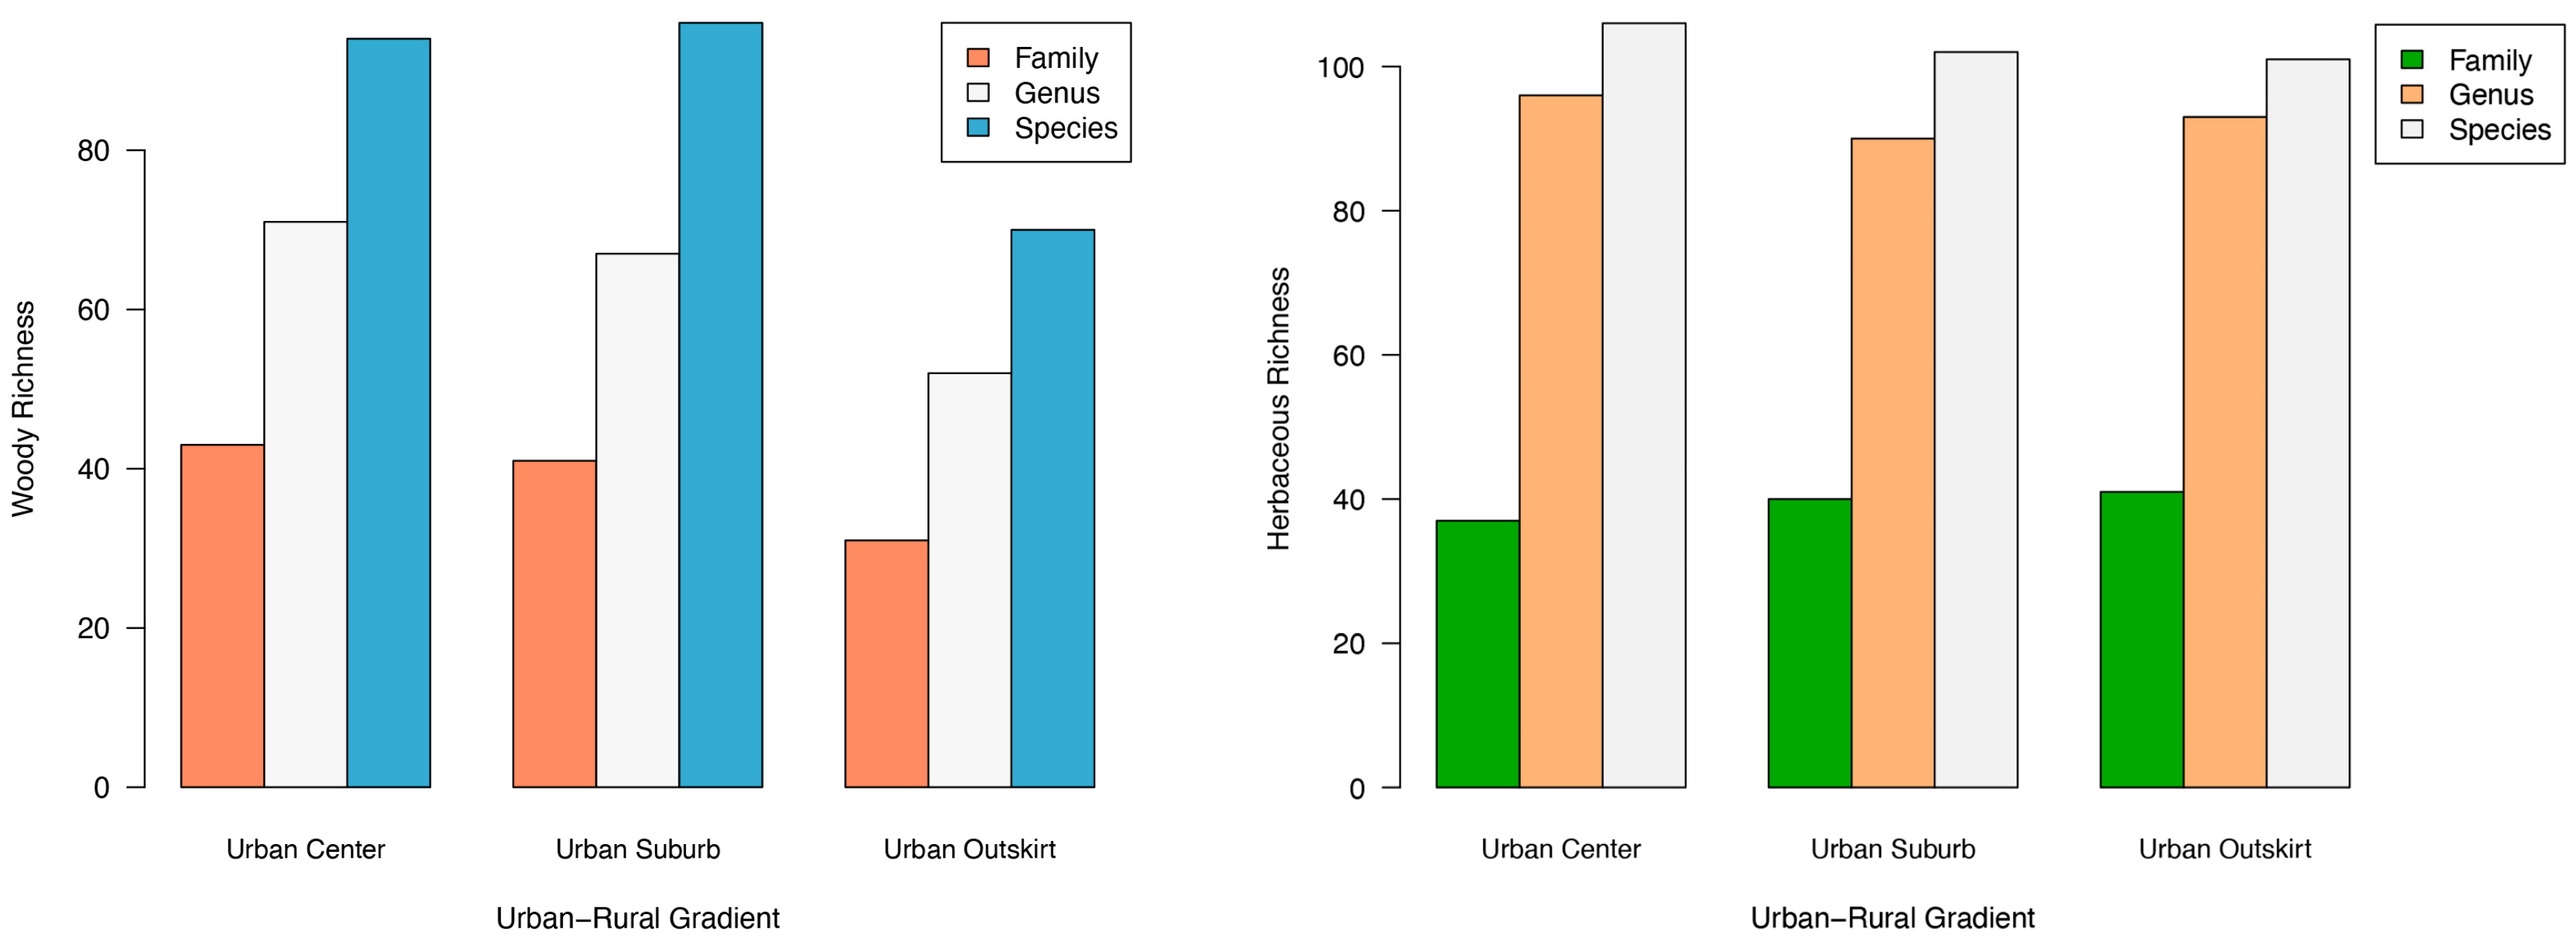
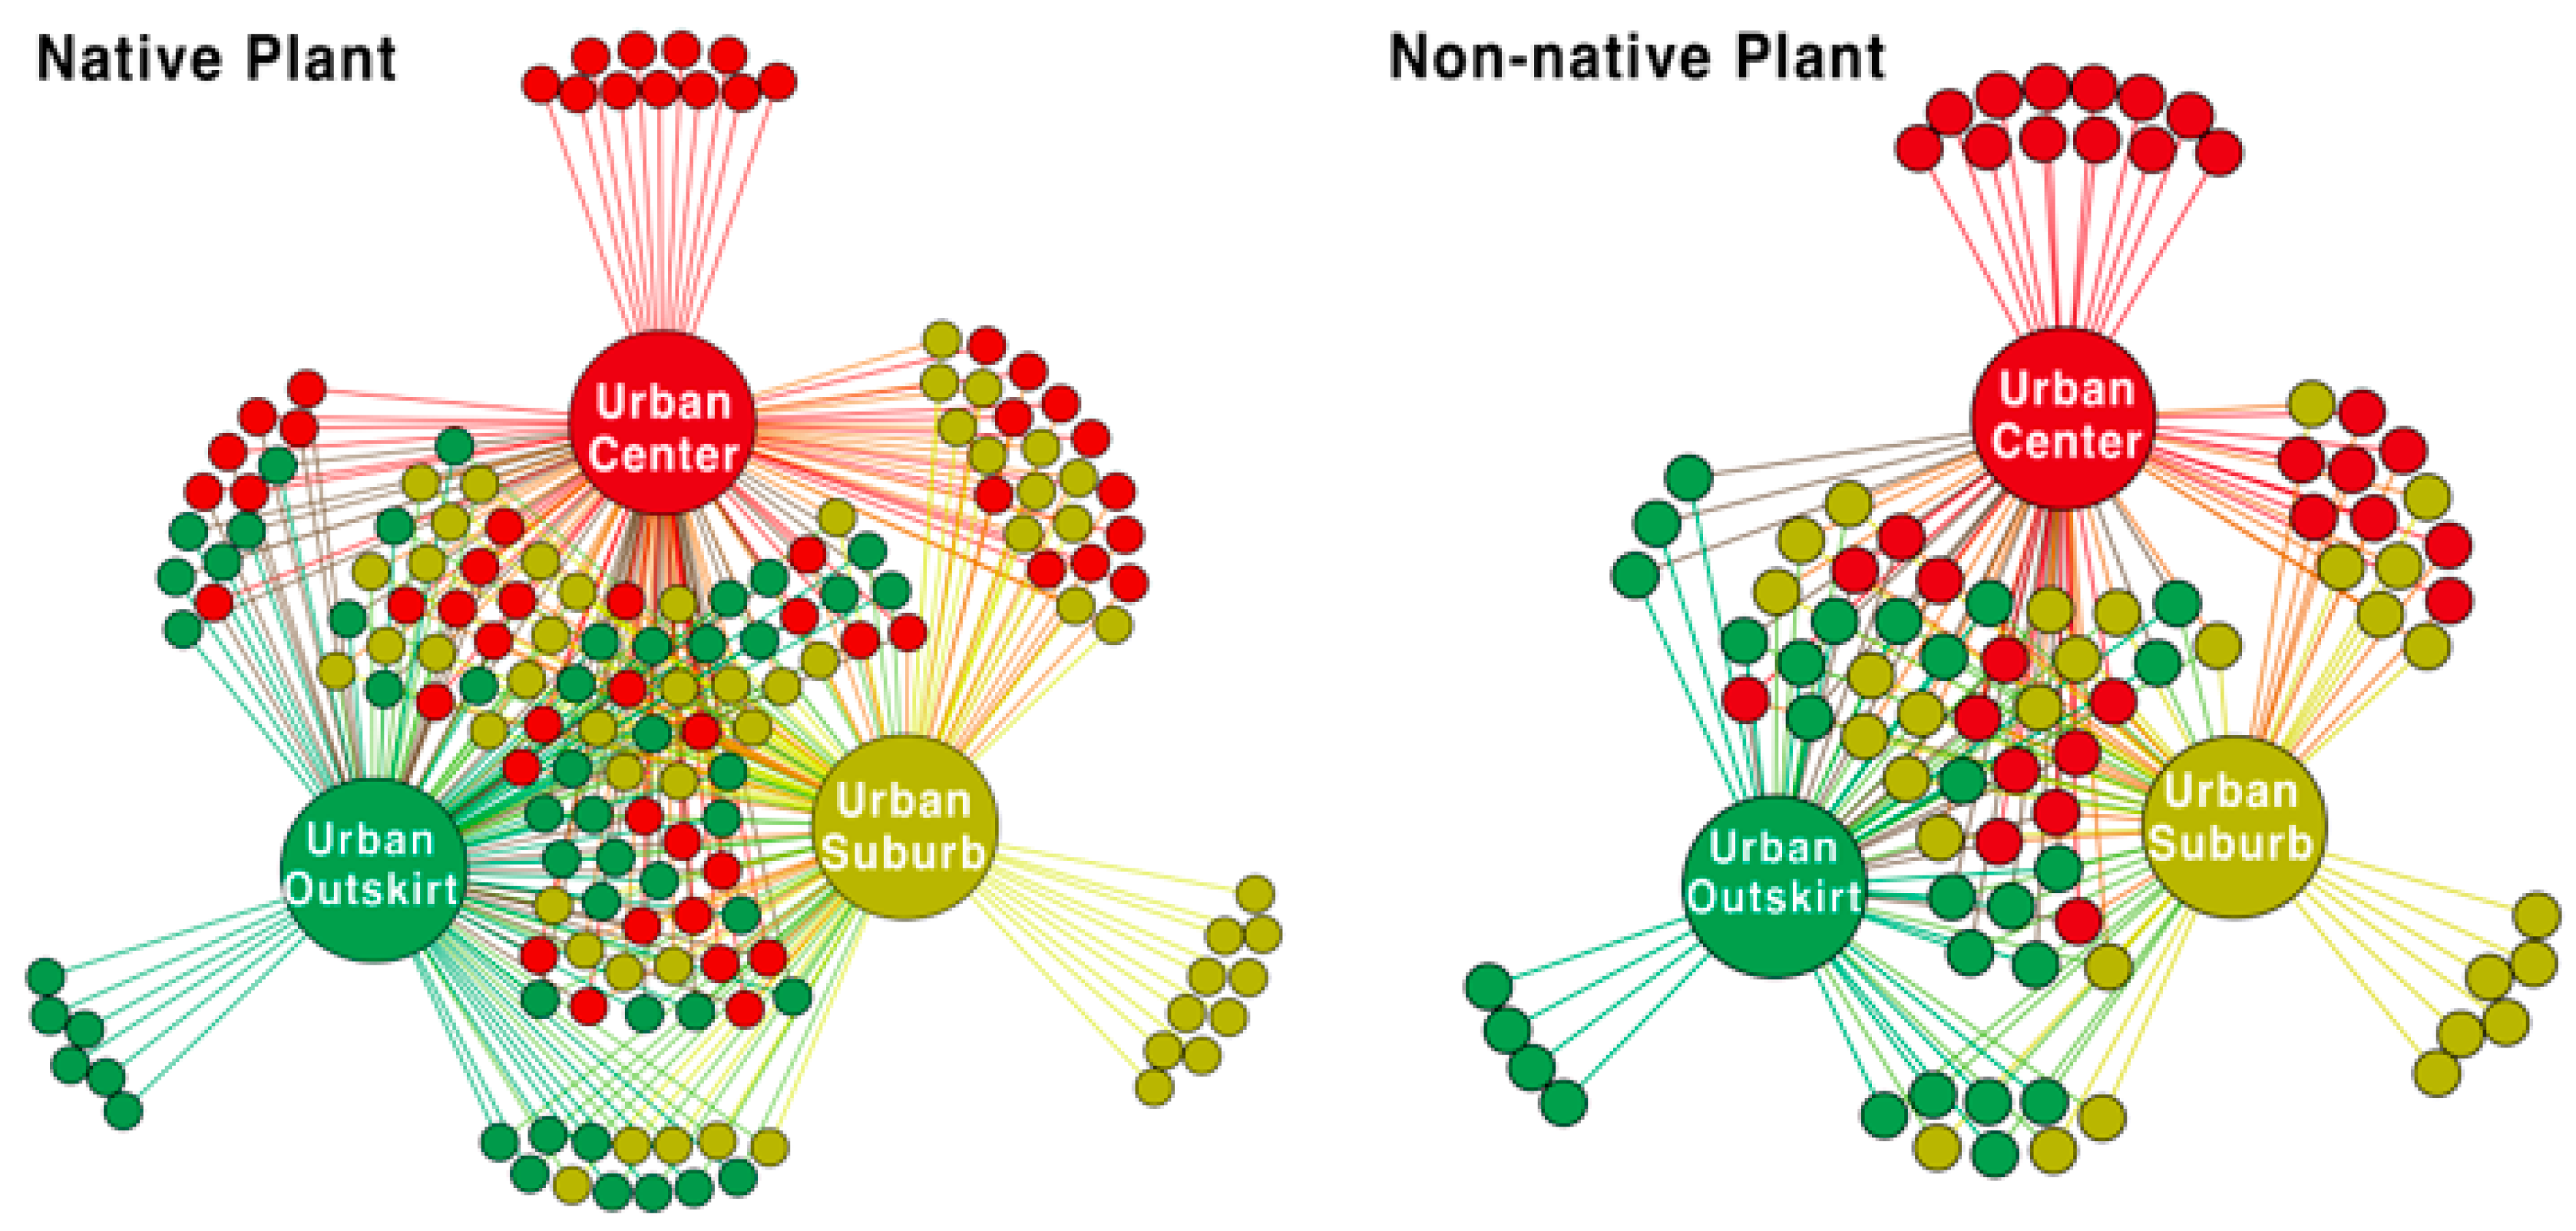
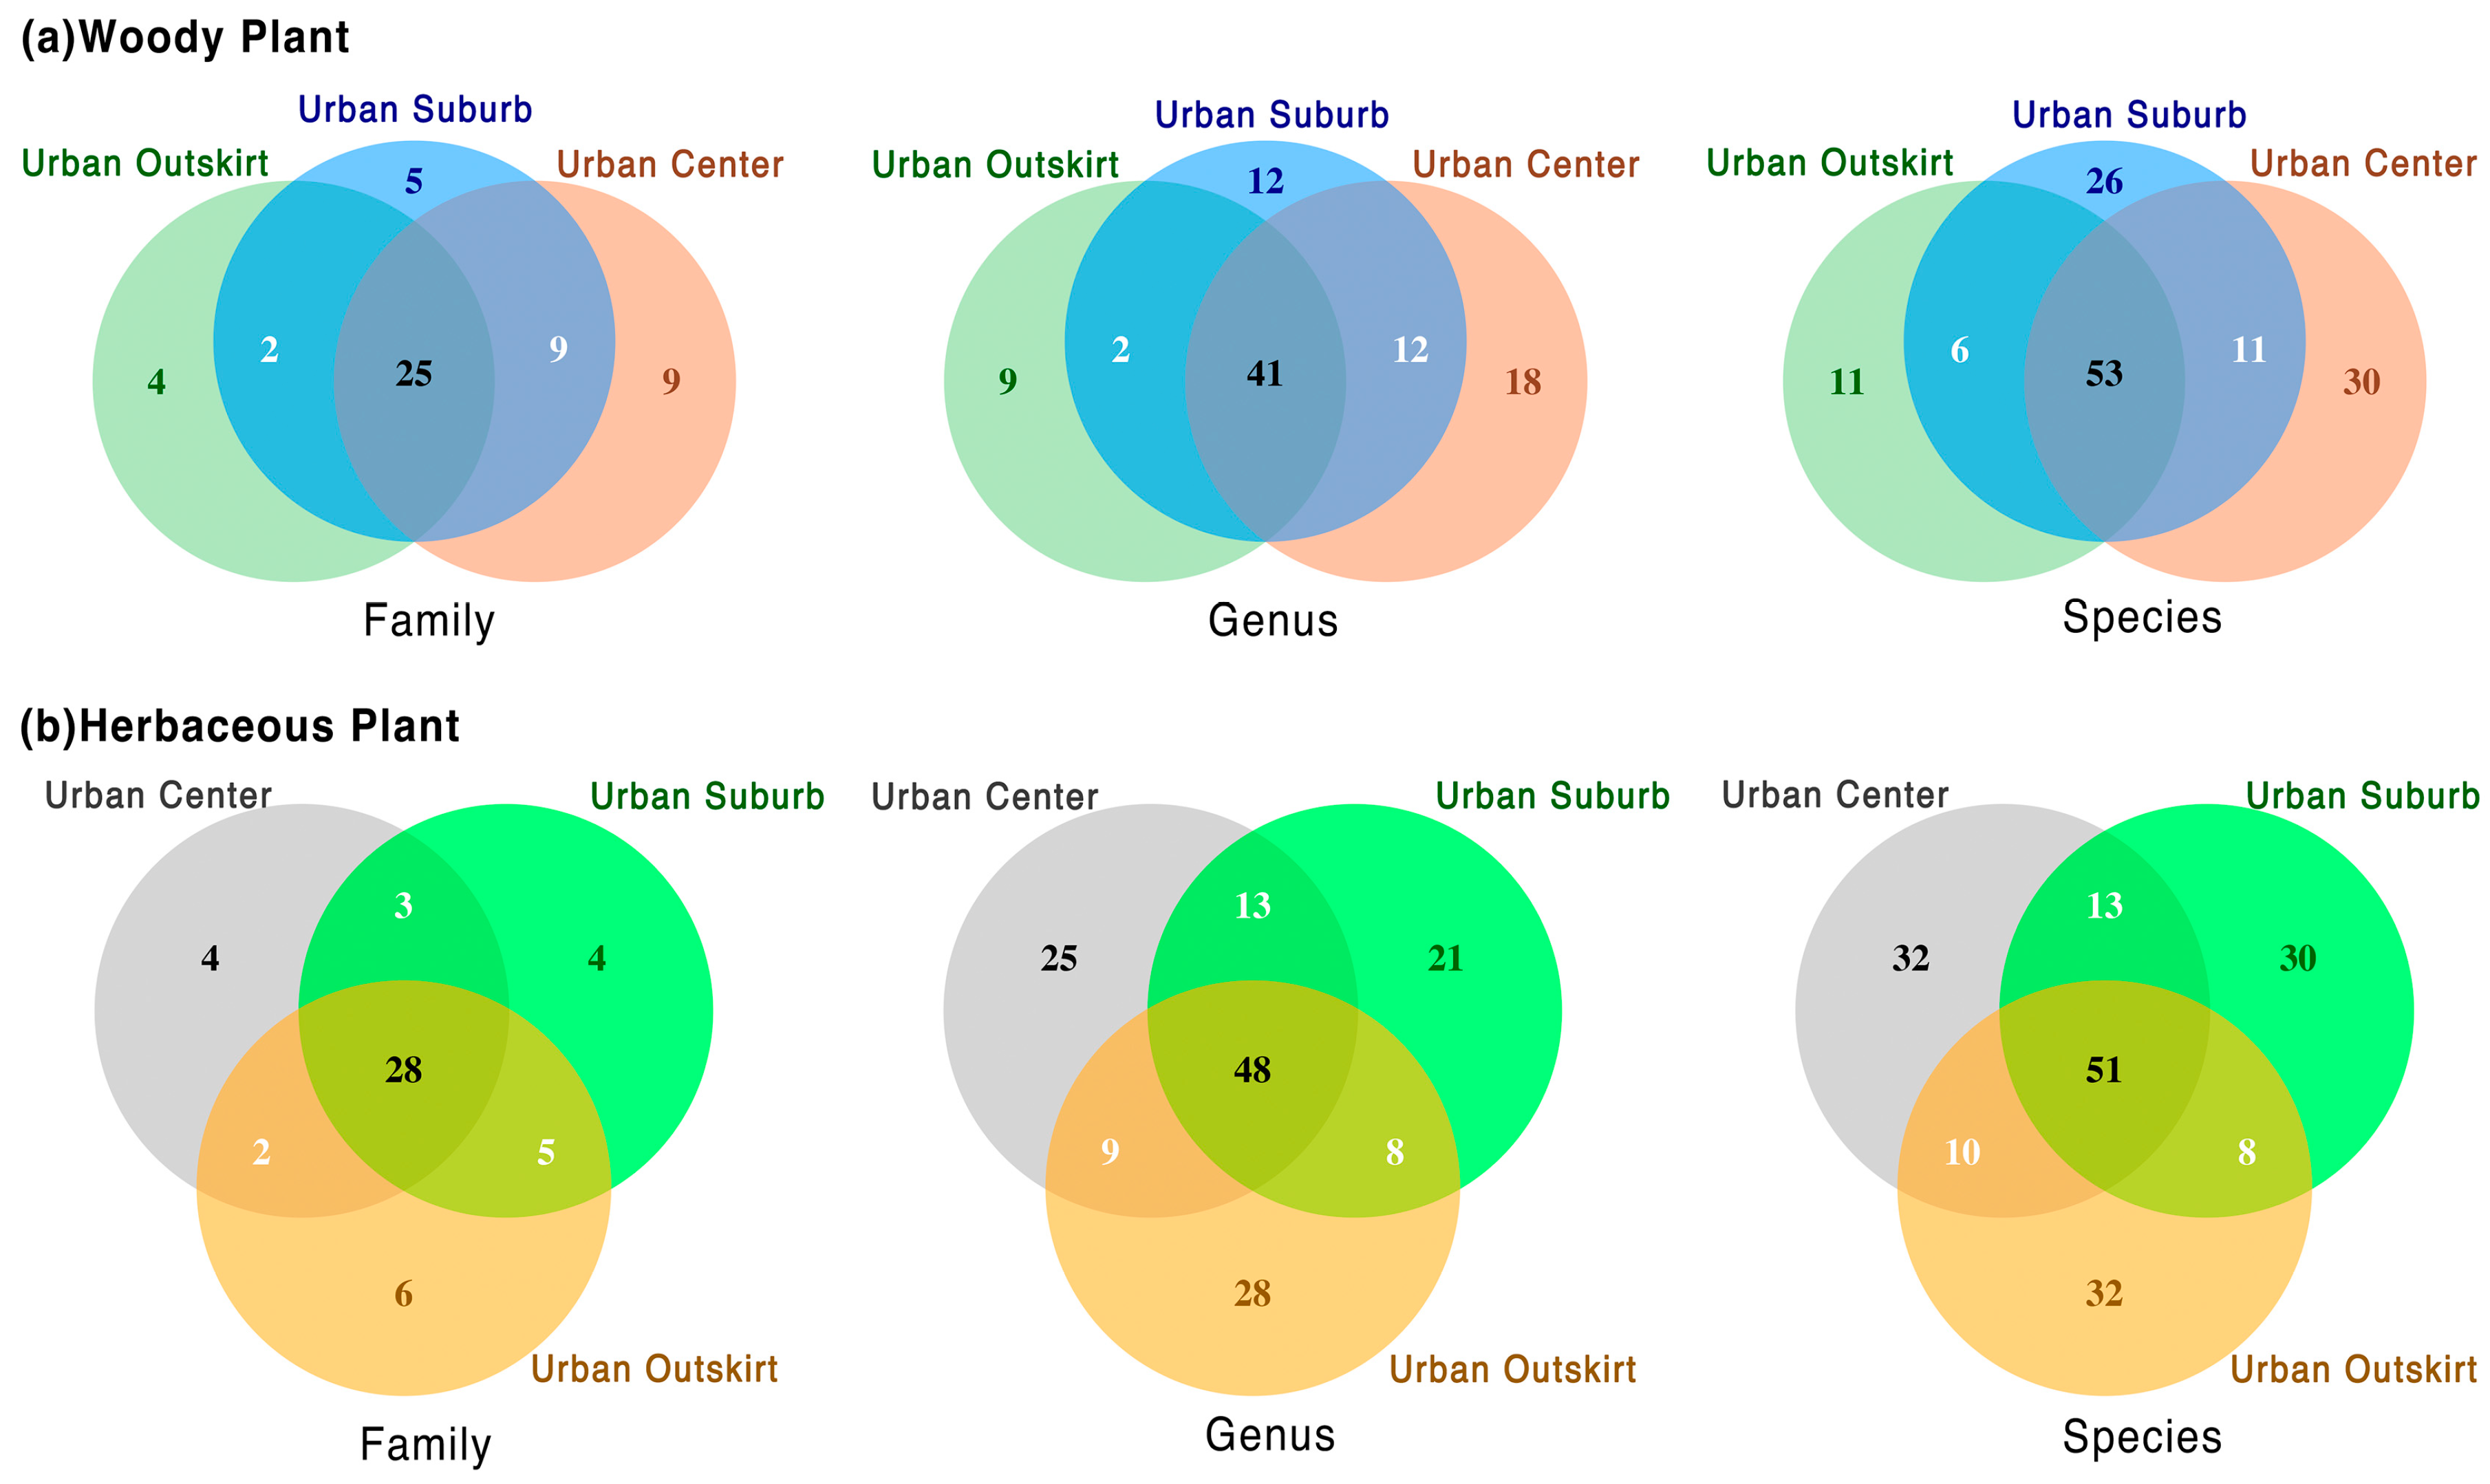
3.2. Different Plant Taxa at Various Gradients of Urbanization

Except for those common to the three urbanization gradients, no species of woody plants were discovered to be shared by urban centers and urban suburbs, according to a Venn diagram (Figure 4). In urban suburbs, the distribution of woody plant species was more similar to that in urban centers (Figure 4a). Although the common species of herbaceous plants in the three gradients were less than those of woody plants, many species were common between the two gradients (Figure 4b). For the common taxon on the different gradients, woody plants had a smaller proportion than herbaceous plants at the family level but a larger proportion at the genus and species levels. Notably, in the three gradients, herbaceous plants exhibited a high percentage of unique species.
The three urbanization gradients’ plant species were subjected to PCoA analysis (Figure 5). Further PCoA analysis of various plant life forms revealed that in the three urbanization gradients the species difference of herbaceous plants was larger than that of woody plants.

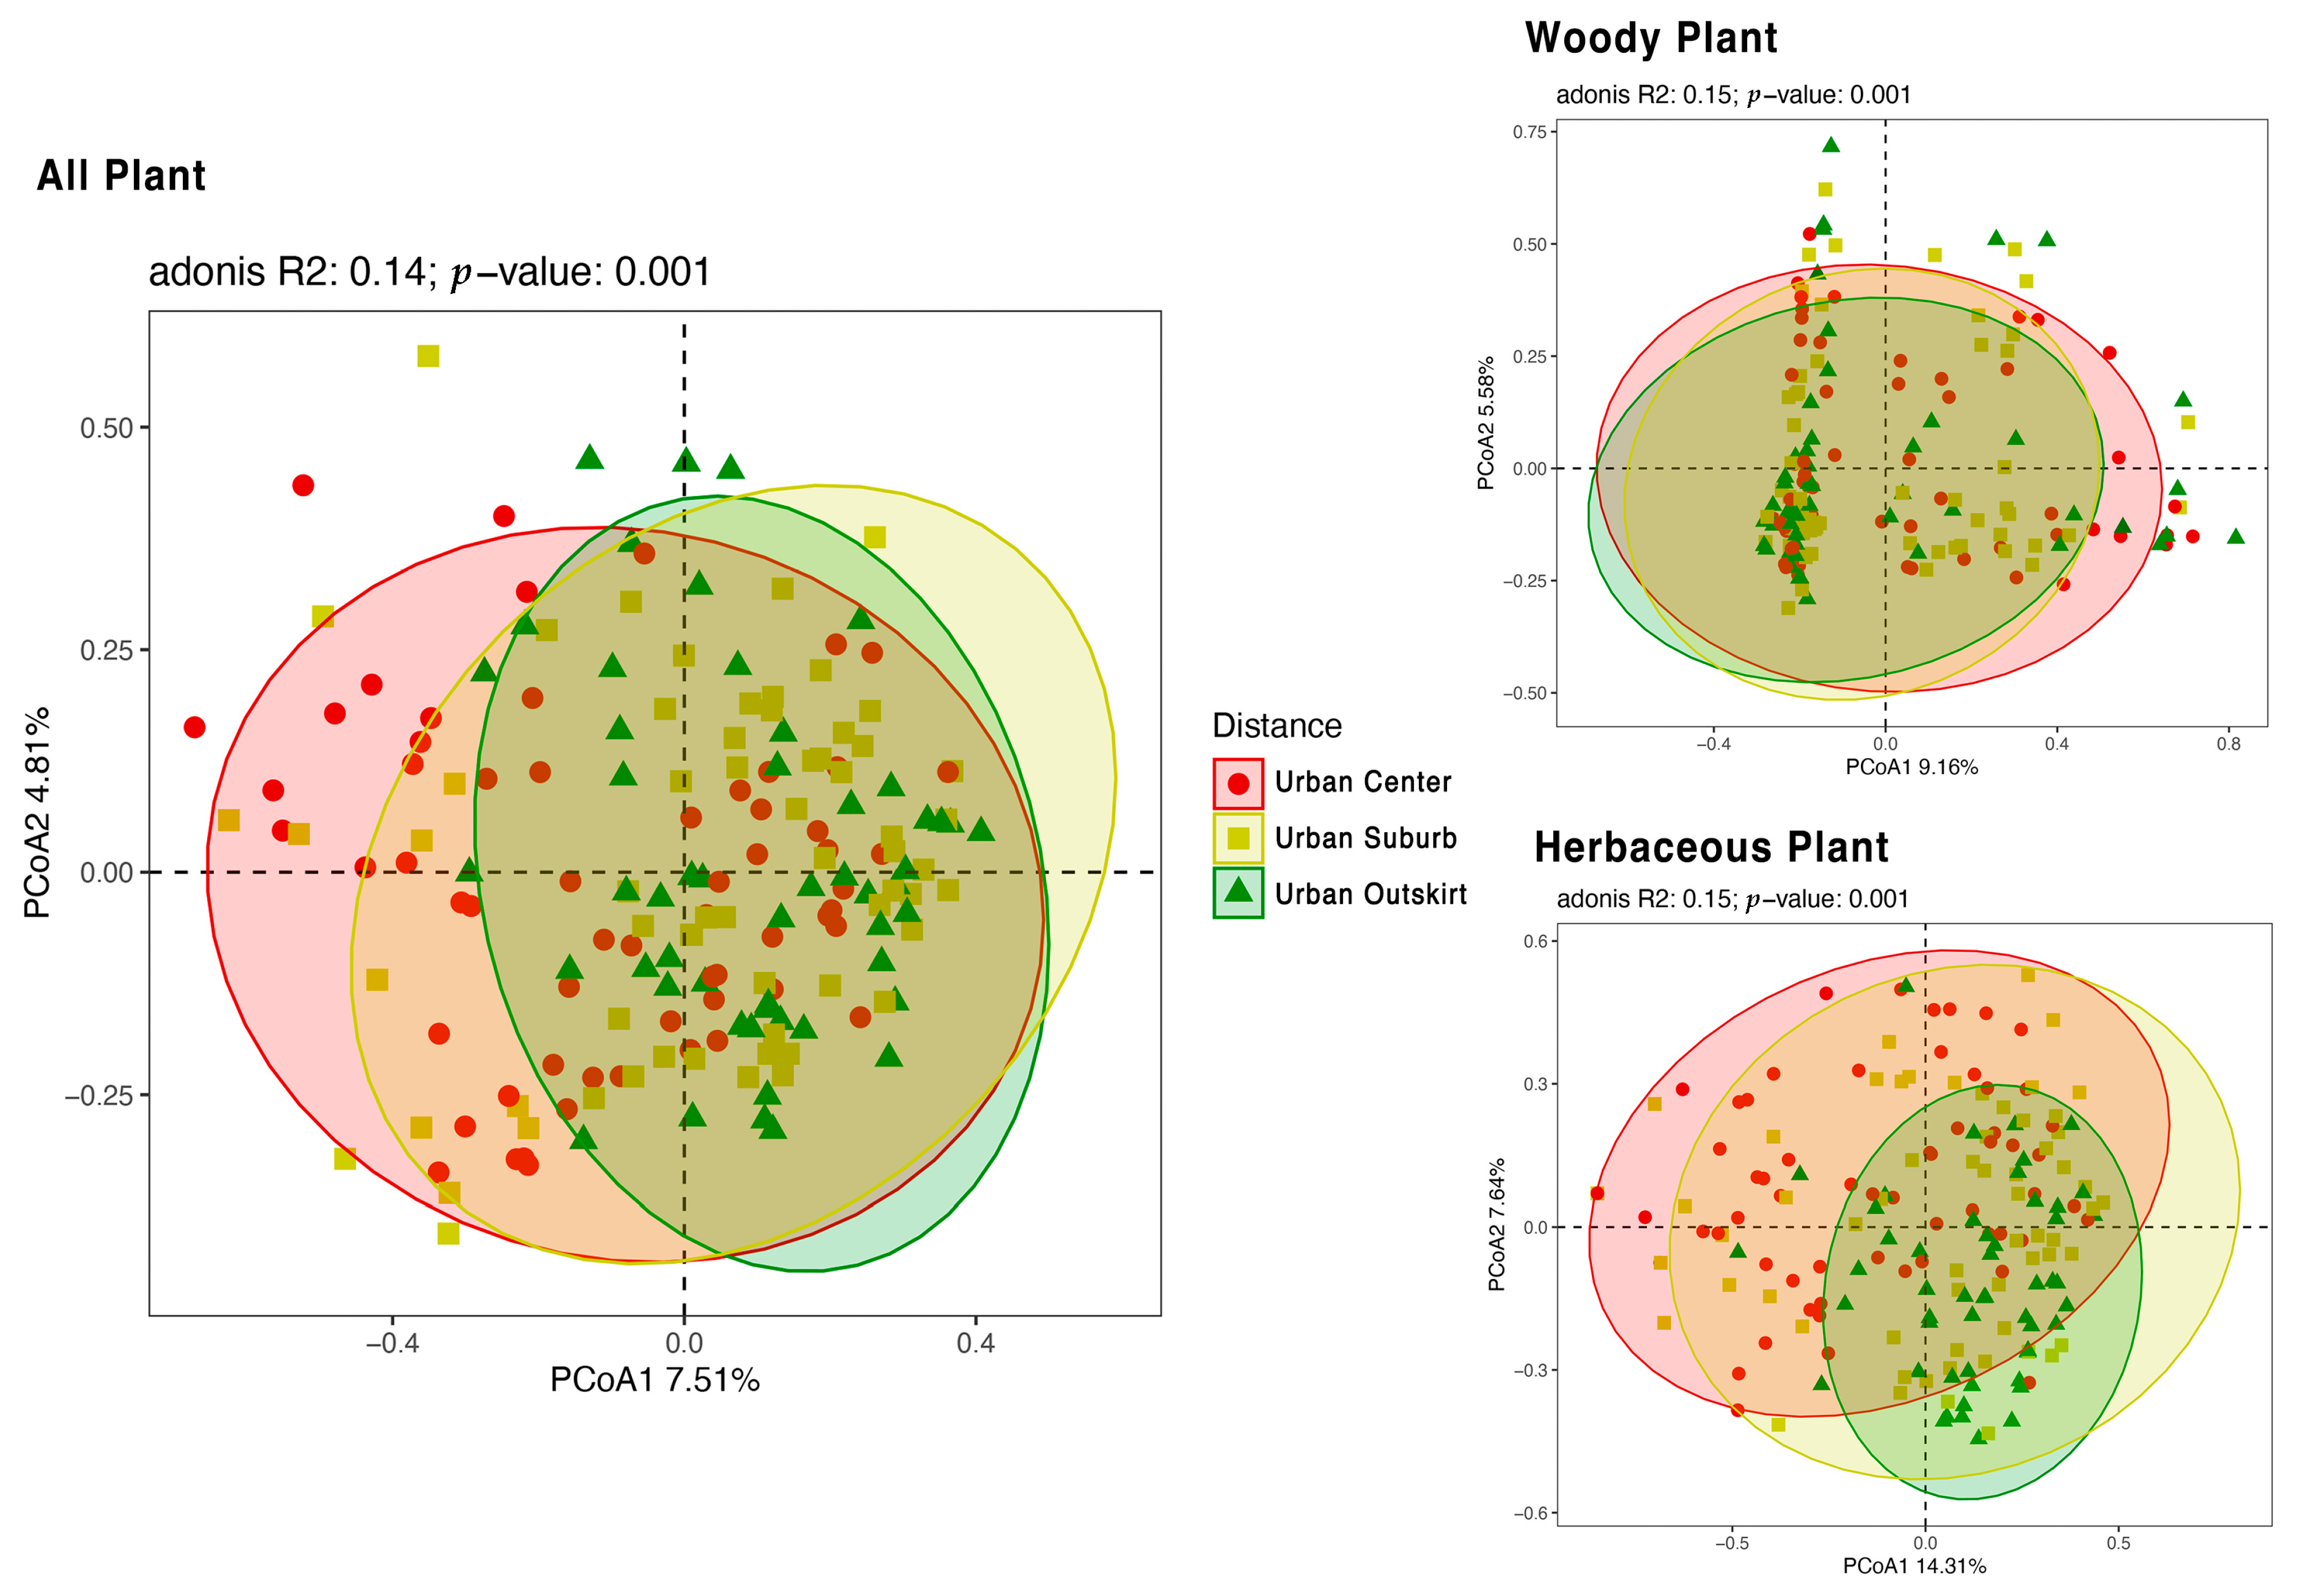
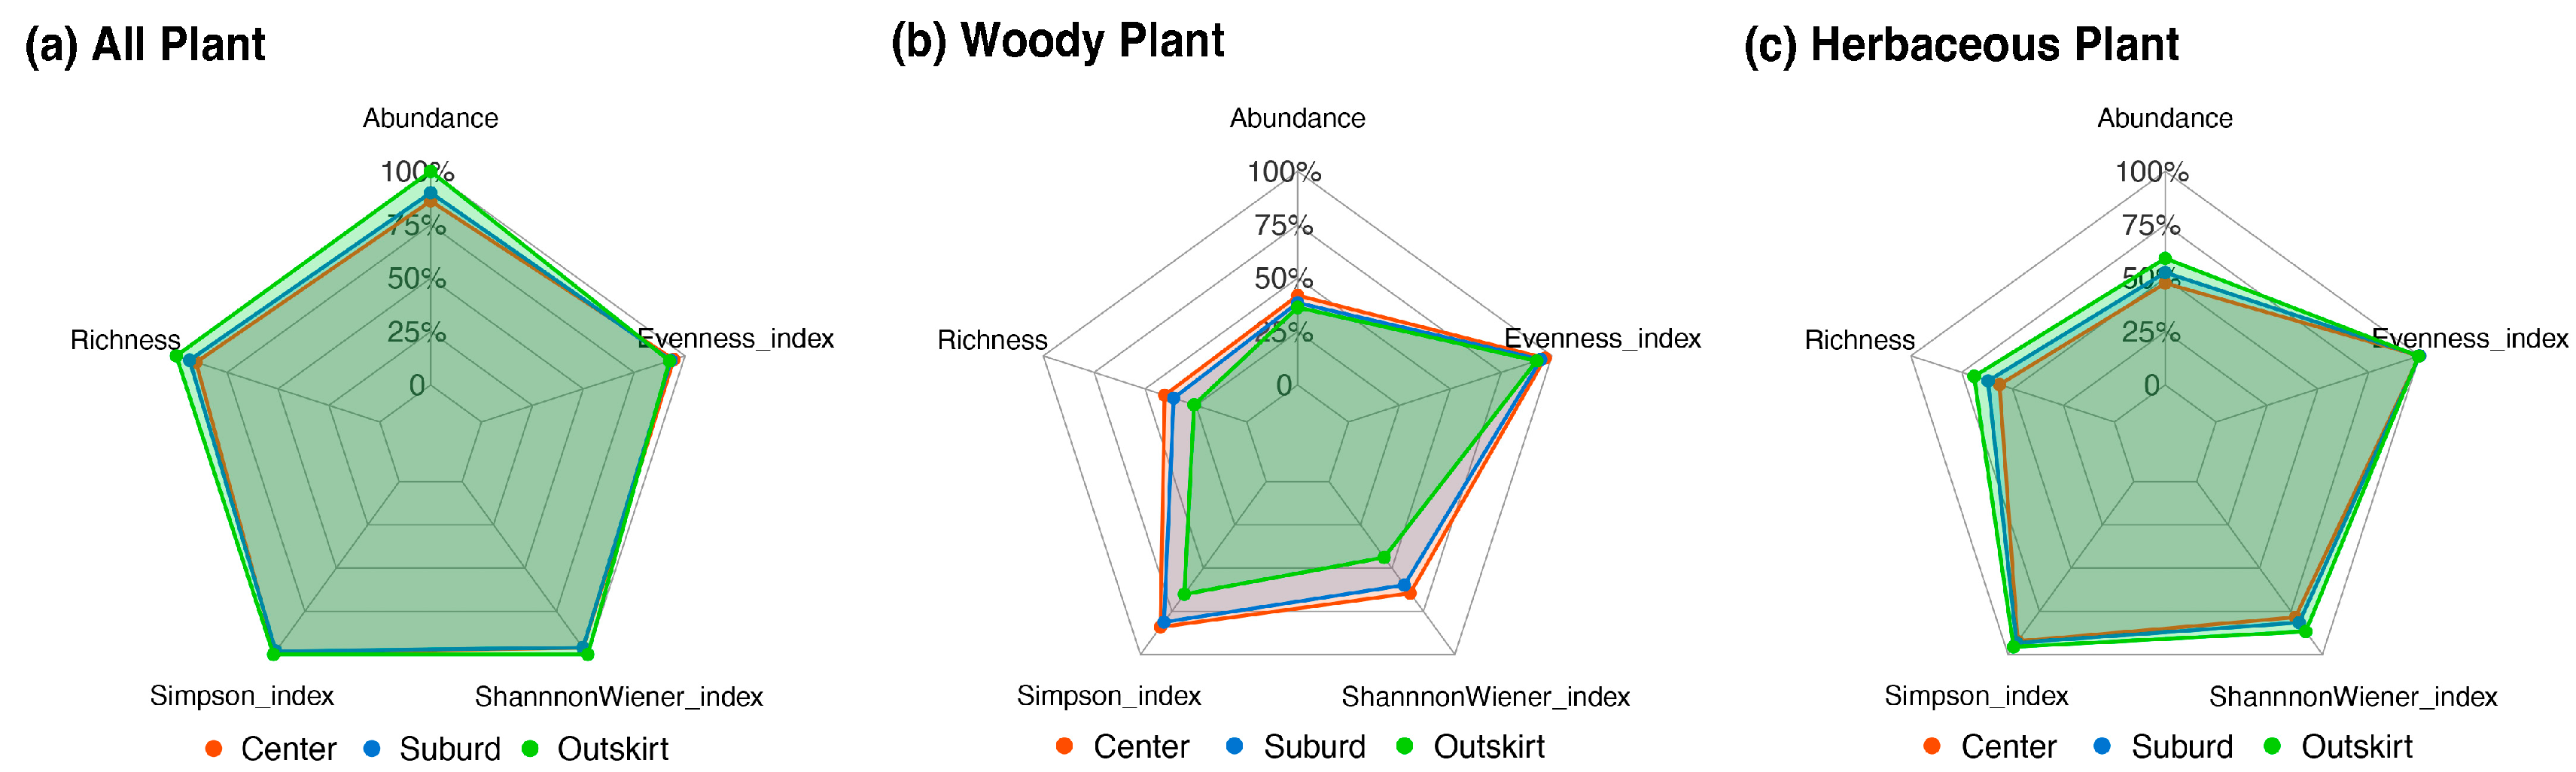
3.3. Different Plant Diversity among Various Gradients of Urbanization

Five distinct plant diversity indices were examined using radar charts, and results showed that at the all-plant level (Figure 6a), the diversity indices of the urban outskirt were superior to those of the urban center and urban suburb. Herbaceous plant diversity indices exhibited the same regularity as those of the all-plant level (Figure 6c). However, in terms of woody plants (Figure 6b), the urban center had the highest diversity of trees, followed by the urban suburbs, and the lowest index was found in the urban outskirts. Data on plant diversity for each quadrat in this study are shown in Table S1.

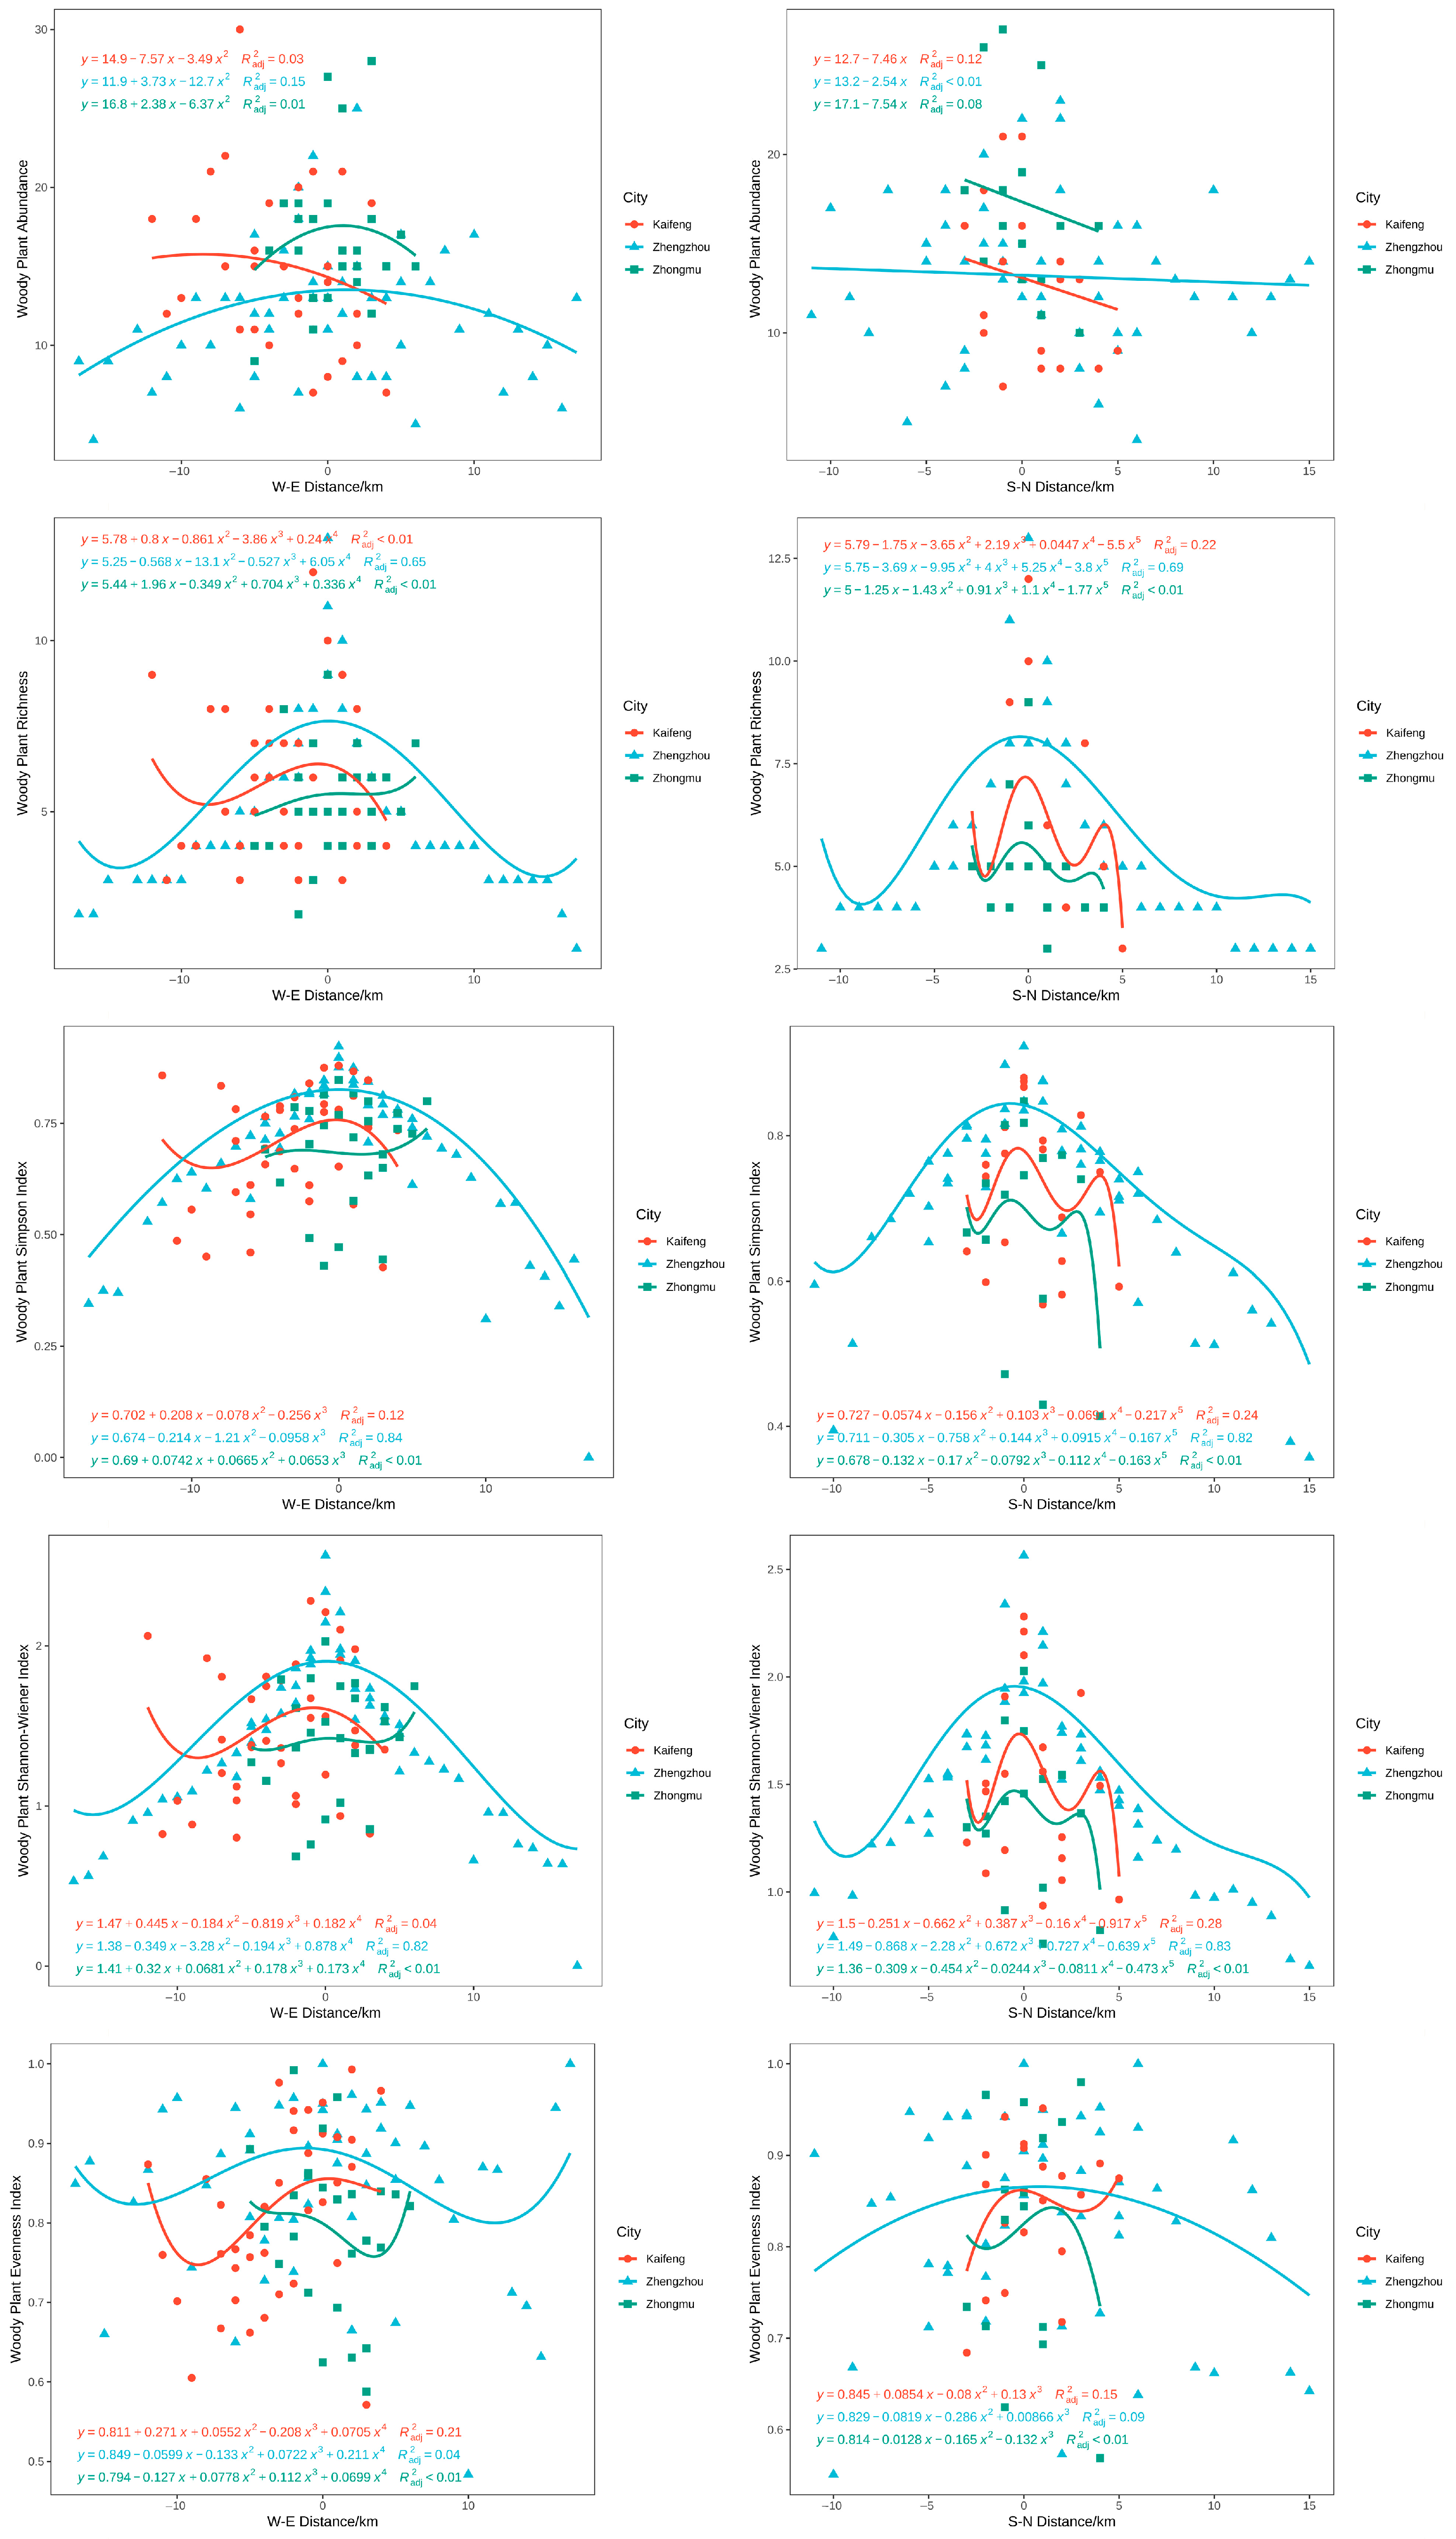
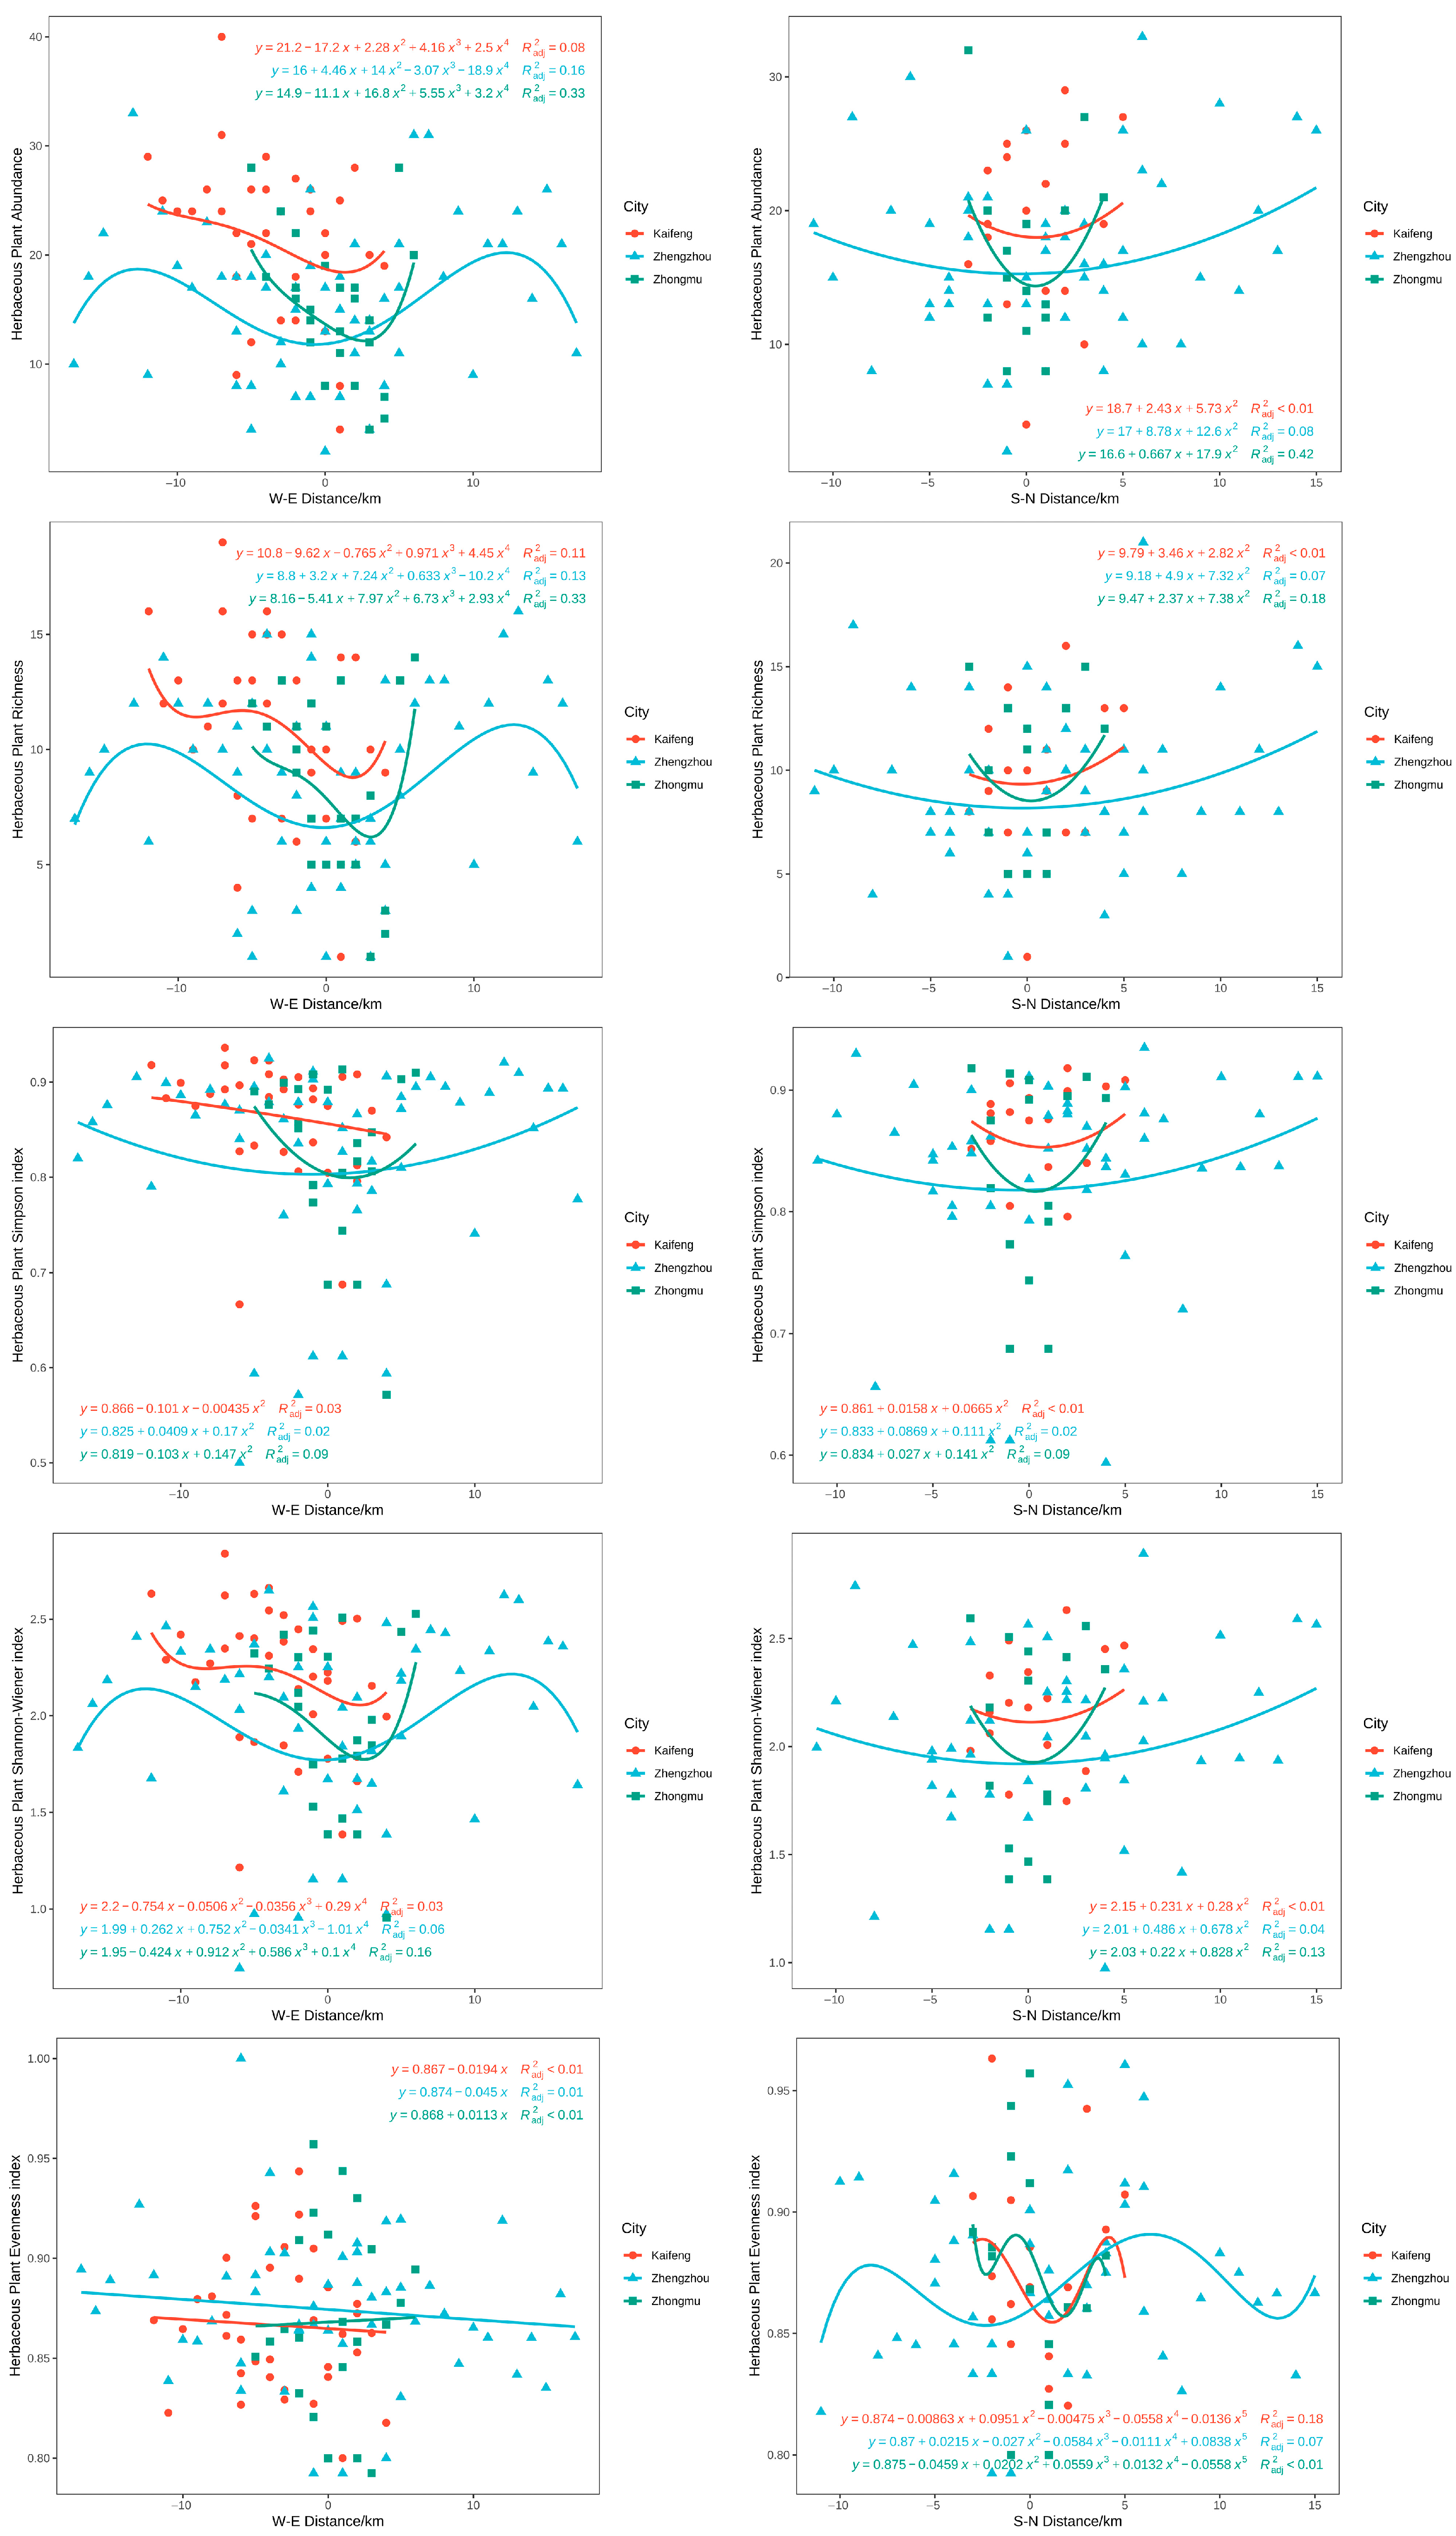
3.4. Distribution Pattern of Plant Diversity in Different Cities

The woody plant diversity of the three cities quadrats revealed various distribution patterns in the west-east (W-E) and south-north (S-N) axes (Figure 7). The linear-regression model demonstrated that the indices of the three cities were higher in the urban center than in the surrounding regions, and each index had a unique regularity. Richness, the Simpson index, and the Shannon–Wiener index of woody plant diversity all had high degrees of gradient fitting, whereas other indices did not alter appreciably. The polynomial fit of the woody plant diversity indices in the three cities’ quadrats was best in Zhengzhou, followed by Kaifeng and Zhongmu County. The single peak and inflection point of the polynomial in Zhengzhou also showed the largest gradient span.
In contrast to woody plants, the distribution patterns of the herbaceous plant diversity varied in the west-east (W-E) and south-north (S-N) axes, and the linear-regression model for the indices showed lower values in the urban center than in the surrounding areas (Figure 8). Although the W-E and S-N diversity of herbaceous plants differed from those of woody plants along the gradient, their polynomial fit was less satisfactory. The Shannon–Wiener index, diversity, abundance, and richness of herbaceous plants, as well as other indices, were relatively well fitted with the gradient; however, other indices did not vary considerably with the gradient. Compared with Zhengzhou and Kaifeng, Zhongmu County had a higher polynomial fitting degree for the diversity indices of herbaceous plants. The single peak and inflection point of the herbaceous polynomial in Zhengzhou showed the largest gradient span, which was the same as the woody plant polynomial.

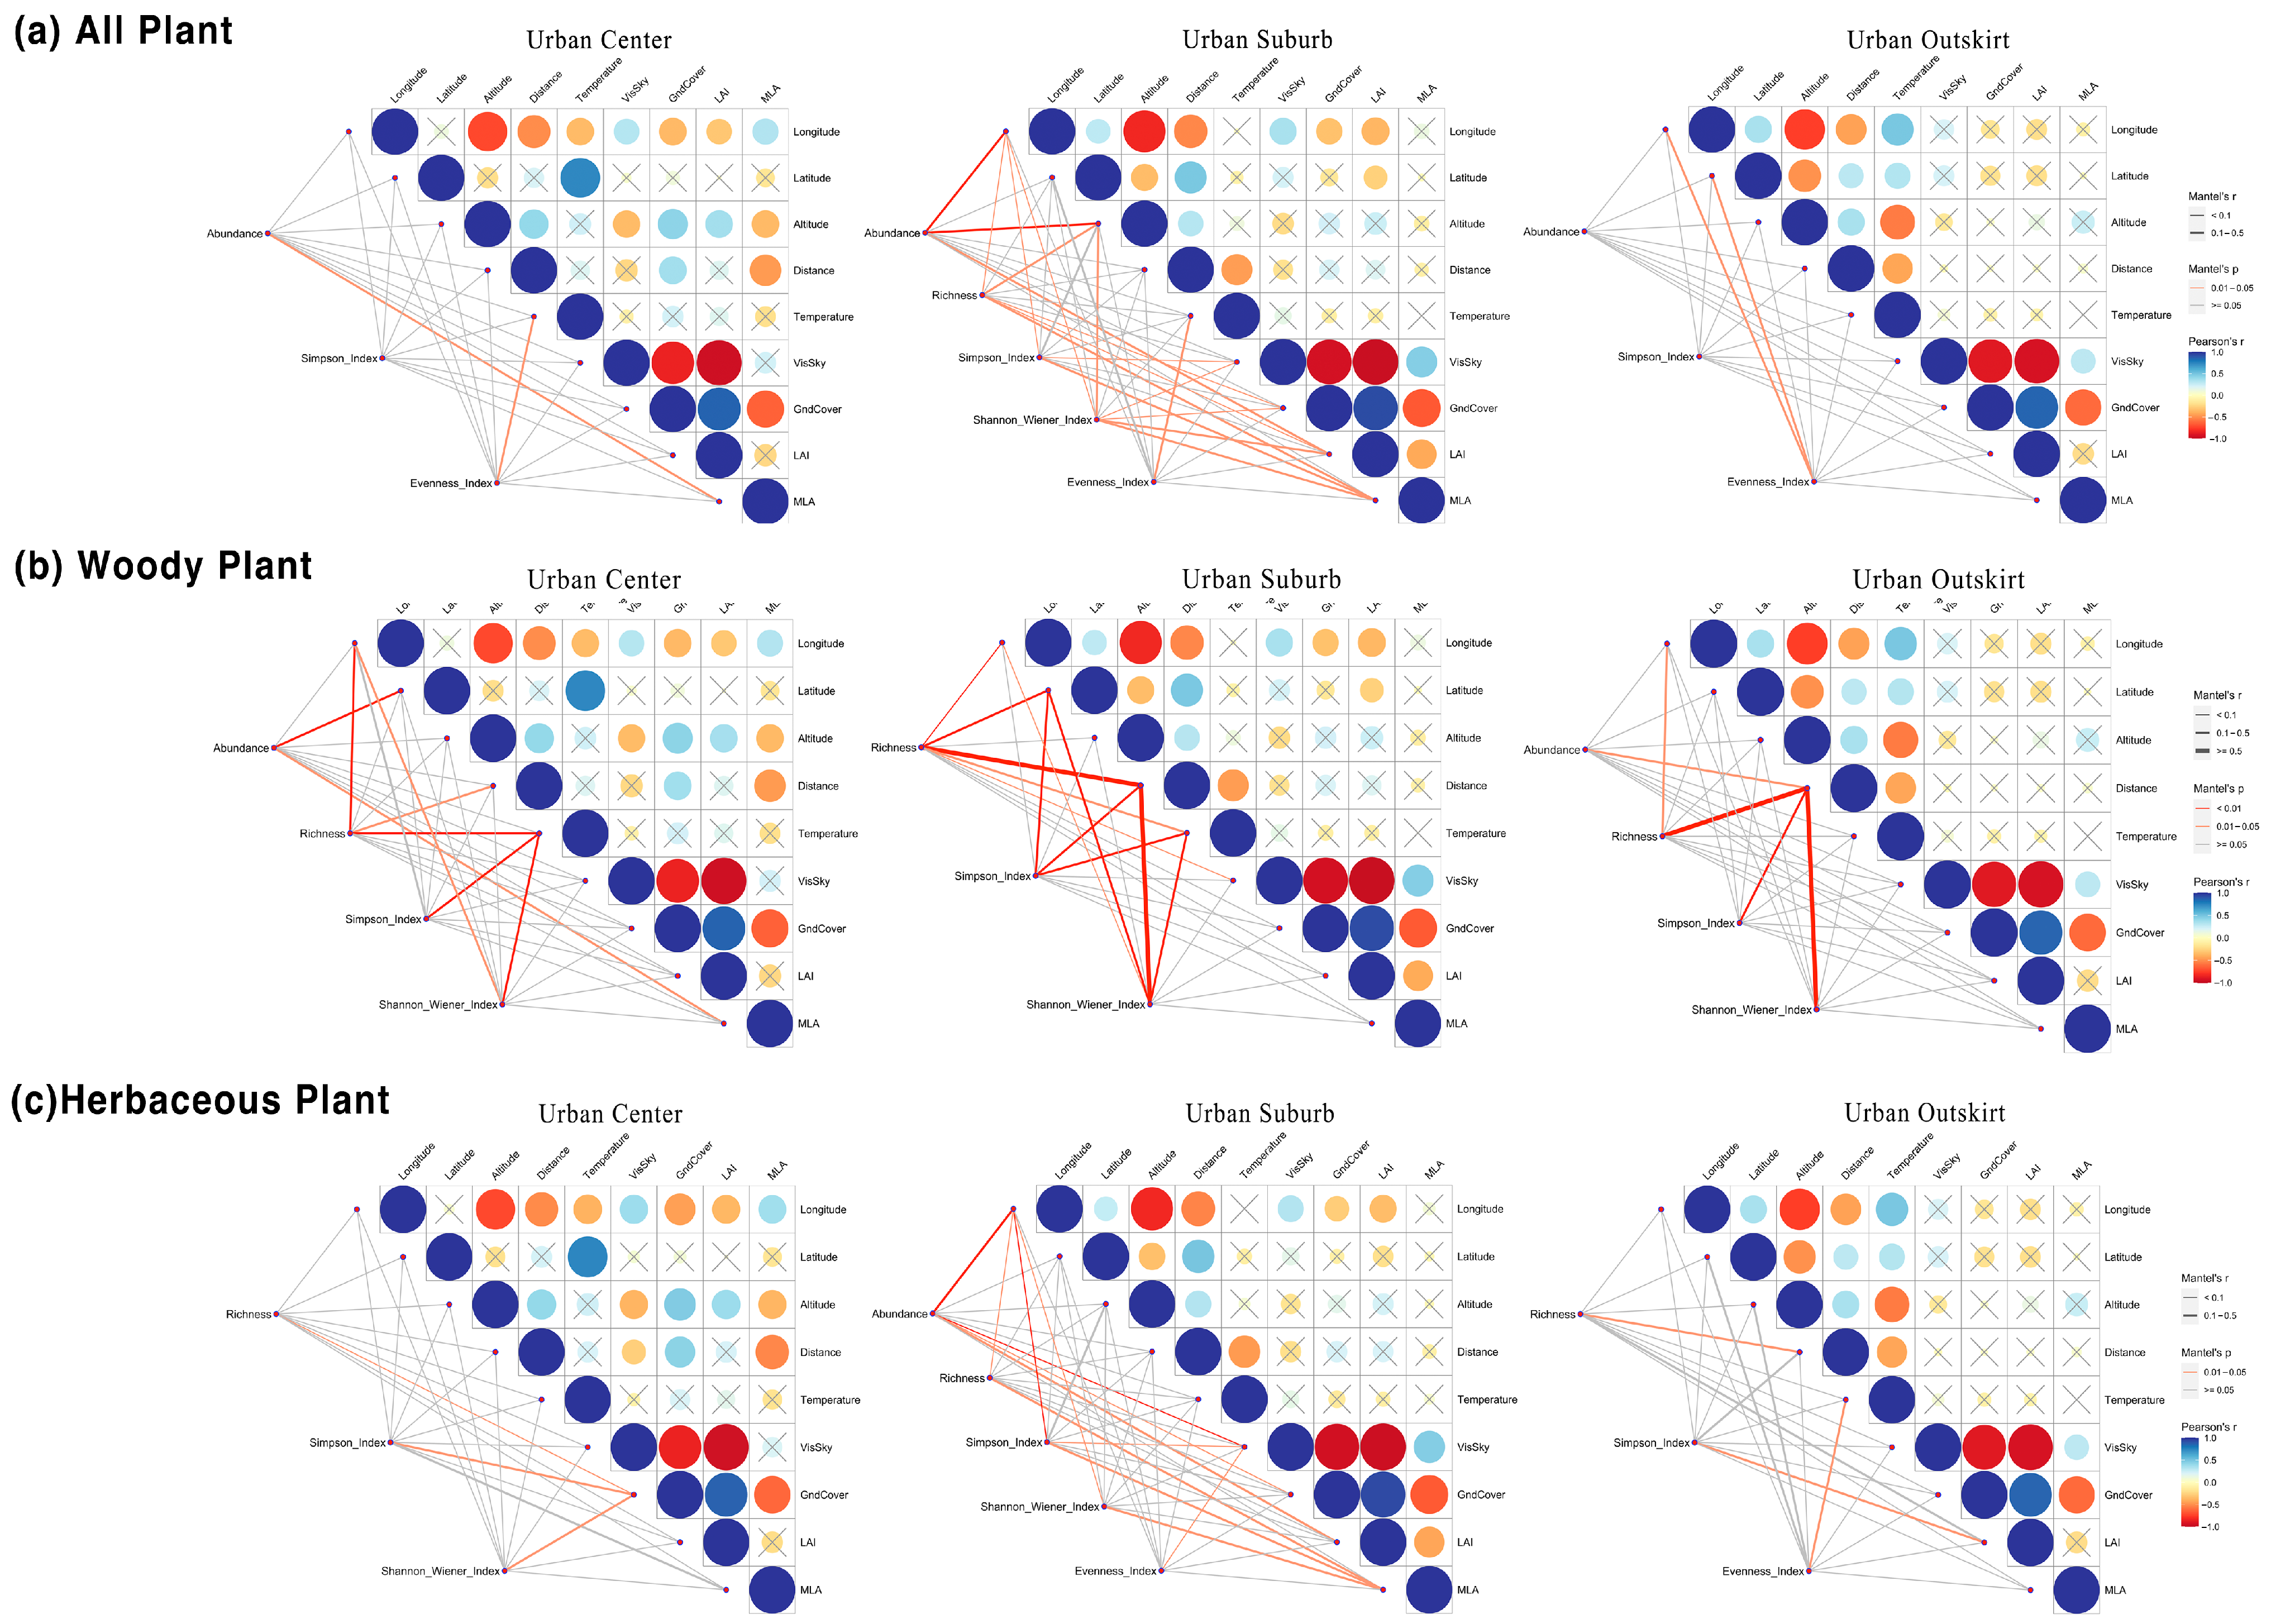
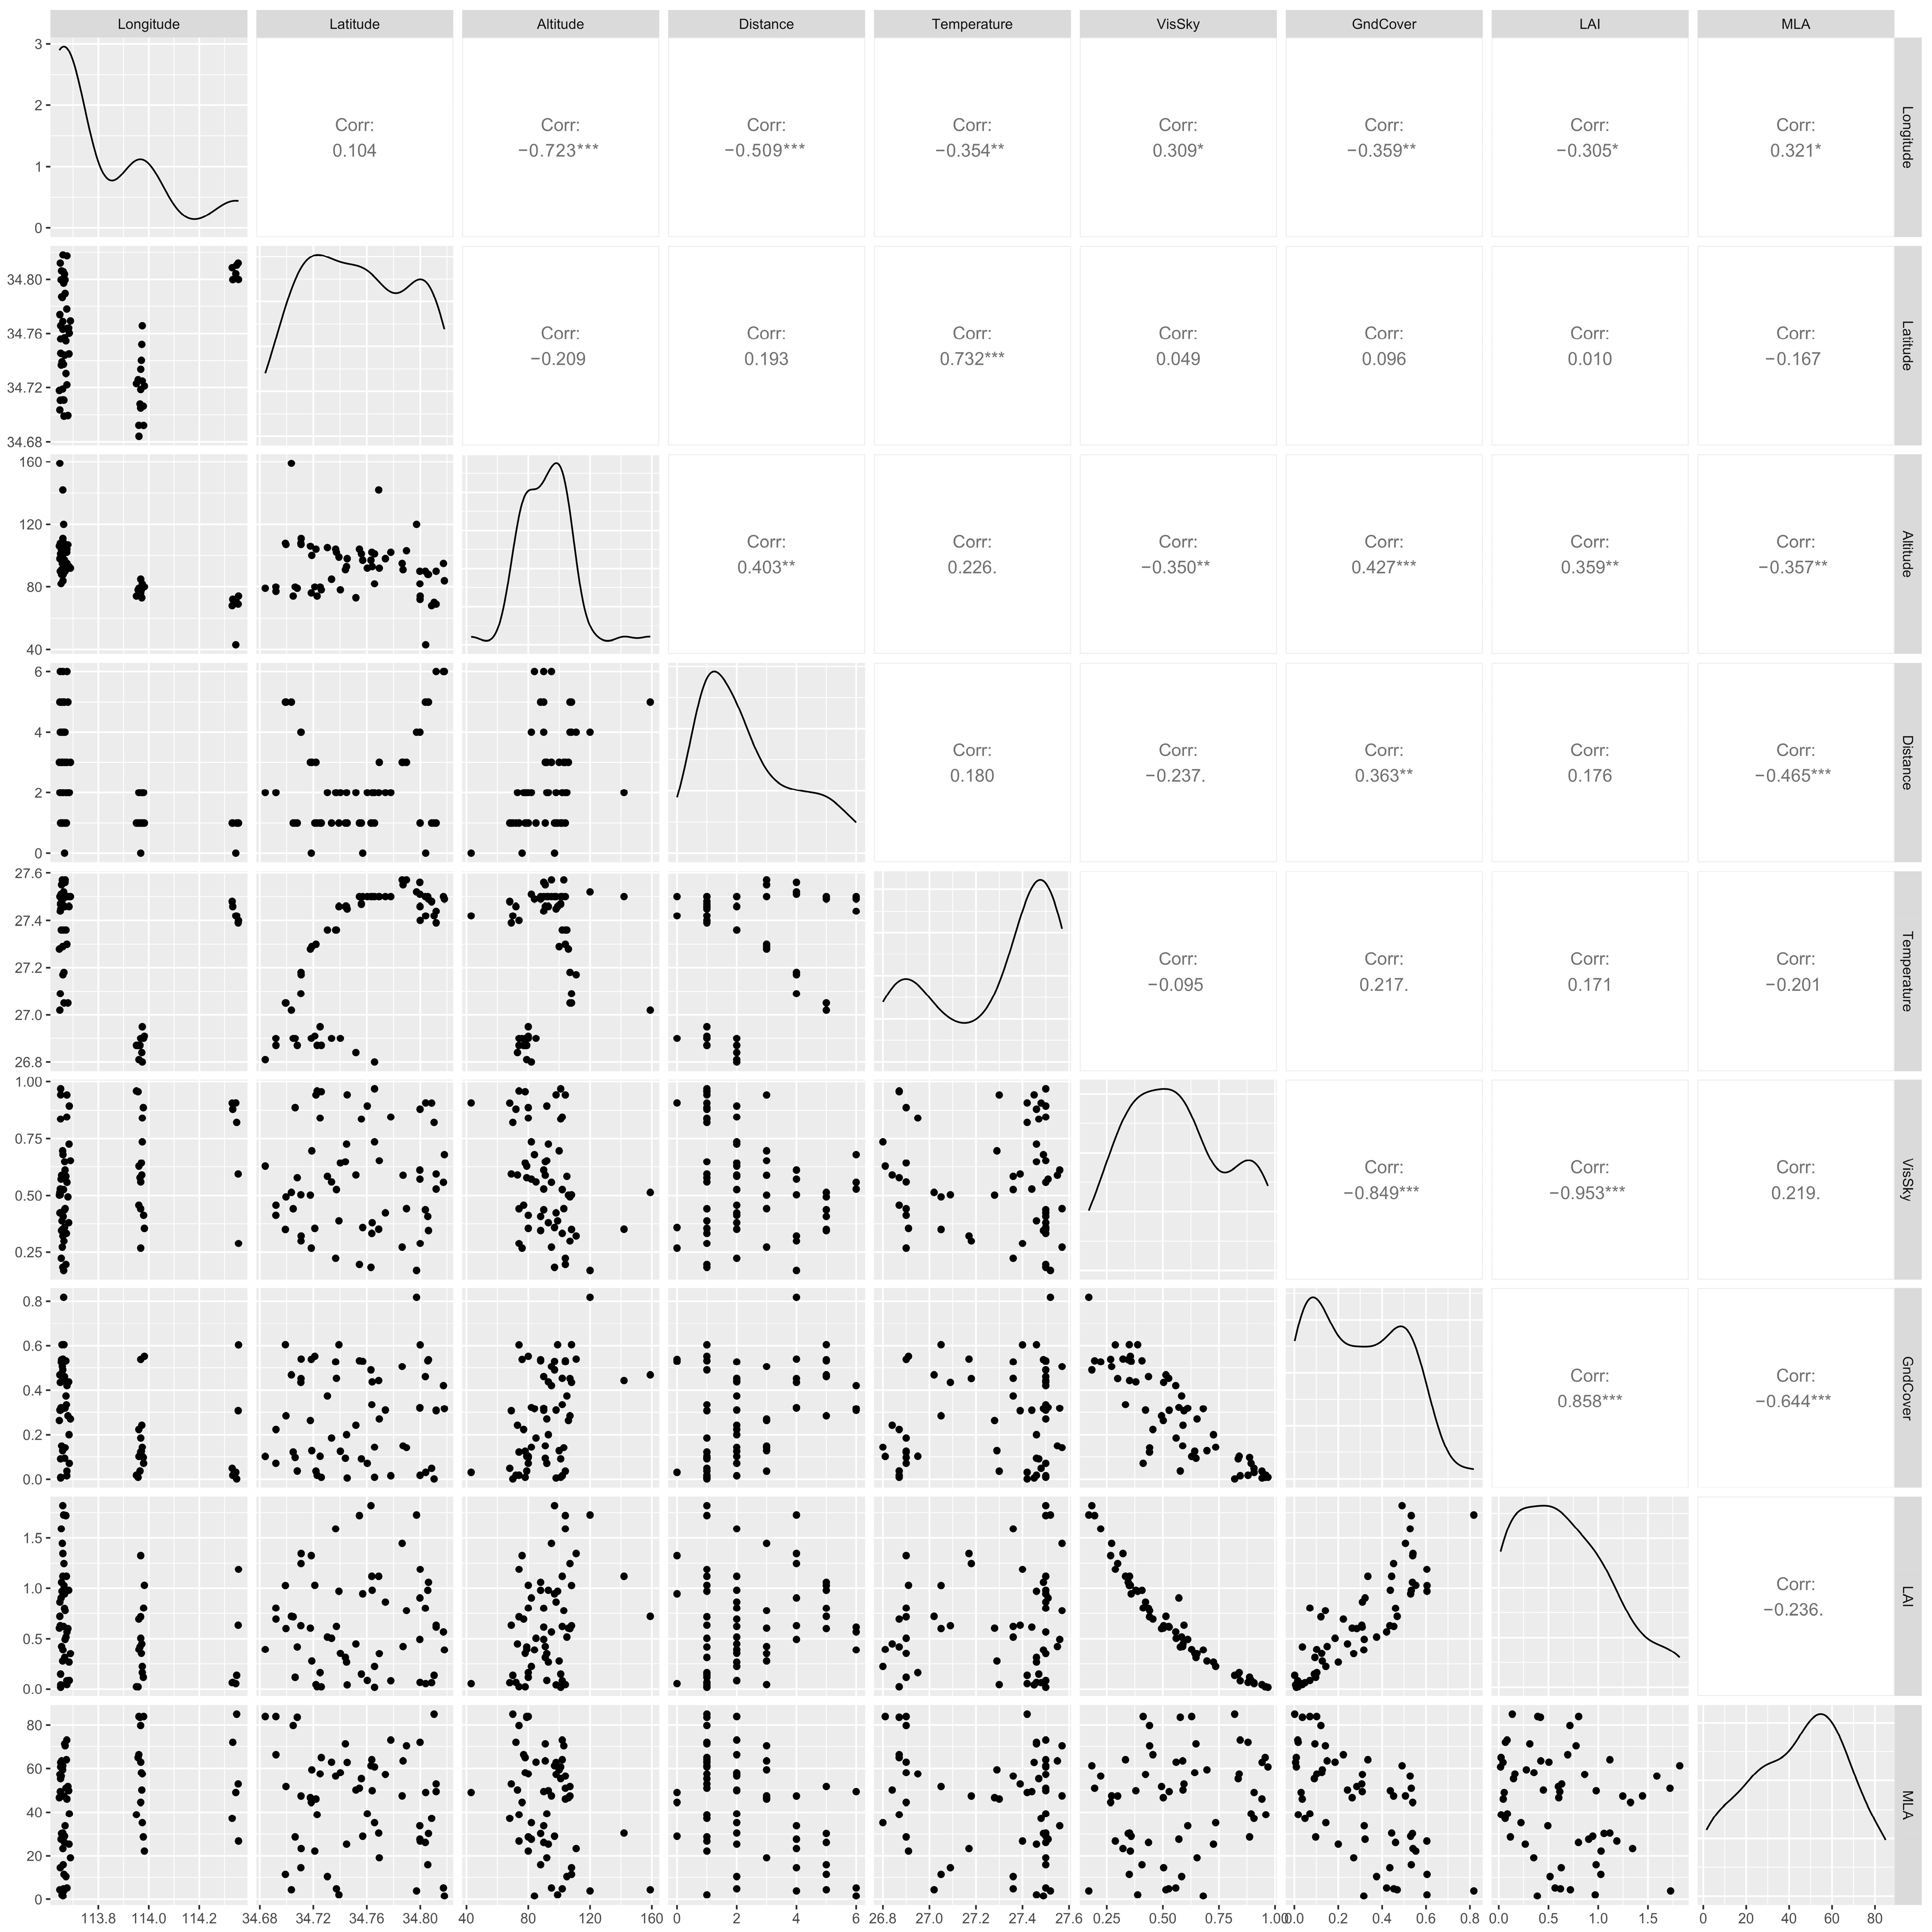
3.5. Effects of Environmental Factors on Plant Diversity under the Urbanization Gradient

The Mantel test revealed that across the three gradients of urban center, urban suburb, and urban outskirt the influence of environmental factors on various life forms of plants displayed a remarkable difference. The environmental data for each quadrat are shown in Table S2. Correlation analysis and significance tests were carried out among different environmental factors (Figure 9). Considering all the plants, the richness in urban centers was mainly affected by MLA, and the evenness index was affected by temperature. In urban suburbs, plant diversity indices were influenced by numerous environmental factors, with richness having the greatest relationship with longitude and altitude. In urban outskirts, the evenness index was substantially correlated with latitude and longitude, whereas other indices were less evident (Figure 10a). Environmental factors had a greater impact on the variety index of woody plants than herbaceous plants for the various plant life types. In urban centers, the temperature had the strongest correlation with woody plant diversity indices; while abundance was affected by longitude, richness was affected by latitude (Figure 10b). In urban suburbs, temperature, latitude, and distance from the urban center affected woody plant diversity. In urban outskirts, the distance from the urban center had the greatest impact on woody plant diversity. The diversity indices of herbaceous plants were more influenced by light factors (Figure 10c). In urban centers, the abundance, Simpson index, and Shannon–Wiener index were affected by the tree-crown Projected Area (GndCover) of light environmental factors. In urban suburbs, besides several light environmental factors, longitude had a remarkable impact on richness. In urban outskirts, only the distance from the urban center, temperature, and LAI influenced the abundance, evenness index, and Simpson index, respectively.

4. Discussion

4.1. Plant Species Composition under the Urbanization Gradient

Our results show that the richness of plant communities in urban center of Henan Province is higher than that in urban suburb and urban outskirt, and the difference of herbaceous plant composition is greater than that of woody plant. In the past 10 years, China has strongly emphasized the growth of urban agglomeration in the country’s center, which has resulted in the rapid, planned densification and extension of the cities in Henan Province; our research on plant species richness is in line with data from other Chinese cities [31,35,56]. This characteristic is prominent in Chinese cities, but more research on international cities reveals this is not always the case. According to several studies [26,29,30,43], China has less urban center green space fragmentation and more concentrated suburban land development than other countries. The difference in woody plant richness across urbanization gradients is remarkably larger than that of herbaceous plants, which further supports the idea that woody plants are the focus of more urbanized anthropogenic activities [57,58].
Although the number of woody plants varied substantially among urban gradients, contrary to our expectation, PCoA indicated the species difference among gradients was mainly manifested in herbaceous plants. The following factors could account for this: (1) The urban outskirt wasteland is home to a great number of natural herb species. However, native plants were eradicated as weeds in urban areas, and people now prioritize selecting exotic flora for their lawns; (2) In the construction and maintenance of urban green space, people have more control over species selection and growth management of woody plants, and this intervention effect decreases with the urban centers. Therefore, existing is more difficult for native woody species than native herb species [59,60]; (3) The woods of urban foundation species were heavily planted in the urban outskirts as backup trees for the green space in the urban center. Indirectly, this decreased the discrepancy between the gradients of woody plant species, which also helped explain why the richness of woody plants was lowest on the outskirts. As a result, in urban agglomerations, the gradient effect of woody plant species was not as substantial as that of herbaceous plants [61,62].

4.2. Multiple Patterns of Plant Species Diversity along the Urban-Rural Gradient

Our findings show that regardless of city size, multiple diversity indices of woody plants and herbaceous plants displayed different trends throughout the 1 km urban-rural gradient habitats. Urban centers had the highest diversity index for woody plants but the lowest for herbaceous plants. Other studies have also discovered the distinct distribution patterns of the different life forms’ diversity indices [31]. Among the many causes of the various trends, the functional adaptations of herbaceous plants to urbanization were the most remarkable ones [29,63]. These adaptations included the survival rate of perennial herbs in the following year and the species invasion of non-native herbs in urban centers [39]. For urban planners, it must be acknowledged that herbaceous plants are crucial to niche ecosystems and careful species selection is needed.
Our findings show the regression fitting of plant diversity indicators is connected with the city’s size. In terms of woody plants, planting and management practices for woody plants in urban green spaces have altered more as a result of urban building than those for herbaceous plants [31]. On the one hand, a huge number of exotic woody plants are planted in the center of a large city to provide more ornamental value, and enough labor and funding are available for follow-up care, which is not possible in a small city. On the other hand, for herbaceous plants, a shorter building period for the small city center may explain the high degree of herb species diversity index regression [64].
Our study shows that the proportion of native and non-native species is similar across the three gradients, which is different from other studies where native plant species richness decreases and non-native plant species richness increases from urban centers to urban outskirts [33]. People tend to have more management interventions with non-native species than with native species [65], and the deliberate introduction of ornamental species means that non-native plants may escape and establish themselves in natural ecosystems [66]. This study, due to the lack of quantification of man-made factors, is unable to identify whether native and non-native species are managed differently along the urbanization gradient, which limits the analysis of the causes behind the multiple patterns that plants exhibit along the gradient. With the accumulation of managed data and the further analysis of ornamental plant species, the causes of multiple patterns will become clearer in the future, thereby adding to our understanding of the relationship between different diversity distribution patterns and ecosystem functions.

4.3. Effects of Urban Environmental Factors on Plant Diversity

Our results indicate that environmental factors such as temperature and distance from urban centers, which are directly related to urbanization, have a stronger influence on woody plants than herbaceous species, possibly because herbaceous plants are frequently cultivated beneath woody plants in urban areas. Compared with buffered understory herbaceous plants, woody plants are more directly vulnerable to climate change [67]. The pattern of woody plant diversity was more impacted by the urban heat island effect, in both native and non-native species [68,69]. According to certain research, the composition of woody plants often reflects more strongly past urban land use, and as woody flora is “catching up” with the current urban disturbance, it is more directly linked to urban environmental conditions. Because the survival of woody plants in urban areas may be heavily affected by the environment, more resistant woody plants should be planted first in urban green spaces to increase survival rates and lower management costs for urban green spaces. Our study only considered the effects of natural environmental factors on urban plant diversity, lacking consideration of human factors. With the collection of data on human factors in the future, the influencing factors on plant diversity will be more comprehensive. Furthermore, the three cities included in this study have explicit urban centers; hence, urban studies that lack clarity regarding urban centers may not be applicable.

5. Conclusions

With an emphasis on urban plant diversity, how plant diversity differs between urban gradients at the scale of urban agglomerations, how plant diversity distribution patterns have changed at the urban scale, and which environmental factors are associated with plant diversity are discussed in this paper. Understanding the answers to these queries is helpful in comprehending the current state of plant ecosystems in urban green spaces in Henan urban agglomerations.
The common species of native and non-native plant species were found to be higher across all urbanization gradients in our study, indicating that people have a similar preference for native and non-native plant species in landscape planting at different gradients. Our findings revealed that the spatial distribution patterns of the plant diversity gradient of different life forms were opposite, with the woody plant diversity indices peaking in urban centers and the herbaceous plant diversity indices being inverted. Our work implied that woody plants, whose resilience is being tested in urban green spaces, may be more sensitive to the climate change brought on by urbanization, and future focus needs to understand the variances in the mechanisms of urbanization in different plant life types better. Finally, using diverse seed selection techniques for herbaceous and woody plants is essential to increase the diversity of urban plants and to improve the stability of the urban ecosystem.

Supplementary Materials

The following supporting information can be downloaded at: https://www.mdpi.com/article/10.3390/d16010053/s1, all quadrats’ plant diversity data are provided in Table S1, and environment data are provided in Table S2.

Author Contributions

Conceptualization, R.Q.; Data curation, R.Q. and Y.C.; Formal analysis, R.Q., X.Z. and Z.L.; Funding acquisition, Y.C.; Investigation, R.Q.; Methodology, R.Q. and X.Z.; Project administration, Y.Y.; Resources, Z.L.; Software, Y.C.; Supervision, Y.Y. and Z.Y.; Validation, F.L. and Y.S.; Visualization, R.Q.; Writing—original draft, R.Q.; Writing—review and editing, D.W. and Y.C. All authors have read and agreed to the published version of the manuscript.

Funding

This work was supported by China Postdoctoral Science Foundation (2021M693400); Youth Foundation of Natural Science Foundation of Henan Province (212300410153); Young Talents project funded by Henan Agricultural University (111/30500744); The key scientific research project plan of colleges and universities in Henan Province (24A180013); Graduate Education Reform Project of Henan Province (No. 2023SJGLX203Y).

Institutional Review Board Statement

Not applicable.

Data Availability Statement

The raw data presented in this study are available on request from the corresponding author. The data are not publicly available due to the risk of potential threats to some endangered plant species.

Acknowledgments

We thank staff members of the Urban Ecosystem Biodiversity Group at Henan Agricultural University for their technical guidance. We are grateful to Yahui Wang, Zihang Shen, and Tengao Xu from the College of Life Science of Henan Agricultural University for their data collection contributions.

Conflicts of Interest

All the authors declare no competing interests.

References

  1. Díaz, J.G.; Gutiérrez-Bustillo, A.M.; Rojo, J. The phenological response of European vegetation to urbanisation is mediated by macrobioclimatic factors. Sci. Total Environ. 2023, 905, 167092. [Google Scholar] [CrossRef]
  2. Meng, L.; Mao, J.; Zhou, Y.; Richardson, A.D.; Lee, X.; Thornton, P.E.; Ricciuto, D.M.; Li, X.; Dai, Y.; Shi, X. Urban warming advances spring phenology but reduces the response of phenology to temperature in the conterminous United States. Proc. Natl. Acad. Sci. USA 2020, 117, 4228–4233. [Google Scholar] [CrossRef] [PubMed]
  3. Aronson, M.F.J.; La Sorte, F.A.; Nilon, C.H.; Katti, M.; Goddard, M.A.; Lepczyk, C.A.; Warren, P.S.; Williams, N.S.G.; Cilliers, S.; Clarkson, B.; et al. A global analysis of the impacts of urbanization on bird and plant diversity reveals key anthropogenic drivers. Proc. R. Soc. B—Biol. Sci. 2014, 281, 20133330. [Google Scholar] [CrossRef]
  4. La Sorte, F.A.; Aronson, M.F.J.; Williams, N.S.G.; Celesti-Grapow, L.; Cilliers, S.; Clarkson, B.D.; Dolan, R.W.; Hipp, A.; Klotz, S.; Kuehn, I.; et al. Beta diversity of urban floras among European and non-European cities. Glob. Ecol. Biogeogr. 2014, 23, 769–779. [Google Scholar] [CrossRef]
  5. Zhou, L.M.; Dickinson, R.E.; Tian, Y.H.; Fang, J.Y.; Li, Q.X.; Kaufmann, R.K.; Tucker, C.J.; Myneni, R.B. Evidence for a significant urbanization effect on climate in China. Proc. Natl. Acad. Sci. USA 2004, 101, 9540–9544. [Google Scholar] [CrossRef] [PubMed]
  6. Wilby, R.L.; Perry, G.L.W. Climate change, biodiversity and the urban environment: A critical review based on London, UK. Prog. Phys. Geogr.—Earth Environ. 2006, 30, 73–98. [Google Scholar] [CrossRef]
  7. Zhao, S.; Da, L.; Tang, Z.; Fang, H.; Song, K.; Fang, J. Ecological consequences of rapid urban expansion: Shanghai, China. Front. Ecol. Environ. 2006, 4, 341–346. [Google Scholar] [CrossRef]
  8. Chen, Y.; Zhou, X.; Wang, Z.; Su, X.; Liu, F.; Tian, X.; Ye, Y.; Shao, Y.; Yuan, Z. Cd contamination determined assembly processes and network stability of AM fungal communities in an urban green space ecosystem. Sci. Total Environ. 2023, 899, 166372. [Google Scholar] [CrossRef]
  9. Jochner, S.; Menzel, A. Urban phenological studies—Past, present, future. Environ. Pollut. 2015, 203, 250–261. [Google Scholar] [CrossRef]
  10. Niemelä, J.; Breuste, J.H.; Guntenspergen, G.; McIntyre, N.E.; Elmqvist, T.; James, P. Urban Ecology: Patterns, Processes, and Applications; OUP Oxford: Oxford, UK, 2011. [Google Scholar]
  11. McDonnell, M.J.; Pickett, S.T. Ecosystem structure and function along urban-rural gradients: An unexploited opportunity for ecology. Ecology 1990, 71, 1232–1237. [Google Scholar] [CrossRef]
  12. McDonnell, M.J.; Hahs, A.K. The use of gradient analysis studies in advancing our understanding of the ecology of urbanizing landscapes: Current status and future directions. Landsc. Ecol. 2008, 23, 1143–1155. [Google Scholar] [CrossRef]
  13. Burton, M.L.; Samuelson, L.J.; Pan, S. Riparian woody plant diversity and forest structure along an urban-rural gradient. Urban Ecosyst. 2005, 8, 93–106. [Google Scholar] [CrossRef]
  14. Evans, B.S.; Reitsma, R.; Hurlbert, A.H.; Marra, P.P. Environmental filtering of avian communities along a rural-to-urban gradient in Greater Washington, DC, USA. Ecosphere 2018, 9, e02402. [Google Scholar] [CrossRef]
  15. Niemela, J.; Kotze, D.J. Carabid beetle assemblages along urban to rural gradients: A review. Landsc. Urban Plan. 2009, 92, 65–71. [Google Scholar] [CrossRef]
  16. Pickett, S.T.A.; Cadenasso, M.L.; Meiners, S.J. Ever since Clements: From succession to vegetation dynamics and understanding to intervention. Appl. Veg. Sci. 2009, 12, 9–21. [Google Scholar] [CrossRef]
  17. Zipperer, W.C.; Wu, J.; Pouyat, R.V.; Pickett, S.T. The application of ecological principles to urban and urbanizing landscapes. Ecol. Appl. 2000, 10, 685–688. [Google Scholar] [CrossRef]
  18. Luck, M.; Wu, J.G. A gradient analysis of urban landscape pattern: A case study from the Phoenix metropolitan region, Arizona, USA. Landsc. Ecol. 2002, 17, 327–339. [Google Scholar] [CrossRef]
  19. Whittaker, R.H.; Niering, W.A. Vegetation of the Santa Catalina Mountains, Arizona: A gradient analysis of the south slope. Ecology 1965, 46, 429–452. [Google Scholar] [CrossRef]
  20. Aronson, M.F.J.; Nilon, C.H.; Lepczyk, C.A.; Parker, T.S.; Warren, P.S.; Cilliers, S.S.; Goddard, M.A.; Hahs, A.K.; Herzog, C.; Katti, M.; et al. Hierarchical filters determine community assembly of urban species pools. Ecology 2016, 97, 2952–2963. [Google Scholar] [CrossRef]
  21. Guenard, G.; Legendre, P. Hierarchical Clustering with Contiguity Constraint in R. J. Stat. Softw. 2022, 103, 1–26. [Google Scholar] [CrossRef]
  22. Gödde, M.; Richarz, N.; Walter, B. Habitat conservation and development in the city of Düsseldorf, Germany. Urban Ecol. Basis Urban Plan. 1995, 163–171. [Google Scholar]
  23. Knapp, S.; Kuehn, I.; Schweiger, O.; Klotz, S. Challenging urban species diversity: Contrasting phylogenetic patterns across plant functional groups in Germany. Ecol. Lett. 2008, 11, 1054–1064. [Google Scholar] [CrossRef]
  24. Kuhn, I.; Brandl, R.; Klotz, S. The flora of German cities is naturally species rich. Evol. Ecol. Res. 2004, 6, 749–764. [Google Scholar]
  25. Kowarik, I. On the role of alien species in urban flora and vegetation. In Urban Ecology: An International Perspective on the Interaction between Humans and Nature; Springer: Berlin/Heidelberg, Germany, 2008; pp. 321–338. [Google Scholar]
  26. Ranta, P.; Viljanen, V. Vascular plants along an urban-rural gradient in the city of Tampere, Finland. Urban Ecosyst. 2011, 14, 361–376. [Google Scholar] [CrossRef]
  27. Stenchly, K.; Lippmann, S.; Waongo, A.; Nyarko, G.; Buerkert, A. Weed species structural and functional composition of okra fields and field periphery under different management intensities along the rural-urban gradient of two West African cities. Agric. Ecosyst. Environ. 2017, 237, 213–223. [Google Scholar] [CrossRef]
  28. Tian, Z.; Song, K.; Da, L. Distribution patterns and traits of weed communities along an urban-rural gradient under rapid urbanization in Shanghai, China. Weed Biol. Manag. 2015, 15, 27–41. [Google Scholar] [CrossRef]
  29. Vakhlamova, T.; Rusterholz, H.-P.; Kanibolotskaya, Y.; Baur, B. Changes in plant diversity along an urban-rural gradient in an expanding city in Kazakhstan, Western Siberia. Landsc. Urban Plan. 2014, 132, 111–120. [Google Scholar] [CrossRef]
  30. Walker, J.S.; Grimm, N.B.; Briggs, J.M.; Gries, C.; Dugan, L. Effects of urbanization on plant species diversity in central Arizona. Front. Ecol. Environ. 2009, 7, 465–470. [Google Scholar] [CrossRef]
  31. Wang, M.; Li, J.; Kuang, S.; He, Y.; Chen, G.; Huang, Y.; Song, C.; Anderson, P.; Lowicki, D. Plant Diversity along the Urban-Rural Gradient and Its Relationship with Urbanization Degree in Shanghai, China. Forests 2020, 11, 171. [Google Scholar] [CrossRef]
  32. Cariñanos, P.; Casares-Porcel, M. Urban green zones and related pollen allergy: A review. Some guidelines for designing spaces with low allergy impact. Landsc. Urban Plan. 2011, 101, 205–214. [Google Scholar] [CrossRef]
  33. Aronson, M.F.J.; Handel, S.N.; La Puma, I.P.; Clemants, S.E. Urbanization promotes non-native woody species and diverse plant assemblages in the New York metropolitan region. Urban Ecosyst. 2015, 18, 31–45. [Google Scholar] [CrossRef]
  34. Cui, Y.C.; Song, K.; Guo, X.Y.; van Bodegom, P.M.; Pan, Y.J.; Tian, Z.H.; Chen, X.S.; Wang, J.; Da, L.J. Phylogenetic and functional structures of plant communities along a spatiotemporal urbanization gradient: Effects of colonization and extinction. J. Veg. Sci. 2019, 30, 341–351. [Google Scholar] [CrossRef]
  35. Yang, Y.; Fujihara, M.; Li, B.; Yuan, X.; Hara, K.; Da, L.; Tomita, M.; Zhao, Y. Structure and diversity of remnant natural evergreen broad-leaved forests at three sites affected by urbanization in Chongqing metropolis, Southwest China. Landsc. Ecol. Eng. 2014, 10, 137–149. [Google Scholar] [CrossRef]
  36. Grimm, N.B.; Faeth, S.H.; Golubiewski, N.E.; Redman, C.L.; Wu, J.; Bai, X.; Briggs, J.M. Global change and the ecology of cities. Science 2008, 319, 756–760. [Google Scholar] [CrossRef] [PubMed]
  37. Lopez, B.E.; Urban, D.; White, P.S. Testing the effects of four urbanization filters on forest plant taxonomic, functional, and phylogenetic diversity. Ecol. Appl. 2018, 28, 2197–2205. [Google Scholar] [CrossRef] [PubMed]
  38. Palma, E.; Catford, J.A.; Corlett, R.T.; Duncan, R.P.; Hahs, A.K.; McCarthy, M.A.; McDonnell, M.J.; Thompson, K.; Williams, N.S.G.; Vesk, P.A. Functional trait changes in the floras of 11 cities across the globe in response to urbanization. Ecography 2017, 40, 875–886. [Google Scholar] [CrossRef]
  39. Ramalho, C.E.; Laliberte, E.; Poot, P.; Hobbs, R.J. Complex effects of fragmentation on remnant woodland plant communities of a rapidly urbanizing biodiversity hotspot. Ecology 2014, 95, 2466–2478. [Google Scholar] [CrossRef]
  40. Chalker-Scott, L. Nonnative, noninvasive woody species can enhance urban landscape biodiversity. Arboric. Urban For. 2015, 41, 173–186. [Google Scholar] [CrossRef]
  41. Helden, A.J.; Stamp, G.C.; Leather, S.R. Urban biodiversity: Comparison of insect assemblages on native and non-native trees. Urban Ecosyst. 2012, 15, 611–624. [Google Scholar] [CrossRef]
  42. Liu, D.; Semenchuk, P.; Essl, F.; Lenzner, B.; Moser, D.; Blackburn, T.M.; Cassey, P.; Biancolini, D.; Capinha, C.; Dawson, W. The impact of land use on non-native species incidence and number in local assemblages worldwide. Nat. Commun. 2023, 14, 2090. [Google Scholar] [CrossRef]
  43. Lin, J.; Wang, Q.; Li, X. Socioeconomic and spatial inequalities of street tree abundance, species diversity, and size structure in New York City. Landsc. Urban Plan. 2021, 206, 103992. [Google Scholar] [CrossRef]
  44. Peng, Y.; Mi, K.; Wang, H.; Liu, Z.; Lin, Y.; Sang, W.; Cui, Q. Most suitable landscape patterns to preserve indigenous plant diversity affected by increasing urbanization: A case study of Shunyi District of Beijing, China. Urban For. Urban Green. 2019, 38, 33–41. [Google Scholar] [CrossRef]
  45. Cao, Y.; Natuhara, Y. Effect of urbanization on vegetation in riparian area: Plant communities in artificial and semi-natural habitats. Sustainability 2019, 12, 204. [Google Scholar] [CrossRef]
  46. Alue, B.A.; Salleh Hudin, N.; Mohamed, F.; Mat Said, Z.; Ismail, K. Plant Diversity along an Urbanization Gradient of a Tropical City. Diversity 2022, 14, 1024. [Google Scholar] [CrossRef]
  47. Rebelo, A.; Holmes, P.; Dorse, C.; Wood, J. Impacts of urbanization in a biodiversity hotspot: Conservation challenges in Metropolitan Cape Town. S. Afr. J. Bot. 2011, 77, 20–35. [Google Scholar] [CrossRef]
  48. Marcacci, G.; Westphal, C.; Rao, V.S.; Kumar, S.S.; Tharini, K.; Belavadi, V.V.; Nölke, N.; Tscharntke, T.; Grass, I. Urbanization alters the spatiotemporal dynamics of plant–pollinator networks in a tropical megacity. Ecol. Lett. 2023, 26, 1951–1962. [Google Scholar] [CrossRef] [PubMed]
  49. Muratet, A.; Porcher, E.; Devictor, V.; Arnal, G.; Moret, J.; Wright, S.; Machon, N. Evaluation of floristic diversity in urban areas as a basis for habitat management. Appl. Veg. Sci. 2008, 11, 451–460. [Google Scholar] [CrossRef]
  50. Benayas, R.; José, M.; Scheiner, S.M. Plant diversity, biogeography and environment in Iberia: Patterns and possible causal factors. J. Veg. Sci. 2002, 13, 245–258. [Google Scholar] [CrossRef]
  51. Chesson, P. Mechanisms of maintenance of species diversity. Annu. Rev. Ecol. Syst. 2000, 31, 343–366. [Google Scholar] [CrossRef]
  52. Hale, S.E.; Edwards, C. Comparison of film and digital hemispherical photography across a wide range of canopy densities. Agric. For. Meteorol. 2002, 112, 51–56. [Google Scholar] [CrossRef]
  53. Oksanen, J.; Blanchet, F.; Kindt, R.; Legendre, P.; Minchin, P.; O’Hara, R.; Simpson, G.; Solymos, P.; Stevens, M.; Wagner, H. Vegan: Community Ecology Package. Available online: https://cran.r-project.org/web/packages/vegan/vegan.pdf (accessed on 8 June 2022).
  54. Villanueva, R.A.M.; Chen, Z.J. ggplot2: Elegant Graphics for Data Analysis; Taylor & Francis: Abingdon, UK, 2019. [Google Scholar]
  55. Hollister, E.B.; Engledow, A.S.; Hammett, A.J.M.; Provin, T.L.; Wilkinson, H.H.; Gentry, T.J. Shifts in microbial community structure along an ecological gradient of hypersaline soils and sediments. ISME J. 2010, 4, 829–838. [Google Scholar] [CrossRef]
  56. Wang, H.-F.; MacGregor-Fors, I.; Lopez-Pujol, J. Warm-temperate, immense, and sprawling: Plant diversity drivers in urban Beijing, China. Plant Ecol. 2012, 213, 967–992. [Google Scholar] [CrossRef]
  57. Capuana, M. A review of the performance of woody and herbaceous ornamental plants for phytoremediation in urban areas. Iforest-Biogeosci. For. 2020, 13, 139–151. [Google Scholar] [CrossRef]
  58. Gregg, J.W.; Jones, C.G.; Dawson, T.E. Urbanization effects on tree growth in the vicinity of New York City. Nature 2003, 424, 183–187. [Google Scholar] [CrossRef]
  59. Cochard, A.; Pithon, J.; Braud, F.; Beaujouan, V.; Bulot, A.; Daniel, H. Intraspecific trait variation in grassland plant communities along urban-rural gradients. Urban Ecosyst. 2019, 22, 583–591. [Google Scholar] [CrossRef]
  60. Yang, J.; Luo, X.; Lu, S.; Yang, Y.; Yang, J. Effects of compositional and configurational heterogeneity of the urban matrix on the species richness of woody plants in urban remnant forest patches. Landsc. Ecol. 2022, 37, 619–632. [Google Scholar] [CrossRef]
  61. Coban, S.; Yener, S.D.; Bayraktar, S. Woody plant composition and diversity of urban green spaces in Istanbul, Turkey. Plant Biosyst. 2021, 155, 83–91. [Google Scholar] [CrossRef]
  62. Cochard, A.; Pithon, J.; Jagaille, M.; Beaujouan, V.; Pain, G.; Daniel, H. Grassland plant species occurring in extensively managed road verges are filtered by urban environments. Plant Ecol. Divers. 2017, 10, 217–229. [Google Scholar] [CrossRef]
  63. Ramalho, C.E.; Laliberte, E.; Poot, P.; Hobbs, R. Effects of fragmentation on the plant functional composition and diversity of remnant woodlands in a young and rapidly expanding city. J. Veg. Sci. 2018, 29, 285–296. [Google Scholar] [CrossRef]
  64. Concepción, E.D.; Obrist, M.K.; Moretti, M.; Altermatt, F.; Baur, B.; Nobis, M.P. Impacts of urban sprawl on species richness of plants, butterflies, gastropods and birds: Not only built-up area matters. Urban Ecosyst. 2015, 19, 225–242. [Google Scholar] [CrossRef]
  65. Chang, C.-R.; Chen, M.-C.; Su, M.-H. Natural versus human drivers of plant diversity in urban parks and the anthropogenic species-area hypotheses. Landsc. Urban Plan. 2021, 208, 104023. [Google Scholar] [CrossRef]
  66. Bayón, Á.; Godoy, O.; Maurel, N.; van Kleunen, M.; Vilà, M. Proportion of non-native plants in urban parks correlates with climate, socioeconomic factors and plant traits. Urban For. Urban Green. 2021, 63, 127215. [Google Scholar] [CrossRef]
  67. Li, D.; Barve, N.; Brenskelle, L.; Earl, K.; Barve, V.; Belitz, M.W.; Doby, J.; Hantak, M.M.; Oswald, J.A.; Stucky, B.J.; et al. Climate, urbanization, and species traits interactively drive flowering duration. Glob. Chang. Biol. 2021, 27, 892–903. [Google Scholar] [CrossRef] [PubMed]
  68. Arruda, L.J.; Ranieri, B.D.; Cheib, A.L.; Morellato, L.P.C.; Fernandes, G.W.; Negreiros, D. Phenological behavior of herbaceous and woody species in the highly threatened Ironstone Rupestrian Grasslands. S. Afr. J. Bot. 2021, 140, 135–142. [Google Scholar] [CrossRef]
  69. Zhou, W.; Huang, G.; Pickett, S.T.A.; Wang, J.; Cadenasso, M.L.; McPhearson, T.; Grove, J.M.; Wang, J. Urban tree canopy has greater cooling effects in socially vulnerable communities in the US. One Earth 2021, 4, 1764–1775. [Google Scholar] [CrossRef]
Figure 1. Distribution of quadrats set in urban centers (red circles), urban suburbs (yellow circles), and urban outskirts (green circles). A total of 176 quadrats were sampled, including 98 quadrats in Zhengzhou, 47 quadrats in Kaifeng, and 31 quadrats in Zhongmu County.
Diversity 16 00053 g001
Figure 2. Richness of plant family, genus, and species in different urbanization gradients.
Diversity 16 00053 g002
Figure 3. Differences between native species and non-native species in the urbanization gradients.
Diversity 16 00053 g003
Figure 4. Association of plants’ taxonomic category in different urbanization gradients. The quadrats were divided into three gradients, namely, urban center, urban suburbs, and urban outskirts, after space-constrained hierarchical clustering.
Diversity 16 00053 g004
Figure 5. Principal Co-ordinates Analysis of quadrat vegetation in different urbanization gradients.
Diversity 16 00053 g005
Figure 6. Radar chart analysis of quadrat vegetation in different urbanization gradients.
Diversity 16 00053 g006
Figure 7. Woody plant diversity spatial patterns in different cities along the west-east (W-E) and south-north (S-N) axes.
Diversity 16 00053 g007
Figure 8. Spatial patterns of herbaceous plant diversity indices along the 1 km gradients in different cities.
Diversity 16 00053 g008
Figure 9. Correlation analysis of different environmental factors. (Note: − means negative correlation; *, **, and *** indicate the significance at p = 0.05, p = 0.01, and p = 0.001).
Diversity 16 00053 g009
Figure 10. Correlations between all plants, woody plants, and herbaceous plants and environmental factors in different urbanization gradients. The pairwise correlation of environmental factors is shown in the upper right corner. Pearson’s correlation coefficient is represented by a color gradient. The line width represents the relevant Mantel r statistic, and the color represents the correlation coefficient of Mantel p. Distance: the distance from the urban center VisSky, total transmittance ratio GndCover, tree-crown projected area. LAI, leaf area index. MLA, mean leaf angle.
Diversity 16 00053 g010
Disclaimer/Publisher’s Note: The statements, opinions and data contained in all publications are solely those of the individual author(s) and contributor(s) and not of MDPI and/or the editor(s). MDPI and/or the editor(s) disclaim responsibility for any injury to people or property resulting from any ideas, methods, instructions or products referred to in the content.

