Article

Nationwide Tracing of Two Top Freshwater Fish Invaders in Greece Using Environmental DNA Sampling

1
Institute of Marine Biological Resources and Inland Waters, Hellenic Centre for Marine Research, 19013 Anavissos, Greece
2
Bristol Zoological Society, Bristol Zoo Gardens, Bristol BS8 3HA, UK
3
Centre for Research in Biosciences, University of the West of England, Coldharbour Lane, Bristol BS16 9QY, UK
4
Wildfowl & Wetlands Trust (WWT), Slimbridge, Gloucester GL2 7BT, UK
*
Author to whom correspondence should be addressed.
Diversity 2024, 16(1), 28; https://doi.org/10.3390/d16010028
Submission received: 24 November 2023 / Revised: 19 December 2023 / Accepted: 28 December 2023 / Published: 31 December 2023

Abstract

:
Alien fish invasions are causing devastating impacts on native freshwater fauna; thus, rigorous, non-invasive and cost-effective biomonitoring of lotic and lentic freshwaters to design and implement appropriate prevention and control measures is now a priority. In this study, we used a species-specific qPCR eDNA assay to monitor two of the most invasive fish species (Gambusia holbrooki and Pseudorasbora parva) in 15 river basins of Greece and validated these results with conventional fish sampling as well as existing field sampling data. Our monitoring provided new records of invasive species indicating basins for rigorous future monitoring and possible eradication attempts. The eDNA proved more sensitive as a detection tool (56% detection rate) compared to conventional electrofishing (50% detection rate) for G. holbrooki. In contrast, it proved less sensitive for detecting P. parva (38% accuracy) compared to electrofishing (44% accuracy), as evident by the two locations where the eDNA failed to detect the target species. Our study illustrates the potential of the eDNA method for regular, standardised monitoring of riverine habitats for invasive fish species by local managers for early detection. Finally, we discuss the application of eDNA in management interventions for identifying invasive species’ hotspots for management prioritisation, for early detection of invaders and for the monitoring of eradication/control actions.

1. Introduction

The ‘Anthropocene’ era is characterised by global biodiversity loss at an unprecedented scale [1,2], with population declines of freshwater biota far outpacing contemporaneous declines in marine or terrestrial groups [3,4]. An important driver of the global biodiversity crisis is biological invasions, often coupled with habitat degradation [3,4,5,6,7]. Though the synergies with habitat destruction are often difficult to disentangle (see [8]), accumulating evidence indicates that invasive species are directly responsible for native species populations’ localised extinctions [9,10].
In freshwater ecosystems, introductions of alien fish species occur via a wide array of vectors, including recreational fishing, aquaculture, ornamental trade and biological control, often followed by natural spread through transboundary waterways [11]. These invasions cause shifts in native species’ communities, affect their genetic make-up and behaviour and also impact ecosystem functioning through alterations in nutrient cycling [7]. At local, national and continental levels, the design and implementation of appropriate prevention and control measures for invasive species requires rigorous monitoring of recipient and/or potential recipient ecosystems for their introduction and spread. Increasingly, this is being conducted using novel molecular methods such as environmental DNA (eDNA). These methods can be robust, non-invasive, efficient and cost-effective for monitoring fish species’ distributions when compared to conventional fish monitoring tools such as electrofishing, netting or trapping [12]. Species-specific eDNA biomonitoring, utilising quantitative PCR (qPCR), has further been shown to have better limits of detection for individual species than metabarcoding eDNA techniques [13]. It does, however, have limitations related to waterbody characteristics, such as flow, temperature, chemistry and extreme events such as rainfalls or floods inducing dilution, as well as being impacted by environmental inhibition [13,14,15].
In Greece, the environmental DNA method was only recently applied for the first time in lowland riverine systems of Western Greece, targeting two rare and threatened killifish species (as well as their alien competitor, the eastern mosquitofish Gambusia holbrooki) with high efficacy [16]. In the current study, we widen the scope of our survey targeting two top global fish invaders at a national scale: the eastern mosquitofish G. holbrooki and the topmouth gudgeon (or stone moroko) Pseudorasbora parva, sampling 16 locations in a total of 15 river basins of Greece. The eastern mosquitofish is globally one of the most worrying invasive vertebrates [17], directly affecting and displacing native fish species through trophic competition, agonistic interactions and/or predation [18]. The eastern mosquitofish has been introduced worldwide as a biological agent for mosquito control inhabiting standing to slow flowing waters, mostly in lowland areas [17]. In Greece, the species is the most widespread alien species found in lotic and lentic ecosystems [19,20]. The species is highly invasive due to its rapid growth, high reproductive rate, viviparity, high behavioural and trophic plasticity and its adaptability to a wide range of, often degraded, environmental conditions. The topmouth gudgeon is also an extremely invasive and harmful alien species, spreading rapidly in Greek rivers and lakes in recent years, competing trophically with native fish species [19,20]. The species exhibits significant plasticity and adaptability to different climatic conditions, new food resources and egg-laying substrates, high reproductive effort and provision of parental care, and a natural ability to cope with new pathogens. Both the eastern mosquitofish and the topmouth gudgeon are listed on the EU Alien Invasive Species list as species of Union concern.
The aim of this work was to conduct, for the first time, a nationwide assessment of the expansion range of G. holbrooki and P. parva at a number of Greek basins using eDNA, validating these results with conventional fish sampling as well as existing field sampling data.

2. Materials and Methods

2.1. Water Sampling and Data Collection

Sampling for eDNA was conducted in October 2020 at 15 basins of Greece (16 sampling sites). At each sampling site, three independent (max 1 L) water samples were collected using a sterile polypropylene ladle and placed into a sterile plastic bag (Whirl-Pak® 1242 mL Stand-Up Bag Merck®, Darmstadt, Germany). Each independent sample consisted of pooling multiple water subsamples collected from across the width of the river by moving upstream in order to avoid disturbing the sediments. Samples from each location were then filtered with a 50 mL syringe (sterile Luer-Lock™ BD Plastipak™,MedGuard, Ashbourne, Co. Meath, Ireland) through a sterile 0.45 μm Sterivex™ HV filter (Sterivex™ filter unit, HV with luer-lock outlet, Merck®, Millipore®, Darmstadt, Germany). Sterivex filters were then immediately fixed with 2 mL of absolute ethanol as a buffer and stored at room temperature until the end of the fieldtrip (maximum of five days). Sterile equipment and disposable nitrile gloves were used during the sampling process and replaced at each location to avoid contamination. For a more detailed description of the sampling procedure, see a previous study [16].
At each sampling site, a series of physicochemical and habitat parameters were also recorded. Specifically, conductivity (μS/cm), salinity (ppt), pH, D.O. (%) and water temperature (°C) were recorded in situ using a portable multiparameter Aquaprobe AP-200. Depth (mean, m) was recorded with a probe, water flow (mean, m/s) with a flowmeter and turbidity (NTU) with a turbidity meter. Additional habitat characteristics assessed included mean wetted width (in meters), shadedness (expressed as a percentage), substrate coarseness (i.e., particles ≥ 63 mm) and the presence of helophytes and bottom vegetation. The last two variables, being categorical in nature, were delineated by five levels for helophytes (missing, isolated rare, sparse, intermediate, rich) and four levels for bottom vegetation (missing, sparse, intermediate, rich). Finally, the percentage of different habitat types, i.e., slow flowing pool and glide habitats versus faster flowing run and riffle habitats, were also recorded for each study site.
Fish abundance data were collected using electrofishing with an EFKO electrofishing DC unit following the European protocol CEN [21] either immediately after eDNA sampling in October 2020 or during the preceding summer (July–September 2020) as part of the implementation of the National Monitoring Programme (2017–2023) of the ecological quality status of surface waters for the WFD 2000/60. Captured fish were identified to the species level, counted and then released into the water. At each site, total sampling area was recorded to calculate fish density, expressed as the number of fish caught per square meter. Detection rate through electrofishing (i.e., percentage of sites the target species presence was confirmed through this method) was calculated. At two locations, fin clips from the two target species (10 clips) were obtained for the DNA analysis, and the fish were returned to the water alive.

2.2. eDNA Analysis

eDNA analysis methods followed a previous study [16] with some adaptations; we also utilised the validated qPCR assay for G. holbrooki described by that study. Novel species-specific primers and probes were designed for P. parva using pre-existing sequences available via GenBank and targeting the cytochrome B gene (CytB). The primers and probe were developed using the NCBI Primer-BLAST function (https://blast.ncbi.nlm.nih.gov/Blast.cgi accessed on 8 February 2021); following a previous study [22]) and the freely available online tool PrimerQuestTM (https://eu.idtdna.com/pages/tools/primerquest, accessed on 8 February 2021).
The specificity of the assay was tested in silico against DNA sequences retrieved from the NCBI database (National Centre for Biotechnology Information; https://www.ncbi.nlm.nih.gov/, accessed on 8 February 2021) from 29 fish species known to be and/or potentially present in the same ecosystems with the targeted organisms (see supplementary information for more details). Following in silico validation, the specificity of each assay was tested in vitro with qPCR using DNA extracted from the following co-occurring species: Alburnoides economoui, Alburnus macedonicus, Alburnus vistonicus, Barbus euboicus, Barbus sperchiensis, Carassius gibelio, Gasterosteus gymnurus, Knipowitschia thessala, Lepomis gibbosus, Pelasgus marathonicus, Phoxinus strymonicus, Salmo peristericus, Squalius vardarensis and Telestes beoticus. DNA was extracted from tissue samples of these species using the Qiagen DNeasy® Blood and Tissue Kit following the manufacturer’s instructions.
eDNA was extracted from the filters with the same type of kit following the extraction workflow for Sterivex filters outlined previously [23]. Extraction of eDNA samples was performed in a separate, clean, PCR-free room independent from the room for handling the tissue samples.
Primer specificity was assessed using PCR before conducting qPCR. qPCR reactions were performed on an ABI StepOnePlus™ Real-Time PCR (Applied Biosystems, Waltham, Massachusetts, USA). The specificity of each assay was further confirmed by qPCR using two replicates of DNA extracted from the species mentioned above. qPCR protocols and conditions were the same across all target species. These consisted of a 15 μL final volume, using 7.5 μL of qPCRBIO Probe Mix Hi-ROX (PCR Biosystems, London, UK), 0.3 μL of each primer, 0.15 μL of probe, 4.75 μL of ddH2O and 2 μL of extracted DNA. Concentrations of primer and probe were 10 Nm/L. The reactions were run on a fast presence/absence test using the following cycling parameters: 2 min denaturation at 95 °C followed by 45 cycling steps of 5 s at 95 °C and 20 s at 62 °C for G. holbrooki and 61 °C for P. parva (adapted from a previous study [24]).
Each PCR plate included a prepared serial dilution of standard of genomic DNA, extracted from the target species’ tissue using the protocol described earlier in triplicate [24]. The concentration of the standard was confirmed using a Qubit 4.0 Fluorometer (Thermo Fisher Scientific, Waltham, MA, USA). The standards, typically seven per plate, provide a regression line from which the unknown quantities of the DNA extracts can be estimated. A positive result was recorded for each sample if amplification reached the Ct threshold (i.e., the cycle number at which a sample’s reaction crosses a fluorescence threshold, indicating the detection of the target nucleic acid) in one or more of the PCR replicates. The dilution series ranged from 10−1 to 10−8 using ten replicates per plate per dilution step, allowing for the assessment of the limit of detection (LOD) and limit of quantification (LOQ) as detailed previously [25,26]. All eDNA samples were analysed using three field replicates and four technical replicates (overall number of replicates = twelve per location). Each qPCR plate also contained three replicates of six dilution points ranging from 10−3 to 10−8 as a positive control and three negative controls using DNA-free water in place of the sample (See Tables S1 and S2). Detection rate through eDNA (i.e., percentage of sites at which the target species presence was detected through this method) was calculated.

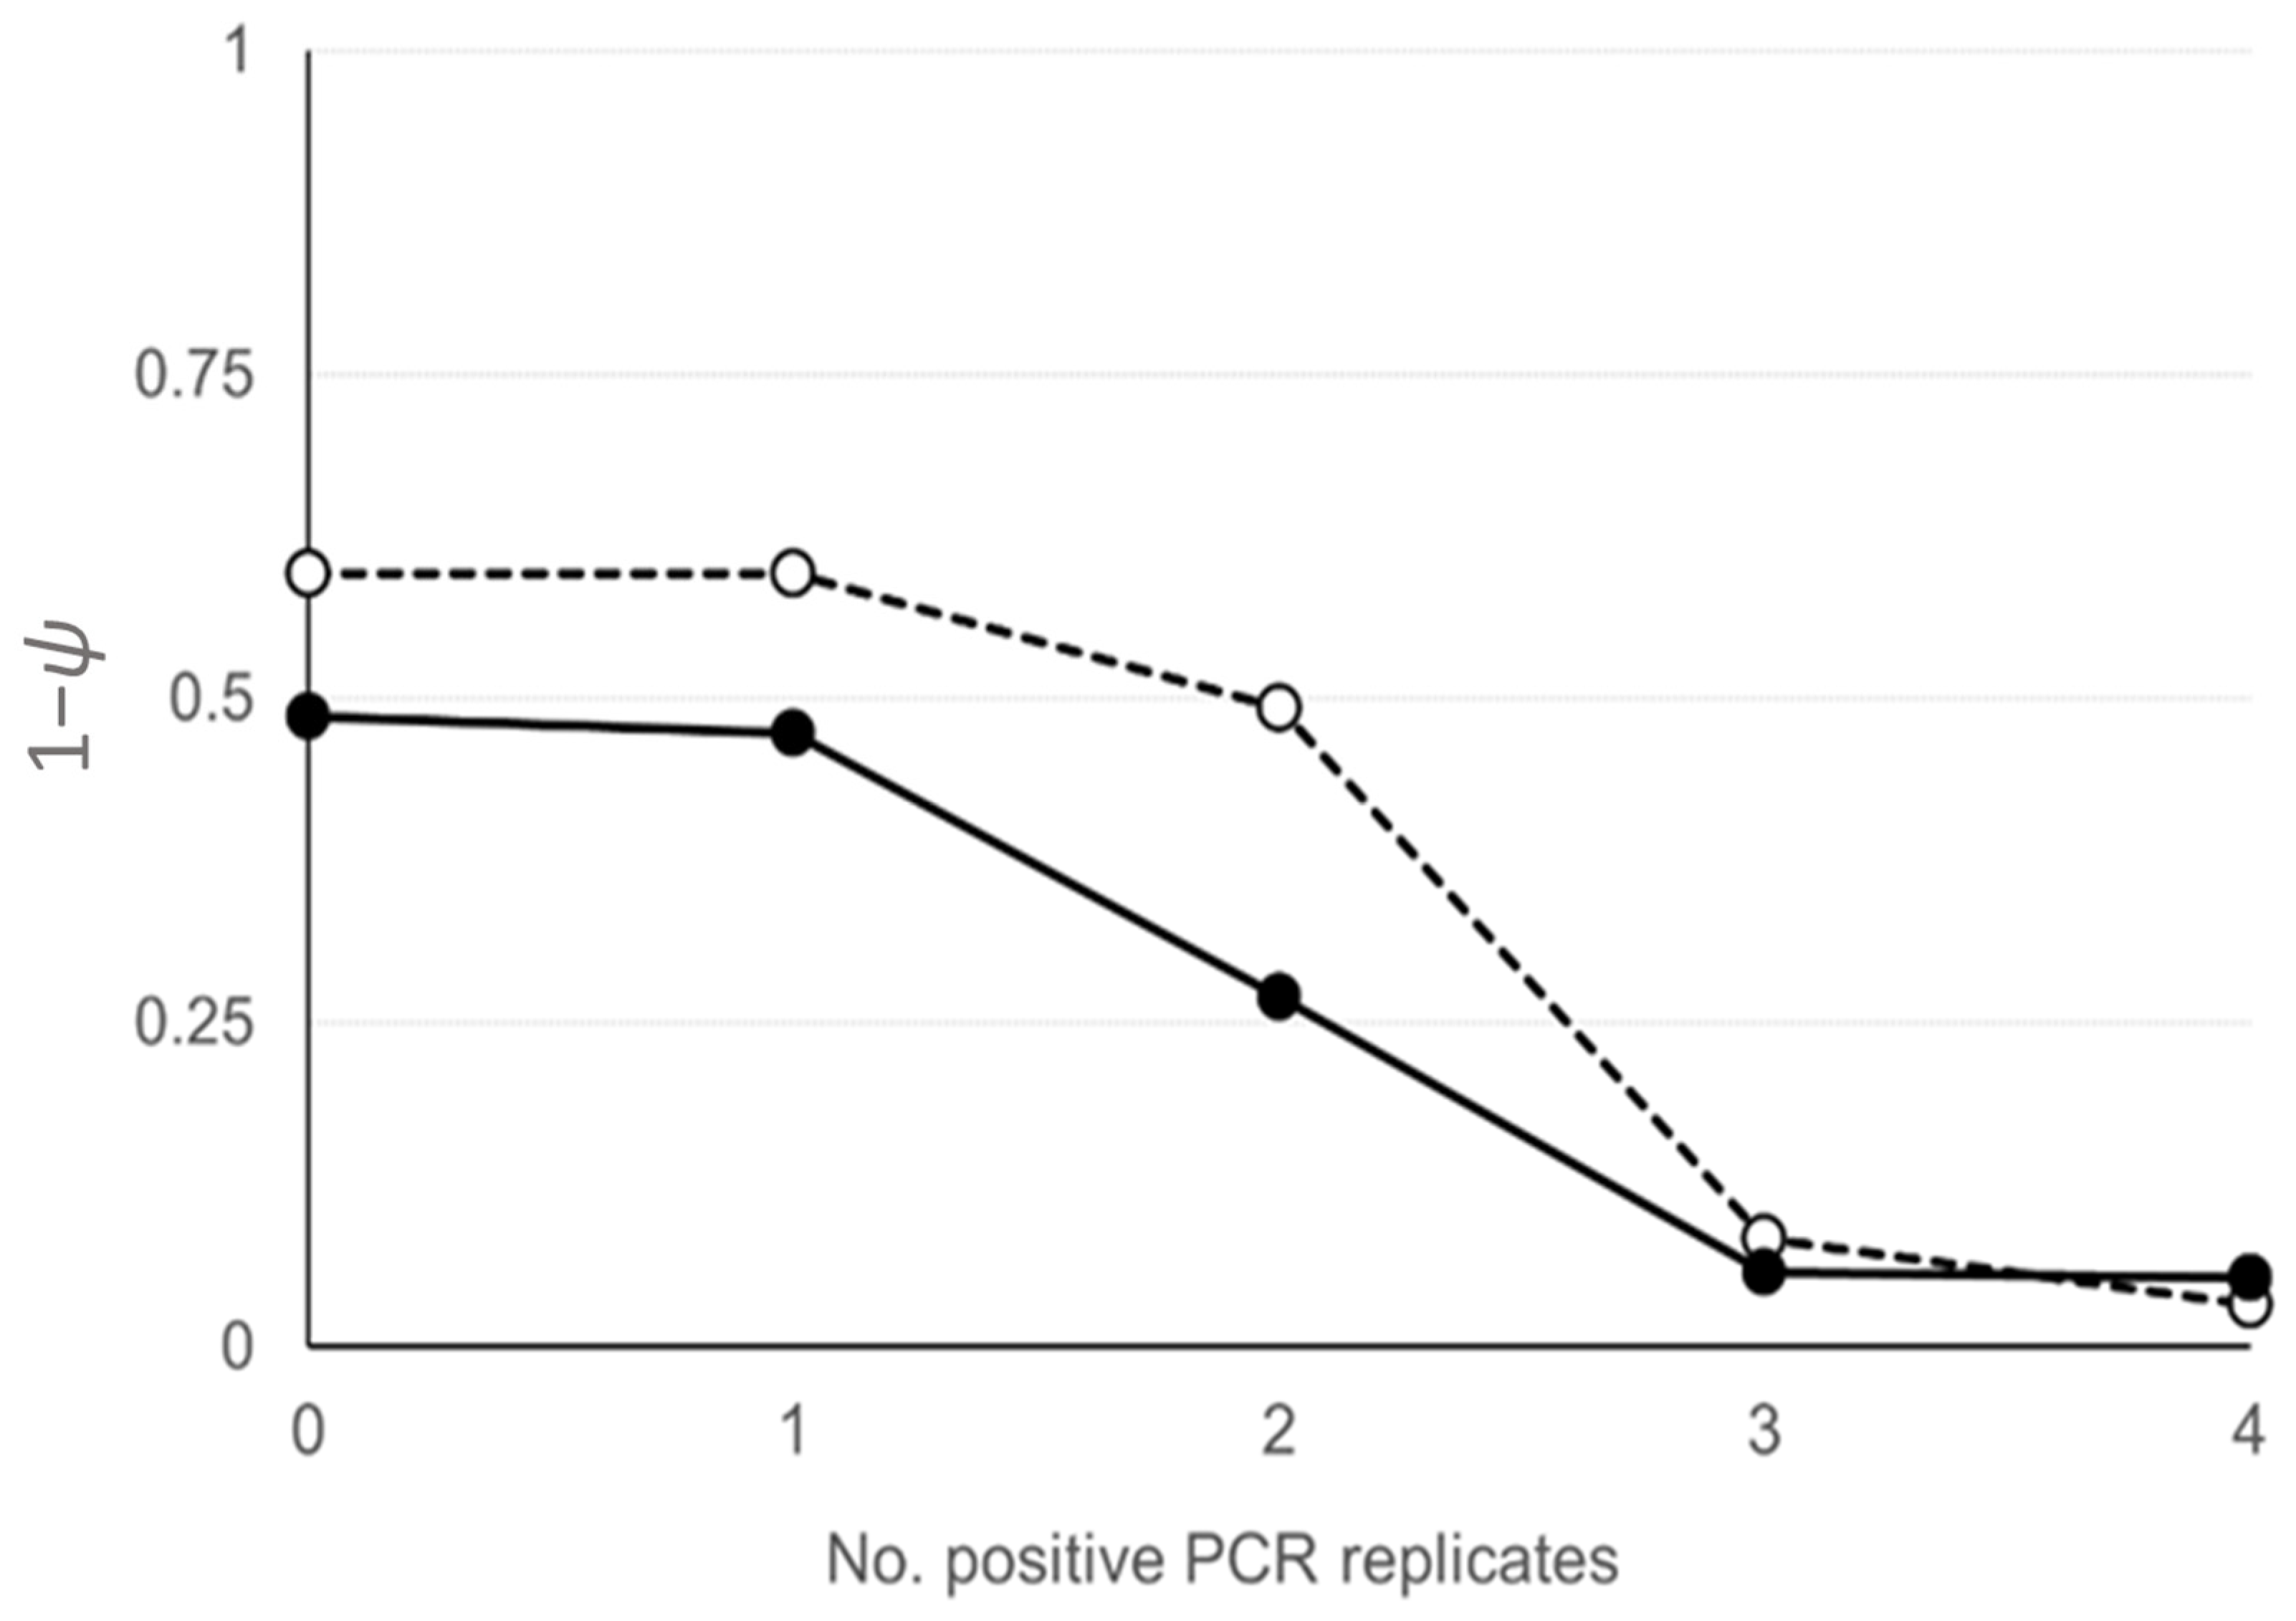
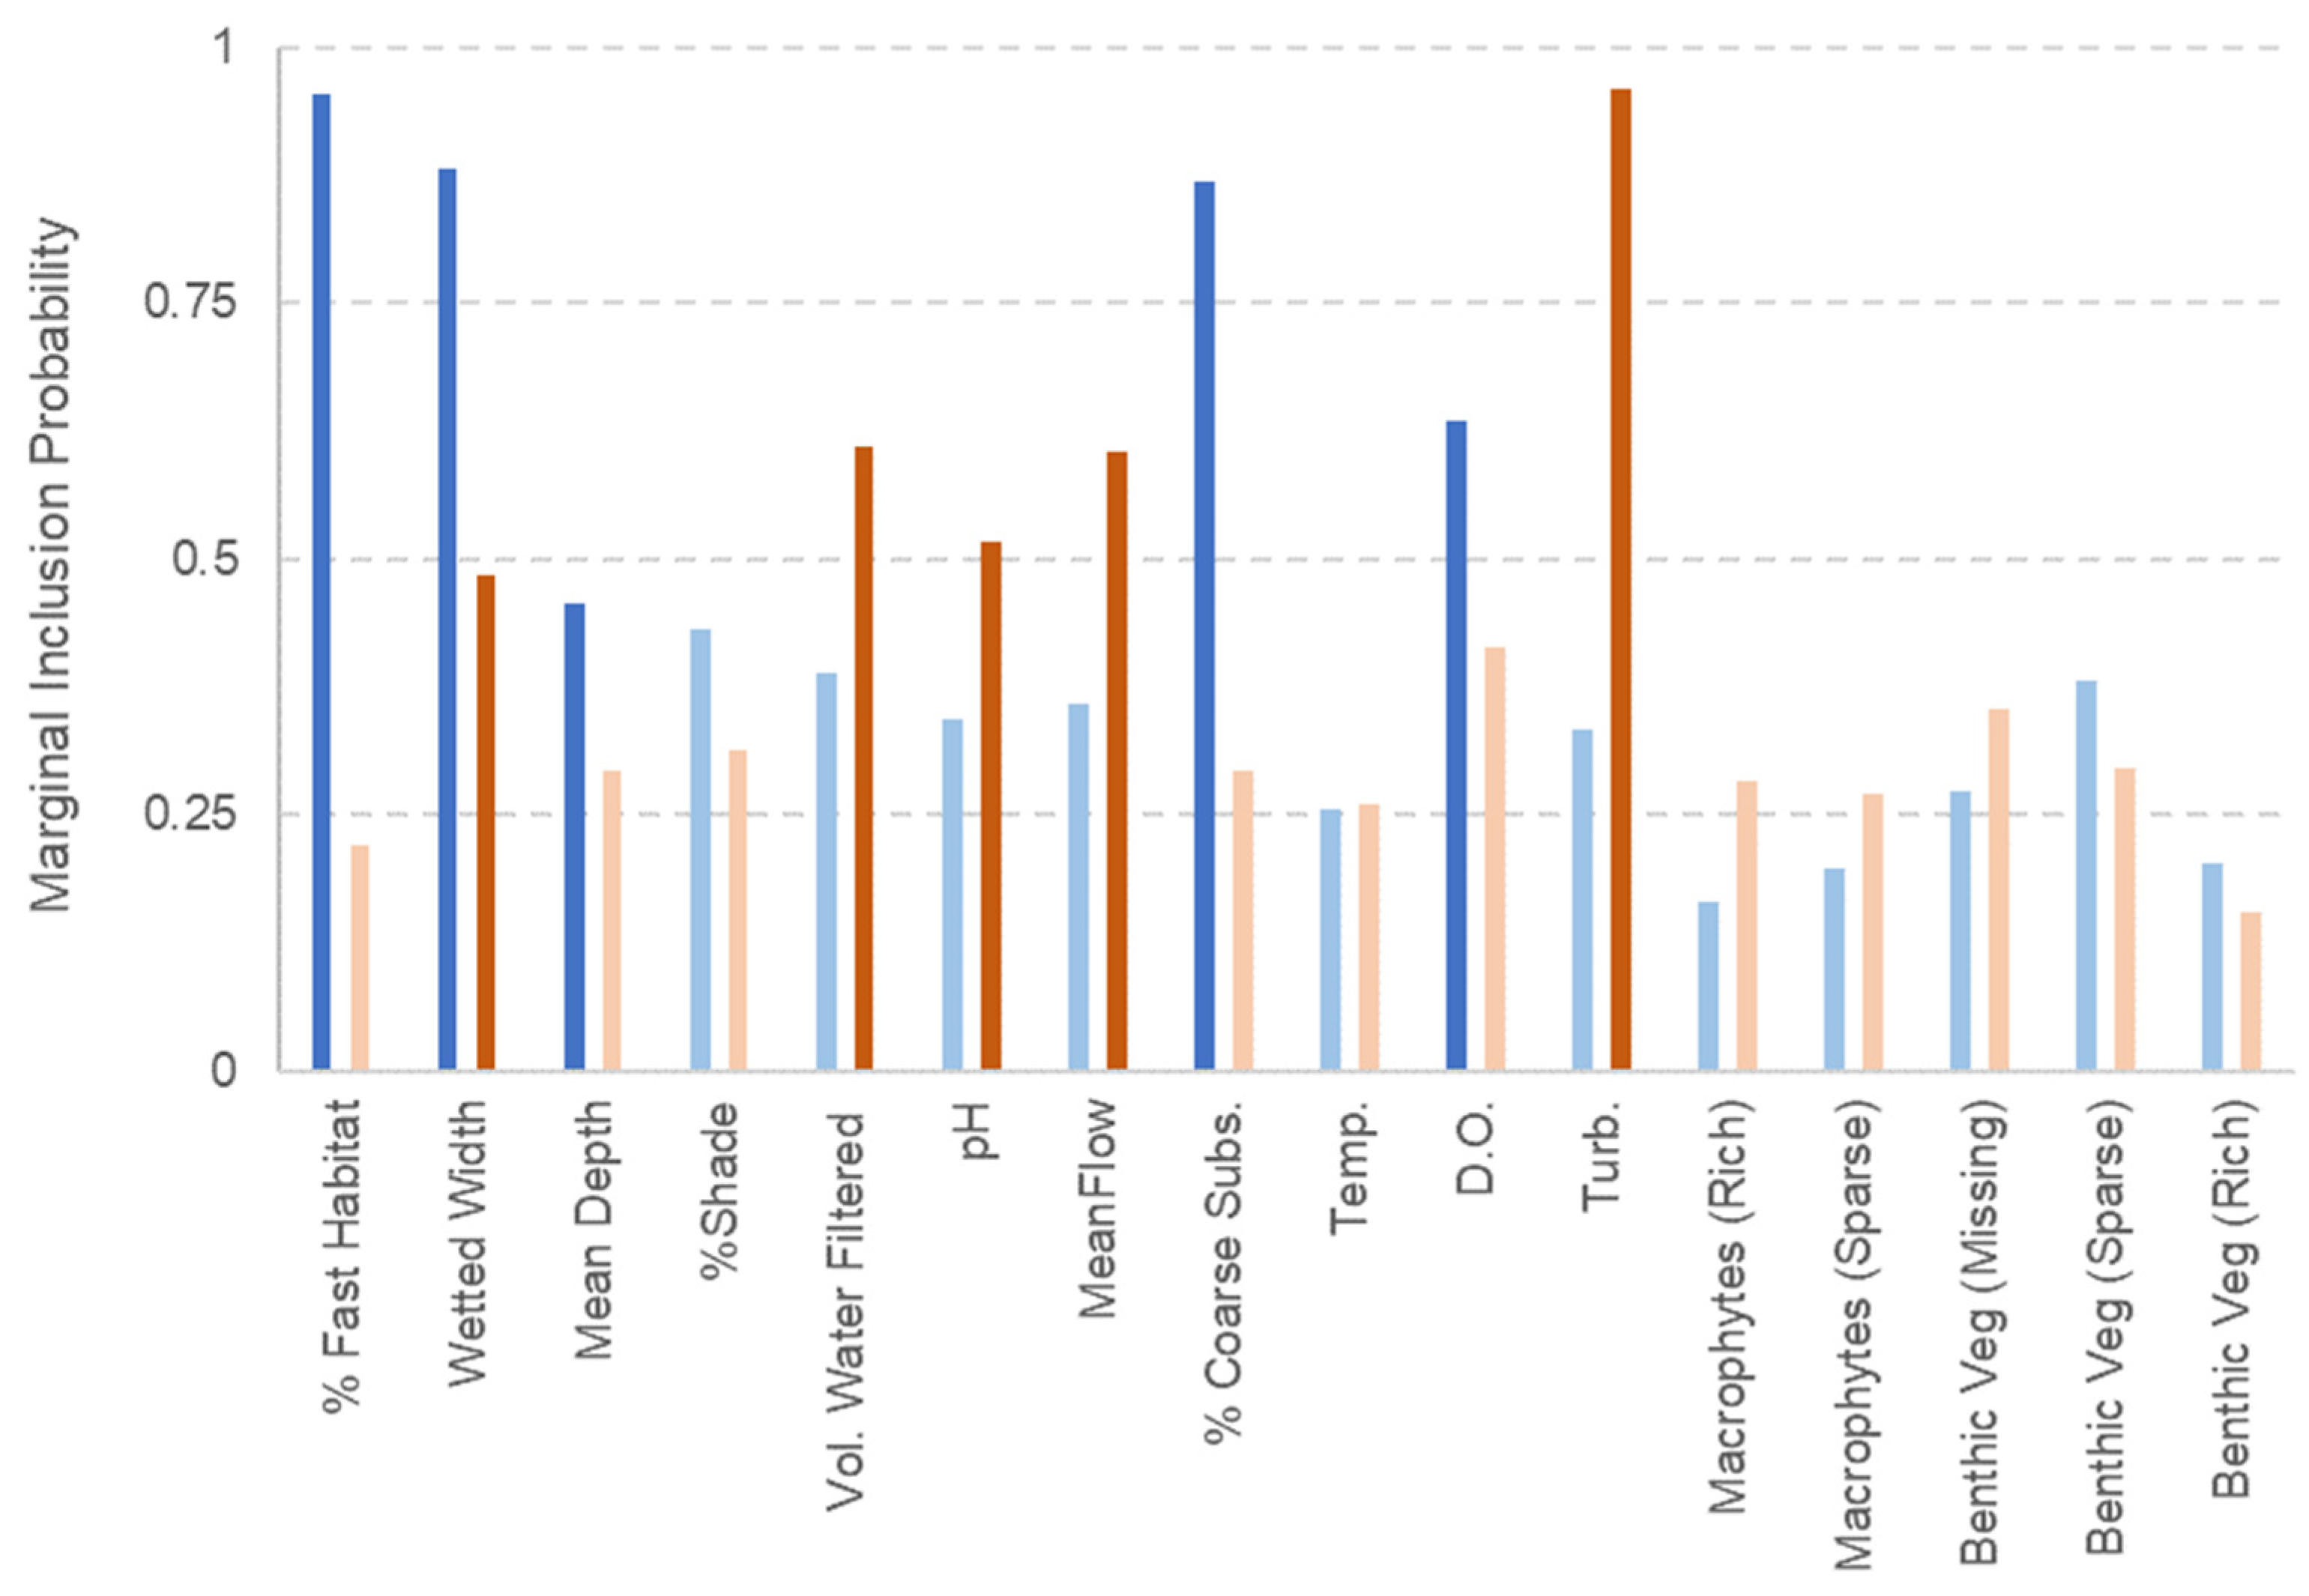
2.3. Statistical Analysis

To assess the impact of environmental covariates on the eDNA presence of G. holbrooki and P. parva and to estimate the probability of their detection, we utilised the occupancy modelling approach [27,28,29]. During the model selection procedure, we tested twelve environmental explanatory variables (two categorical, i.e., helophytes with 5 levels and bottom vegetation with 4 levels) as well as the amount of water filtered. Analyses were performed in the R statistical language version 4.2.2 [30]. The modelling procedure was performed in two stages. During the first stage, we utilised a MCMC Bayesian model selection procedure in order to evaluate all possible models deriving from the total combinations of our candidate variables. The MCMC performed 25,000 iterations, with uniform initial variable probabilities and prior models prior. The models were compared using the Bayesian information criterion (BIC) which measures each model’s fit and complexity [31]. Finally, the results were evaluated via a sensitivity analysis under multiple other models prior. This procedure thinned out the candidate model space, revealing the five most important variables, which were characterised by high inclusion probabilities. After obtaining the most probable model variables, each was examined for any variance-inflating effects, and the model structure was adjusted accordingly. During the second stage, we used the ‘eDNAoccupancy’ package [32] and the package’s ‘occModel’ function to fit the model. To reach model convergence, MCMC chains were run for 25,000 iterations, with 24,000 retained for obtaining parameter estimates and credible intervals. Two criteria were used to select the covariates of the final model: the PPLC (posterior predictive loss criterion) [33] and the WAIC (widely applicable information criterion) [34,35].
The Bayesian estimates of the final model illustrate the influence of covariates on the probability of occurrence at a given site (p). Specifically, the parameters (α) and (δ) function as covariates affecting both the conditional probability of environmental DNA presence in a sample (θ) and its subsequent detection (p). Since in our study there were no site and sample level repetitions, there was no variability, and the estimates of the probabilities of occurrence (ψ) and the conditional probabilities of eDNA presence in a sample (θ) were identical for all the sites.
Finally, we utilised the RShiny app ‘eDNA 1.0’ [36], which implements the Bayesian occupancy modelling framework [37] to generate estimates of the conditional probability of true absence (1 − ψ) given a certain number of positive PCR replicates, as per [38].

2.4. Ethical Statement
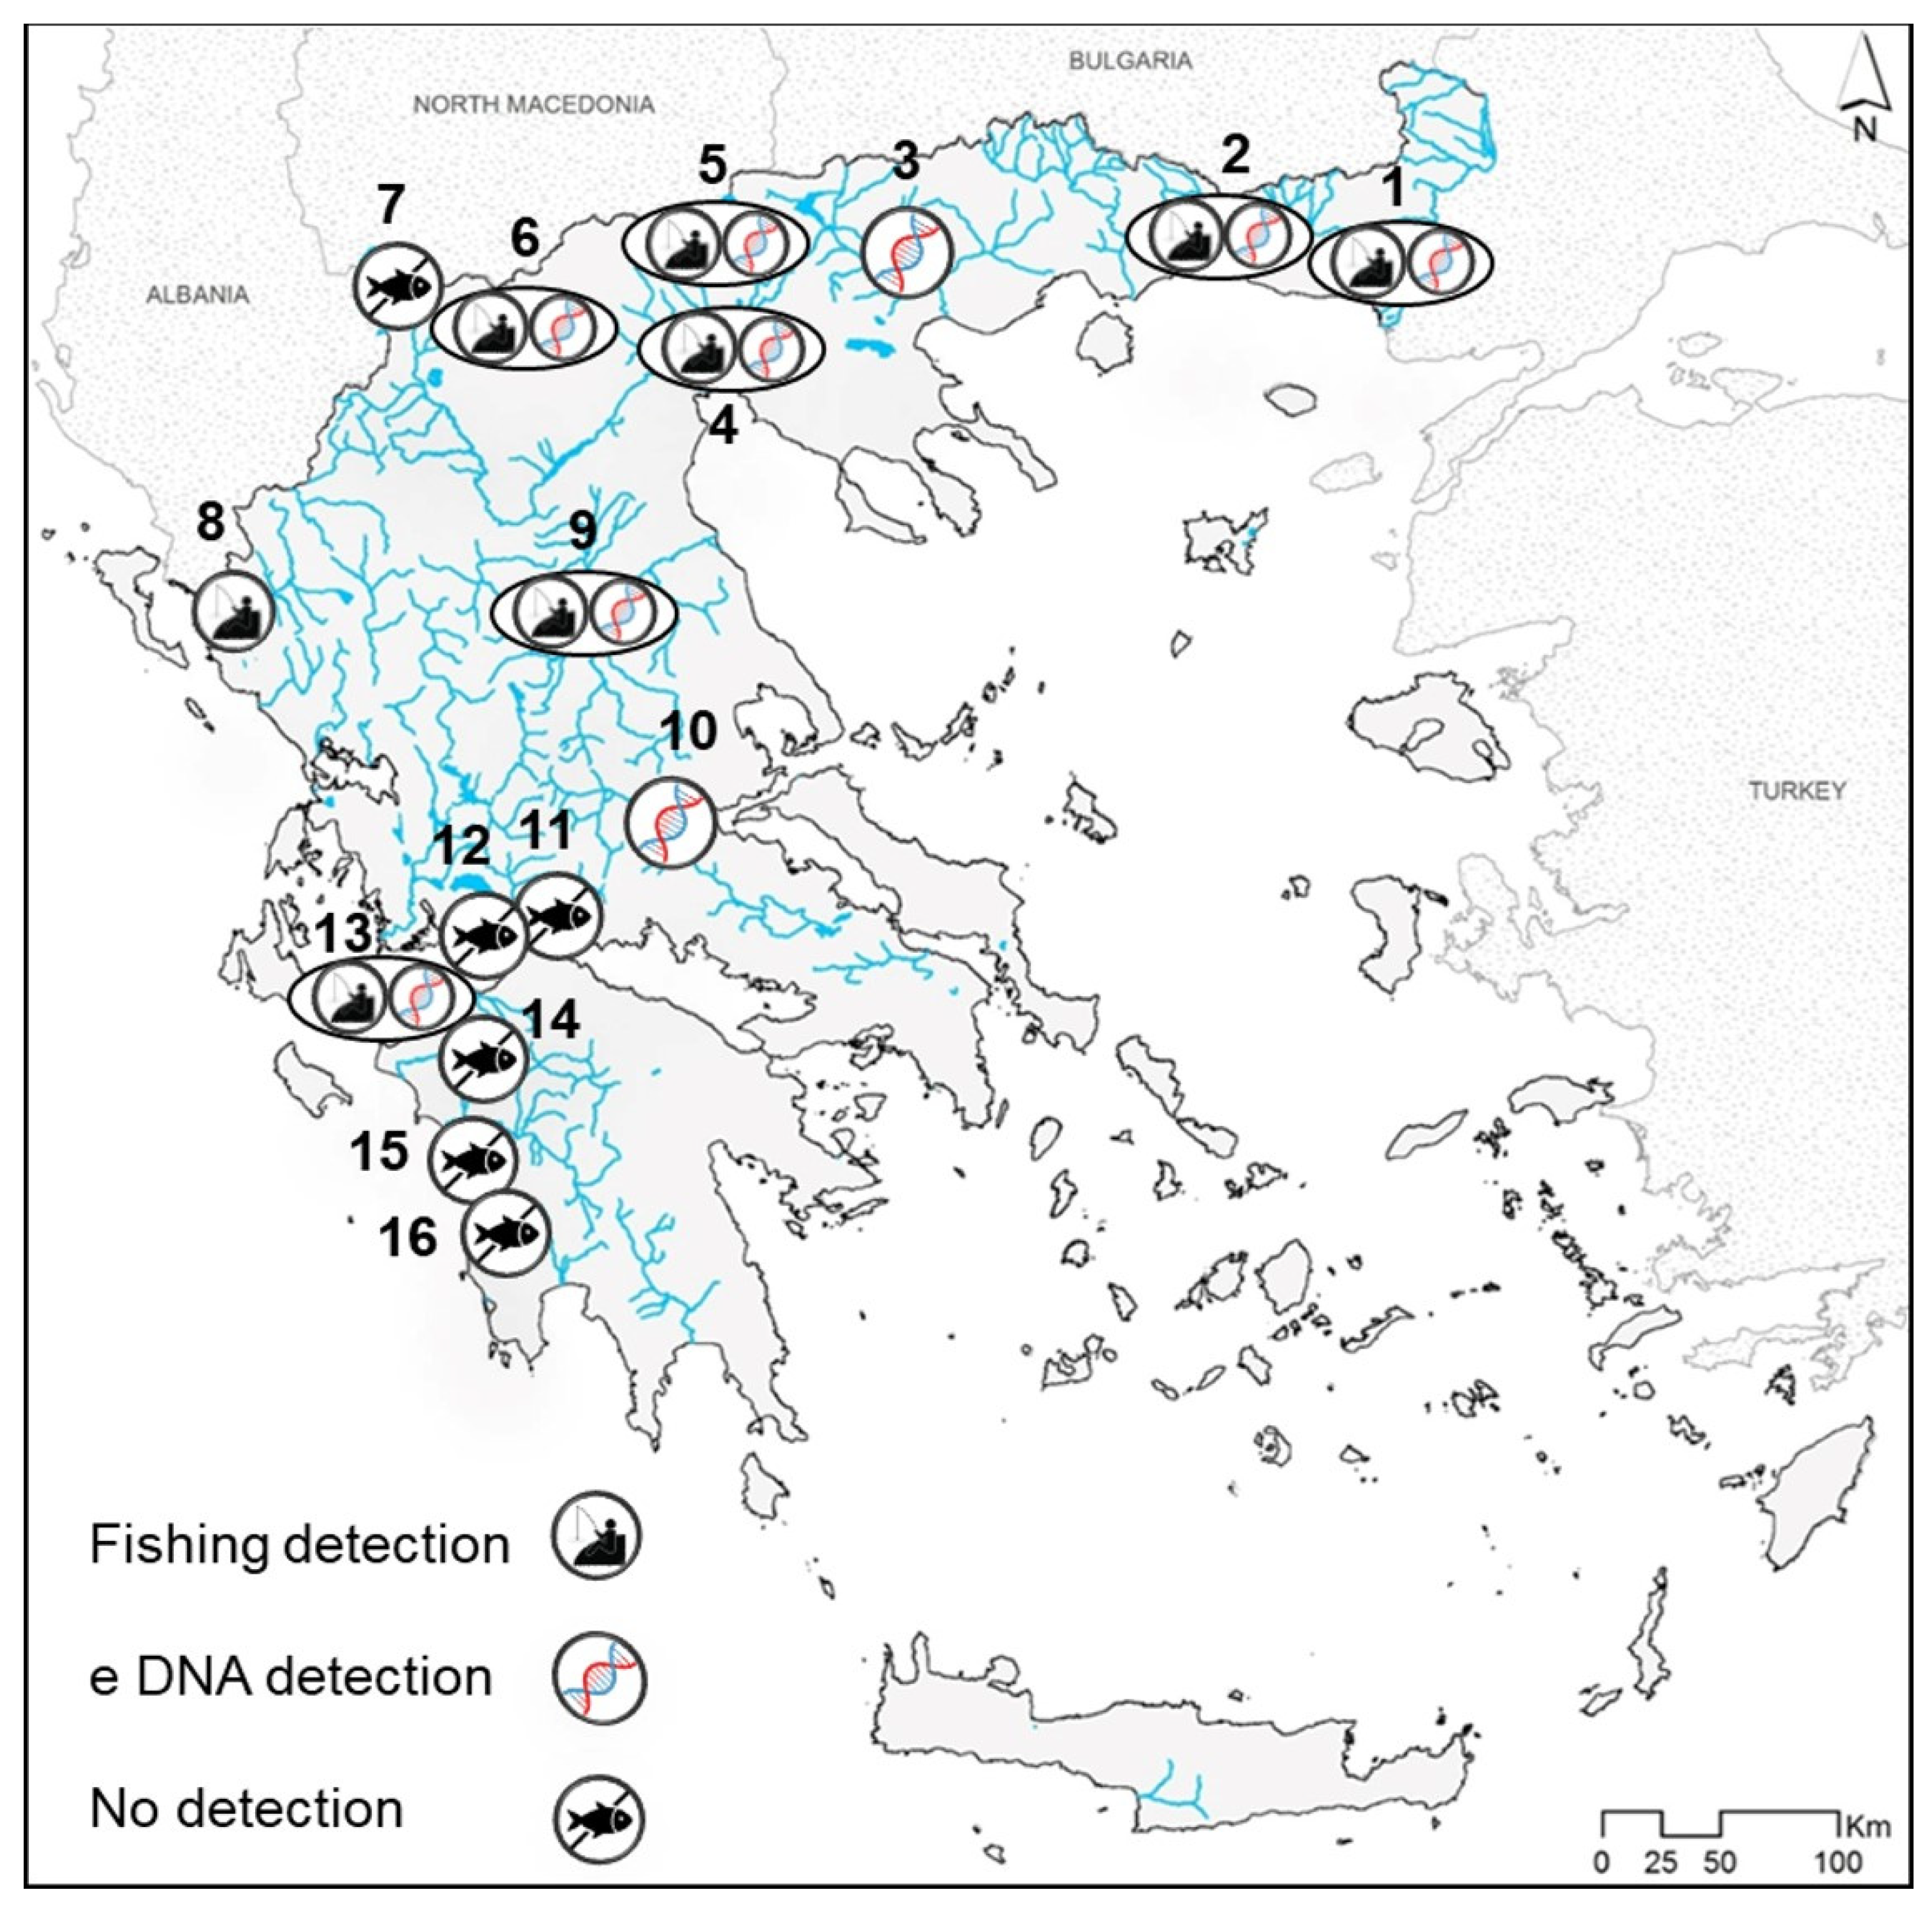
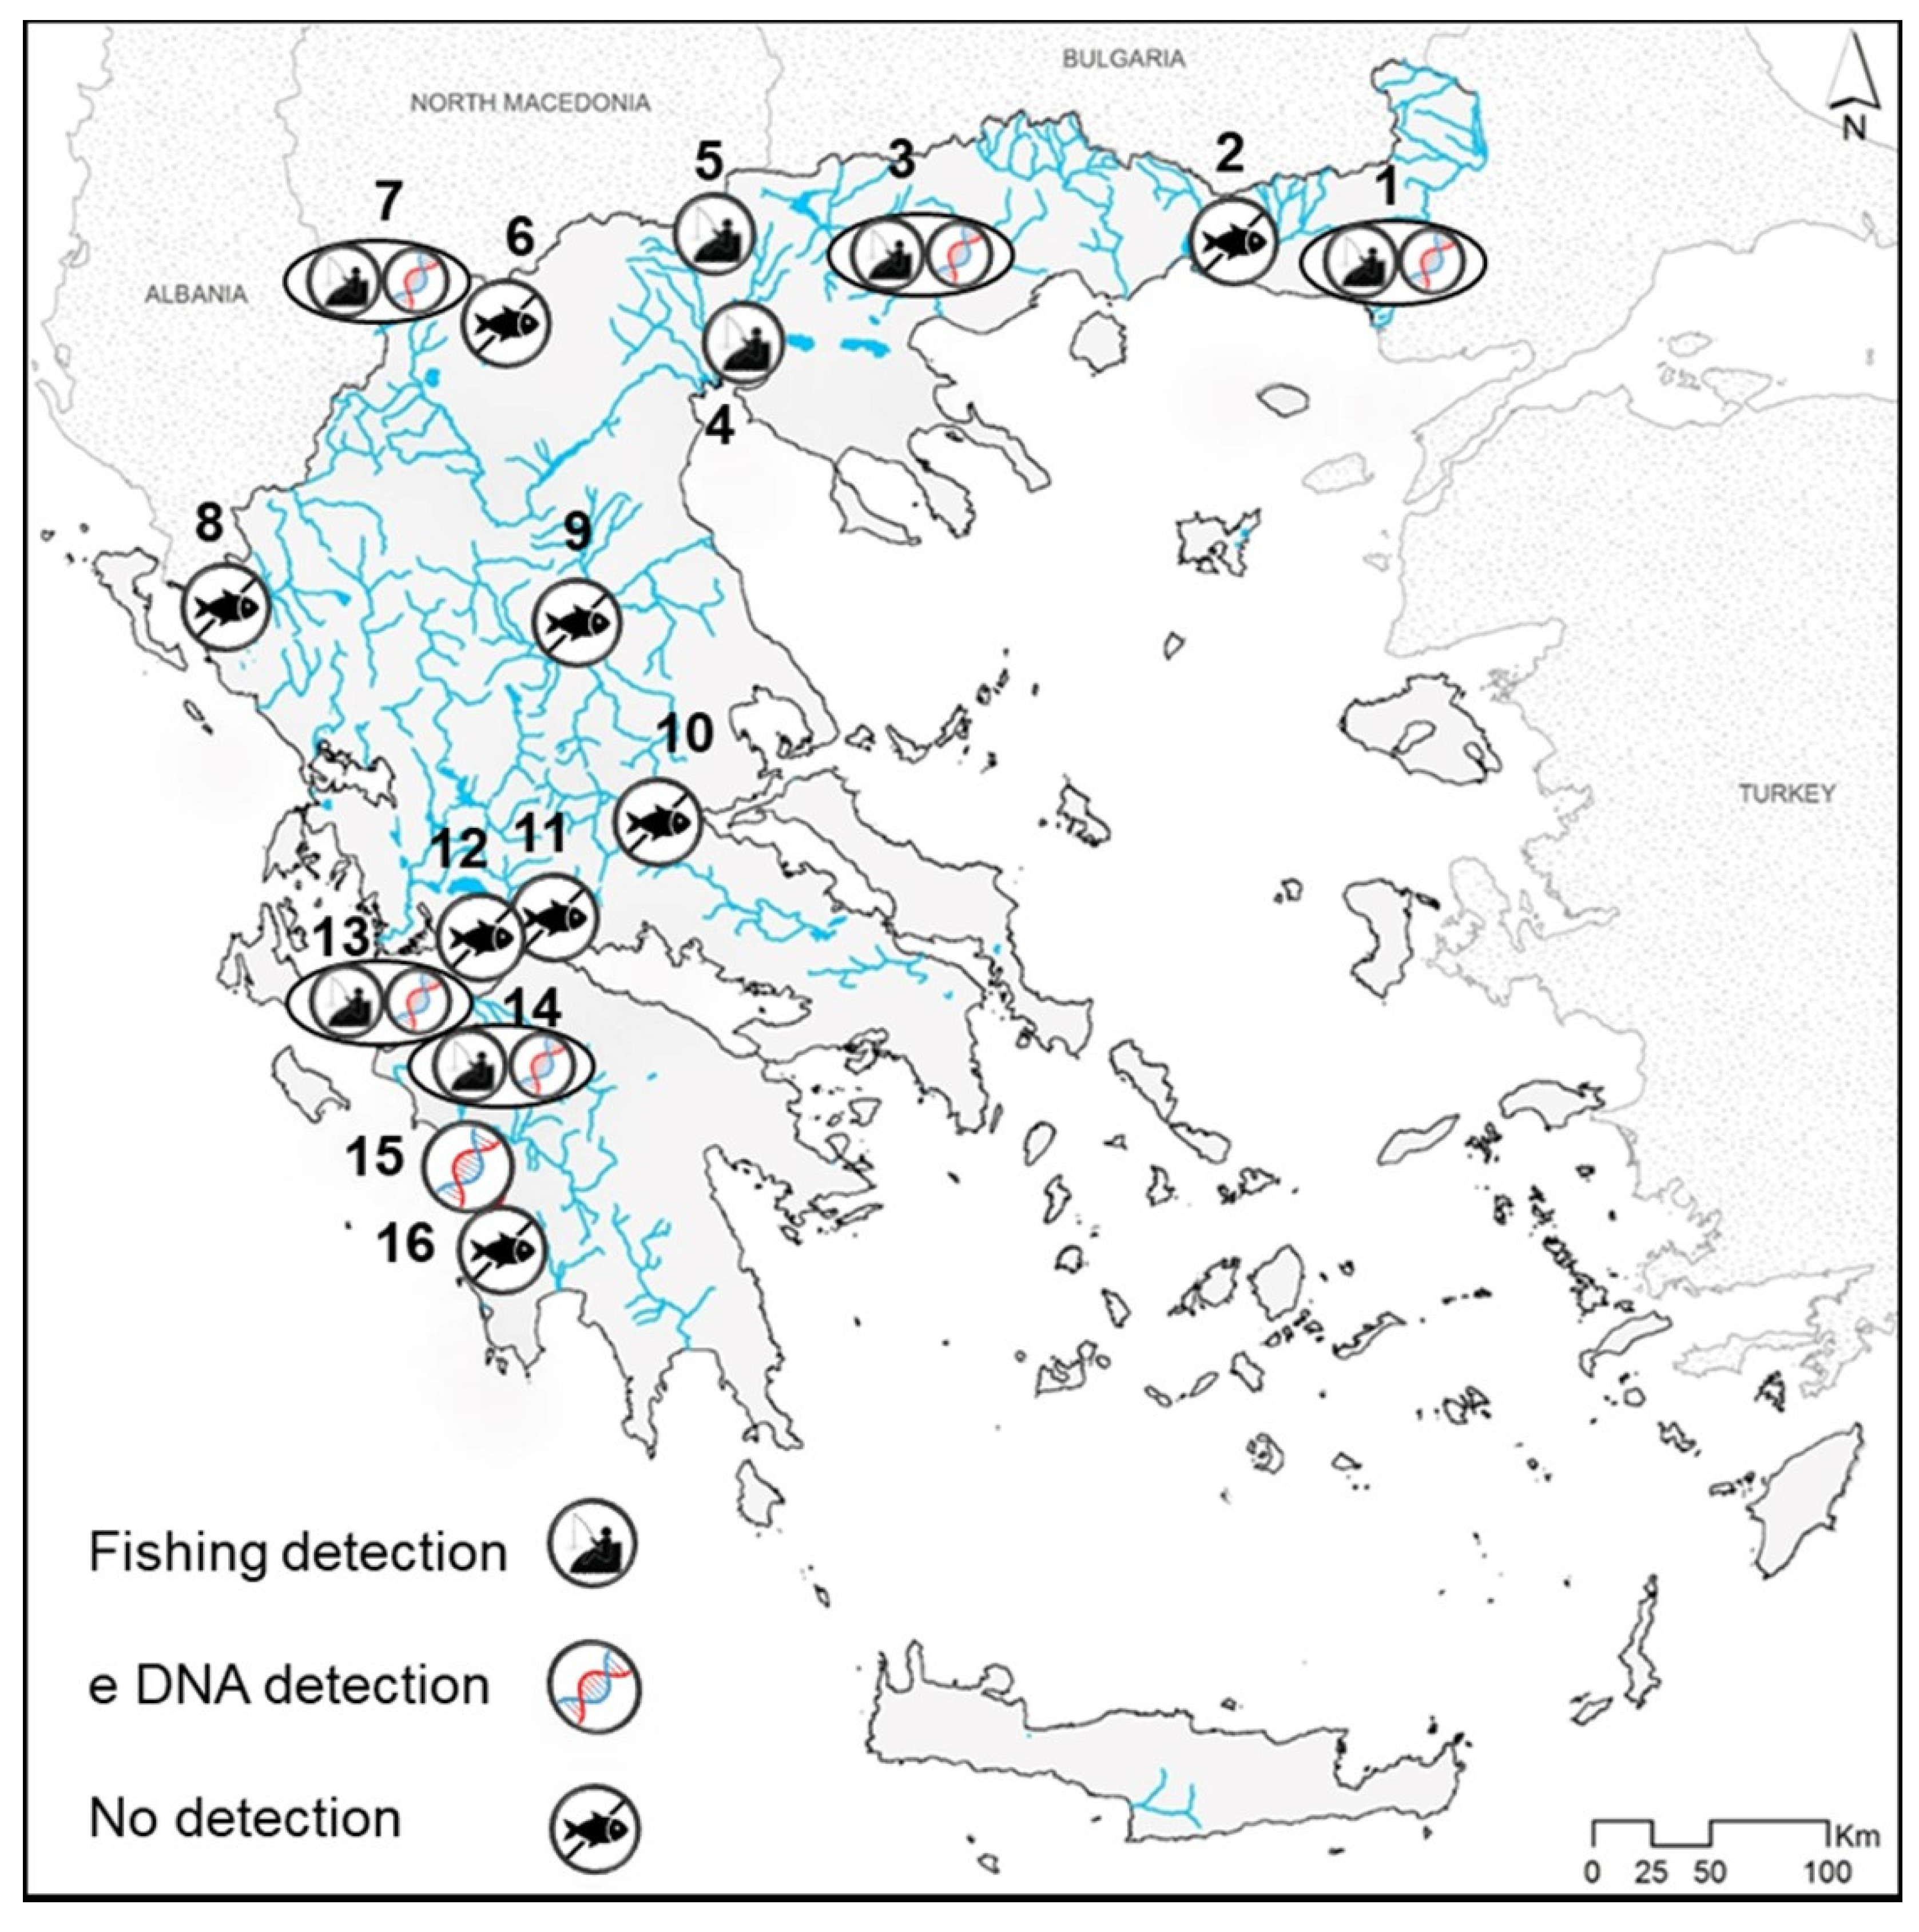
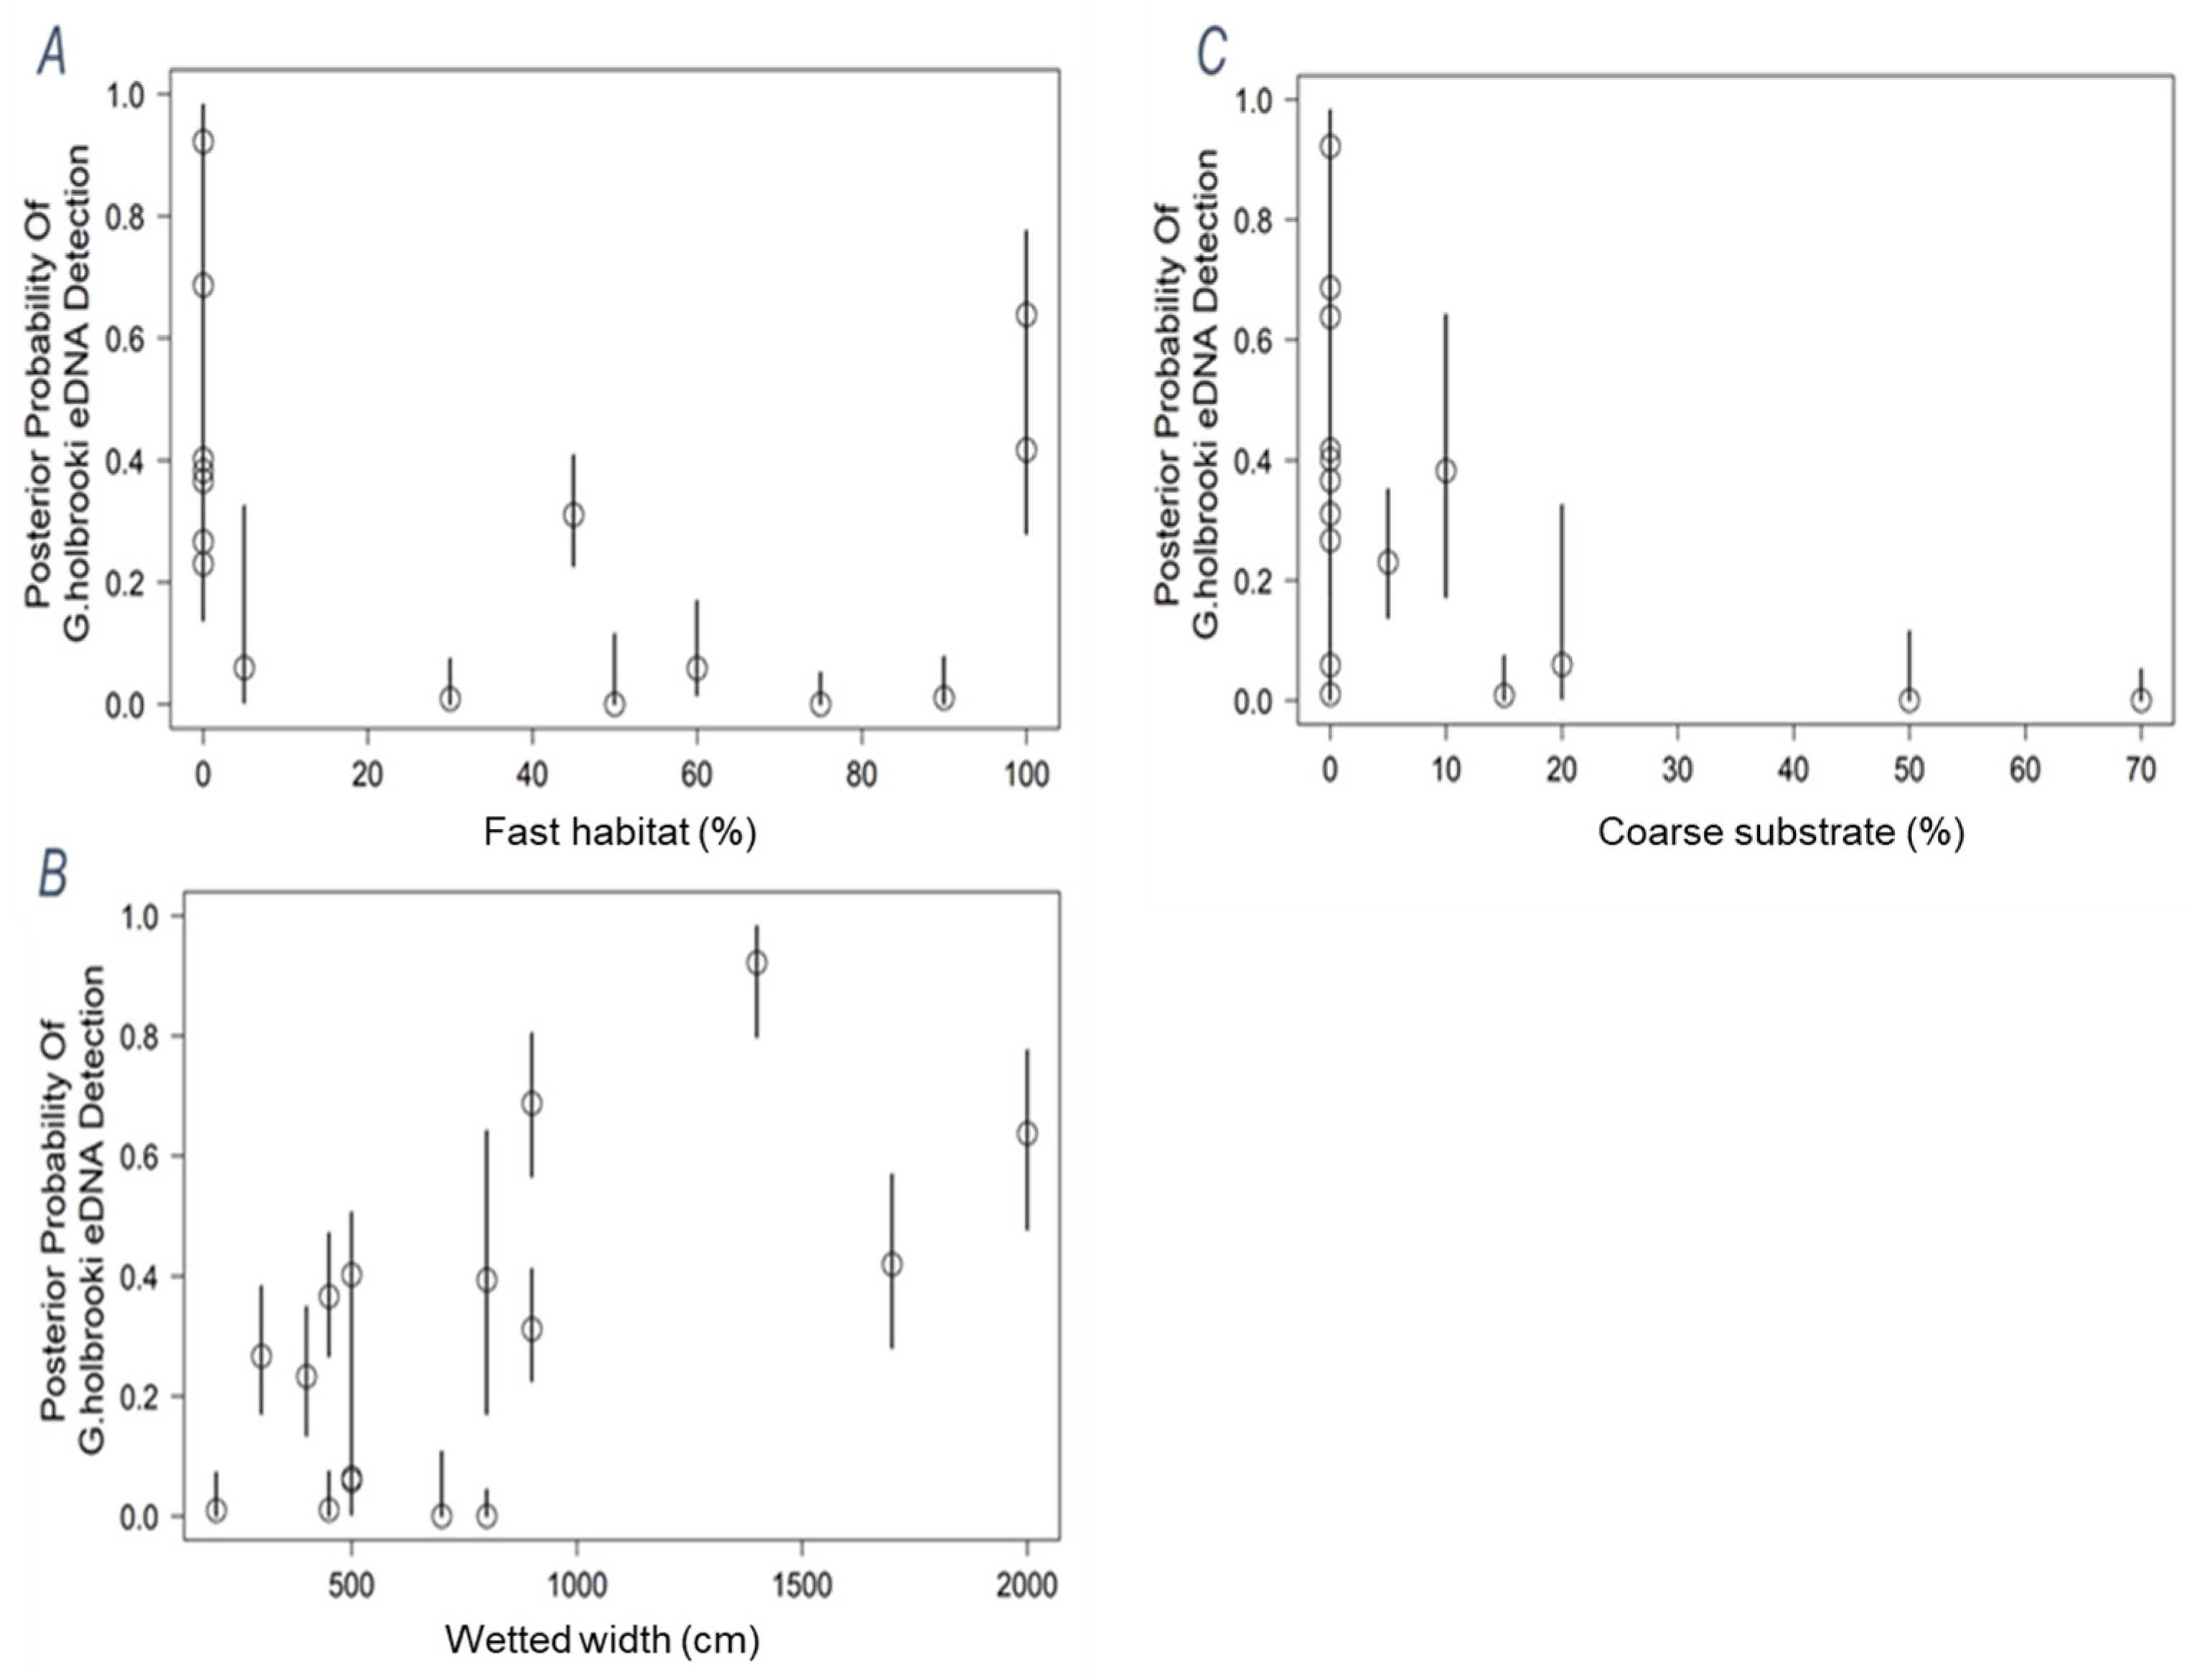
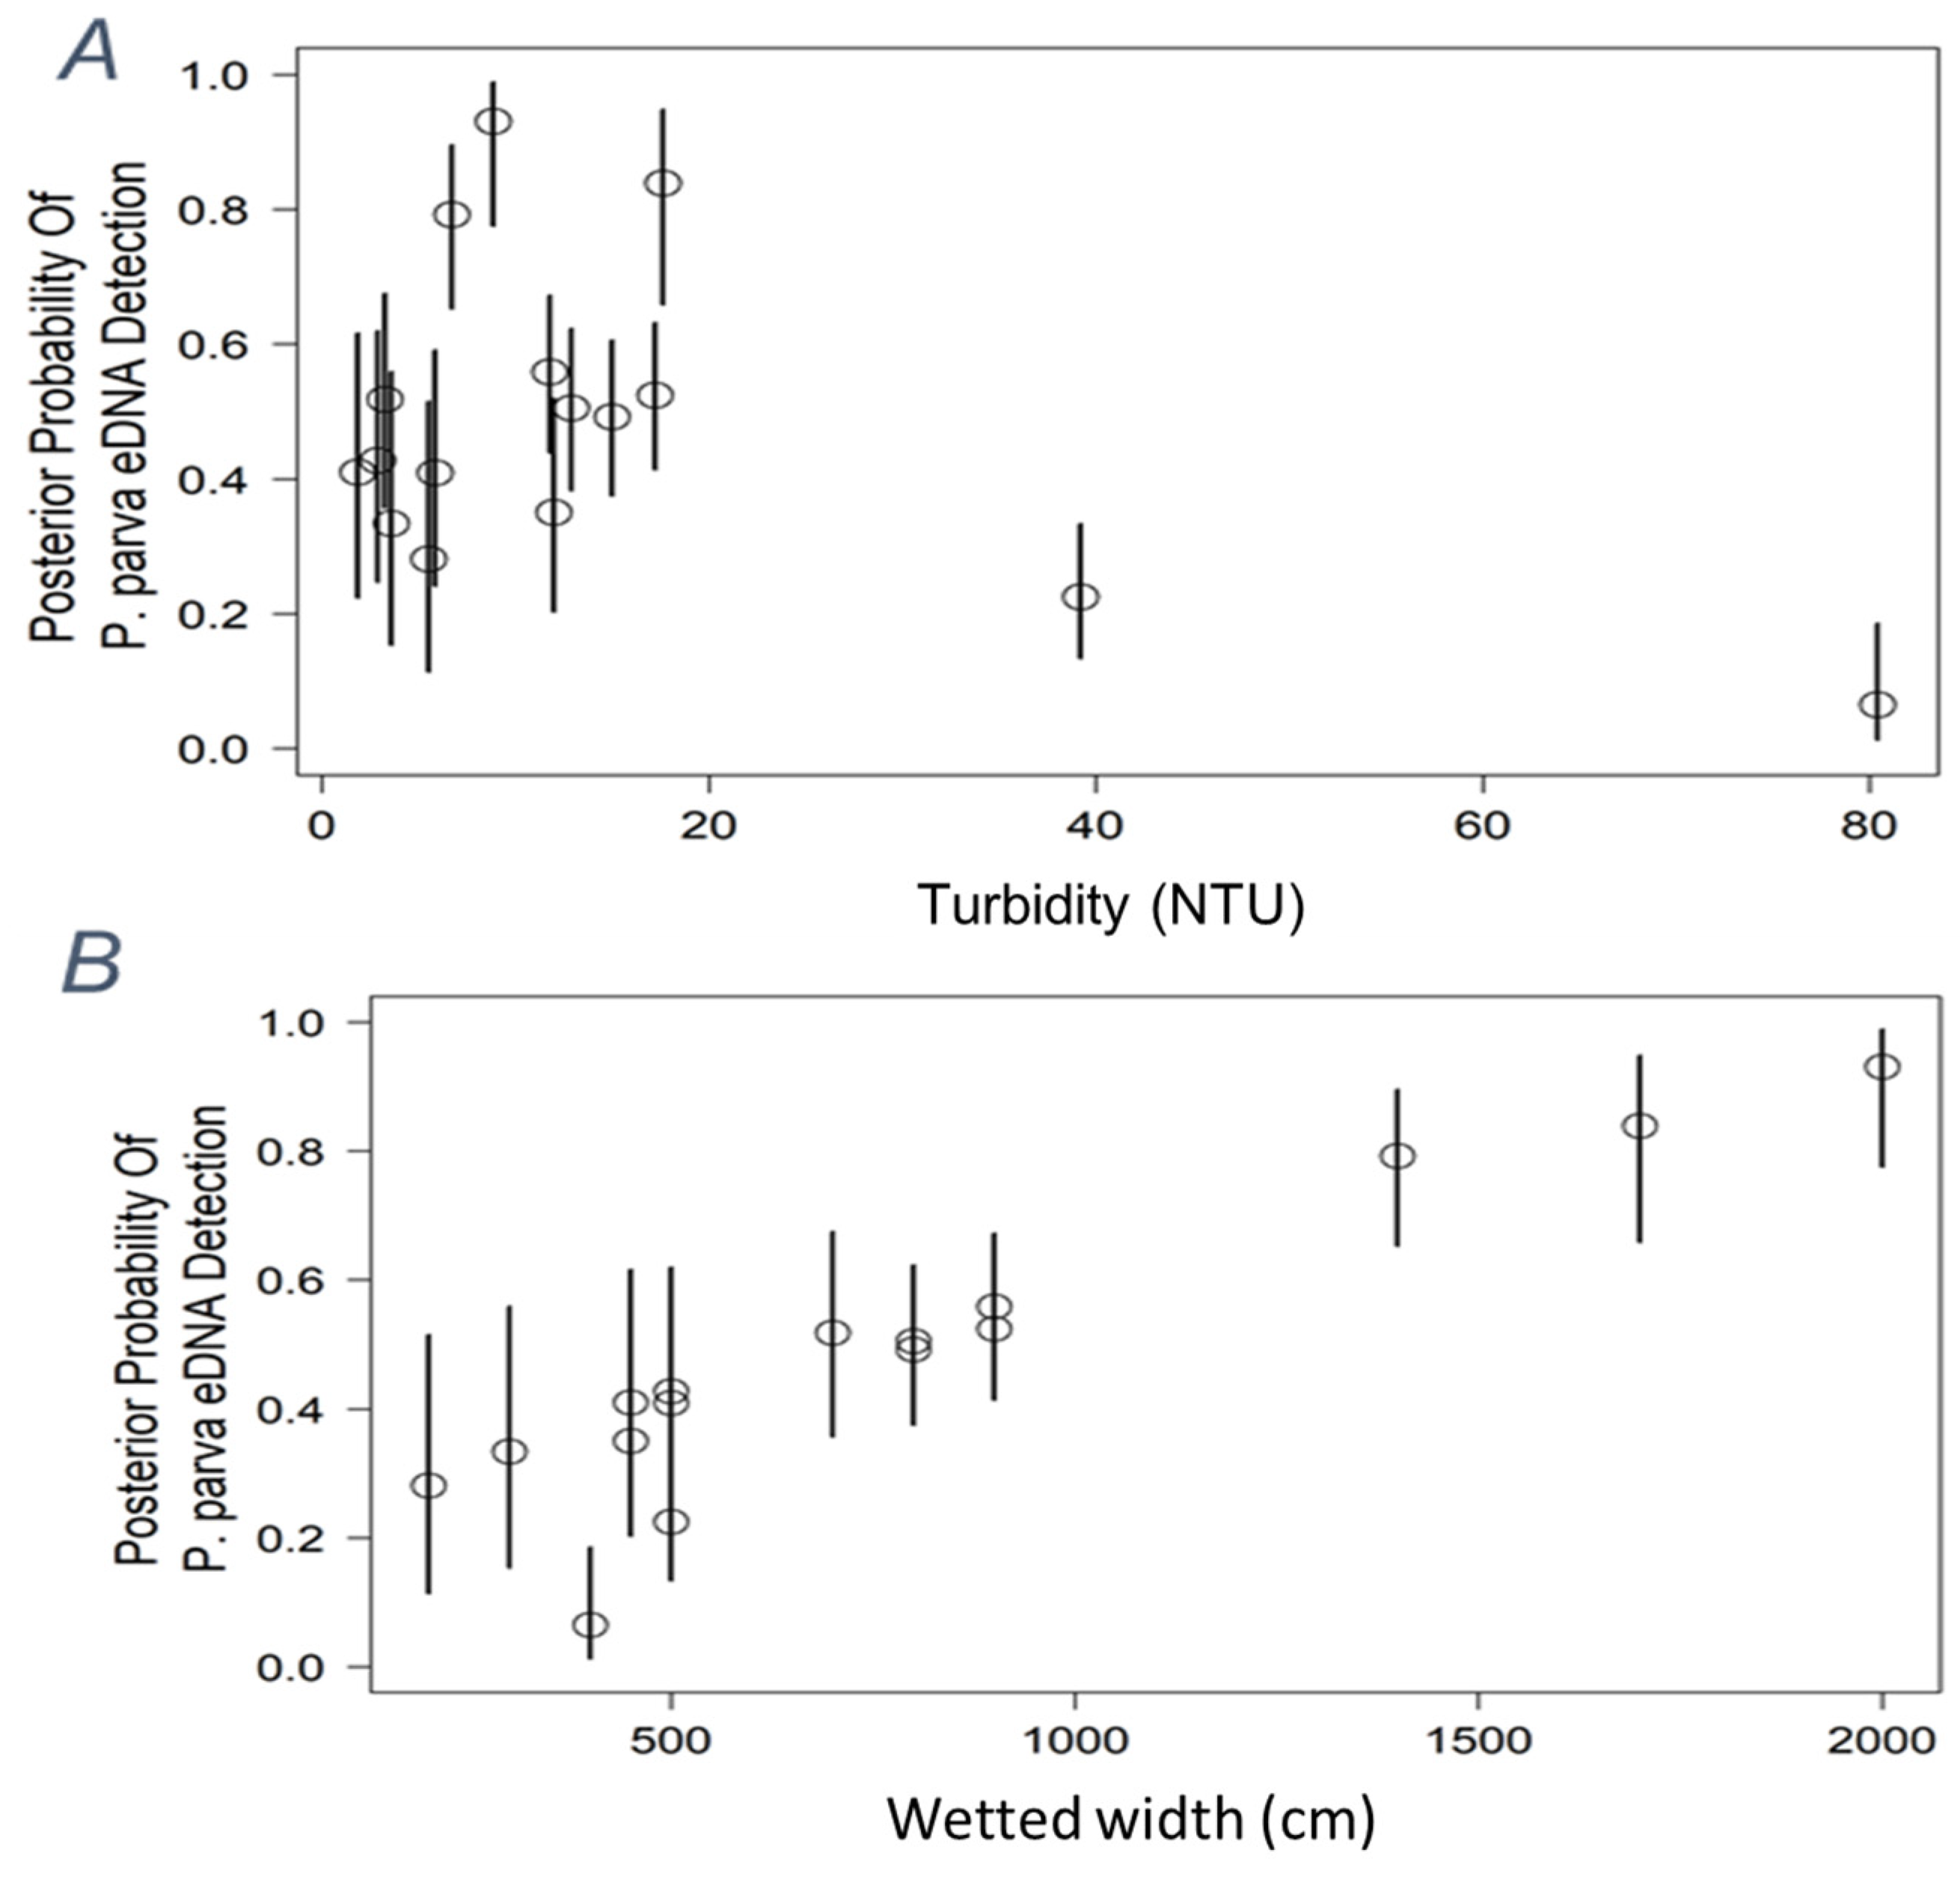
Tissue samples were collected under permit Ω4214653Π8-ΘOΜ/2019 by the Greek Ministry of Environment, Energy and Climate Change. Fish handling in the field complied with Greek guidelines on the protection of animals used for scientific purposes (Official Journal of the Greek Government No. 106/30 April 2013).

3. Results

The results of the presence (or absence) of G. holbrooki by the eDNA method and by electrofishing were in agreement in 13 out of the 16 locations sampled, i.e., G. holbrooki was detected at seven sites by using both methods, while at six sites its absence was again confirmed by both methods (Figure 1; Table 1). In two cases, the species was not detected by electrofishing, with the eDNA method however giving a positive signal at both sites: site 3 (Strymon basin) and site 10 (Sperchios basin). However, it should be noted that the number of positive qPCR amplifications from site 10 did not exceed two for any of the biological replicates, suggesting a lower degree of confidence in this result (Figure 2; Table 1). Conversely, at one site (site 8, Kalamas basin), the species was detected by electrofishing, but the eDNA showed a negative signal.
Overall, the detection rate for G. holbrooki by using eDNA was slightly higher (56%) compared to conventional electrofishing (50% detection rate). In addition, site Ferres (site 1) demonstrated the highest probability (0.92), while site Agios Germanos (site 7) demonstrated the lowest probability (0.01).
Similarly, the results for the presence (or absence) of P. parva by the eDNA method and by electrofishing were in agreement in 13 out of the 16 sites tested (Figure 3, Table 1). The species’ presence was confirmed by both methods at five sites, and the species’ absence at eight sites. However, at two sites (site 4, Gallikos basin, and site 5, Axios/Vardar basin), the species was found by electrofishing, but the eDNA gave a negative signal. Finally, at one site (site 15, Neda basin), there was a strong positive signal by the eDNA, but the species was not found with electrofishing (Table 1). Low numbers of P. parva were recovered from both sites in the Peirou-Verga-Pineiou basin (sites 13 & 14), which appears to correspond to the low levels of eDNA recovered. None of the biological replicates at these locations provided more than two out of four positive amplifications, which would suggest lower levels of confidence in the eDNA results were they not corroborated by the physical survey.
Overall, the detection rate for P. parva by using eDNA was lower (38%) compared to conventional electrofishing (44%). In addition, sites S10 (site 5) and Ladon Pinios (site 13) demonstrated the highest (0.93) and the lowest (0.065) probability of eDNA detection, respectively, for P. parva.
The Bayesian model selection procedure facilitated an overarching evaluation of variables, revealing the most influential environmental factors affecting eDNA detection probability (Figure 4). Subsequently, the identified variables underwent further assessment to ascertain the optimal models of occupancy for each species.
Our final model for G. holbrooki composed of the percentage of fast habitat in the site area, the wetted width and the percentage of coarse substrate (Figure 5); it scored a PPLC of 276 and a WAIC 58.88, indicating a good overall fit while avoiding significant autocorrelation and variance-inflating effects. The reported means denote the estimated parameter values, accompanied by their corresponding 95% credible intervals, providing a comprehensive understanding of the uncertainty associated with these estimations (Table 2).
From the total number of examined covariates, three indicated a statistically significant impact on the detection probability. The percentage of fast habitat (mean: −0.87, 95% credible interval: [0.0092, 0.0087]), the wetted width (mean: 0.955, 95% credible interval: [0.604, 1.333]) and the percentage of coarse substrate (mean: −1.215, 95% credible interval: [−2.505, −0.068]) (Table 2).
The mean of −0.87 for the percentage of fast habitat variable suggests a negative effect on the probability of detecting the species. This means that a one-unit increase in the percentage of fast flowing habitat (e.g., from 30% to 31%) is associated with a decrease in the probability of eDNA detection by approximately 0.87 units. Hence, in the case of a higher percentage of fast flowing habitat, the likelihood of eDNA detection decreases. Conversely, a one-unit decrease in the percentage of fast flowing habitat would increase the probability of eDNA detection by the same amount. Similarly, the mean of −1.215 suggests a negative effect of the percentage of coarse substrate on the probability of detecting the species. This indicates that as the proportion of coarse substrate increases, the probability of eDNA detection decreases. Conversely, the mean of 0.955 indicates the positive effect of the percentage of wetted width variable on the probability of detecting the species. Therefore, as the wetted width of the site increases, the probability of eDNA detection also increases. Overall, the standard errors for most of the parameters are relatively small, indicating that the parameter estimates are reasonably precise. The Monte Carlo standard errors of Bayesian estimates associated with each parameter estimate indicate the variability or uncertainty in those estimates.
The model estimate for the parameter p is associated with the probability of eDNA detection (p) at each site (Table S3).
For P. parva, two model-selected variables demonstrated a statistically significant influence on the probability of eDNA detection. Those were turbidity (mean: −0.310, 95% credible interval: [−0.556, −0.072]) and wetted width (mean: 0.603, 95% credible interval: [0.273, 0.951]) (Table 3).
The mean of −0.31 for the water turbidity suggests a negative effect on the probability of detecting the species (Figure 6A). This means that a one-unit increase in the water turbidity (e.g., from 30% to 31%) is associated with a decrease in the probability of eDNA detection by approximately 0.31 units.
Conversely, the mean of 0.603 indicates a positive effect of the percentage of wetted width on the probability of detecting the species (Figure 6B).

4. Discussion

4.1. eDNA—A Technique for Nationwide Invasive Species’ Monitoring

During the first decade of its application in fish studies, eDNA methods were predominately used for the detection of alien and/or invasive species in lotic freshwater habitats [12] and yet have proven efficient even within large aquatic systems and numerous water bodies both lotic and lentic [12,39]. In the current study, the eDNA method proved an efficient fish biomonitoring tool at a national scale, consuming both less time and human resources compared to conventional fish sampling methods, especially once the assay was validated [40]. Also, eDNA methods have regularly been shown to be more accurate than conventional sampling methods for species and diversity monitoring [41,42]. This was evident in the current survey for G. holbrooki, in which the eDNA proved slightly more sensitive as a detection tool compared to conventional electrofishing, as shown by the positive signal at two locations. Indeed, electrofishing failed to capture the target species, though there is historical record of the alien species’ presence in these locations. In contrast, it proved overall less sensitive for detecting P. parva compared to electrofishing, as evident by the two locations where the eDNA failed to detect the target species. The two false negative eDNA results are perplexing, especially at the site where P. parva occurs at high densities, and thus this failed detection cannot be attributed to the low biomass of the target. Factors such as seasonal variation and method applied (e.g., number of replicates) can affect the detectability with eDNA [25], but all samplings were conducted during the summer period, and at all locations, three replicates were collected [42]. Other factors responsible for these false negatives could be methodological errors either in the field sampling or in the laboratory processing as well as physiological factors, hydrological drivers and/or inhibition by co-extracted compounds [25,26,43,44].
Overall, site Ferres (site 1) demonstrated the highest probability for G. holbrooki, while site Agios Germanos (site 7) demonstrated the lowest probability, which is consistent with our on-site observations at a lowland stream and an oligotrophic trout river of ideal and unsuitable conditions, respectively, for G. holbrooki. Likewise, the highest and the lowest probability of eDNA detection for P. parva at site S10 (site 5) and Ladon Pinios (site 13), respectively, possibly correlated with wetted width. This due to the fact that S10 is a lowland section of the Pinios (Thessaly) river with ideal environmental conditions for the alien species, while Ladon Pinios is an upland section of the Pinios (Peloponnese) river.
In the context of assessing the environmental factors affecting the detectability of eDNA for the two species, it was discerned that the wetted width of the sampling site yielded a consistent and conspicuous influence across both species. Specifically, an expanded waterway width was identified as positively associated with an enhanced likelihood of eDNA detection for both species. Similarly, a pronounced negative effect was observed in the case of G. holbrooki concerning the percentage of coarse habitat. An increase in substrate coarseness was notably linked to a rapid decline in the probability of detecting G. holbrooki. By contrast, water turbidity emerged as a prominent factor affecting P. parva detectability, with a marked reduction in detection probability as turbidity levels increased. Notably, the velocity of flow at the sampling site yielded a more nuanced outcome in the context of G. holbrooki, indicating that the probability of detection was relatively higher in situations of either slow or fast flow, while detection in conditions of average flow exhibited more moderate outcomes. The observed effects of these environmental variables on eDNA detectability for both species align well with the expectations and are consistent with findings from analogous studies within the scientific literature. A broader wetted width typically characterises larger aquatic systems capable of accommodating higher species abundances and greater ecological complexity [45], thereby providing a more diverse range of habitats for the species of interest [46,47]. Moreover, in larger systems, eDNA dispersal occurs over larger spatial scales, generating positive signals even when the target species may not be present at the immediate site.
The inverse relationship between eDNA detectability and increasing substrate coarseness may be explained by the tendency of eDNA aggregates to adhere to finer substrates [48]. Fine-grained substrates facilitate greater eDNA persistence due to enhanced attachment of the aggregates, whereas coarser substrates, characterised by boulders, result in eDNA drifting away and rendering it more susceptible to mechanical or physicochemical degradation.
Water turbidity commonly presents challenges in eDNA sampling, rendering the extraction process more intricate. Additionally, eDNA often adheres on the particles in turbid streams, causing it to disperse and thereby reducing its persistence within the sampling site.
The multifaceted findings concerning eDNA detectability in relation to stream flow velocity can be attributed to the differential behaviour of eDNA aggregates under varying flow conditions. Lower flow velocities permit eDNA to remain within the sampling site or attach to substrate, plants and other environmental elements, enhancing the on-site persistence. Conversely, in higher flow conditions, eDNA aggregates are more prone to drifting away, reducing their on-site persistence but increasing their dispersibility across larger spatial scales. The results for sites characterised by average flow velocities appear to represent an amalgamation of these effects.

4.2. New Records of the Two Invaders and Insights on Their Dispersal

The survey for the eastern mosquitofish confirmed its widespread occurrence in Greece [19,49], reflecting its very early, and repeated, introduction to Greece, first in 1927 in water reservoirs of Northern Greece and again in the 1940s and 1960s [50,51], as well as its ability to spread between watersheds via drainage and irrigation canals [18]. It also highlights the urgent conservation priority of rigorously monitoring and, if required, preventing the spread of the species in the few Greek drainages that remain mosquitofish-free due to its extremely deleterious effects on the native fish fauna through predation, trophic competition and agonistic interactions [18,52,53].
The survey for the topmouth gudgeon revealed its widespread presence in the transboundary rivers (and lakes) of Northern Greece, such as the rivers Evros, Strymon and Axios and the Prespa lake basin, reflecting its first accidental introduction during fish stockings in the Albanian section of Prespa Lake in the 1970s [54,55]. After its first record in Albania, the species was subsequently recorded from all neighbouring Balkan countries; thus, its natural dispersal to Greece through transboundary rivers with Bulgaria and Turkey cannot be excluded [11,56].
Our survey also revealed its southern expansion in the Peloponnese peninsula, as evident by its detection with both eDNA and electrofishing. Further south, the species was detected only with eDNA, a result that should be treated with caution and deemed as a “pseudo-positive”, since this is the first detection of P. parva not corroborated with electrofishing. “False positives” can be due to contamination during sampling or lab processing, but if this is not the case, there is also the possibility of sampling independent contamination, e.g., by birds [44]. Alternatively, it could be a case of early detection of the species in the Peloponnese, requiring repetition of the eDNA sampling and analysis as well as rigorous monitoring with fish sampling. Concerning its mode of spread in the Peloponnese, we should consider the non-detection of the species from other neighbouring Western Greece basins as confirmed recent inventories [52]. This could indicate that the species has been introduced in the Piniou-Verga basin in the Peloponnese as a contaminant of fish consignments to fish farms in this river, as postulated elsewhere for its dispersal in other European countries [57].
The negative effects of the P. parva can be significant through food competition; predation of eggs and larvae of native species; and, importantly, the transport of the pathogen Sphaerothecum destruens, which causes mortality and spawning inhibition in various native cyprinids, also affecting many salmonids [58,59,60]. Thus, the prevention of its further spread in the Peloponnese and also in Eastern Central Greece and the Aegean islands should be a priority.

4.3. Top Invader Pockets, Early Detection and Management Intervention Monitoring with eDNA

Managing invasive freshwater fish species is a complex and multifaceted task that requires a robust approach [61], especially when they co-occur with threatened freshwater fish species. The initial step involves careful monitoring of the distributional range and population status of both invasive and threatened species and, therefore, their spatial overlap within the ecosystem under investigation. This assessment provides crucial insights into the impact of the invasive species on the threatened species, which in turn determines the urgency and severity of management actions required for their protection. For instance, this holds great significance for the critically endangered freshwater fishes of Greece, as the percentage of overlapping areas between critically endangered and moderate to high non-indigenous fish species richness (1.5–4.3 species per 1 km2) is already around 50% [62]. To address this challenge effectively, it is imperative to develop a comprehensive management plan that carefully considers various options and strategies; like removal and/or control of invasive species, habitat restoration or alternative approaches that can support the recovery of native fish populations.
Priority must be given to management actions that have the greatest potential for protecting the threatened species and their habitats, ensuring that efforts are focused on the most critical areas, and well-designed activities that can yield the highest impact [63]. Firstly, eDNA monitoring can help track changes in the abundance and distribution of invasive fish species over time. By regularly collecting water samples from different locations in a fine-scale sampling design, researchers can analyse the eDNA to determine the presence or absence of invasive species, their local distribution and even estimate their population size. Specifically, in combination with eDNA metabarcoding methods, we can provide insights into the spatiotemporal patterns of the relative abundance of species within a freshwater ecosystem [64]. This information is vital for understanding the impact of invasives on endangered fish populations and developing appropriate conservation strategies. According to current distributional records, approximately one-quarter of the overlapping areas of critical endangered and non-indigenous fish species are located within the NATURA 2000 network [62]. Similarly, in our results, P. parva has been detected co-occurring along with three native species of high conservation interest within the protected region of the Prespa Lake basin. In these zones, management bodies have the opportunity to implement control programs aimed at reducing the adverse effects of invasive species on native biodiversity. On the other hand, G. holbrooki was detected overlapping with one species of interest in areas of the Pinios Thessaly basin which fall well outside of a protected area. By sampling various sites within an ecosystem, researchers can identify areas where invasive species are more prevalent or where they have established breeding populations, especially within protected biodiversity hotspots. This information helps with targeting management efforts, such as tailor-made mitigation actions or implementing removal programs, in critical areas to protect endangered fish species. However, up until now, the available data suggest that there have been no successful preventive measures implemented to constrain the spread of invasive species in protected areas in comparison to unprotected areas [62].
Furthermore, continuous monitoring of the effectiveness of these management actions is essential. By assessing the outcomes and making necessary adjustments to the management plan, stakeholders can optimise the results and adapt their strategies accordingly. For instance, early detection of invasive fish species plays a vital role in preventing their spread and establishment. Hence, national and international policies are increasingly emphasising the need for rapid response monitoring [64]. In addition, early detection, particularly with the use of eDNA, can reduce the cost and effort of management by preventing the need for expensive and extensive control measures. However, while it provides an opportunity to respond quickly and implement appropriate management actions, such as quarantine measures or targeted control strategies, it also has limitations. Detecting invasive species can be challenging, especially at low densities or remote locations, and even when detected early, eradication may be very difficult. Nonetheless, eDNA could help to regular monitoring, which will enable early identification of any alien fish species presence, allowing for timely course correction in order to reduce the impact of invasive species on freshwater ecosystems.
eDNA can also be pivotal in monitoring the success of eradication/control actions targeting invasive species. Physical removal, which is usually the first to be considered (through electrofishing and/or netting), is costly and often has limited success [65], especially with small-bodied species. Chemical removal methods, though more successful, may negatively affect native invertebrate and other vertebrate biota [66] and can meet with a negative reaction by local communities. Thus, eradication/drastic reduction efforts need careful planning and monitoring to minimise unintended consequences and ensure their success.
In conclusion, managing invasive freshwater fish species that co-occur with threatened/endangered species and addressing the associated management issues require a robust and comprehensive approach. This entails meticulous monitoring, prioritising actions based on their potential impact, continuous monitoring of progress as well as close collaboration with stakeholders. By adopting eDNA approach at all these different phases, it is possible to develop effective and tailor-made management plans that minimise the negative impact of invasive species while safeguarding the vulnerable populations of threatened species.

Supplementary Materials

The following supporting information can be downloaded at: https://www.mdpi.com/article/10.3390/d16010028/s1, Table S1: MIQE Guidelines (Gambusia holbrooki); Table S2: MIQE Guidelines (Pseudorasbora parva); Table S3: Bayesian estimates for the probabilities of eDNA detection (p) for both species at each sampling site. Table S4: Model comparison for G. holbrooki. Table S5: Posterior summaries of coefficients for G. holbrooki. Table S6: Model comparison for P. parva. Table S7: Posterior Summaries of Coefficients for P. parva.

Author Contributions

Conceptualisation: E.K. and B.Z.; methodology: E.K., N.K. (Nicholas Koutsikos), N.K. (Nektarios Kalaitzakis), L.V. and M.D.S.; formal analysis: S.M., N.K. (Nektarios Kalaitzakis) and S.S.; investigation and data curation: E.K., N.K. (Nektarios Kalaitzakis) and M.D.S.; writing—original draft preparation: E.K., N.K. (Nicholas Koutsikos), N.K. (Nektarios Kalaitzakis) and M.D.S.; writing—review and editing: N.K. (Nektarios Kalaitzakis), L.V., E.K., L.W. and M.D.S.; visualisation: N.K. (Nicholas Koutsikos), L.V., N.K. (Nektarios Kalaitzakis) and M.D.S. All authors have read and agreed to the published version of the manuscript.

Funding

This study was conducted within the frame of project PACIM funded by the A.G. Leventis Foundation through the Zoological Society of London.

Institutional Review Board Statement

Fish sampling was conducted under permission from the Hellenic Ministry of Environment and Energy (permit 9ZE24653Π-ΖO6, 20 July 2016).

Data Availability Statement

Data are contained within the article and supplementary materials.

Acknowledgments

The authors wish to thank Petros Kouraklis for help with the field work as well as all the other HCMR colleagues that helped with the collection of fish sampling data within the Nation-wide River Monitoring Programme (2017–2023).

Conflicts of Interest

The authors declare no conflicts of interest.

References

  1. Butchart, S.H.M.; Walpole, M.; Collen, B.; Van Strien, A.; Scharlemann, J.P.W.; Almond, R.E.A.; Baillie, J.E.M.; Bomhard, B.; Brown, C.; Bruno, J.; et al. Global biodiversity: Indicators of recent declines. Science 2010, 328, 1164–1168. [Google Scholar] [CrossRef] [PubMed]
  2. Johnson, C.N.; Balmford, A.; Brook, B.W.; Buettel, J.C.; Galetti, M.; Guangchun, L.; Wilmshurst, J.M. Biodiversity losses and conservation responses in the Anthropocene. Science 2017, 356, 270–275. [Google Scholar] [CrossRef] [PubMed]
  3. Richman, N.I.; Böhm, M.; Adams, S.B.; Alvarez, F.; Bergey, E.A.; Bunn, J.J.S.; Burnham, Q.; Cordeiro, J.; Coughran, J.; Crandall, K.A.; et al. Multiple drivers of decline in the global status of freshwater crayfish (Decapoda: Astacidea). Philos. Trans. R. Soc Biol. Sci. 2015, 370, 20140060. [Google Scholar] [CrossRef] [PubMed]
  4. Reid, A.J.; Carlson, A.K.; Creed, I.F.; Eliason, E.J.; Gell, P.A.; Johnson, P.T.J.; Kidd, K.A.; MacCormack, T.J.; Olden, J.D.; Ormerod, S.J.; et al. Emerging threats and persistent conservation challenges for freshwater biodiversity. Biol. Rev. 2019, 94, 849–873. [Google Scholar] [CrossRef]
  5. Maxwell, S.; Fuller, R.A.; Brooks, T.M.; Watson, J.E.M. The ravages of guns, nets and bulldozers. Nature 2016, 536, 143–145. [Google Scholar] [CrossRef] [PubMed]
  6. Gherardi, F. Invasive crayfish and freshwater fishes of the world. Rev. Sci. Tech. (Off. Int. Epizoot.) 2010, 29, 241–254. [Google Scholar] [CrossRef] [PubMed]
  7. Pyšek, P.; Hulme, P.E.; Simberloff, D.; Bacher, S.; Blackburn, T.M.; Carlton, J.T.; Dawson, W.; Essl, F.; Foxcroft, L.C.; Genovesi, P.; et al. Scientists’ warning on invasive alien species. Biol. Rev. 2020, 95, 1511–1534. [Google Scholar] [CrossRef]
  8. Doherty, T.S.; Dickman, C.R.; Nimmo, D.G.; Ritchie, E.G. Multiple threats, or multiplying the threats? Interactions between invasive predators AC S. Kaminskas Pacific Conservation Biology and other ecological disturbances. Biol. Conserv. 2015, 190, 60–68. [Google Scholar] [CrossRef]
  9. Clavero, M.; García-Berthou, M. Invasive species are a leading cause of animal extinctions. Trends Ecol. Evol. 2005, 20, 110. [Google Scholar] [CrossRef]
  10. Kaminskas, S.; Lymbery, A. Alien fish ascendancy and native fish extinction: Ecological history and observations on the Lower Goodradigbee River, Australia. Pac. Conserv. Biol. 2022, 29, 38–73. [Google Scholar] [CrossRef]
  11. Piria, M.; Simonović, P.; Kalogianni, E.; Vardakas, L.; Koutsikos, N.; Zanella, D.; Ristovska, M.; Apostolou, A.; Adrović, A.; Mrdak, D.; et al. Alien freshwater fish species in the Balkans—Vectors and pathways of introduction. Fish. Fish. 2018, 19, 138–169. [Google Scholar] [CrossRef]
  12. Yao, M.; Zhang, S.; Lu, Q.; Chen, X.; Zhang, S.Y.; Kong, Y.; Zhao, J. Fishing for fish environmental DNA: Ecological applications, methodological considerations, surveying designs, and ways forward. Mol. Ecol. 2022, 31, 5132–5164. [Google Scholar] [CrossRef] [PubMed]
  13. Harper, L.R.; Handley, L.L.; Hahn, C.; Boonham, N.; Rees, H.C.; Gough, K.C.; Lewis, E.; Adams, I.P.; Brotherton, P.; Phillips, S.; et al. Needle in a haystack? A comparison of eDNA metabarcoding and targeted qPCR for detection of the great crested newt (Triturus cristatus). Ecol. Evol. 2018, 8, 6330–6341. [Google Scholar] [CrossRef] [PubMed]
  14. Barnes, M.A.; Turner, C.R.; Jerde, C.L.; Renshaw, M.A.; Chadderton, W.L.; Lodge, D.M. Environmental conditions influence eDNA persistence in aquatic systems. Environ. Sci. Technol. 2014, 48, 1819–1827. [Google Scholar] [CrossRef] [PubMed]
  15. McKee, A.M.; Spear, S.F.; Pierson, T.W. The effect of dilution and the use of a post-extraction nucleic acid purification column on the accuracy, precision, and inhibition of environmental DNA samples. Biol. Conserv. 2015, 183, 70–76. [Google Scholar] [CrossRef]
  16. Mauvisseau, Q.; Kalogianni, E.; Zimmerman, B.; Bulling, M.; Brys, R.; Sweet, M. eDNA-based monitoring: Advancement in management and conservation of critically endangered killifish species. Environ. DNA 2020, 2, 601–613. [Google Scholar] [CrossRef]
  17. Francis, R.A. Handbook of Global Freshwater Invasive Species, 2nd ed.; Earthscan: New York, NY, USA, 2012; 455p. [Google Scholar]
  18. Pyke, G.H. Plague minnow or mosquito fish? A review of the biology and impacts of introduced Gambusia species. Annu. Rev. Ecol. Evol. 2008, 39, 171–191. [Google Scholar] [CrossRef]
  19. Koutsikos, N.; Zogaris, S.; Vardakas, L.; Kalantzi, O.I.; Dimitriou, E.; Economou, A.N. Tracking non-indigenous fishes in lotic ecosystems: Invasive patterns at different spatial scales in Greece. Sci. Total Environ. 2019, 659, 384–400. [Google Scholar] [CrossRef]
  20. Vardakas, L.; Koutsikos, N.; Perdikaris, C.; Petriki, O.; Bobori, D.; Zogaris, S.; Giakoumi, S.; Fitoka, E.; Tompoulidou, M.; Tsiaoussi, V.; et al. The fish fauna in lentic ecosystems of Greece. Mediterr. Mar. Sci. 2022, 23, 223–265. [Google Scholar] [CrossRef]
  21. CEN. EN 14011; Water Quality—Sampling of Fish with Electricity. European Committee for Standardization: Brussels, Belgium, 2003; 18p.
  22. Ye, J.; Coulouris, G.; Zaretskaya, L.; Cutcutache, L.; Rozen, S.; Madden, T.L. Primer-BLAST: A tool to design target-specific primers for polymerase chain reaction. BMC Bioinform. 2012, 13, 134. [Google Scholar] [CrossRef]
  23. Spens, J.; Evans, A.R.; Halfmaerten, D.; Knudsen, S.W.; Sengupta, M.E.; Mak, S.S.T.; Sigsgaard, E.E.; Hellström, M. Comparison of capture and storage methods for aqueous macrobial eDNA using an optimized extraction protocol: Advantage of enclosed filter. Methods Ecol. Evol. 2017, 8, 635–645. [Google Scholar] [CrossRef]
  24. Weldon, L.; O’Leary, C.; Steer, M.; Newton, L.; Macdonald, H.; Sargeant, S.L. A comparison of European eel Anguilla anguilla eDNA concentrations to fyke net catches in five Irish lakes. Environ. DNA 2020, 2, 587–600. [Google Scholar] [CrossRef]
  25. Mauvisseau, Q.; Burian, A.; Gibson, C.; Brys, R.; Ramsey, A.; Sweet, M. Influence of accuracy, repeatability and detection probability in the reliability of species-specific eDNA based approaches. Sci. Rep. 2019, 9, 580. [Google Scholar] [CrossRef] [PubMed]
  26. Mauvisseau, Q.; Davy-Bowker, J.; Bulling, M.; Brys, R.; Neyrinck, S.; Troth, C.; Sweet, M. Combining ddPCR and environmental DNA to improve detection capabilities of a critically endangered freshwater invertebrate. Sci. Rep. 2019, 9, 14064. [Google Scholar] [CrossRef] [PubMed]
  27. MacKenzie, D.I.; Nichols, J.D.; Lachman, G.B.; Droege, S.; Andrew Royle, J.; Langtimm, C.A. Estimating site occupancy rates when detection probabilities are less than one. Ecology 2002, 83, 2248–2255. [Google Scholar] [CrossRef]
  28. MacKenzie, D.I.; Nichols, J.D.; Royle, J.A.; Pollock, K.H.; Bailey, L.L.; Hines., J.E. Occupancy Estimation and Modeling: Inferring Patterns and Dynamics of Species Occurrence, 1st ed.; Academic Press: New York, NY, USA, 2006; 643p. [Google Scholar]
  29. Royle, J.A.; Dorazio, R.M. Hierarchical Modeling and Inference in Ecology: The Analysis of Data from Populations, Metapopulations and Communities, 1st ed.; Academic Press: London, UK, 2008; 443p. [Google Scholar]
  30. R Core Team. R: A Language and Environment for Statistical Computing; R Foundation for Statistical Computing: Vienna, Austria, 2023. [Google Scholar]
  31. Burnham, K.P.; Anderson, D.R. Multimodel inference: Understanding AIC and BIC in model selection. Sociol. Methods Res. 2004, 33, 261–304. [Google Scholar] [CrossRef]
  32. Dorazio, R.M.; Erickson, R.A. ednaoccupancy: An r package for multiscale occupancy modelling of environmental DNA data. Mol. Ecol. Resour. 2018, 18, 368–380. [Google Scholar] [CrossRef]
  33. Ghosh, S.K.; Gelfand, A.E. Latent risk approach for modeling individual level data consisting of multiple event times. J. Statist. Res. 1998, 32, 23–38. [Google Scholar]
  34. Watanabe, S.; Opper, M. Asymptotic equivalence of Bayes cross validation and widely applicable information criterion in singular learning theory. J. Mach. Learn. Res. 2010, 11, 3571–3594. [Google Scholar]
  35. Watanabe, S. A widely applicable Bayesian information criterion. J. Mach. Learn. Res. 2013, 14, 867–897. [Google Scholar]
  36. Diana, A.; Matechou, E.; Griffin, J.E.; Buxton, A.S.; Griffiths, R.A. An RShiny app for modelling environmental DNA data: Accounting for false positive and false negative observation error. Ecography 2021, 44, 1838–1844. [Google Scholar] [CrossRef]
  37. Griffin, J.E.; Matechou, E.; Buxton, A.S.; Bormpoudakis, D.; Griffiths, R.A. Modelling environmental DNA data; Bayesian variable selection accounting for false positive and false negative errors. J. R. Stat. Soc. Ser. C Appl. Stat. 2020, 69, 377–392. [Google Scholar] [CrossRef]
  38. Kalogianni, E.; Koutsikos, N.; Karaouzas, I.; Smeti, E.; Kapakos, Y.; Laschou, S.; Dimitriou, E.; Vardakas, L. REVIVE: A feasibility assessment tool for freshwater fish conservation translocations in Mediterranean rivers. Sci. Total Environ. 2023, 862, 160595. [Google Scholar] [CrossRef] [PubMed]
  39. Jerde, C.L.; Chadderton, W.L.; Mahon, A.R.; Renshaw, M.A.; Corush, J.; Budny, M.L.; Mysorekar, S.; Lodge, D.M. Detection of Asian carp DNA as part of a Great Lakes basin-wide surveillance program. Can. J. Fish. Aquat. Sci. 2013, 70, 522–526. [Google Scholar] [CrossRef]
  40. Evans, N.T.; Shirey, P.D.; Wieringa, J.G.; Mahon, A.R.; Lamberti, G.A. Comparative cost and effort of fish distribution detection via environmental DNA analysis and electrofishing. Fisheries 2017, 42, 90–99. [Google Scholar] [CrossRef]
  41. Rees, H.C.; Maddison, B.C.; Middleditch, D.J.; Patmore, J.R.; Gough, K.C. The detection of aquatic animal species using environmental DNA–a review of eDNA as a survey tool in ecology. J. Applied Ecol. 2014, 51, 1450–1459. [Google Scholar] [CrossRef]
  42. Taberlet, P.; Bonin, A.; Zinger, L.; Coissac, E. Environmental DNA for Biodiversity Research and Monitoring, 1st ed.; Oxford University Press: Oxford, UK, 2018; 252p. [Google Scholar]
  43. Troth, C.R.; Sweet, M.J.; Nightingale, J.; Burian, A. Seasonality, DNA degradation and spatial heterogeneity as drivers of eDNA detection dynamics. Sci. Total Environ. 2021, 768, 144466. [Google Scholar] [CrossRef]
  44. Burian, A.; Mauvisseau, Q.; Bulling, M.; Domisch, S.; Qian, S.; Sweet, M. Improving the reliability of eDNA data interpretation. Mol. Ecol. Resour. 2021, 21, 1422–1433. [Google Scholar] [CrossRef]
  45. Brönmark, C.; Herrmann, J.; Malmqvist, B.; Otto, C.; Sjöström, P. Animal community structure as a function of stream size. Hydrobiologia 1984, 112, 73–79. [Google Scholar] [CrossRef]
  46. Oberdoff, T.; Guégan, J.F.; Hugueny, B. Global scale patterns of fish species richness in rivers. Ecography 1995, 18, 345–352. [Google Scholar] [CrossRef]
  47. Guégan, J.F.; Lek, S.; Oberdorff, T. Energy availability and habitat heterogeneity predict global riverine fish diversity. Nature 1998, 391, 382–384. [Google Scholar] [CrossRef]
  48. Shogren, A.J.; Tank, J.L.; Andruszkiewicz, E.; Olds, B.; Mahon, A.R.; Jerde, C.L.; Bolster, D. Controls on eDNA movement in streams: Transport, retention, and resuspension. Sci. Rep. 2017, 7, 5065. [Google Scholar] [CrossRef] [PubMed]
  49. Zenetos, A.; Pancucci-Papadopoulou, M.; Zogaris, S.; Papastergiadou, E.; Vardakas, L.; Aligizaki, K.; Economou, A.N. Aquatic alien species in Greece (2009): Tracking sources, patterns and effects on the ecosystem. J. Biol. Res. Thessalon. 2009, 12, 135–172. [Google Scholar]
  50. Livadas, G.A.; Sphangos, J.C. Malaria in Greece (1930–1940), Research Control, 1st ed.; Pyrsos Press: Athens, Greece, 1941; 238p. [Google Scholar]
  51. Bartlett, B.R. Introduced Parasites and Predators of Arthropod Pests and Weeds: A World Review. No. 480 Agricultural Research Service; US Department of Agriculture: Washington, DC, USA, 1978; 545p. [Google Scholar]
  52. Kalogianni, E.; Giakoumi, S.; Andriopoulou, A.; Chatzinikolaou, Y. Prey utilisation and trophic overlap between the non native mosquitofish and a native fish in two Mediterranean rivers. Mediterr. Mar. Sci. 2014, 15, 287–301. [Google Scholar] [CrossRef]
  53. Kalogianni, E.; Koutsikos, N.; Vardakas, L.; Giakoumi, S.; Chatzinikolaou, Y.; Economou, A.N. Impacts of the alien mosquitofish on the abundance and condition of two Mediterranean native fish. Mediterr. Mar. Sci. 2019, 20, 727–735. [Google Scholar] [CrossRef]
  54. Rosecchi, E.; Crivelli, A.J.; Catsadorakis, G. The establishment and impact of Pseudorasbora parva, an exotic fish species introduced into Lake Mikri Prespa (north-western Greece). Aquat. Conserv: Mar. Freshw. Ecosyst. 1993, 3, 223–231. [Google Scholar] [CrossRef]
  55. Holčík, J. Fish introductions in Europe with particular reference to its central and eastern part. Can. J. Fish. Aquat. Sci. 1991, 48, 13–23. [Google Scholar] [CrossRef]
  56. Koutsikos, N.; Vardakas, L.; Vavalidis, T.; Kalogianni, E.; Dimitriou, E.; Kalantzi, O.I.; Zogaris, S. Defining non-indigenous fish assemblage types in Mediterranean rivers: Network analysis and management implications. J. Environ. Manag. 2021, 278, 111551. [Google Scholar] [CrossRef]
  57. Simon, A.; Gozlan, R.E.; Robert Britton, J.; Van Oosterhout, C.; Hänfling, B. Human induced stepping-stone colonisation of an admixed founder population: The spread of topmouth gudgeon (Pseudorasbora parva) in Europe. Aquat. Sci. 2015, 77, 17–25. [Google Scholar] [CrossRef]
  58. Gozlan, R.E.; Andreou, D.; Asaeda, T.; Beyer, K.; Bouhadad, R.; Burnard, D.; Caiola, N.; Cakic, P.; Djikanovic, V.; Esmaeili, H.R.; et al. Pan-continental invasion of Pseudorasbora parva: Towards a better understanding of freshwater fish invasions. Fish. Fish. 2010, 11, 315–340. [Google Scholar] [CrossRef]
  59. Pinder, A.C.; Davies, G.D.; Brazier, M.; Britton, J.R. A case study of the population ecology of a topmouth gudgeon (Pseudorasbora parva) population in the UK and the implication for native fish communities. Aquat. Conserv: Mar. Freshw. Ecosyst. 2006, 17, 749–759. [Google Scholar] [CrossRef]
  60. Spikmans, F.; Lemmers, P.; op den Camp, H.J.; van Haren, E.; Kappen, F.; Blaakmeer, A.; van Der Velde, G.; van Langevelde, F.; Leuven, R.S.; van Alen, T.A. Impact of the invasive alien topmouth gudgeon (Pseudorasbora parva) and its associated parasite Sphaerothecum destruens on native fish species. Biol. Invasions 2020, 22, 587–601. [Google Scholar] [CrossRef]
  61. Hulme, P.E. Beyond control: Wider implications for the management of biological invasions. J. Appl. Ecol. 2006, 43, 835–847. [Google Scholar] [CrossRef]
  62. Koutsikos, N.; Vardakas, L.; Kalantzi, O.I.; Zogaris, S. Patterns of spatial overlap between non-indigenous and critically endangered freshwater fishes from a Mediterranean biodiversity hotspot. Diversity 2021, 13, 233. [Google Scholar] [CrossRef]
  63. Aschonitis, V.G.; Gavioli, A.; Lanzoni, M.; Fano, E.A.; Feld, C.; Castaldelli, G. Proposing priorities of intervention for the recovery of native fish populations using hierarchical ranking of environmental and exotic species impact. J. Environ. Manag. 2018, 210, 36–50. [Google Scholar] [CrossRef]
  64. Brys, R.; Haegeman, A.; Halfmaerten, D.; Neyrinck, S.; Staelens, A.; Auwerx, J.; Ruttink, T. Monitoring of spatiotemporal occupancy patterns of fish and amphibian species in a lentic aquatic system using environmental DNA. Mol. Ecol. 2021, 30, 3097–3110. [Google Scholar] [CrossRef]
  65. Trebitz, A.S.; Hoffman, J.C.; Darling, J.A.; Pilgrim, E.M.; Kelly, J.R.; Brown, E.A.; Chadderton, W.L.; Egan, S.P.; Grey, E.K.; Hashsham, S.A.; et al. Early detection monitoring for aquatic non-indigenous species: Optimizing surveillance, incorporating advanced technologies, and identifying research needs. J. Environ. Manag. 2017, 202, 299–310. [Google Scholar] [CrossRef]
  66. Davies, S.J.; Jordaan, M.S.; Karsten, M.; Terblanche, J.S.; Turner, A.A.; van Wilgen, N.J.; Veldtman, R.; Zengeya, T.A.; Measey, J. Experience and Lessons from Alien and Invasive Animal Control Projects in South Africa. In Biological Invasions in South Africa, 1st ed.; van Wilgen, N.J., Measey, J., Richardson, D.M., Wilson, J., Zengeya, T.A., Eds.; Springer International Publishing: Cham, Switzerland, 2020; pp. 629–663. [Google Scholar] [CrossRef]
Figure 1. Map showing the locations at which G. holbrooki was detected through the eDNA method and/or through fish sampling.
Diversity 16 00028 g001
Figure 2. Posterior conditional probability of species presence given x positive qPCR replicates for G. holbrooki (open circles) and P. parva (black circles).
Diversity 16 00028 g002
Figure 3. Map showing the locations at which P. parva was detected through the eDNA method and/or through fish sampling.
Diversity 16 00028 g003
Figure 4. Inclusion probabilities of the selected environmental variables for G. holbrooki (blue) and P. parva (brown). Bolder colours highlight the five environmental variables with the highest inclusion probabilities.
Diversity 16 00028 g004
Figure 5. Posterior probability of G. holbrooki eDNA detection in relation to the percentage of fast habitat in the site’s area (A), the site’s wetted width (B), and the percentage of coarse substrate in the site’s area (C). For more details, see Tables S4 and S5.
Diversity 16 00028 g005
Figure 6. Posterior probability of P. parva eDNA detection in relation to turbidity (A) and the site’s wetted width (B). For more details, see Tables S6 and S7.
Diversity 16 00028 g006
Table 1. Summary of eDNA and electrofishing results, alongside key physiochemical parameters and amount of water filtered at each site tested. eDNA score shows the number of positive qPCR amplifications and the total number run; density (inds/m2) gives a measure of the number of fish detected using electrofishing.
SiteRiver BasinG. holbrooki
eDNA Score
G. holbrooki DensityP. parva eDNA ScoreP. parva DensityVolume Filtered (X3)Mean Flow (m/s)Temperature
(°C)
pH
1Evros18/180.9411/120.3110000.0019.447.66
2Bospos1/180.300/120.001800.3520.977.57
3Strymonas17/180.0011/120.023001.3318.257.9
4Gallikos12/180.270/120.765400.11198.23
5Axios4/180.420/120.097200.0517.97.9
6Aliakmonas7/180.010/120.004200.26118.13
7Agios Germanos (Prespa L.)0/180.008/121.5310000.2411.066.59
8Kalamas0/180.170/120.007800.1416.047.14
9Pinios Thessaly13/180.600/120.001800.0116.527.88
10Spercheios2/180.000/120.003000.3517.137.98
11Evinos0/180.000/120.0010000.0323.247.66
12Mornos0/180.000/120.006000.1017.047.61
13Peirou-Verga-Pineiou3/180.132/120.014800.1519.367.69
14Peirou-Verga-Pineiou0/180.001/120.114800.1923.277.91
15Neda0/180.007/120.0010000.4719.467.42
16Peristera0/180.000/120.0010000.1319.777.69
Table 2. Bayesian estimates of the effects of covariates on the probability of detection (p) for G. holbrooki where the numbers in brackets represent each estimate’s 95% credible intervals. Bold values indicate statistically significant results.
Mean2.50%97.50%
beta. (intercept)1.154 (0.0108)0.133 (0.0120)2.484 (0.0163)
alpha. (intercept)1.137 (0.0158)0.131 (0.0104)2.481 (0.0919)
delta. (intercept)−1.115 (0.0071)−1.782 (0.0154)−0.516 (0.0172)
delta.fasthabpr−0.870 (0.0036)−1.261 (0.0092)−0.508 (0.0087)
delta.wetwidcm0.955 (0.0035)0.604 (0.0091)1.333 (0.0089)
delta.coarsubpr−1.215 (0.0140)−2.505 (0.0292)−0.068 (0.0414)
Table 3. Bayesian estimates of the effects of covariates on the probability of detection at a site (p) for P. parva, where the numbers in brackets represent each estimate’s 95% credible intervals. Bold values indicate statistically significant results.
Mean2.5%97.5%
beta. (Intercept)0.363 (0.0172)−0.686 (0.0096)1.973 (0.0281)
alpha. (Intercept)0.576 (0.0990)−0.644 (0.0084)6.553 (0.0000)
delta. (Intercept)−0.049 (0.0011)−0.345 (0.0027)0.243 (0.0023)
delta.Turb−0.310 (0.0010)−0.556 (0.0030)−0.072 (0.0021)
delta.WetWidcm0.603 (0.0014)0.273 (0.0028)0.951 (0.0040)
Disclaimer/Publisher’s Note: The statements, opinions and data contained in all publications are solely those of the individual author(s) and contributor(s) and not of MDPI and/or the editor(s). MDPI and/or the editor(s) disclaim responsibility for any injury to people or property resulting from any ideas, methods, instructions or products referred to in the content.

