Article

Transcriptomic Analysis of Medicago truncatula under Long-Day Conditions

1
Department of Grassland Science, College of Animal Sciences, Guizhou University, Guiyang 550025, China
2
Institute of Prataculture, Guizhou Academy of Agricultural Sciences, Guiyang 550006, China
*
Author to whom correspondence should be addressed.
Diversity 2023, 15(9), 1020; https://doi.org/10.3390/d15091020
Submission received: 28 July 2023 / Revised: 10 September 2023 / Accepted: 12 September 2023 / Published: 15 September 2023
(This article belongs to the Section Plant Diversity)

Abstract

:
The objective of this research was to understand the expression characteristics and biological functions of Medicago truncatula genes under long-day conditions. The leaves of “R108” tribulus Medicago truncatula at the branch stage (A), bud stage (B), initial flowering stage (C), and full flowering stage (D) were sequenced using RNA-Seq technology. The genome of Medicago truncatula, a related species of Medicago truncatula, was used as the reference genome for sequence comparison. The transcriptomes of three adjacent periods (A vs. B, B vs. C, and C vs. D) were analyzed for differential gene expression and these genes were screened. A total of 6875 differentially expressed genes were detected. GO functional analysis showed that differentially expressed genes were mainly involved in biological processes, cell components, and molecular functions, among which the most differentially expressed genes were involved in the synthesis of cell components. KEGG enrichment analysis showed that the differentially expressed genes were mainly involved in circadian rhythm, photosynthetic antenna protein, ribosome metabolism, and other pathways. The number of single nucleotide variants detected by cSNP analysis was 312,875, and the frequency of A/G and C/T were the highest. The function of eggNOG was divided into 23 categories, with a total of 26,745 genes having similarities, while 9008 genes were classified as having an unknown function, 2669 genes were classified as part of signal transduction mechanisms, and 2194 genes were classified as being involved in transcription. In different developmental stages (A vs. B, B vs. C, and C vs. D), 3463 up-regulated and 3412 down-regulated differentially expressed genes were found. The difference between up-regulated and down-regulated genes was more noteworthy at the bud stage and the initial flowering stage. In addition, a total of 79 flowering genes were found, of which 51 differential genes were identified as participating in the photoperiodic regulation pathway, consisting of 23 differential genes that were up-regulated, and 28 differential genes that were down-regulated. The ratios of gene-LOC11410562(GI), gene-LOC11435974(CO), gene-LOC11422615(TOC1), and gene-LOC11432385(LHY) were higher than those of gene-LOC25500742(PHYA) and gene-LOC11 431402(ELF3); gene-LOC11434778(Col13), gene-LOC25498015(Col6), and gene-LOC11415514(Col9) were pre-expressed. The above differentially expressed genes were significantly expressed in different developmental stages of Medicago truncatula, which lays a foundation for further study of the molecular mechanism of Medicago truncatula.

1. Introduction

The photoperiod not only plays a crucial role in flowering, but also has a significant impact on plant growth cycle, stem branching, stress resistance, and fruit quality [1,2]. Currently, most studies on the photoperiodic regulation of flowering have focused on the model plant Arabidopsis thaliana, providing a comprehensive understanding of the mechanism involved [3]. In this plant, the biological clock controls the transcription of At CONSTANS mRNA so that it reaches its peak in the evening. This is mediated by the activity of the photoreceptors cry2 and phyA, which stabilize the At CONSTANS proteins and encourage the expression of flowering integrons a and b [4]. LHY and CCA1 are also part of A. thaliana’s core circadian oscillator, and both of their expression levels peak in the morning. The response regulator (PSEUDO-RESPONSE REGULATOR) family of genes peaks between 11 a.m. and 18 p.m. [5], which is also part of the LHY negative feedback loop. Finally, GI, EARLY 3, and EARLY 4 reach their maximum at night, and they exhibit repressive effects on genes expressed earlier in the day [6]. Therefore, it is important to understand the mechanisms of flowering regulation in the model plant A. thaliana for the regulation of flowering in Medicago truncatula.
The annual forage plant Medicago truncatula, which is a member of the legume family, has advantages such as a quick growth cycle, self-pollination, and a high fruiting rate [7]. More and more studies on Medicago truncatula have been undertaken in recent years, and it has also been developed into a model plant for legumes. This has substantial theoretical implications for the study of legume forage grasses [8,9] and genetics [10]. Medicago truncatula has a tiny diploid genome, a brief life cycle, and several genes that are related to ft. Among them, Mt FTa is impacted by extended spring flowering and up-regulates its expression in response to a long day (LD) [11,12]. Moreover, flowering genes that control photoperiods have been studied and found in Medicago truncatula [13,14], but it is unknown which gene converts light signals into a circadian biological clock, thereby providing a photoperiod to induce flowering regulation; in Pisum sativum L., homologues of the relevant genes regulating the biological clock, ELF3, LUX, and ELF4, are involved in the expression of the FT family of genes, and inhibit the flowering of Pisum sativum L. under short-daylight conditions [15,16,17]. In photoperiodic regulation, the Medicago truncatula gene CO did not play a significant role for its own FT genes, and the Mt COL gene also had no effect on flowering phenotype when overexpressed in A. thaliana [18]. Furthermore, the GmE1 gene of Glycine max acts as a flowering repressor under long-daylight conditions, with higher expression than in SD conditions [19], and it is also affected by GmFT2a and GmFT5a, resulting in delayed flowering [20,21]. Under long-daylight conditions, Medicago truncatula flowering is affected by the tnt1 mutant of MtE1, and shows delayed flowering, which could lead to the hypothesis that MtE1 contributes to early flowering of Medicago truncatula by up-regulating the FT gene [14,22]. In addition, researchers are also investigating the molecular regulatory mechanisms of the initiation of flower formation through the differences in photoperiodic responses of other plants. Jin et al. (2018) [23] used the temperate maize inbred line B73 as a test material and found that Zm COL3 is a flowering repressor for maize and that overexpression of Zm COL3 under various light treatments could delay flowering by about 4 h. The expression of the Zm COL3 gene can transactivate the transcription of the Zm CCT gene and affect circadian rhythms, and then inhibit the flowering of the plant. In a study of temperate self-inbred maize lines, Meng et al. (2011) [24] found that the Zm ZCN8 gene was the only gene with flower-forming activity, and Zm CCT, Zm CCT9, and so on, were flowering repressor genes that could negatively feedback to regulate the expression of the Zm ZCN8 gene, thus inhibiting flowering; Chen et al. (2014) [25] studied PPD1 using phyC in wheat and found that phyC can activate the expression of PPD1, causing wheat to flower earlier under long-day conditions, but showing no effect under short-day conditions.
At present, the importance of Medicago truncatula in breeding is increasing, but there is still a lack of transcriptomic studies on Medicago truncatula in leaves at different developmental stages. Therefore, using RNA-Seq technology, we used leaves of Medicago truncatula at the branching stage (A), budding stage (B), first flowering stage (C), and the blooming stage (D) as study materials and analyzed the expression characteristics of the related genes and biological functions of Medicago truncatula at these four different developmental stages to provide a basis for revealing the molecular mechanism of Medicago truncatula under long-day conditions.

2. Materials and Methods

2.1. Test Material

The material was Medicago truncatula L. ‘R108’, provided by the Grass Research Institute of Guizhou Provincial Academy of Agricultural Sciences. Fresh leaves of Medicago truncatula were collected from the artificial climate chamber of Guizhou Institute of Grass Research on 13 February, 28 February, 27 March, and 17 April 2023, representing meristematic stage (A), bud stage (B), first flowering stage (C), and full flowering stage (D), respectively. Samples were mixed at the time of sampling for three biological replications. The samples were quick-frozen in liquid nitrogen, embedded in dry ice, and sent for transcriptome sequencing at Suzhou Panomics Biomedical Technology Co. (Panomic Biomedical Technology Co., Ltd., Suzhou, China).

2.2. Methods

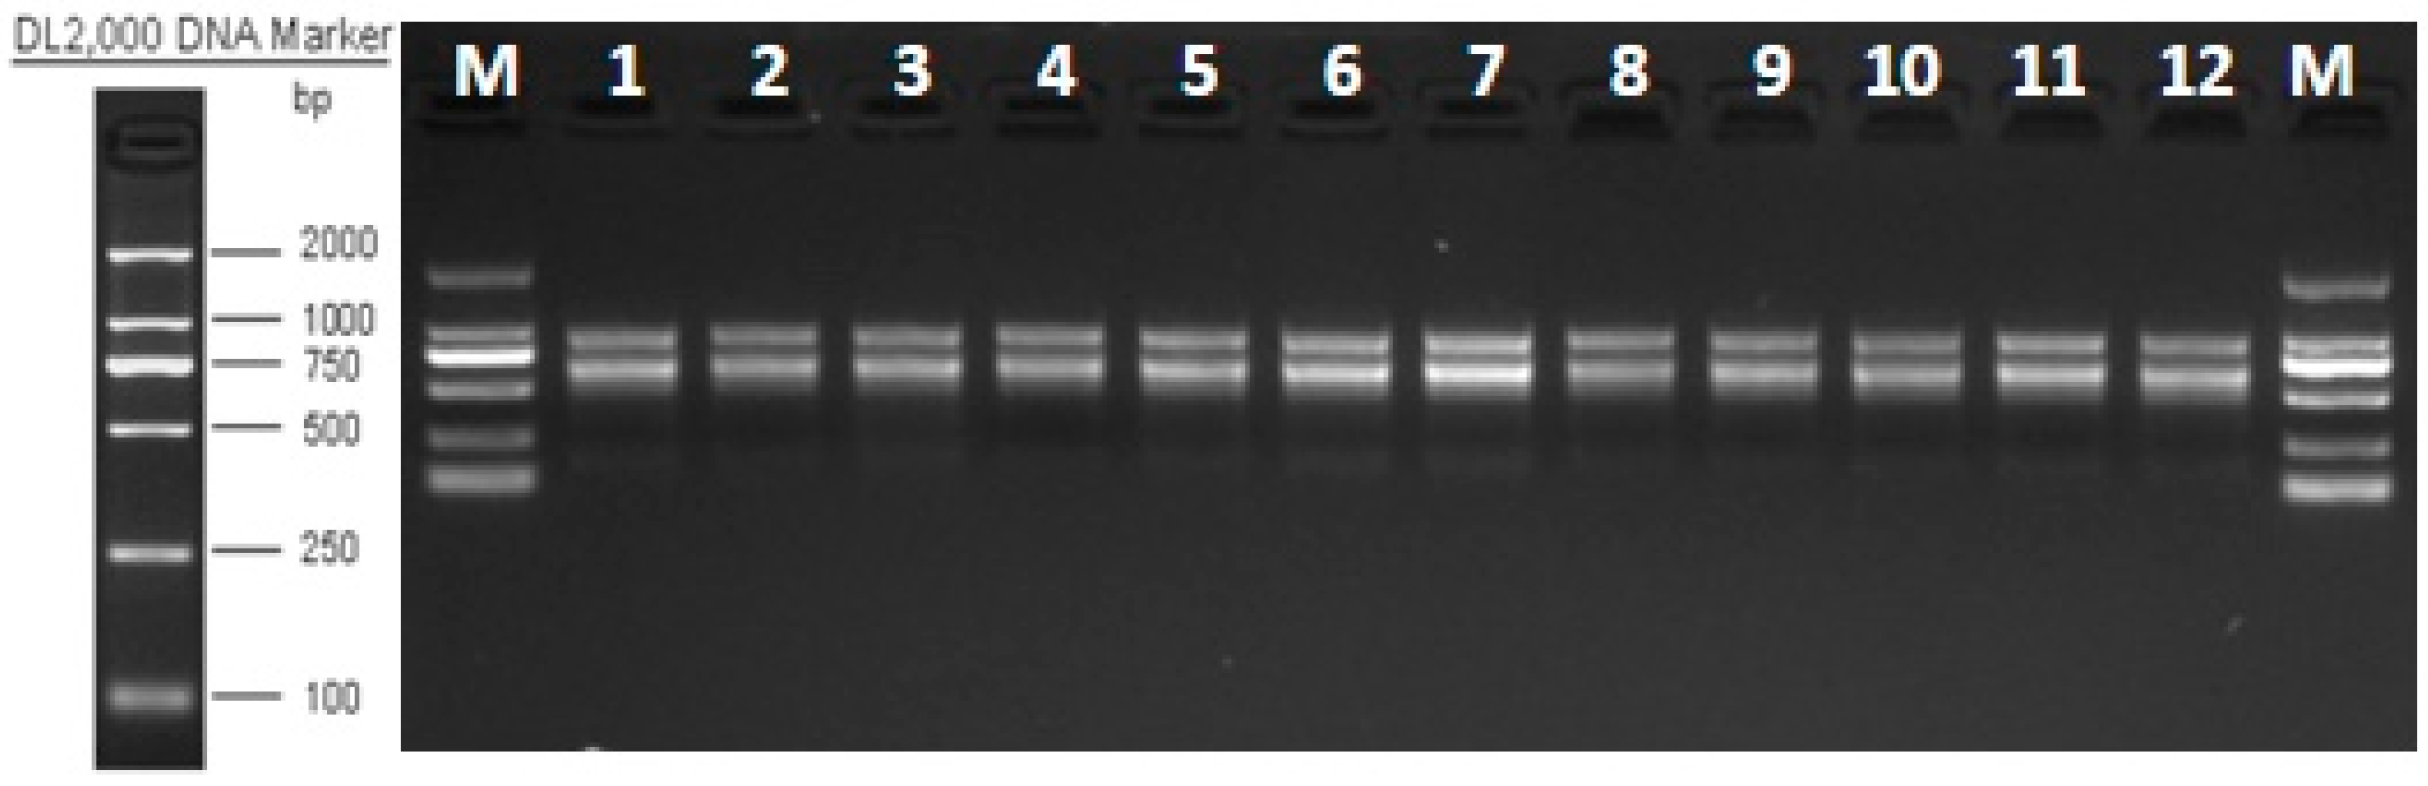
2.2.1. Total RNA Extraction and Detection, cDNA Library Construction, and Transcriptome Sequencing

Using the TIANGEN Magnetic Bead Method Plant Total RNA Extraction Kit (Tiangen Biochemical Technology Co., Ltd., Peking, China), total RNA was extracted from the leaves of ‘R108’ Medicago truncatula at various developmental stages. All procedures were carried out in accordance with the instructions. Thermo Scientific NanoDrop 2000 (Thermofly Biotech, Shanghai, China) was used to assess the concentration and purity of total RNA, and the Agilent 2100 Bioanalyzer (Thermofly Biotech, Shanghai, China) and RNA 6000 Nano kit 5067-1511 (Thermofly Biotech, Shanghai, China) were used to determine the integrity of the sample. As can be seen in Figure 1, the samples were of high quality. NEBNext Ultra II RNA Library Prep Kit for Illumina (TIANGEN, China) (NEBNext Ultra Directional RNA Library Prep Kit for Illumina) was used to select and analyze the total RNA with a total amount ≥1 μg. Oligo(dT) magnetic beads were used to enrich for mRNAs with polyA tails, which were then randomly interrupted by ion interruption using divalent cations. To create cDNA, fragmented mRNA was employed as a template and randomly chosen oligonucleotides as primers. After clearing quality control, cDNA was sequenced using next-generation sequencing (NGS) technology based on Illumina HiSeq. Suzhou Panomic Biopharmaceutical Technology Co., Ltd., China carried out this process.

2.2.2. Raw Data Processing and Comparison with Reference Genome Sequence

The downlinked data will have some reads with splices and low quality, which were filtered using cutadapt software (v1.18). The high-quality sequences (clean data) obtained after filtering were compared with the reference genome (https://ftp.ncbi.nlm.nih.gov/genomes/all/GCF/003/473/485/GCF_003473485.1_MtrunA17r5.0ANR/, accessed on 14 June 2023) using fastp [26] software (0.22.0).

2.2.3. Analysis of Differential Gene Expressions (DEGs)

Expression was normalized using FPKM [27] to estimate the expression levels of genes in Medicago truncatula at different developmental stages. Expression difference multiplicity |log2FoldChange| > 1 and significance p-value < 0.05 groups were used as screening criteria, and gene expression was differentially analyzed using DESeq (1.38.3) software.

2.2.4. Analysis of GO Functional Enrichment

Significantly enriched GO terms [28] were classified into three major categories: cellular components, molecular functions, and biological processes involved. p-value was calculated by the hypergeometric distribution method for GO terms significantly enriched in differential genes, and the criterion for significant enrichment was p-value < 0.05.

2.2.5. Analysis of KEGG Pathway Enrichment

Significant enrichment of DEGs was analyzed using KEGG [29] as the database, and the extent of enrichment was analyzed to obtain the pathway with significant enrichment as measured by rich factor, FDR value, and the number of genes enriched in this pathway.

2.2.6. Analysis of cSNP Structure

The Varscan (version 2.3.7) program was used to obtain cSNP loci. To ensure the quality of subsequent analyses, cSNP [30] was further screened with sequencing depth ≥ 8, mutant base sequencing depth ≥ 2, base mass ≥ 20, and p ≤ 0.01.

2.2.7. Analysis of eggNOG

Contigs, transcripts, and genes were obtained by de novo splicing using Trinity software (2.15.1). Gene function annotation of clustered genes was performed using BLAST software (version 2.2.30+). The database eggNOG [31] (evolutionary genealogy of genes: Non-supervised orthologous groups) was used for functional annotation of genes, and genes were functionally classified at different developmental stages of Medicago truncatula by eggNOG database.

3. Results

3.1. Analysis of RNA-Seq Sequence

After sequencing quality control, the number of reads in the raw data of each sample group was 42296358~52817612, the number of reads after filtering of the raw data (clean reads) was 41995038~52325294, and the proportion of base quality value Q30 in the 12 samples was higher than 93%, which indicated that the quality of sequencing data was reliable and could be used for the subsequent analysis (Table 1).

3.2. Functional Annotation of Genes

Functional annotation of the clustered genes (Table 2) showed that all the genes could be annotated in the Ensembl database; 6490 genes could be annotated in the GO database, accounting for 53.81% of the total; 4351 genes could be annotated in the KEGG database, accounting for 36.07% of the total; 9780 genes could be annotated in the eggNOG database, accounting for 81.09% of the total; and 8269 genes could be annotated in the SwissProt database, accounting for 68.56% of the total.

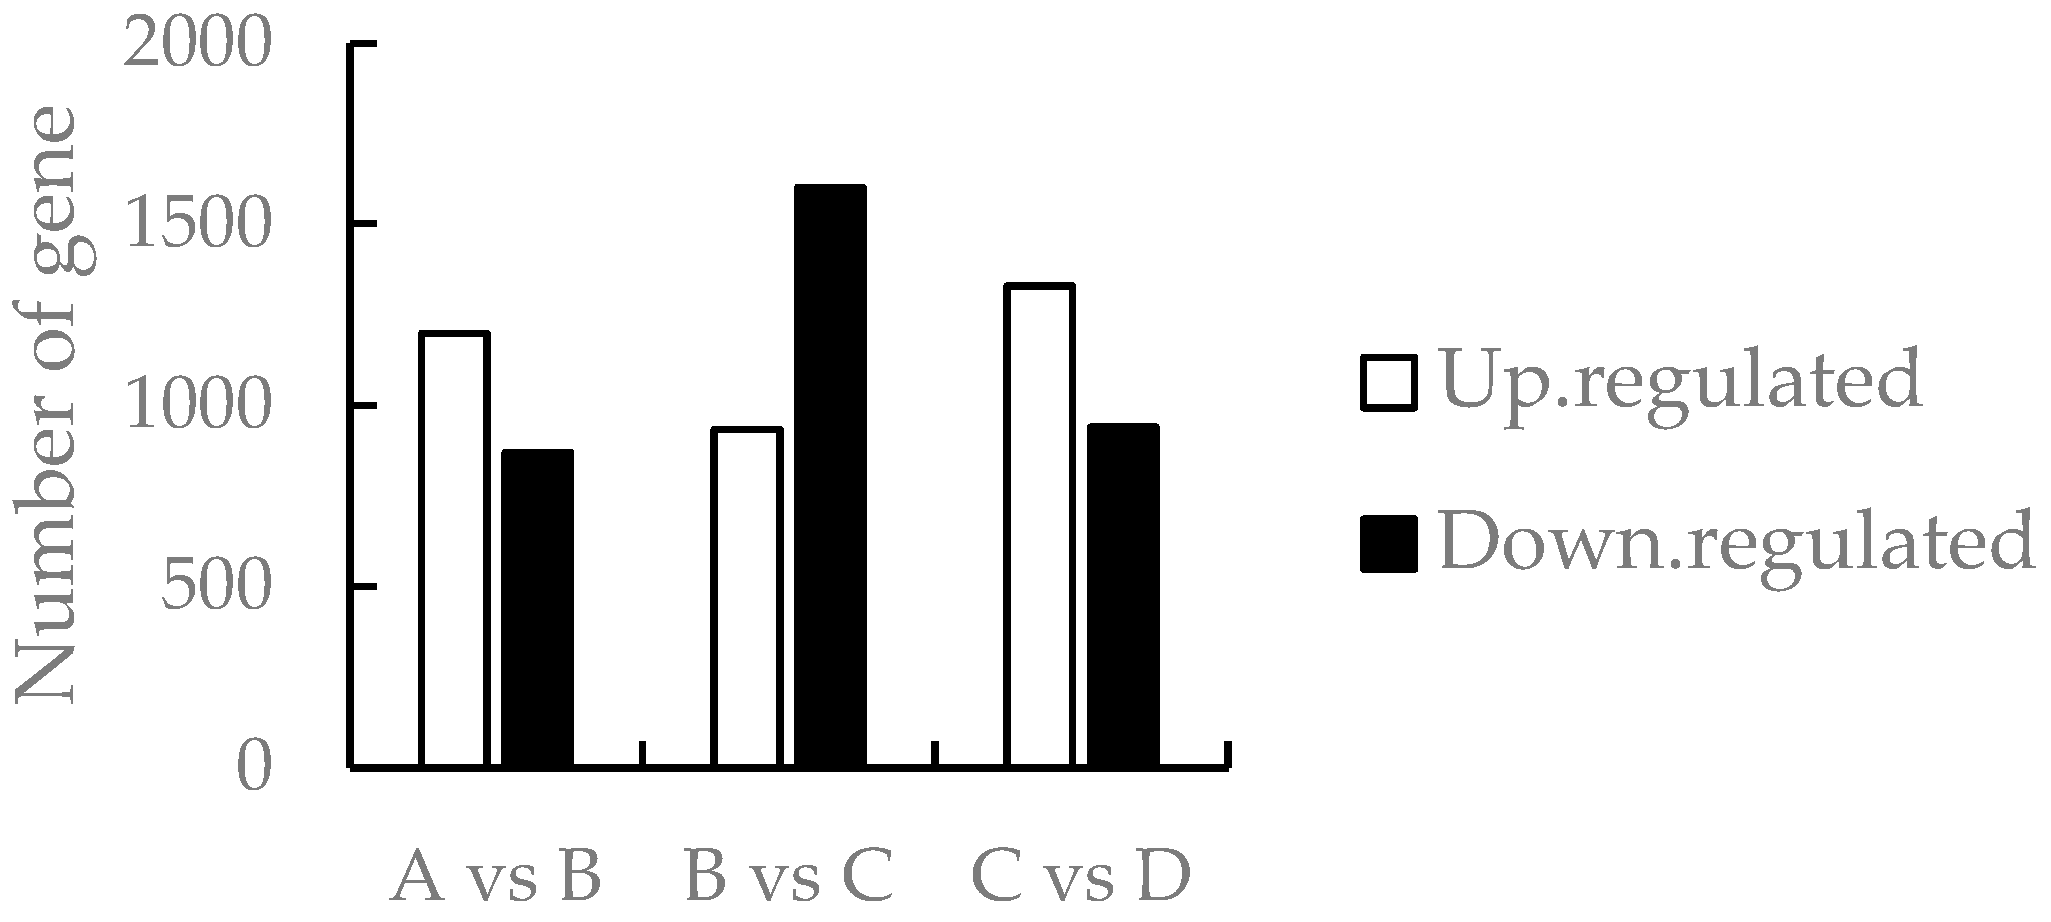
3.3. Comparison of Differentially Expressed Genes

The differentially expressed genes among different developmental stages (A vs. B, B vs. C, and C vs. D) were obtained through screening (Figure 2), showing that 2069 genes were differentially expressed between the meristematic stage and the bud stage, with 1199 and 870 up- and down-regulated genes, respectively; 2536 genes were differentially expressed between the bud stage and the primordial stage, with 934 and 1602 up- and down-regulated genes, respectively; and between the primordial and the full flower stage, the number of differentially expressed genes was 2270, and the number of up- and down-regulated genes was 1330 and 940, respectively. The total number of up-regulated genes was 3463, and the total number of down-regulated genes was 3412.

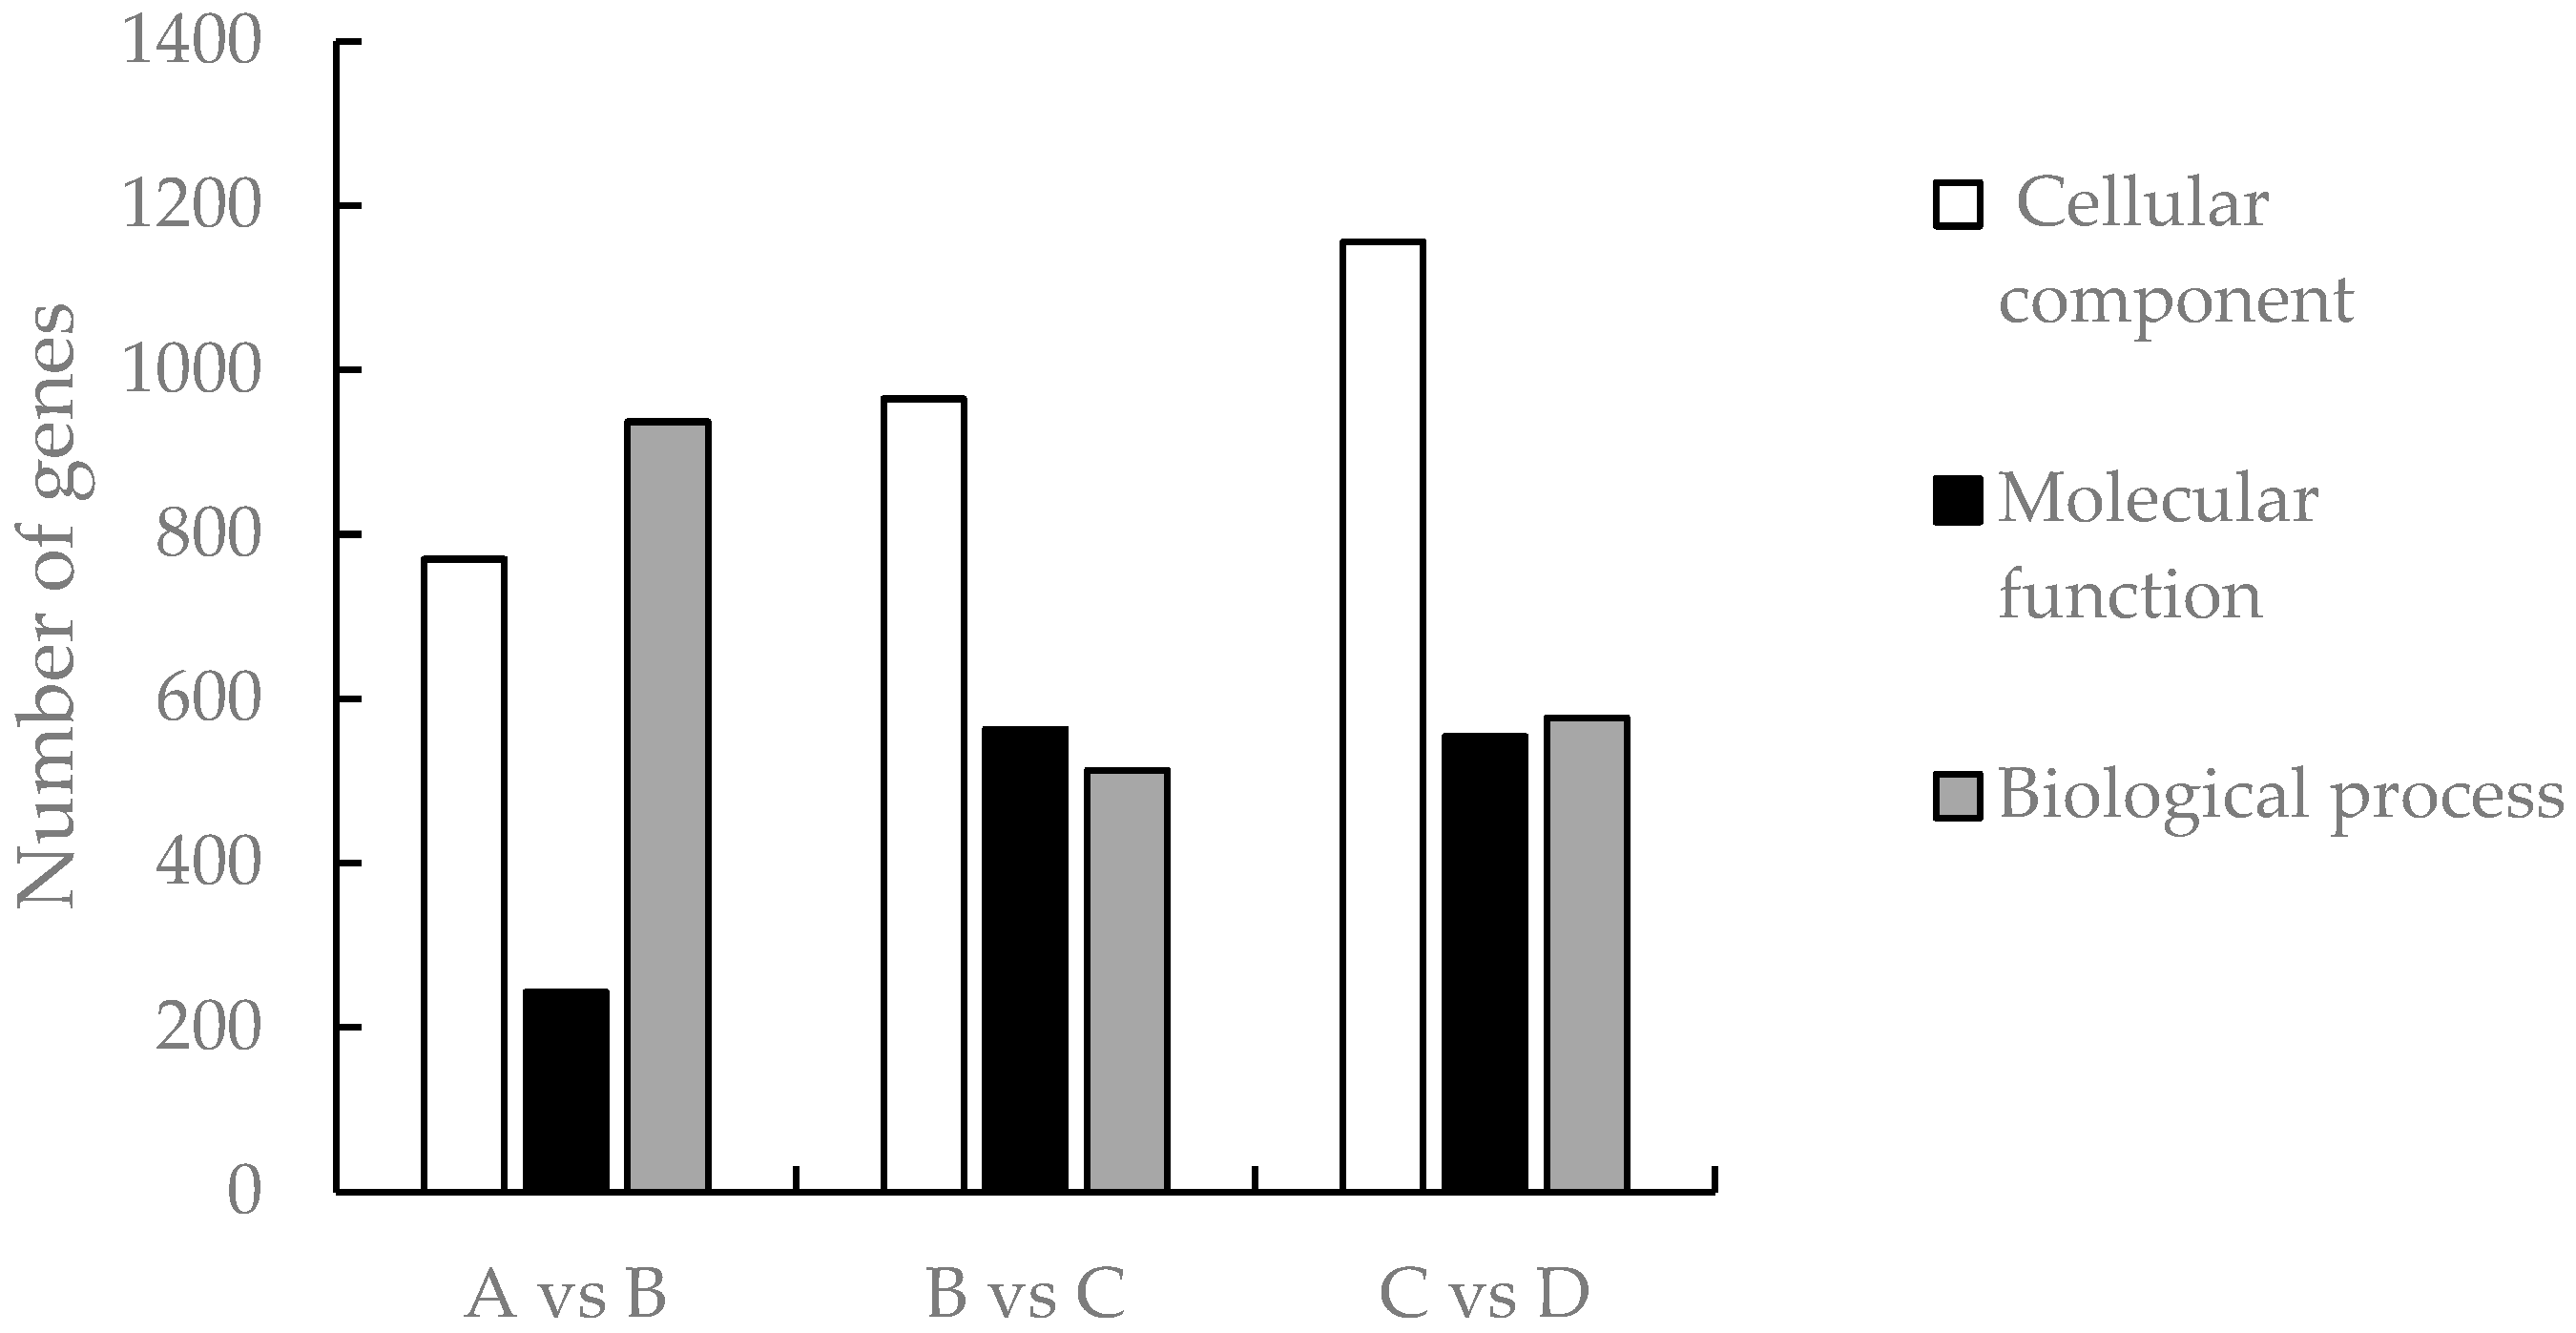
3.4. Analysis of GO Function Enrichment of Differential Genes

Analysis of GO accumulation may reflect the major biological functions of DEGs in Medicago truncatula during different developmental periods. In this study, comparison of data from adjacent developmental periods revealed that the highest number of differential genes in the cellular component was enriched in Medicago truncatula’s leaves (Figure 3). Among them, 1950 DEGs were enriched in 4768 GO pathways when compared between groups A vs. B (Figure 4a); 2041 DEGs were enriched in 5960 GO pathways when compared between groups B vs. C (Figure 4b); and 2287 DEGs were enriched in 5528 GO pathways when compared between groups C vs. D (Figure 4c).

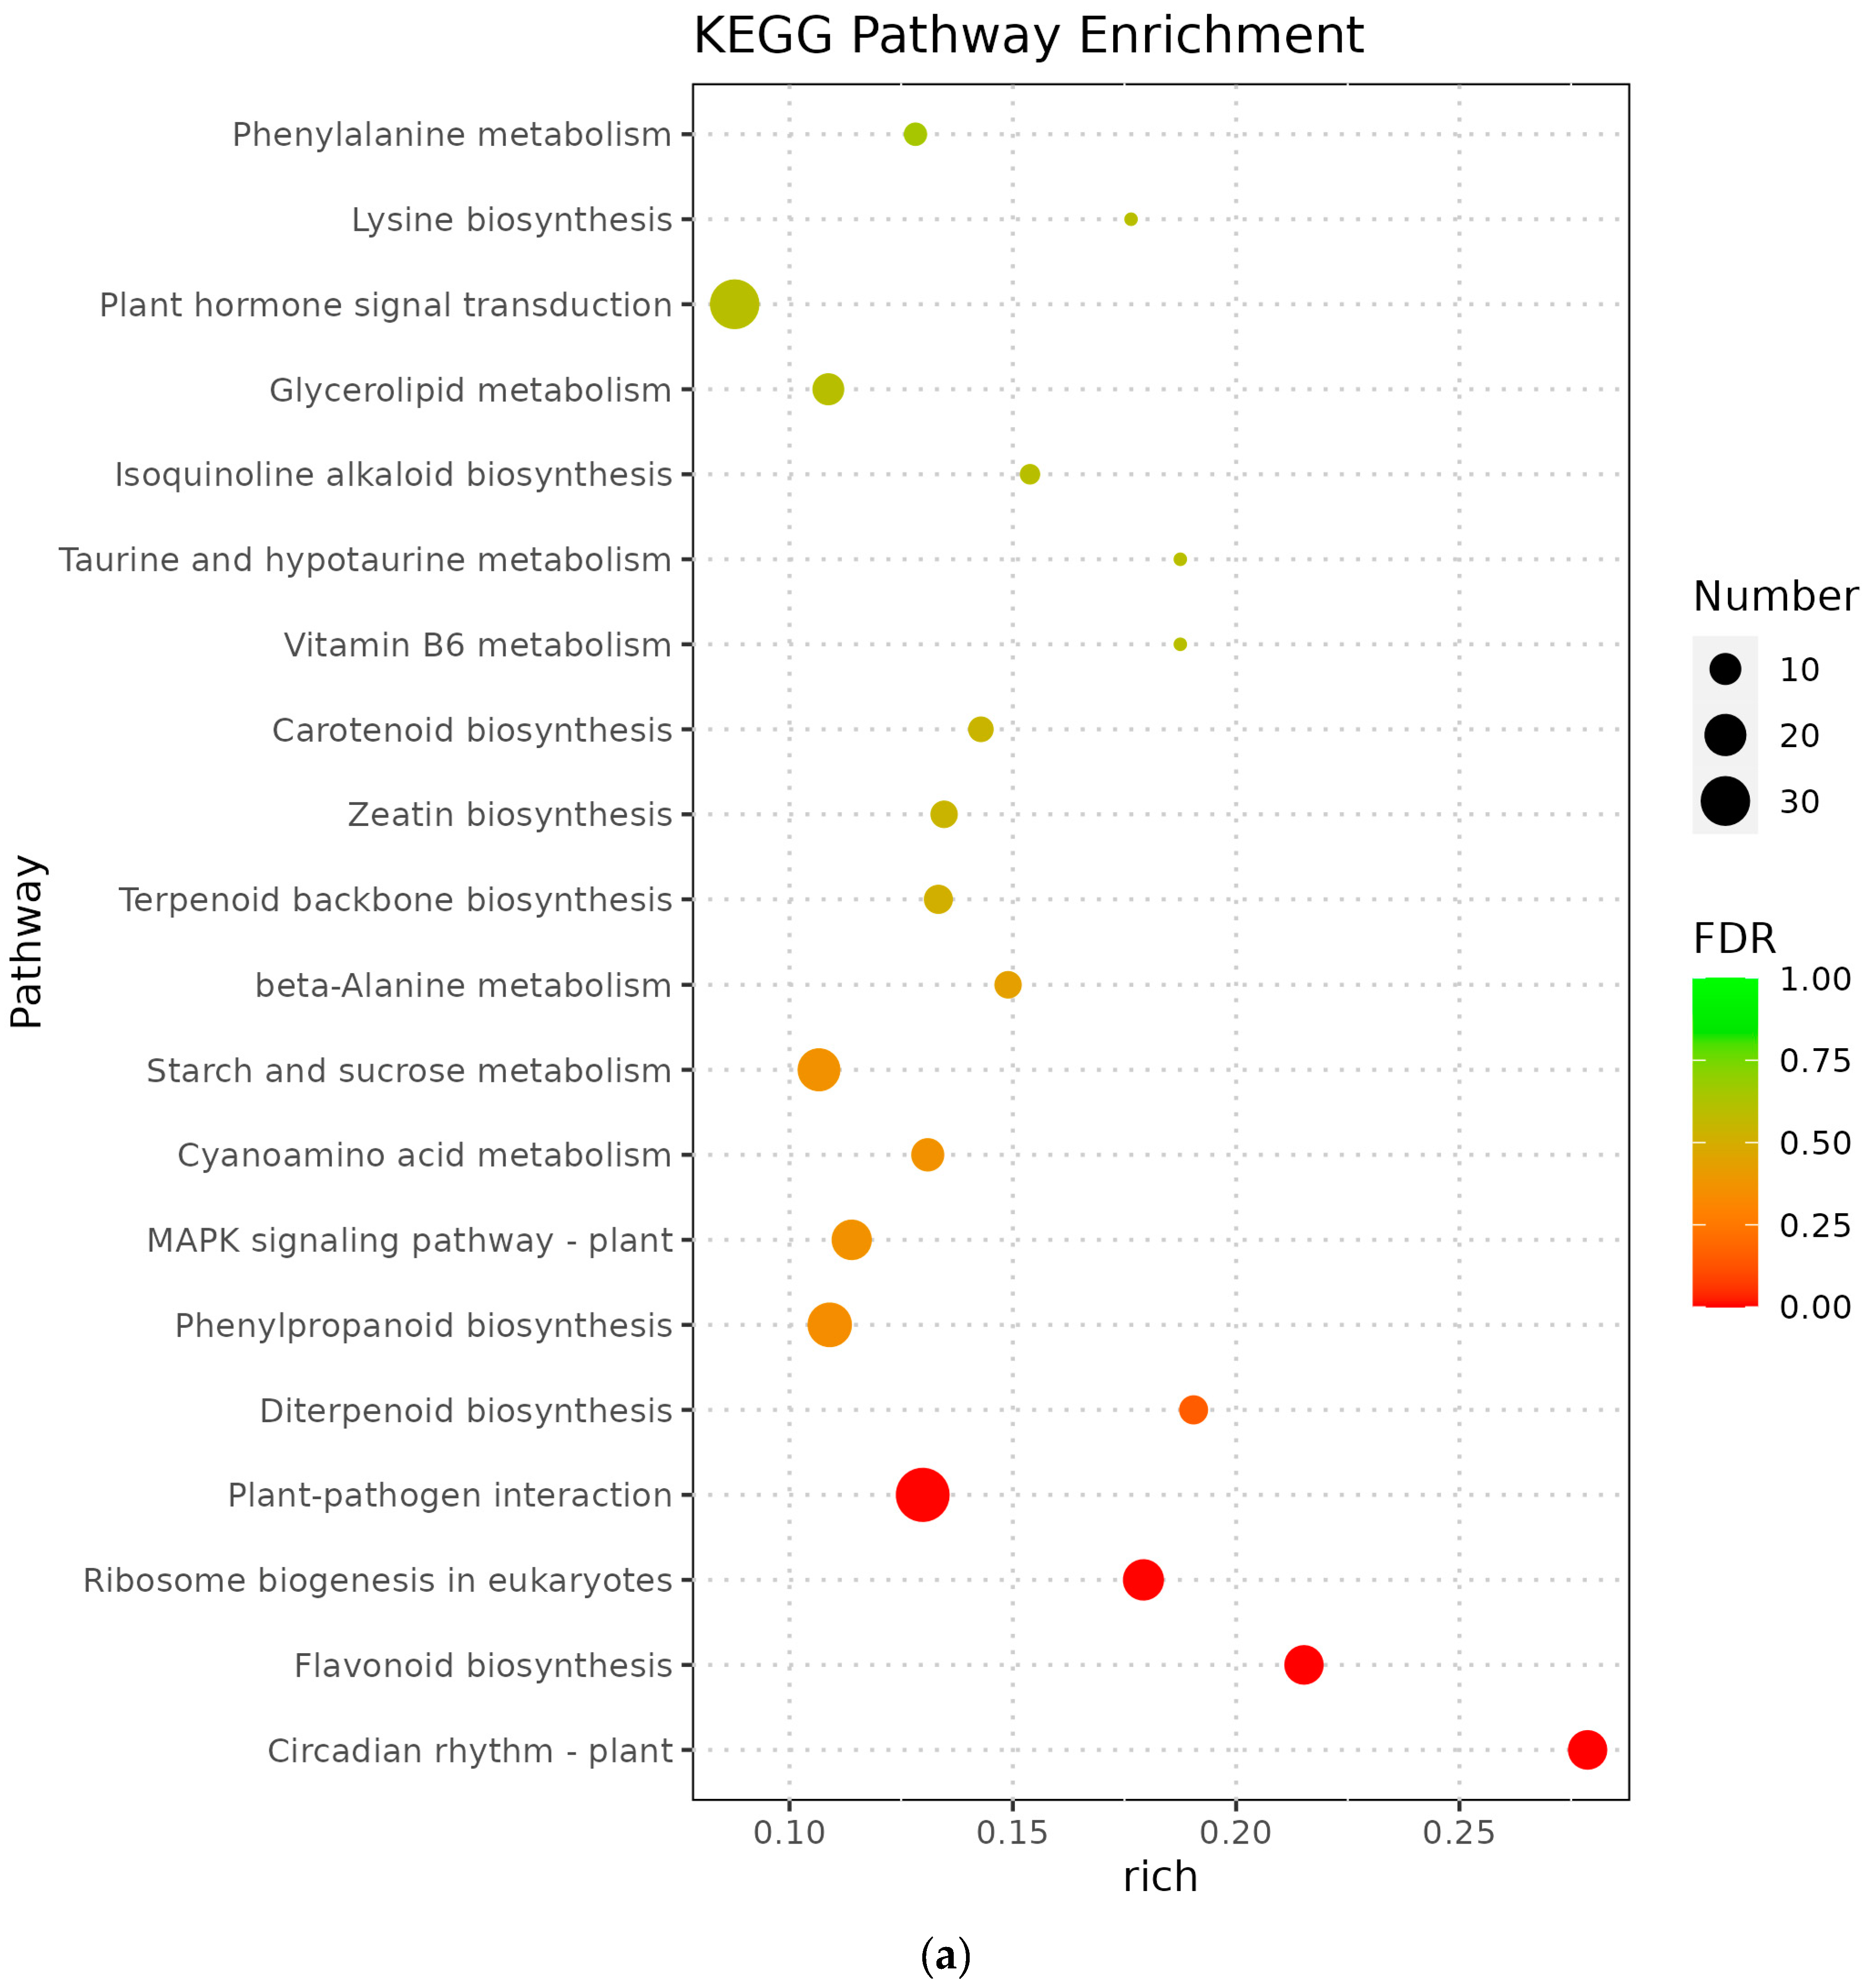
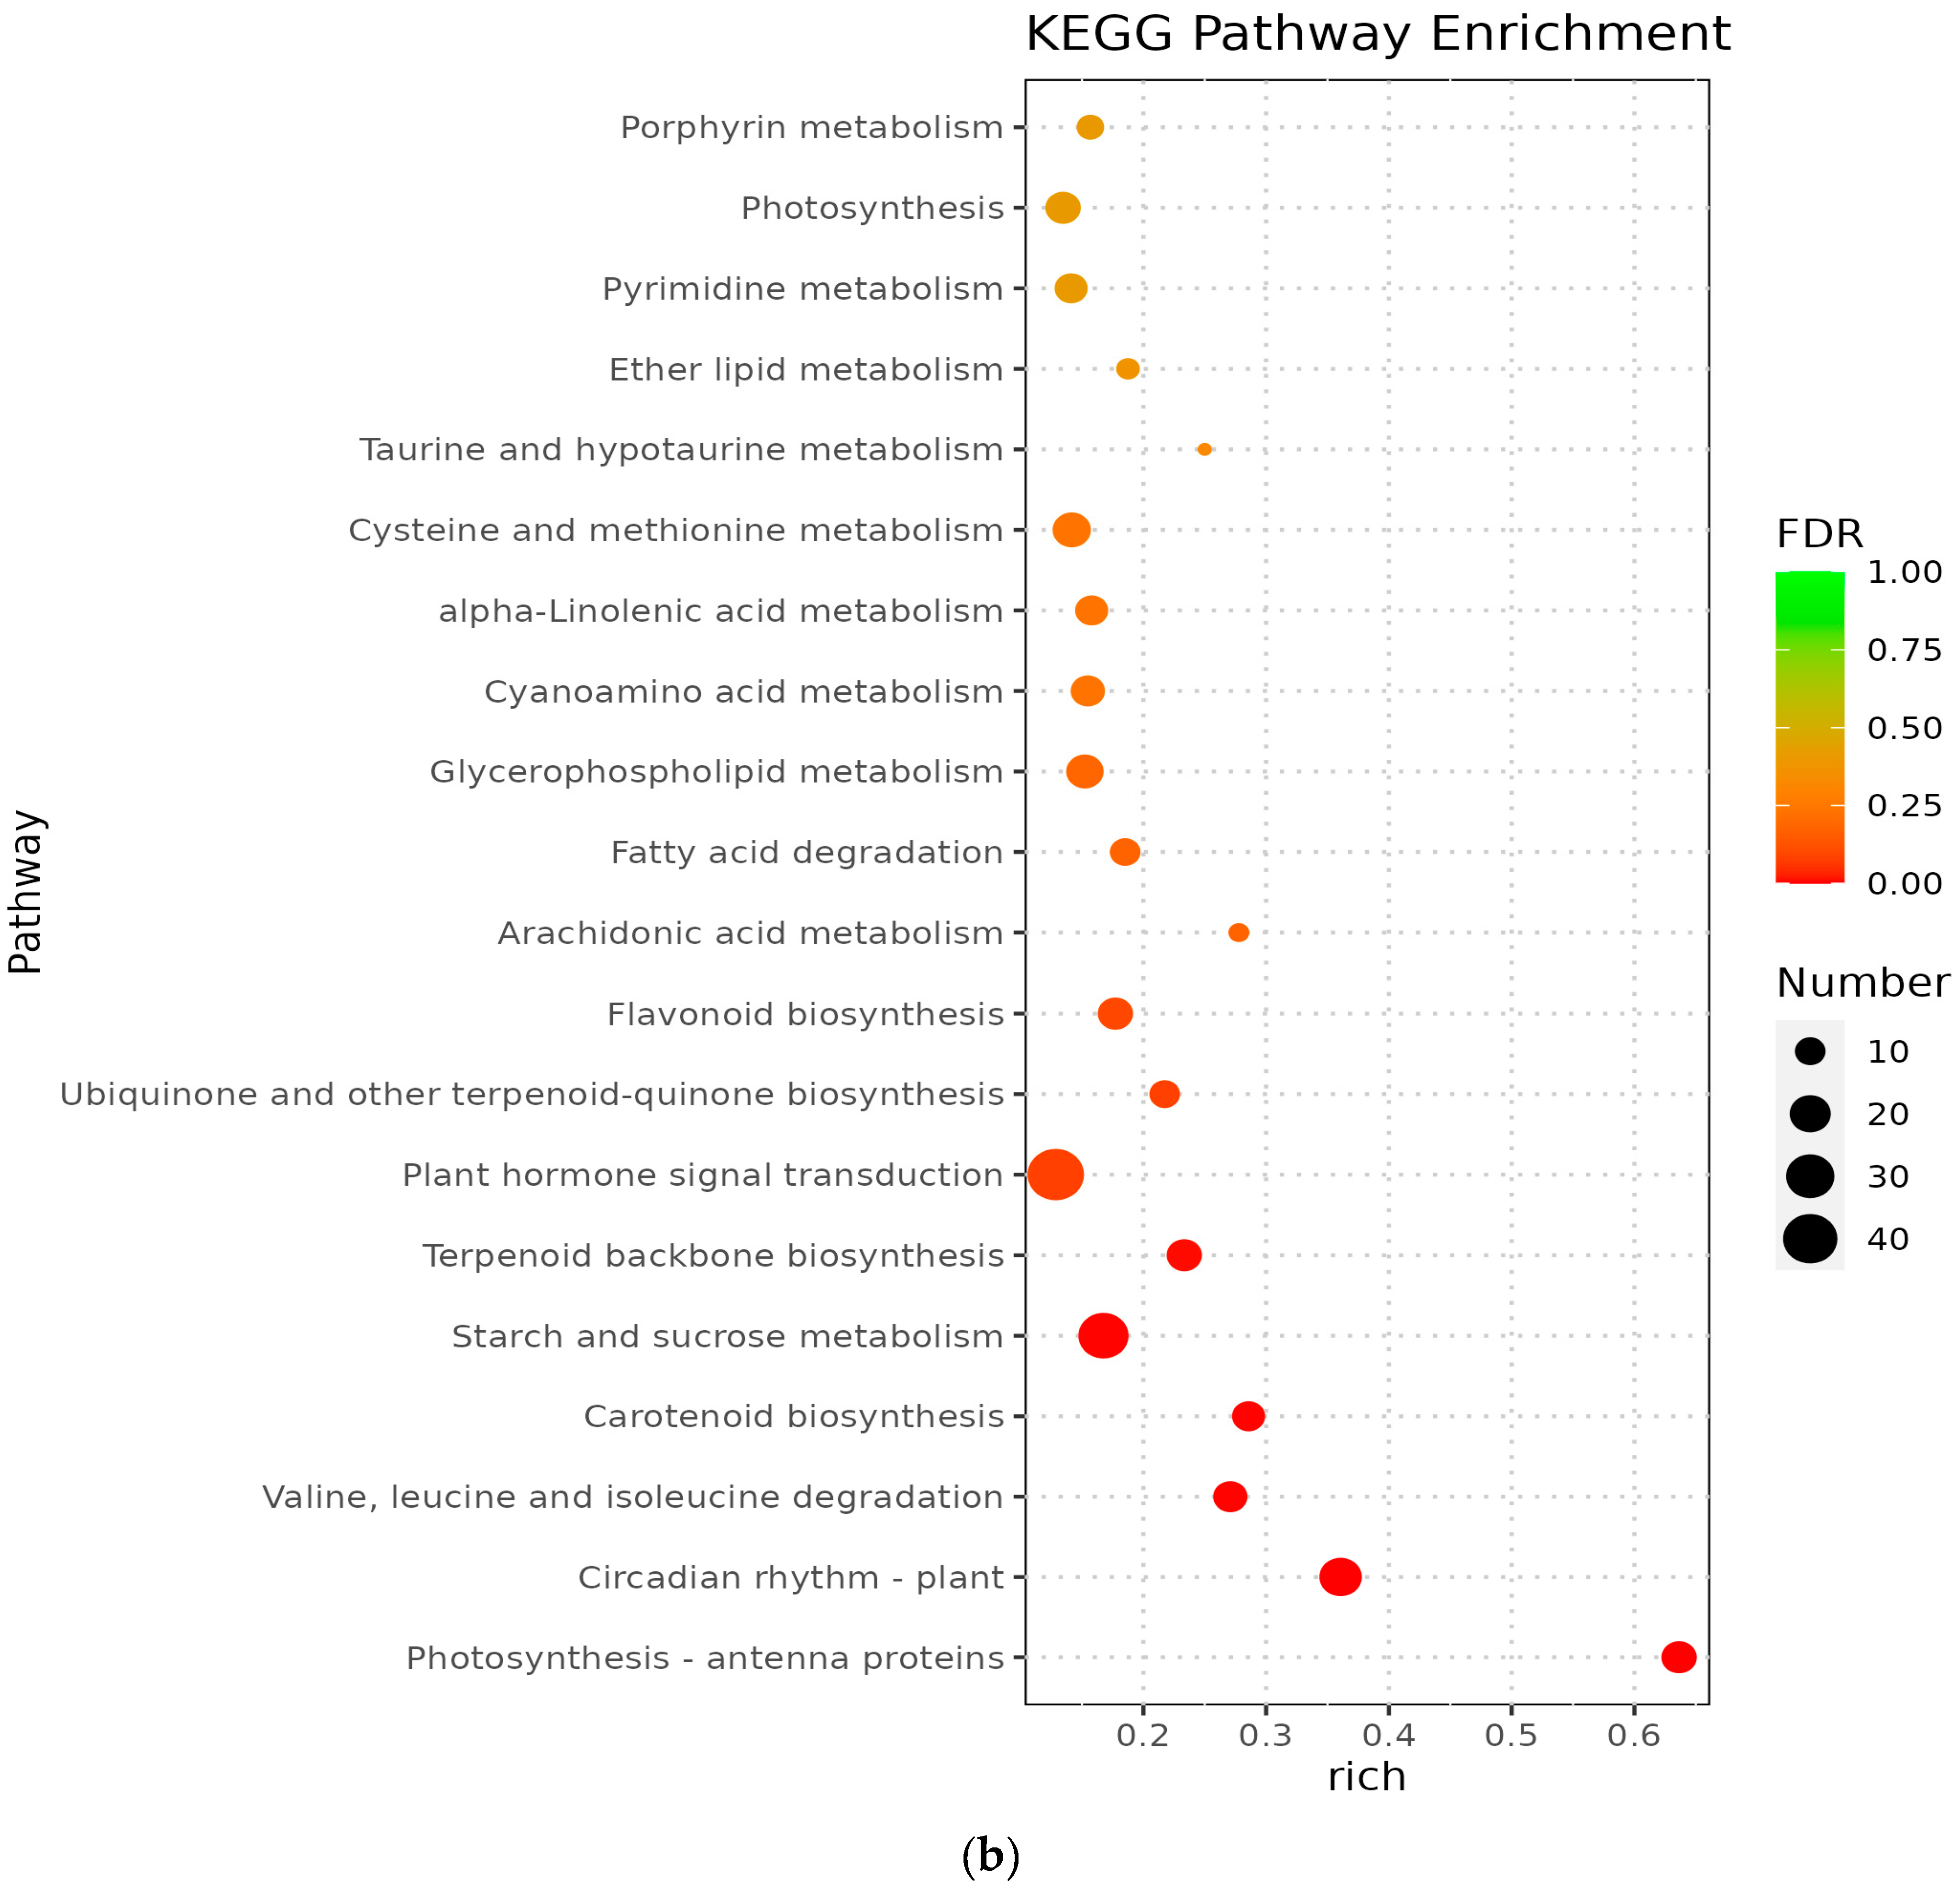
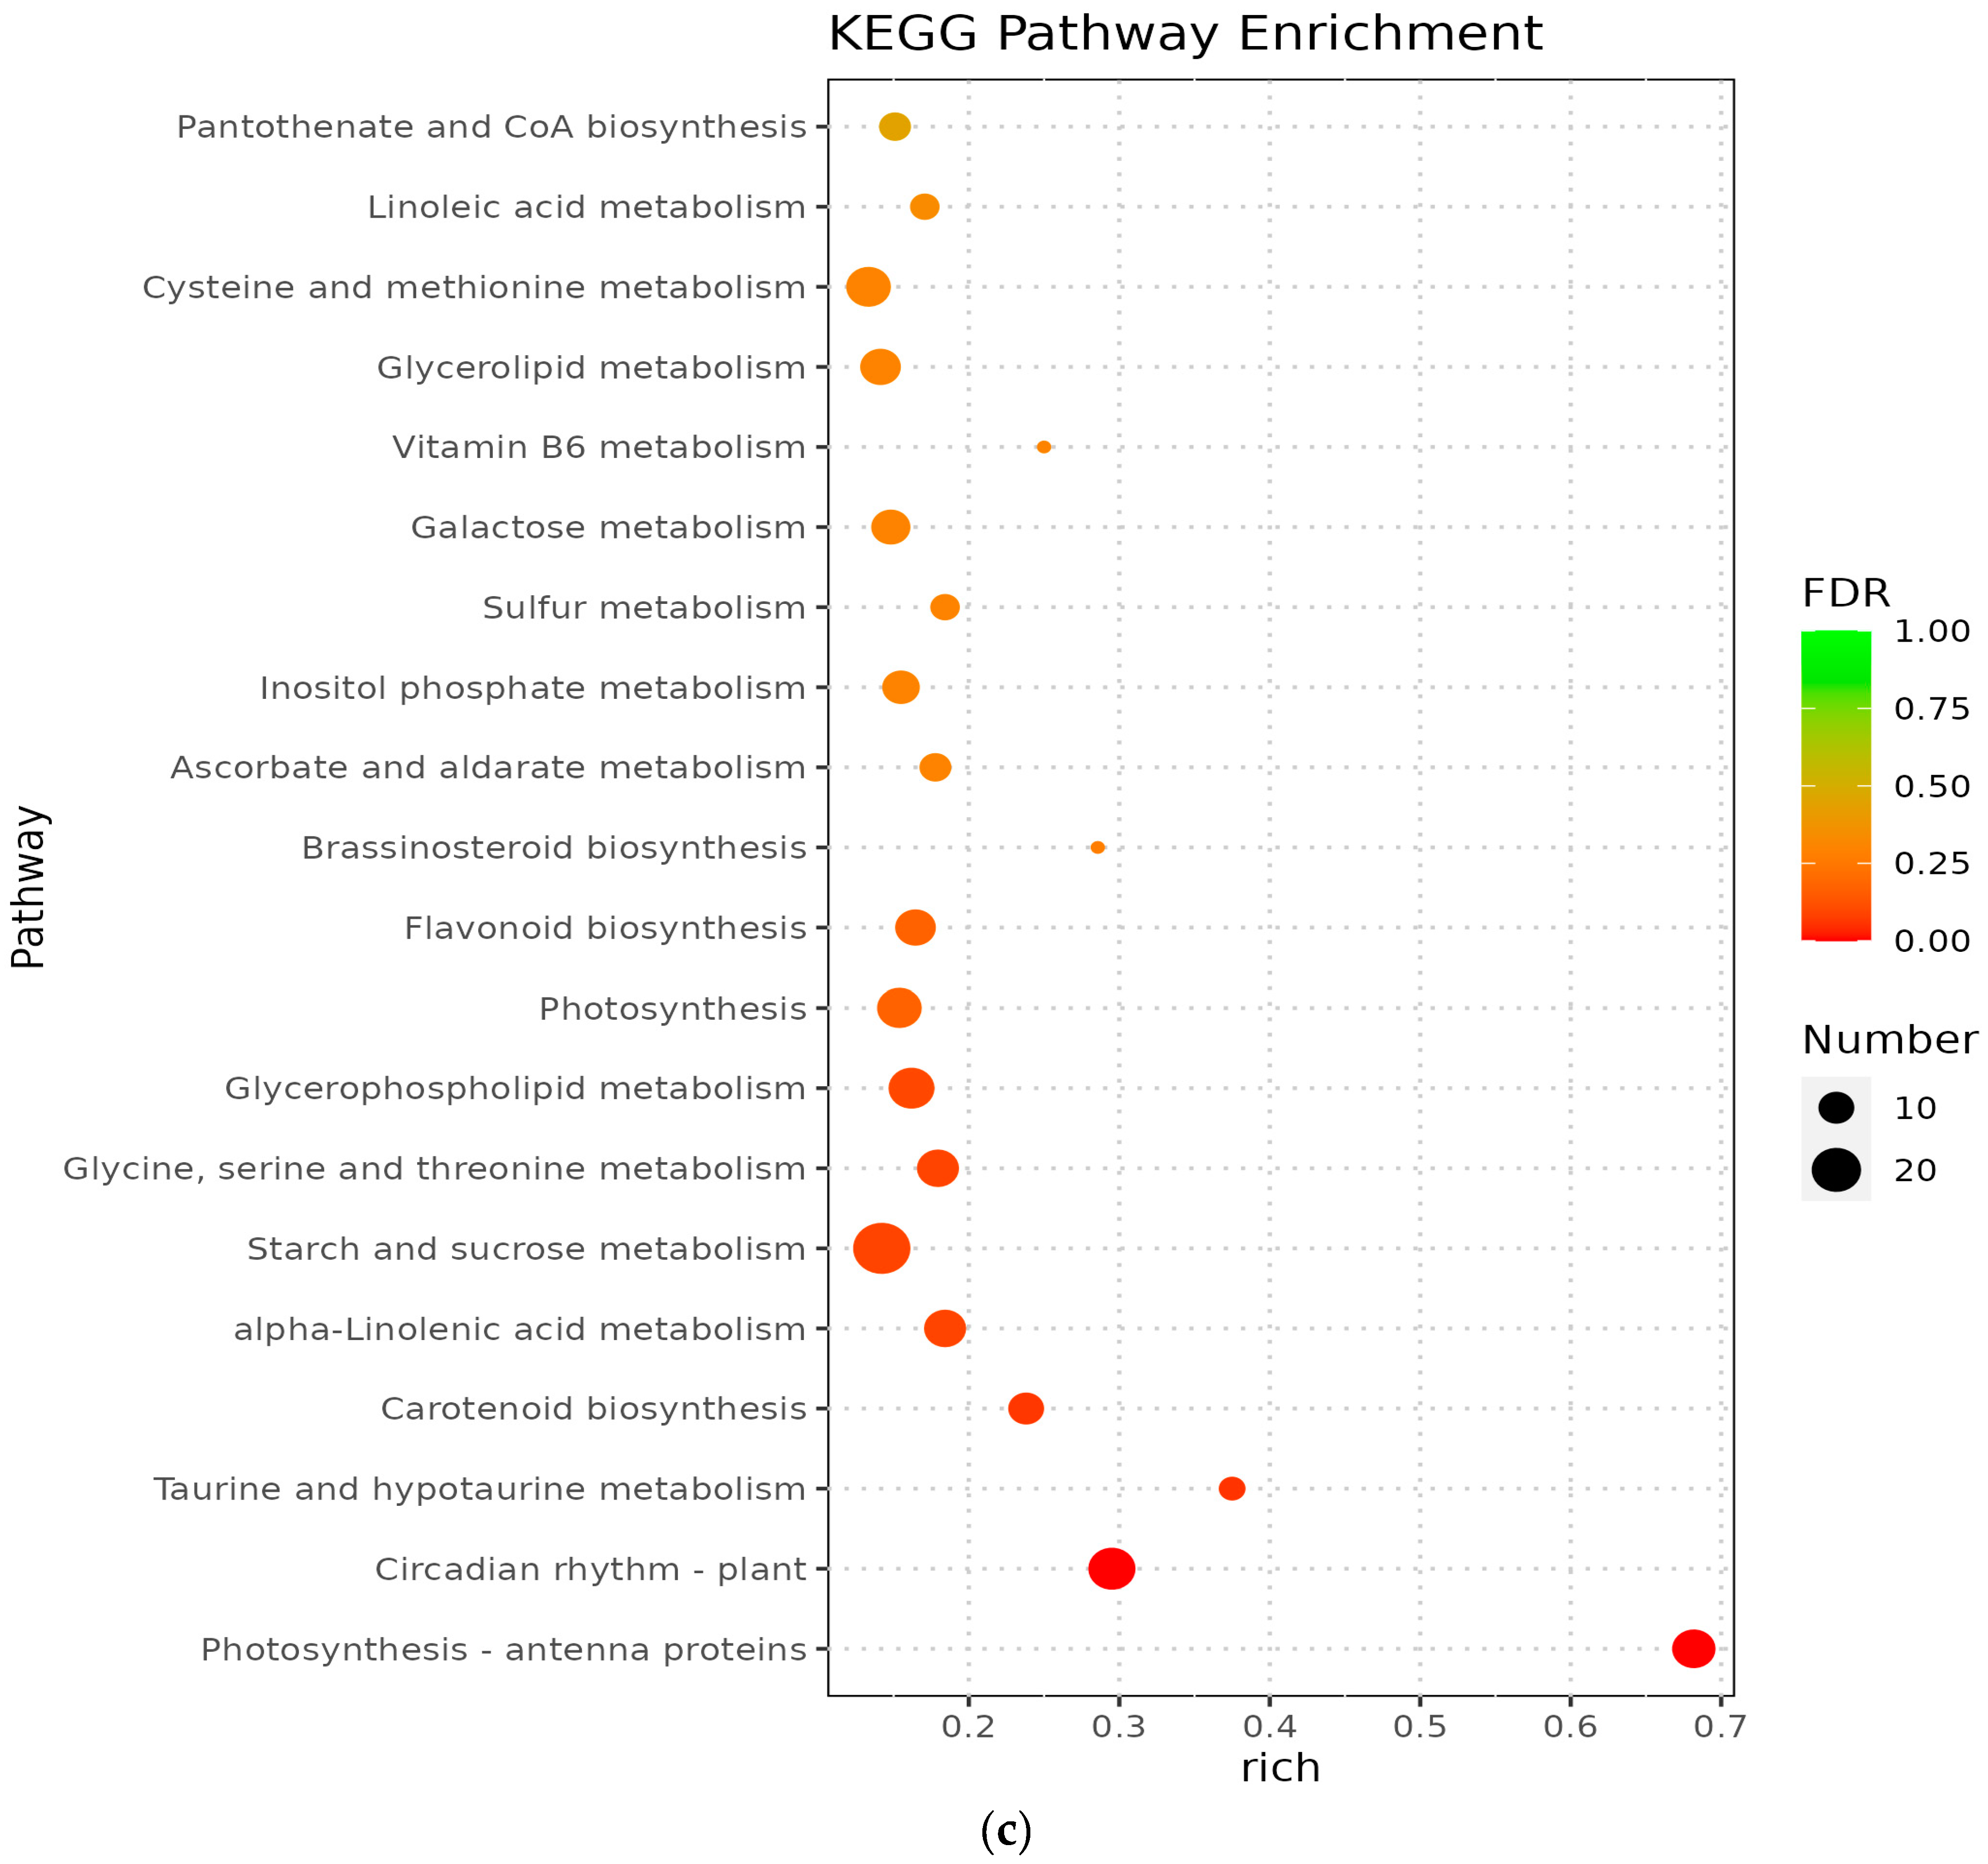
3.5. Analysis of KEGG Pathway of Differential Genes

The metabolic pathways with p-value ≤ 0.05 in the three comparison groups were classified as significantly enriched metabolic pathways, and KEGG analysis showed that 596, 806, and 772 differentiated genes were again annotated in multiple metabolic pathways, 105, 114, and 117 in A vs. B, B vs. C, and C vs. D, respectively. The analyses revealed that circadian rhythms, plant pathogen interactions, flavonoid biosynthesis, ribosome bioreactivity in eukaryotes, and diterpene biosynthetic pathways were particularly enriched between groups A and B (Figure 5a); the photosynthetic antenna protein metabolic pathway was the most enriched in groups B and C, followed by circadian metabolic pathways and the degradation pathways of valine, leucine, and isoleucine (Figure 5b); the major metabolic pathways enriched in groups C and D were the photosynthetic antenna protein metabolic pathway, circadian rhythm, taurine and hypotaurine metabolism, and carotenoid biosynthetic pathway (Figure 5c). However, Medicago truncatula was at different stages of growth and development and was found to contain a higher number of differential genes in the plant circadian pathway in all comparisons of groups A vs. B, B vs. C, and C vs. D, namely 17, 22, and 18 DEGs, respectively.

3.6. Analysis of cSNP

SNPs (single nucleotide polymorphisms) refer to genetic markers formed by single nucleotide variants on the genome. The transformations occurring in SNPs include conversion and subversion, and SNP refers to single nucleotide variants with a frequency of variation greater than 1%. cSNP (coding SNP) denotes the SNP of the protein coding region. The number of cSNP in this study was 312,875, and the highest frequency of A/G and C/T was 31.17% and 30.88%, respectively, while the frequency of the other four single nucleotide variants A/C, A/T, C/G, and G/T were below 15%, 9.55%, 12.05%, 6.8%, and 9.56%, respectively (Figure 6).

3.7. Functional Classification of eggNOG

The gene fragments of the Medicago truncatula transcriptome were compared with the eggNOG database, and a total of 26,745 genes were found to have similarities with the genes in the eggNOG database. The genes in the Medicago truncatula transcriptome were roughly classified into 23 categories based on their functions, and the number of genes in each category was counted. The results showed that the eggNOG functional categories of genes were relatively comprehensive, involving numerous metabolic pathways and life activities, with 9008 genes classified as functionally unknown, followed by signaling mechanisms (2669), transcription (2194), post-translational modifications, protein turnover, chaperones (2123), carbohydrate transport and metabolism (1312), replication, recombination and repair (1236), secondary metabolite biosynthesis, transport and catabolism (1126), translation, ribosome structure and biological reactions (998), and amino acid transport and metabolism (851) (Table 3).

3.8. Photoperiod-Related Differentially Expressed Genes

In this study, we focused on the pathway of photoperiodic-pathway-related differentially expressed genes. A total of 79 flowering genes were identified in the transcriptome data of Medicago truncatula at four different developmental stages, which could be categorized as photoperiodic regulatory pathways, among which there were 51 differentially expressed genes, while 23 differentially expressed genes were up-regulated and 28 differentially expressed genes were down-regulated. Several of the most critical genes of the photoperiod-regulated pathway were identified from the transcriptome, and the expression and gene expression patterns among neighboring (A vs. B, B vs. C, and C vs. D) comparison groups were compared at four different developmental stages (Table 4).
Analysis of the results of the data in Table 4 revealed that in the photoperiodic pathway, the rhythm clock output gene, GI, showed up-regulated expression in both the meristem–bud and emergent-flowering stages, and down-regulated expression in the bud–flowering stage; the biological clock gene, CO, showed up-regulated expression in the meristem–bud stage, non-differential expression in the bud–flowering stage, and down-regulated expression in the emergent-flowering stage; the photosensitive pigmentation gene PHYA was not differentially expressed in the meristem–bud stage, was down-regulated in the emergent-flowering stage, and was down-regulated in the emergent-flowering stage; PHYB and the cryptochromes CRY1 and CRY2 were not differentially expressed in the four developmental stages; the rhythm clock gene TOC1 was up-regulated in the meristem–bud stage, and was not differentially expressed in the emergent-flowering stage, nor in the emergent-flowering stage; and the rhythm clock gene TOC1 was up-regulated in the meristem–bud stage, and was not differentially expressed in the emergent-flowering stage. The rhythm clock gene ELF3 was not differentially expressed in the meristem–bud stage, was up-regulated in the bud–bloom stage, and was down-regulated in the bloom–bloom stage. The rhythm clock gene LHY showed up-regulated expression in the meristematic–bud stage, down-regulated expression in the bud–flowering stage, and no differential expression in the bud–flowering stage. In addition, we analyzed six rhythm clock downstream genes, CO, of which Col2, Col4, and Col5 were not differentially expressed in the four different developmental periods, and Col13 was down-regulated in the blooming stage, but was not differentially expressed in the other two developmental stages. Col6 was not differentially expressed in the meristem–bud stage, and showed opposite expression characteristics in the meristem–flowering stage, with down-regulated expression in the former and up-regulated expression in the latter. Col9 was not differentially expressed in the meristem–bud stage, up-regulated in the meristem–flowering stage, and down-regulated in the full flowering stage.

4. Discussion

The samples subjected to high-throughput sequencing in this study were Medicago truncatula leaves from different developmental stages, all of which were key stages of growth and development of Medicago truncatula. The results of transcriptomics-based analysis showed that a total of 6875 differentially expressed genes were detected from different developmental stages of Medicago truncatula under long-day conditions, which were mainly involved in biological processes, cellular components, and molecular functions, with the most differentially expressed genes being involved in cellular components. The results of KEGG signal pathway enrichment analysis showed that these differentially expressed genes were mainly involved in circadian rhythm, photosynthesis, antenna proteins, flavonoid biosynthesis, and other biological functions. We analyzed antenna proteins, flavonoid biosynthesis, ribosomal reaction, valine metabolism, leucine metabolism, taurine metabolism, and carotenoid biosynthesis, among which the most differentially expressed genes were involved in circadian rhythms. cSNP analysis detected a total of 312,875 single-nucleotide variations, and it was found that the highest frequency of occurrence was in A/G and C/T, with 31.17% and 30.88%, respectively. eggNOG functional classification found a total of 26,745 genes with similarity to genes in the eggNOG database, which were classified into 23 categories, and the analysis found that among the first three pathways, 9008 genes were classified as functionally unknown, followed by 2669 that were classified as signaling mechanisms, and the last 2194 were classified as transcriptional. In different developmental stages of Medicago truncatula, the number of up-regulated differential genes expressed in the three adjacent period comparison combinations (A vs. B, B vs. C, and C vs. D) was 3463, and the number of down-regulated differential genes was 3412, with the number of up-regulated differential genes being slightly larger than the number of down-regulated differential genes. The difference between the number of up-regulated and down-regulated differentially expressed genes was most obvious at the bud stage–primordial flowering stage, with a difference of 668 differentially expressed genes. The above differentially expressed genes are involved in the regulation of the growth and development of Medicago truncatula, which lays the foundation for the in-depth study of the molecular mechanism of Medicago truncatula. The results of this study analyzed the molecular regulation patterns of the Medicago terrestris in different developmental stages to a certain extent, and laid a theoretical foundation for further research on the mechanism of the regulation of the flowering of the Medicago terrestris under the condition of long days, and also provided an important basis for the biotechnological breeding of the Medicago terrestris.
In plants, the photoperiodic pathway mainly signals through GIGANTEA (GI) and CONSTANS (CO) [32]. In this study, the GI expression at different developmental stages of Medicago truncatula varied significantly, and reached the maximum at the bud stage, which is presumed to promote the flowering of Medicago truncatula by increasing the expression of GI; the expression of CO showed an upward trend during the first three stages, and reached the maximum at the emergence stage (27 March), which is presumed to mean that the flowering of Medicago truncatula is related to the expression of CO; however, the specific mechanism of action is still to be researched further. In the photoperiodic pathway, there are two types of photoreceptor genes related to flowering; one is the photosensitive pigments PHYs that absorb red and far-red light [33] and the other is the cryptogamous pigment genes CRY1 and CRY2 that absorb blue and ultraviolet light [34]. PHYA, PHYB, CRY1, and CRY2 were found at different developmental stages of Medicago truncatula, and are all genes promoting flowering in photoperiod; among them, PHYB, CRY1, and CRY2 were not differentially expressed in this study, which might have some effect on flowering, PHYA showed an inflection point in the emergence of flowers, and PHYA was first non-differentially changed and then down-regulated, which might be affected by blue light or red light. The inflection point of ELF3 also occurred at the emergence stage (27 March), and ELF3 was up-regulated after no differential change, and then down-regulated at the bloom stage (17 April). TOC1 was up-regulated at the meristematic stage, and was not differentially expressed in the following three periods, LHY was up-regulated but not differentially expressed at the bud stage, while PHYA was down-regulated at the bud stage. LHY showed an inflection point in the bud stage (28 February), with a down-regulated and then up-regulated expression pattern, followed by no differential expression in the emergence and full bloom stages. Two genes, ELF3 and LHY, were positively regulated at the initiation of flowering in the emergence stage (27 March). The COL gene family belongs to the downstream genes of the biological rhythm clock [35], and in this study, Col2, Col4, and Col5, indicating that they had little effect on the regulation of flowering in Medicago truncatula; Col13 was not differentially expressed during the first three periods and was down-regulated during the bloom period, which can indicate that Col13 has a role in delaying flowering; in addition, its expression decreased sharply, which strengthens its influence on the inhibition of flowering. Col16 and Col19 were not differentially expressed during the branching period, and were expressed in the latter three periods in the opposite way of expression: Col16 showed promotion of flowering at the emergence stage and down-regulated expression and delayed flowering at the full flowering stage, and Col19 was the opposite. From the above patterns of change in the expression of several rhythm clock genes, it can be seen that the photoperiodic regulatory pathway of Medicago truncatula has a significant role in the regulation of flowering during the emergence period and has its own unique mode of regulation. In addition, gene-LOC11410562 (GI), gene-LOC11435974 (CO), gene-LOC11422615 (TOC1), gene-LOC11432385 (LHY) than gene-LOC25500742 (PHYA), gene-LOC11431402 (ELF3), gene-LOC11434778 (Col13), gene-LOC25498015 (Col6), and gene-LOC11415514 (Col9) were expressed in advance, and their specific mechanisms of action remain to be further investigated. Finally, seven flowering genes such as GI, CO, PHYA, and ELF3 were significantly expressed at different developmental stages, which may be involved in the regulation of the flowering synthesis of alfalfa. However, five flowering genes, including PHYB, CRY1, CRY2, and Col2, were not significant in different developmental stages, and the specific regulatory mechanisms have not been cleared, which will be the focus of our next study.

5. Conclusions

Based on RNA-Seq technology, this study revealed the transcriptomic map of different developmental stages of Medicago truncatula under long-day conditions and found that there were significant gene differences in different developmental stages of Medicago truncatula under long-day conditions. In total, 6875 differentially expressed genes, comprising 3463 up-regulated genes and 3412 down-regulated genes, were found by comparing the gene expression of leaves at various developmental stages. Based on functional annotation and enrichment analysis, it was shown that the differentially expressed genes were primarily connected to pathways for ribosome metabolism, photosynthesis-related proteins, and circadian rhythms. The reaction to prolonged long-day conditions was also discovered to be regulated by 51 photoperiod-related differentially expressed genes at various stages of Medicago truncatula development. These results provided a theoretical basis for transcriptomic studies on the leaves of Medicago truncatula at different developmental stages, and provided new insights for plant breeding. Finally, they laid a foundation for the exploration of the function of the differentially expressed genes in the late stage of Medicago truncatula and provided basic sequences for the study of flowering regulation mechanisms and flowering-related genes, which holds high significance for the subsequent study of adaptability breeding of leguminous forage.

Author Contributions

Conceptualization, X.W.; methodology, W.L., Y.L., P.M. and L.Y.; resources, Y.L., P.M. and D.H.; writing—original draft preparation, X.W. and W.L.; writing—review and editing, W.L. and X.W.; validation, X.W. and C.C.; project administration, X.W.; funding acquisition, X.W. All authors have read and agreed to the published version of the manuscript.

Funding

Funder: Xiaoli Wang. This research was supported by the National Natural Science Foundation of China (32060394); Funder: Peijie Ma. Fund Project of Guizhou Province, China. (Qiankeheji-ZK [2023]. General 164); Funder: Xiaoli Wang. Guizhou Academy of Agricultural Sciences National Foundation Subsidy Project (Guizhou Academy of Agricultural Sciences National Foundation Subsidy (2021) No. 54); Funder: Peijie Ma. Guizhou Academy of Agricultural Sciences (2021). National Base Subsidy/Guizhou Academy of Agricultural Sciences National Base Subsidy (2021) No. 33; Funder: Caijun Chen. Research Institution Innovation Capacity Building Special (Guizhou Science Joint Service Enterprise [2022]004).

Institutional Review Board Statement

Not applicable.

Data Availability Statement

All data are presented in the manuscript.

Conflicts of Interest

The authors declare no conflict of interest.

References

  1. Xiao, H.S.; Lei, T.; Shun, X.W.; Zhou, J.L.; Zhang, J.; Chen, Z.; Wu, L.J.; Ku, L.X.; Chen, Y.H. Integrating transcriptomic and proteomic analyses of photoperiod-sensitive in near isogenic maize line under long-day conditions. J. Integr. Agric. 2019, 18, 1211–1221. [Google Scholar] [CrossRef]
  2. Kathleen, G.; Robertson, C.M. Integrating circadian dynamics with physiological processes in plants. Nat. Rev. Genet. 2015, 16, 598–610. [Google Scholar] [CrossRef]
  3. Fernando, A.; George, C. The genetic basis of flowering responses to seasonal cues. Nat. Rev. Genet. 2012, 13, 627–639. [Google Scholar] [CrossRef]
  4. Sung, J.S.; Akane, K.; Takato, I. Circadian Clock and Photoperio5-15dic Flowering in Arabidopsis: CONSTANS Is a Hub for Signal Integration. Plant Physiol. 2017, 173, 5–15. [Google Scholar] [CrossRef]
  5. Soledad, P.; Nathanael, N.; Fran, R.; Weller, J.L.; Bond, D.M.; Macknight, R.C. A Point Mutation in Phytochromobilin synthase Alters the Circadian Clock and Photoperiodic Flowering of Medicago truncatula. Plants 2022, 11, 239. [Google Scholar] [CrossRef]
  6. Sanchez, E.S.; Rugnone, L.M.; Kay, A.S. Light Perception: A Matter of Time. Mol. Plant 2020, 13, 363–385. [Google Scholar] [CrossRef] [PubMed]
  7. Viker, K.B.; Steele, M.B.; Iankov, I.D.; Concilio, S.C.; Ammayappan, A.; Bolon, B.; Jenks, N.J.; Goetz, M.P.; Panagioti, E.; Federspiel, M.J.; et al. Preclinical safety assessment of MV-s-NAP, a novel oncolytic measles virus strain armed with an H. pylori immunostimulatory bacterial transgene. Mol. Ther.-Meth. D 2022, 26, 532–546. [Google Scholar] [CrossRef] [PubMed]
  8. Tao, Y.; Zheng, J.; Xu, Z.; Zhang, X.H.; Zhang, K.; Wang, G.Y. Functional analysis of ZmDWF1, a maize homolog of the Arabidopsis brassinosteroids biosynthetic DWF1/DIM gene. Plant Sci. 2004, 167, 743–751. [Google Scholar] [CrossRef]
  9. Laurie, R.E.; Diwadkar, P.; Jaudal, M.; Zhang, L.L.; Hecht, V.; Wen, J.Q.; Tadege, M.; Mysore, K.S.; Putterill, J.; Weller, J.L.; et al. The Medicago FLOWERING LOCUS T homolog, MtFTa1, is a key regulator of flowering time. Plant Physiol. 2011, 156, 2207–2224. [Google Scholar] [CrossRef]
  10. Putterill, J.; Varkonyi-Gasic, E. FT and florigen long-distance flowering control in plants. Curr. Opin. Plant Biol. 2016, 33, 77–82. [Google Scholar] [CrossRef]
  11. Zhang, L.L.; Jiang, A.; Thomson, G.; Kerr-Phillips, M.; Phan, C.; Krueger, T.; Jaudal, M.; Wen, J.Q.; Mysore, K.S.; Putterill, J. Overexpression of Medicago MtCDFd1_1 Causes Delayed Flowering in Medicago via Repression of MtFTa1 but Not MtCO-Like Genes. Front. Plant Sci. 2019, 10, 1148. [Google Scholar] [CrossRef] [PubMed]
  12. Jaudal, M.; Wen, J.Q.; Mysore, K.S.; Putterill, J. Medicago PHYA promotes flowering, primary stem elongation and expression of flowering time genes in long days. BMC Plant Biol. 2020, 20, 329. [Google Scholar] [CrossRef] [PubMed]
  13. Thomson, G.; Zhang, L.L.; Wen, J.Q.; Mysore, K.S.; Putterill, J. The Candidate Photoperiod Gene MtFE Promotes Growth and Flowering in Medicago truncatula. Front. Plant Sci. 2021, 12, 634091. [Google Scholar] [CrossRef] [PubMed]
  14. Liew, L.C.; Hecht, V.; Sussmilch, F.C.; Weller, J.L. The Pea Photoperiod Response Gene STERILE NODES Is an Ortholog of LUX ARRHYTHMO. Plant Physiol. 2014, 165, 648–657. [Google Scholar] [CrossRef]
  15. Rubenach, A.J.S.; Hecht, V.; Vander, S.J.K.; Liew, L.C.; Aubert, G.; Burstin, J.; Weller, J.L. EARLY FLOWERING3 Redundancy Fine-Tunes Photoperiod Sensitivity. Plant Physiol. 2017, 173, 2253–2264. [Google Scholar] [CrossRef]
  16. Wong, A.; Hecht, V.F.; Picard, K. Isolation and functional analysis of CONSTANS-LIKE genes suggests that a central role for CONSTANS in flowering time control is not evolutionarily conserved in Medicago truncatula. Front. Plant Sci. 2014, 5, 486. [Google Scholar] [CrossRef] [PubMed]
  17. Xia, Z.J.; Watanabe, S.; Yamada, T.; Tsubokura, Y.; Nakashima, H.; Zhai, H.; Anai, T.; Sato, S.; Yamazaki, T.; Lv, S.X. Positional cloning and characterization reveal the molecular basis for soybean maturity locus E1 that regulates photoperiodic flowering. Proc. Natl. Acad. Sci. USA 2012, 109, E2155–E2164. [Google Scholar] [CrossRef]
  18. Liu, W.; Jiang, B.J.; Ma, L.M.; Zhang, S.W.; Zhai, H.; Xu, X.; Hou, W.S.; Xia, Z.J.; Wu, C.X.; Sun, S.; et al. Functional diversification of Flowering Locus T homologs in soybean: GmFT1a and GmFT2a/5a have opposite roles in controlling flowering and maturation. New Phytol. 2018, 217, 1335–1345. [Google Scholar] [CrossRef]
  19. Xu, M.L.; Yamagishi, N.; Zhao, C.; Takeshima, R.; Kasai, M.; Watanabe, S.; Kanazawa, A.; Yoshikawa, N.; Liu, B.H.; Yamada, T.; et al. The Soybean-Specific Maturity Gene E1 Family of Floral Repressors Controls Night-Break Responses through Down-Regulation of FLOWERING LOCUS T Orthologs. Plant Physiol. 2015, 168, 1735–1746. [Google Scholar] [CrossRef]
  20. Zhang, X.Z.; Zhai, H.; Wang, Y.Y.; Tian, X.J.; Zhang, Y.P.; Wu, H.Y.; Lv, S.X.; Yang, G.; Li, Y.Q.; Wang, L.; et al. Functional conservation and diversification of the soybean maturity gene E1 and its homologs in legumes. Sci. Rep. 2016, 6, 29548. [Google Scholar] [CrossRef]
  21. Jin, M.L.; Liu, X.G.; Jia, W.; Liu, H.J.; Li, W.Q.; Peng, Y.; Du, Y.F.; Wang, Y.B.; Yin, Y.J.; Zhang, X.H.; et al. ZmCOL3 a CCT gene represses flowering in maize by interfering with the circadian clock and activating expression of ZmCCT. J. Integr. Plant Biol. 2018, 60, 465–480. [Google Scholar] [CrossRef]
  22. Meng, X.; Muszynski, M.G.; Danilevskaya, O.N. The FT-like ZCN8 Gene Functions as a Floral Activator and Is Involved in Photoperiod Sensitivity in Maize. Plant Cell 2011, 23, 942–960. [Google Scholar] [CrossRef] [PubMed]
  23. Chen, A.; Li, C.X.; Hu, W.; Lau, M.Y.; Lin, H.Q.; Rockwell, N.C.; Martin, S.S.; Jernstedt, J.A.; Lagarias, J.C.; Dubcovsky, J. Phytochrome C plays a major role in the acceleration of wheat flowering under long-day photoperiod. Proc. Natl. Acad. Sci. USA 2014, 111, 10037–10044. [Google Scholar] [CrossRef] [PubMed]
  24. Chen, S.F.; Zhou, Y.Q.; Chen, Y.R.; Gu, J. fastp: An ultra-fast all-in-one FASTQ preprocessor. Bioinformatics 2018, 34, i884–i890. [Google Scholar] [CrossRef] [PubMed]
  25. Mortazavi, A.; Williams, B.A.; McCue, K.; Schaeffer, L.; Wold, B. Mapping and quantifying mammalian transcriptomes by RNA-Seq. Nat. Methods 2008, 5, 621–628. [Google Scholar] [CrossRef] [PubMed]
  26. Michael, A.; Catherine, A.B.; Judith, A.B.; David, B.; Heather, B.; Cherry, J.M.; Allan, P.D.; Kara, D.; Selina, S.D.; Janan, T.E.; et al. Gene Ontology: Tool for the unification of biology. Nat. Genet. 2000, 25, 25–29. [Google Scholar] [CrossRef]
  27. Minoru, K.; Susumu, G.; Shuichi, K.; Yasushi, O.; Masahiro, H. The KEGG resource for deciphering the genome. Nucleic Acids Res. 2004, 32, D277–D280. [Google Scholar]
  28. Yu, H.H.; Xie, W.B.; Li, J.; Zhou, F.S.; Zhang, Q.F. A whole-genome SNP array (RICE6K) for genomic breeding in rice. Plant Biotechnol. J. 2014, 12, 28–37. [Google Scholar] [CrossRef]
  29. Grabherr, M.G.; Haas, B.J.; Yassour, M.; Levin, J.Z.; Thompson, D.A.; Amit, I.; Adiconis, X.; Fan, L.; Raychowdhury, R.; Zeng, Q.D.; et al. Full-length transcriptome assembly from RNA-Seq data without a reference genome. Nat. Biotechnol. 2011, 29, 644–652. [Google Scholar] [CrossRef]
  30. Panigrahi, S.C.K.; EMishra, P. GIGANTEA—An Emerging Story. Front. Plant Sci. 2015, 6, 8. [Google Scholar] [CrossRef]
  31. Simpson, G.G.; Dean, C. Arabidopsis, the Rosetta Stone of Flowering Time? Science 2002, 296, 285–289. [Google Scholar] [CrossRef] [PubMed]
  32. Chentao, L. Blue light receptors and signal transduction. Plant Cell 2002, 14, S207–S225. [Google Scholar]
  33. Li, R.N.; Li, T.; Wu, X.; Yao, X.Y.; Ai, H.; Zhang, Y.J.; Gan, Z.C.; Huang, X.Z. Genome-Wide Identification, Characterization and Expression Profiling of the CONSTANS-like Genes in Potato (Solanum tuberosum L.). Genes 2023, 14, 1174. [Google Scholar] [CrossRef]
  34. Endre, G.; Kereszt, A.; Kevei, Z.; Mihacea, S.; Kaló, P.; Kiss, G.B. A receptor kinase gene regulating symbiotic nodule development. Nature 2002, 417, 962–966. [Google Scholar] [CrossRef] [PubMed]
  35. Stacey, G.; Libault, M.; Brechenmacher, L.; Wan, J.; May, G.D. Genetics and functional genomics of legume nodulation. Curr. Opin. Plant Biol. 2006, 9, 110–121. [Google Scholar] [CrossRef] [PubMed]
Figure 1. Results of agarose gel electrophoresis.
Diversity 15 01020 g001
Figure 2. Comparison of the number of differentially expressed genes in A vs. B, B vs. C, and C vs. D groups. Note: A stands for meristematic stage; B stands for bud stage; C stands for first flowering stage; and D is for full flowering stage. A vs. B stands for the meristematic stage compared with the bud stage; B vs. C stands for bud stage compared with first flowering stage; and C vs. D stands for flowering and full flowering stage compared. The same below.
Diversity 15 01020 g002
Figure 3. Number of GO-enriched differential genes at different developmental stages of Medicago truncatula.
Diversity 15 01020 g003
Figure 4. GO functional categories of differentially expressed genes at different developmental stages of Medicago truncatula (showing the first 10). Note: GO stands for Gene Ontology; (a) stands for A vs. B; (b) stands for B vs. C; (c) stands for C vs. D; A stands for meristematic stage; B stands for bud stage; C stands for first flowering stage; and D is for full flowering stage. A vs. B stands for the meristematic stage compared with the bud stage; B vs. C stands for bud stage compared with first flowering stage; and C vs. D stands for flowering and full flowering stage compared.
Diversity 15 01020 g004aDiversity 15 01020 g004bDiversity 15 01020 g004c
Figure 5. KEGG enrichment of differentially expressed genes in Medicago truncatula at different developmental stages (showing the first 10). Note: KEGG stands for Kyoto Encyclopedia of Genes and Genomes; (a) stands for A vs. B; (b) stands for B vs. C; (c) stands for C vs. D; A stands for meristematic stage; B stands for bud stage; C stands for first flowering stage; and D is for full flowering stage. A vs. B stands for the meristematic stage compared with the bud stage; B vs. C stands for bud stage compared with first flowering stage; and C vs. D stands for flowering and full flowering stage compared.
Diversity 15 01020 g005aDiversity 15 01020 g005bDiversity 15 01020 g005c
Figure 6. cSNP statistics in transcriptome sequences of Medicago truncatula.
Diversity 15 01020 g006
Table 1. Throughput and quality detection of RNA-seq.
SampleReads No.Clean Reads No.Q30 (%)Total Mapped (%)Multiple Mapped (%)Uniquely Mapped (%)
A_1454258764510198494.8492.87%4.00%96.00%
A_2446764624432303494.5893.74%4.46%95.54%
A_3460696544552562293.6191.77%4.31%95.69%
B_1427307304214471293.0191.69%15.13%94.87%
B_2468431524620567893.0691.11%3.31%96.69%
B_3422963584199503894.4992.05%3.81%96.19%
C_1430990644253211493.1690.75%4.20%95.80%
C_2445300664406686094.0690.39%3.74%96.26%
C_3449455544443731293.7690.85%3.99%96.01%
D_1467518564631945294.1392.00%4.03%95.97%
D_2437623224332600894.0492.00%5.02%94.98%
D_3528176125232529493.9691.76%3.33%96.67%
Table 2. Statistics of gene annotation results of Medicago truncatula.
DatabaseNumberPercentage (%)
NR11,15192.46
GO649053.81
KEGG435136.07
eggNOG978081.09
Swissprot826968.56
In all database343628.49
Table 3. eggNOG functional classification of the transcriptome of Medicago truncatula.
Functional ClassificationNumber of Genes/EachPercentage/%
RNA processing and modification7532.82
Chromatin structure and dynamics2701.01
Energy production and conversion6742.52
Cell cycle control, cell division, and chromosome partitioning2961.11
Amino acid transport and metabolism8513.18
Nucleotide transport and metabolism2070.77
Carbohydrate transport and metabolism13124.91
Coenzyme transport and metabolism2751.03
Lipid transport and metabolism6182.31
Translation, ribosomal structure, and biogenesis9983.73
Transcription21948.20
Replication, recombination, and repair12364.62
Cell wall/membrane/envelope biogenesis1830.68
Post-translational modification, protein turnover, and chaperones21237.94
Inorganic ion transport and metabolism6082.27
Secondary metabolites biosynthesis, transport, and catabolism11264.21
Function unknown900833.68
Signal transduction mechanisms26699.98
Intracellular trafficking, secretion, and vesicular transport7942.97
Defense mechanisms3021.13
Extracellular structures80.03
Nuclear structure70.03
Cytoskeleton2330.87
Table 4. Expression patterns of key genes in photoperiod regulation pathway of Medicago truncatula.
GeneUnigene CodeFPKMGene Expression Model
A
Branching Stage
B
Bud Stage
C
First Flowering Stage
D
Blooming Stage
A vs. BB vs. CC vs. D
GIgene-LOC1141056222.4552.221.4527.22UpDownUp
COgene-LOC114359740.191.174.610.43Up-Down
PHYAgene-LOC2550074212.8926.256.0112.42-DownUp
PHYBgene-LOC1142002512.7111.8916.7913.27---
CRY1gene-LOC11428875138.89162.06165.35134.21---
CRY2gene-LOC2548445251.7069.8980.6656.78---
TOC1gene-LOC1142261532.2856.0666.9833.86Up--
ELF3gene-LOC114314021.472.9316.781.20-UpDown
LHYgene-LOC11432385469.08192.19806.17415.10DownUp-
Col2gene-LOC25497637129.53122.78174.20134.80---
Col13gene-LOC1143477822.9231.4756.7117.66--Down
Col4gene-LOC11431452169.85104.34163.58146.27---
Col5gene-LOC11425462131.48191.78251.04195.10---
Col6gene-LOC2549801520.0017.685.7916.2-DownUp
Col9gene-LOC114155143.252.3257.722.85-UpDown
Note: “-” indicates no significant difference in gene expression levels.
Disclaimer/Publisher’s Note: The statements, opinions and data contained in all publications are solely those of the individual author(s) and contributor(s) and not of MDPI and/or the editor(s). MDPI and/or the editor(s) disclaim responsibility for any injury to people or property resulting from any ideas, methods, instructions or products referred to in the content.

