Article

Spatiotemporal Variability in Fish Assemblages in a Coastal and Estuarine System in the Tropical Eastern Pacific during the Anthropause

by
Yareli Hernández-Álvarez
1,
Georgina Ramírez-Ortiz
2,
Francisco Flores-de-Santiago
3,
Felipe Amezcua-Linares
3,
Victor Muro-Torres
4,
Daniel Arceo-Carranza
5 and
Felipe Amezcua
2,*
1
Posgrado en Ciencias del Mar y Limnología, Universidad Nacional Autónoma de México, Cto. de los Posgrados S/N, C.U., Coyoacán, México City 04510, Mexico
2
Unidad Académica Mazatlán, Instituto de Ciencias del Mar y Limnología, Universidad Nacional Autónoma de Mexico, Joel Montes Camarena s/n, Mazatlán 82000, Mexico
3
Instituto de Ciencias del Mar y Limnología, Universidad Nacional Autónoma de México, Avenida Universidad 3000, Mexico City 04510, Mexico
4
CONACYT-Centro de Investigaciones Biológicas del Noreste, Av. Instituto Politécnico Nacional 195, La Paz 23096, Mexico
5
Unidad Multidiciplinaria de Docencia e Investigación, Sisal, Facultad de Ciencias, Universidad Nacional Autónoma de México, Puerto de Abrigo s/n, Sisal 97356, Mexico
*
Author to whom correspondence should be addressed.
Diversity 2023, 15(8), 934; https://doi.org/10.3390/d15080934
Submission received: 13 June 2023 / Revised: 9 August 2023 / Accepted: 11 August 2023 / Published: 17 August 2023
(This article belongs to the Special Issue Marine Biodiversity and Ecology of the Gulf of California)

Abstract

:
Differences in fish assemblages’ composition and their relationship with the environmental variables were analyzed in the Urías estuarine system, Mexican North Pacific. Environmental variables and fish catches were recorded bimonthly between June 2018 and November 2021, including a period before and during the COVID-19 pandemic. Multivariate analyses were performed in the studied area to define zones based on their environmental, biotic, and abiotic characteristics and the effect of these on the fish assemblages. Two zones were identified, an estuarine with mangrove forest and a surf zone in the coastal area outside the estuarine system. Fish composition, biomass, and diversity (α and β) were evaluated among the factors of the period (before–during COVID-19), climatic seasons, and zones. A total of 5947 fish individuals of 41 species were collected using beach seines as fishing gear. The structure of the fish assemblages was different between zones and periods. Abiotic (temperature, salinity, and total matter suspended), biotic (mangrove area), and temporal (season and period before–during COVID-19) variables had an effect on fish biomass and α diversity, while the results of the β diversity only indicate changes in the nestedness component before–during the lockdown. These results indicate a change in fish assemblages’ structure and composition between periods, which might be a consequence of the limitation of human activities derived from the pandemic, climatic changes, or a combination of both effects. Our results show that fish assemblages in the estuarine systems of the Tropical Eastern Pacific are unique, and there is a need to establish local management strategies for these ecosystems.

1. Introduction

Tropical coastal and estuarine systems support diverse communities and high biomass at different trophic levels, making them among the most productive ecosystems worldwide [1,2]. These coastal ecosystems host multiple species of fish that use them to feed, reproduce, and act as nursery habitats [3]. Besides that, these ecosystems are usually an essential source of protein for human populations and an utmost economic resource, especially for developmental emerging countries [4].
The ichthyofauna in these systems is affected in two ways. Firstly, human activities can negatively affect fish communities and alter the natural functioning of aquatic ecosystems through stressors on the systems [5]. Secondly, constant fluctuations in environmental factors (precipitation, tidal regime, temperature, salinity, etc.) affect the diversity and density of fish in tropical coastal systems [6,7,8]
In the first case, the stressors can be direct, such as overexploitation of fishing resources, or cumulative, such as diffuse effects of habitat degradation associated with chemical alterations throughout a watershed (e.g., point source contaminant loads and nutrient transport disruption) leading to an abrupt increase in nutrient content and various xenobiotic elements (i.e., eutrophication) [5]. In the second case, fish abundance and diversity are altered as a consequence of changes in the annual rainfall and river discharges induced by phenomena such as El Niño, La Niña, and the Pacific Decadal Oscillation (PDO), exacerbating the effects of sea level rise and changing the biogeochemical properties of the water [9]. As a result, these ecosystems are highly vulnerable to the effects of human impacts and climate change [10].
It has been recognized that aquatic ecosystems respond positively to decreases in stress, and this reflects in the biodiversity [5]. As a result of the global pandemic by COVID-19 declared by the World Health Organization on 11 March 2020, a drastic reduction in human activities occurred [11], which in turn resulted in a reduction of different stressors leading to a sudden drop in carbon and nitrogen dioxide emissions, improvements in water quality, decrease in pollution by anthropogenic waste, and reduction of acoustic pollution [12,13,14,15], which in turn resulted in the increase in aquatic biota [16].
In the Mexican North Pacific, preventive measures due to the pandemic led to the total or random closure of small-scale fishing, tourism, and port trade [17], thus affecting the socio-economic activities in the area. Estuarine systems in this region support small-scale fisheries from demersal and benthopelagic species of local and regional commercial importance [18,19]. For the specific case of the Urías estuarine system, small-scale landings of fish did not increase during the anthropause, despite a steady increase of more than 10,000 metric tons per year, since 2016. A total of 169,887,307 tons were landed during the anthropause compared to 168,651,288 tons landed in 2019 and 179,412,604 tons in 2021 when all the activities resumed [18,20]. Also, the cruise tourism sector had to face a suspension of activities of up to 12 months during the confinement [21], while maritime trade had a drastic drop of −7.4% compared to 2019 [22].
Fish composition, and therefore fish landings in the Urías estuarine system, changed seasonally due to its location at the Sinaloan Gap, which is a transition zone separating the temperate Cortez and the tropical Mexican biogeographic provinces [23], and as a consequence, the climatic events that change the water temperature can affect the fish assemblages in this system. Hence, this work aimed to determine if there were changes in the fish assemblages of the Urías estuarine system and the contiguous marine area, through the comparison of abundance, biomass, α (Hill numbers), and β diversity (turnover and nestedness) from 2018 to 2021, and if this variation could be related to the reduction of socio-economic activities due to the anthropause. We hypothesized that fish abundance, biomass, and diversity increased from 2018 to 2021, due to the global and local reduction/stability of socio-economic activities (e.g., trade, tourism, small-scale fishing) during the COVID-19 lockdown.

2. Materials and Methods

2.1. Study Area

The studied area was the estuarine system of Urías and the adjacent surf zone at the entrance of the system denominated Isla de la Piedra on the northwestern coast of Mexico (Figure 1). Urías is a type II estuarine system (tide-dominated estuary) communicated in its northern part through an inlet to the Pacific Ocean [24]. It is populated by red mangrove (Rhizophora mangle), white mangrove (Laguncularia racemosa), and black mangrove (Avicennia germinans), with an average coverage of 1153 ha, leading to high biological diversity and a complex food chain [18,25,26]. This coastal system has average values of depth of 3 m, temperature of 25 °C, salinity of 33, rainfall per year of 812 mm, annual evaporation of 1500 mm, and water replacement time of 5.5 to 6.5 days. The main contribution of fresh water to this system comes from surface runoff and from the small streams located in the highest part of the coastal lagoon, which includes a group of tidal channels that present a coefficient runoff of 14.24% with a daily natural surface runoff of 135,488 m2 [27].

2.2. Sampling Design

A suite of sampling stations was placed along different beaches in the studied area, including both environments found in the system (estuarine and surf zone; Figure 1). At each station, the date, time, the abiotic variables of temperature (°C), and salinity (‰) were recorded with a Horiba U-50 Series multiparameter water quality checker.
Fish were collected at each sampling station using an 80 m-long by one-meter width beach seine net with a mesh size of 1 cm. Since the depth at each sampling station was <2 m, the trawling was carried out from the beach, covering a total area per haul of ~120 m2 multiplied by the number of hauls made at each sampling station to calculate the actual sampled area. After each sampling endeavor, the collected organisms were iced and transported to the laboratory. Fish were identified to species level [23,28], and the biometric measurements of total length (TL) and total weight (PT) were recorded using an ichthyometer (+0.05 mm) and a digital scale (0.01–200 g + 0.001). Samples were collected bimonthly during the morning hours from June 2018 to November 2021, which included two pre-COVID-19 pandemic years (2018–2019) and two years during the COVID-19 pandemic restrictions (2020–2021).
To assess if the anthropause affected turbidity, we obtained the total suspended matter (mg/L) as it is a good indicator of the anthropogenic impact on coastal systems. This was obtained by downloading Sentinel-2 multispectral images from the official website of the European Space Agency https://scihub.copernicus.eu/ (accessed on 1 March 2022). Image dates correspond to the field campaigns using the specific field-of-view T13QCF. Then, each image was selected in a 2A format with the atmospheric correction algorithm (sen2cor). Each of the Sentinel-2 images was imported into the free SNAP software that extracts the band b5 (red-edge 704 nm), the area of each sampling site (10 × 10 m), and calculates the total suspended matter (mg/L) using the methodology of Mishra and collaborators (2021) for water quality monitoring in coastal areas [29].
The studied area was divided into zones according to abiotic, biotic, and geomorphological characteristics. Biotic characteristics included the water total suspended matter (mg/L), and the mangrove extension and height. Mangrove forest extension was quantified using a 200-m constant vector shape in front of the sampling station over a freely available Google Earth image. Mangrove height was calculated using a portable Vertex Laser VL400 hypsometer to estimate average values per species.
With the abiotic, biotic, and geomorphological information, two zones were established: (1) Estuarine zone: which includes a tidal channel and a lagoon zone. The tidal channel is characterized by an estuarine beach with a mean depth of 1.5 m, strongly influenced by the cycle of semi-diurnal tides of the Pacific Ocean, and bordered by marginal black mangrove (A. germinans) with an average height of 3 m and extension of 1.5 ha. This area receives the highest human impact because it receives residual discharges from the city and industrial zone of Mazatlán, and it is the site with the highest traffic of ships (fishing, commercial, and tourist). The lagoon zone is distinguished by an estuarine beach with a mean depth of 1.5 m, influenced by freshwater inputs, and bordered by fringe red mangrove (R. mangle) with an average height of 5 m and extension of 0.17 ha. This zone is the most “conserved” in terms of mangrove forest and receives less anthropogenic impacts from the city and industry because it is further away. (2) Marine surf zone: represented by a coastal beach with a mean depth of 2 m, adjacent to the estuarine system of Urías with a direct connection with the Pacific Ocean, and high effect of littoral currents, tidal forces, and waves from local wind. This zone is only impacted by beach tourism and small-scale coastal fishing.
Comparisons between fish diversity were made using the factors zones (estuarine and marine surf zone) as spatial variables; period (pre-COVID-19 2018–2019 and during-COVID-19 restrictions 2020–2021), and season ([11] (DC) Dry-cold, December to March; (DW) Dry-warm, April to June; (RW) Rainy-warm, July to November) as temporal variables [18].

2.3. Analysis of Environmental Data

Differences in temperature (°C), salinity, and total suspended matter (mg/L) between the zones were analyzed for every season using a one-way ANOVA. Cochran’s C test was used for homogeneity of variance, and Tukey’s HSD test was used for pairwise mean comparison in case of significant results.
To determine spatiotemporal variations in zones according to their environmental characteristics (salinity, water temperature, total suspended matter, mangrove area, and height), multivariate analyses (PERMANOVA and PCoA) were performed according to the aforementioned factors (zone, period, and season). Since environmental data involve multiple variables measured on different scales, a normalization procedure was applied, transforming each variable into a mean of 0 and a standard deviation of 1. Pearson’s correlation coefficients and corresponding p-values were tested using the RStudio “cor” function, to determine statistically significant correlations between environmental variables. If significant correlations were found, data were fourth-root transformed, and the analysis was rerun until the correlation was not significant. Afterward, a similarity matrix of environmental data between sampling stations was constructed using the Euclidean distance.
A permutational multivariate analysis of variance (PERMANOVA) was performed on the similarity matrix [30] to test the H0: the period before–during the COVID-19 pandemic is not different despite differences between the environmental factors analyzed, with a significance of p < 0.05. A Bonferroni test was applied by dividing α (0.05) by the number of comparisons to reduce type I error.
In case of statistical differences, a principal coordinate analysis (PCoA) was performed to visualize how the different sampling stations or periods clustered. This analysis allowed us to determine which features best explained cluster separation through a two-dimensional scatterplot and the environmental characteristics of each sampling station overlaid as vectors. The importance of a given environmental factor in the groups of sampling stations is indicated by the trajectory of the vector, so both axes have a scale from -n to n, with a centroid of value 0,0 where all the points should be if the null hypothesis was true [31].

2.4. Analysis of Fish Assemblages

The similarity between fish assemblages at each zone, season, and period was calculated based on biomass per species. To avoid variations among fishing operations, biomass data of each haul were standardized as Catch per Unit of Effort (CPUE) by dividing the number of organisms caught in each fishing operation by the swept area (i.e., the length of the net multiplied by the distance hauled) [32]
Randomized species accumulation curves were performed to determine if the samples adequately represented the species composition in the studied area. Samples were randomized 1000 times using Chao’s 2 estimator, which depends on the number of species found in a sample [33] and estimates the number of species considering the species distribution between samples and the possibility of finding new species, taking into account the rare species. Its arithmetic notation is:
S e s t = S o b s + Q 1 2 2 Q 2
where Sest is the estimated number of species, Sobs is the observed number of species in the sample, Q1 is the number of species that occur in one sample only (unique species), and Q2 is the number of species that occur in two samples [34].
Spatiotemporal differences in fish assemblages were tested using hierarchical multivariate analyses with period, season, and zone as levels. A matrix containing j columns (seine-hauls) and i lines (species) was created. From this, a Bray–Curtis similarity matrix was generated, where each zone was considered a replicate within each season and period. To test the H0 that fish assemblages did not differ according to the environmental factors, a PERMANOVA was used with a fixed factor (model type I), and its statistical significance was tested using a type III sum of squares, with 10,000 unrestricted permutations of raw data [30]. A permutation test was conducted to examine the homogeneity of species composition between zone, season, and period using the PERMDISP routine from PRIMER 7. To determine if periods, seasons, and zones differed, pairwise tests were performed by applying a Bonferroni procedure to correct multiple comparisons.
To identify the environmental variables that affected the variation of fish assemblages between periods, seasons, and zones, a distance-based linear model permutation test (DistLM) was performed, meeting the assumption of this analysis (the number of samples was higher than the number of variables) [35,36]. In this analysis, the variation in the data is partitioned and displayed as a resemblance matrix calculated by multiple regression models [36]. Additionally, a marginal test shows the amount of variation explained by each variable, ignoring the other variables, and a sequential test (forward direction) selects individual variables based on the Akaike information criterion (AIC). The lowest AIC values indicated the parsimonious model (the best combination of environmental variables that explain fish assemblages’ composition), and the proportion of explained variation attributed to each variable is added to the model as a function of the other variables already present [35]. Based on the parsimonious model selected, a distance-based redundancy analysis (dbRDA) was conducted to visualize the relationship between environmental variables and fish assemblages’ composition. To determine which species accounted for most of the dissimilarities among the spatiotemporal compositions, a similarity of percentages analysis (SIMPER, Bray–Curtis index, and cutoff at 90%) was used [37,38], thereby identifying characteristic species for each system.
Once the factors contributing to the observed differences in fish assemblages were identified, α-diversity indices were computed based on haul-specific species biomass data standardized by the CPUE. The α diversity was estimated using Hill numbers or effective species numbers (qD), which are the number of equally likely elements needed to produce the given value of the diversity index [39,40]. The selected indices were: order 0 or species richness (0D), which gives disproportionate weight to rare species because it is not sensitive to the biomass of the species; order 1 or exponential of the Shannon entropy (1D), sensitive to the number of common species in the community since the influence of each species depends on its biomass in the sample; and order 2 or inverse concentration of Simpson (2D), sensitive to the number of dominant species in the community since it favors species with high biomass [39,40,41]. Differences between these indices according to the contributed factors were analyzed using factorial ANOVA. Homoscedasticity of variances was checked using Cochran’s C test, and if significant differences were found, pairwise comparisons were performed using a Tukey HSD test [42].
Hill numbers and biomass values were used as response variables in Generalized Additive Models (GAM), which replace the linear form ΣBjXj with a sum of smooth functions ΣSj(Xj), where the Sj()′s are unspecified functions estimated using a scatterplot smoother in an interactive procedure called a local scoring algorithm [40]. In contrast, explanatory variables were the environmental factors that affected the fish assemblages’ composition according to the previous multivariate analyses (period, season, temperature, salinity, total matter suspended, and mangrove area). According to the behavior of the data, the binomial probability distribution was used with a logit link function (biomass, and Hill numbers 1D and 2D), and Gaussian with a natural logarithm link function in the case of species richness.
The biomass per species matrix was transformed to a presence matrix to calculate the local contribution of each sample to both components of β-diversity (turnover and nestedness), using the Jaccard dissimilarity coefficient [43]. Parametric statistical tests were undertaken in STATISTICA 12 (StatSoft Inc. Tulsa, OK, USA). Multivariate analyses and species accumulation curves were completed using PRIMER 7 with PERMANOVA (PRIMER-e, serial no. 7875) [30,35]. α-diversity, Hill numbers, and β-diversity components (turnover and nestedness) were estimated using the function “beta.div.comp” of the package “adespatial” [44,45], and GAM were performed using the “mgcv” package in R [46].

3. Results

3.1. Analysis of Environmental Data

Marked seasonal differences were found in water temperature according to the established climatic seasons, as it was significantly lower during the DC season (23.94 ± 1.01 °C), followed by the DW season (27.7 ± 1.06 °C) and the RW season (32.52 ± 0.74 °C; F(2,17) = 53.38, p < 0.05). In contrast, no significant differences among seasons were found for salinity and total suspended matter. Additionally, no significant correlations were found among environmental variables after normalization (Pearson’s correlation coefficient = 0.53, p > 0.05).
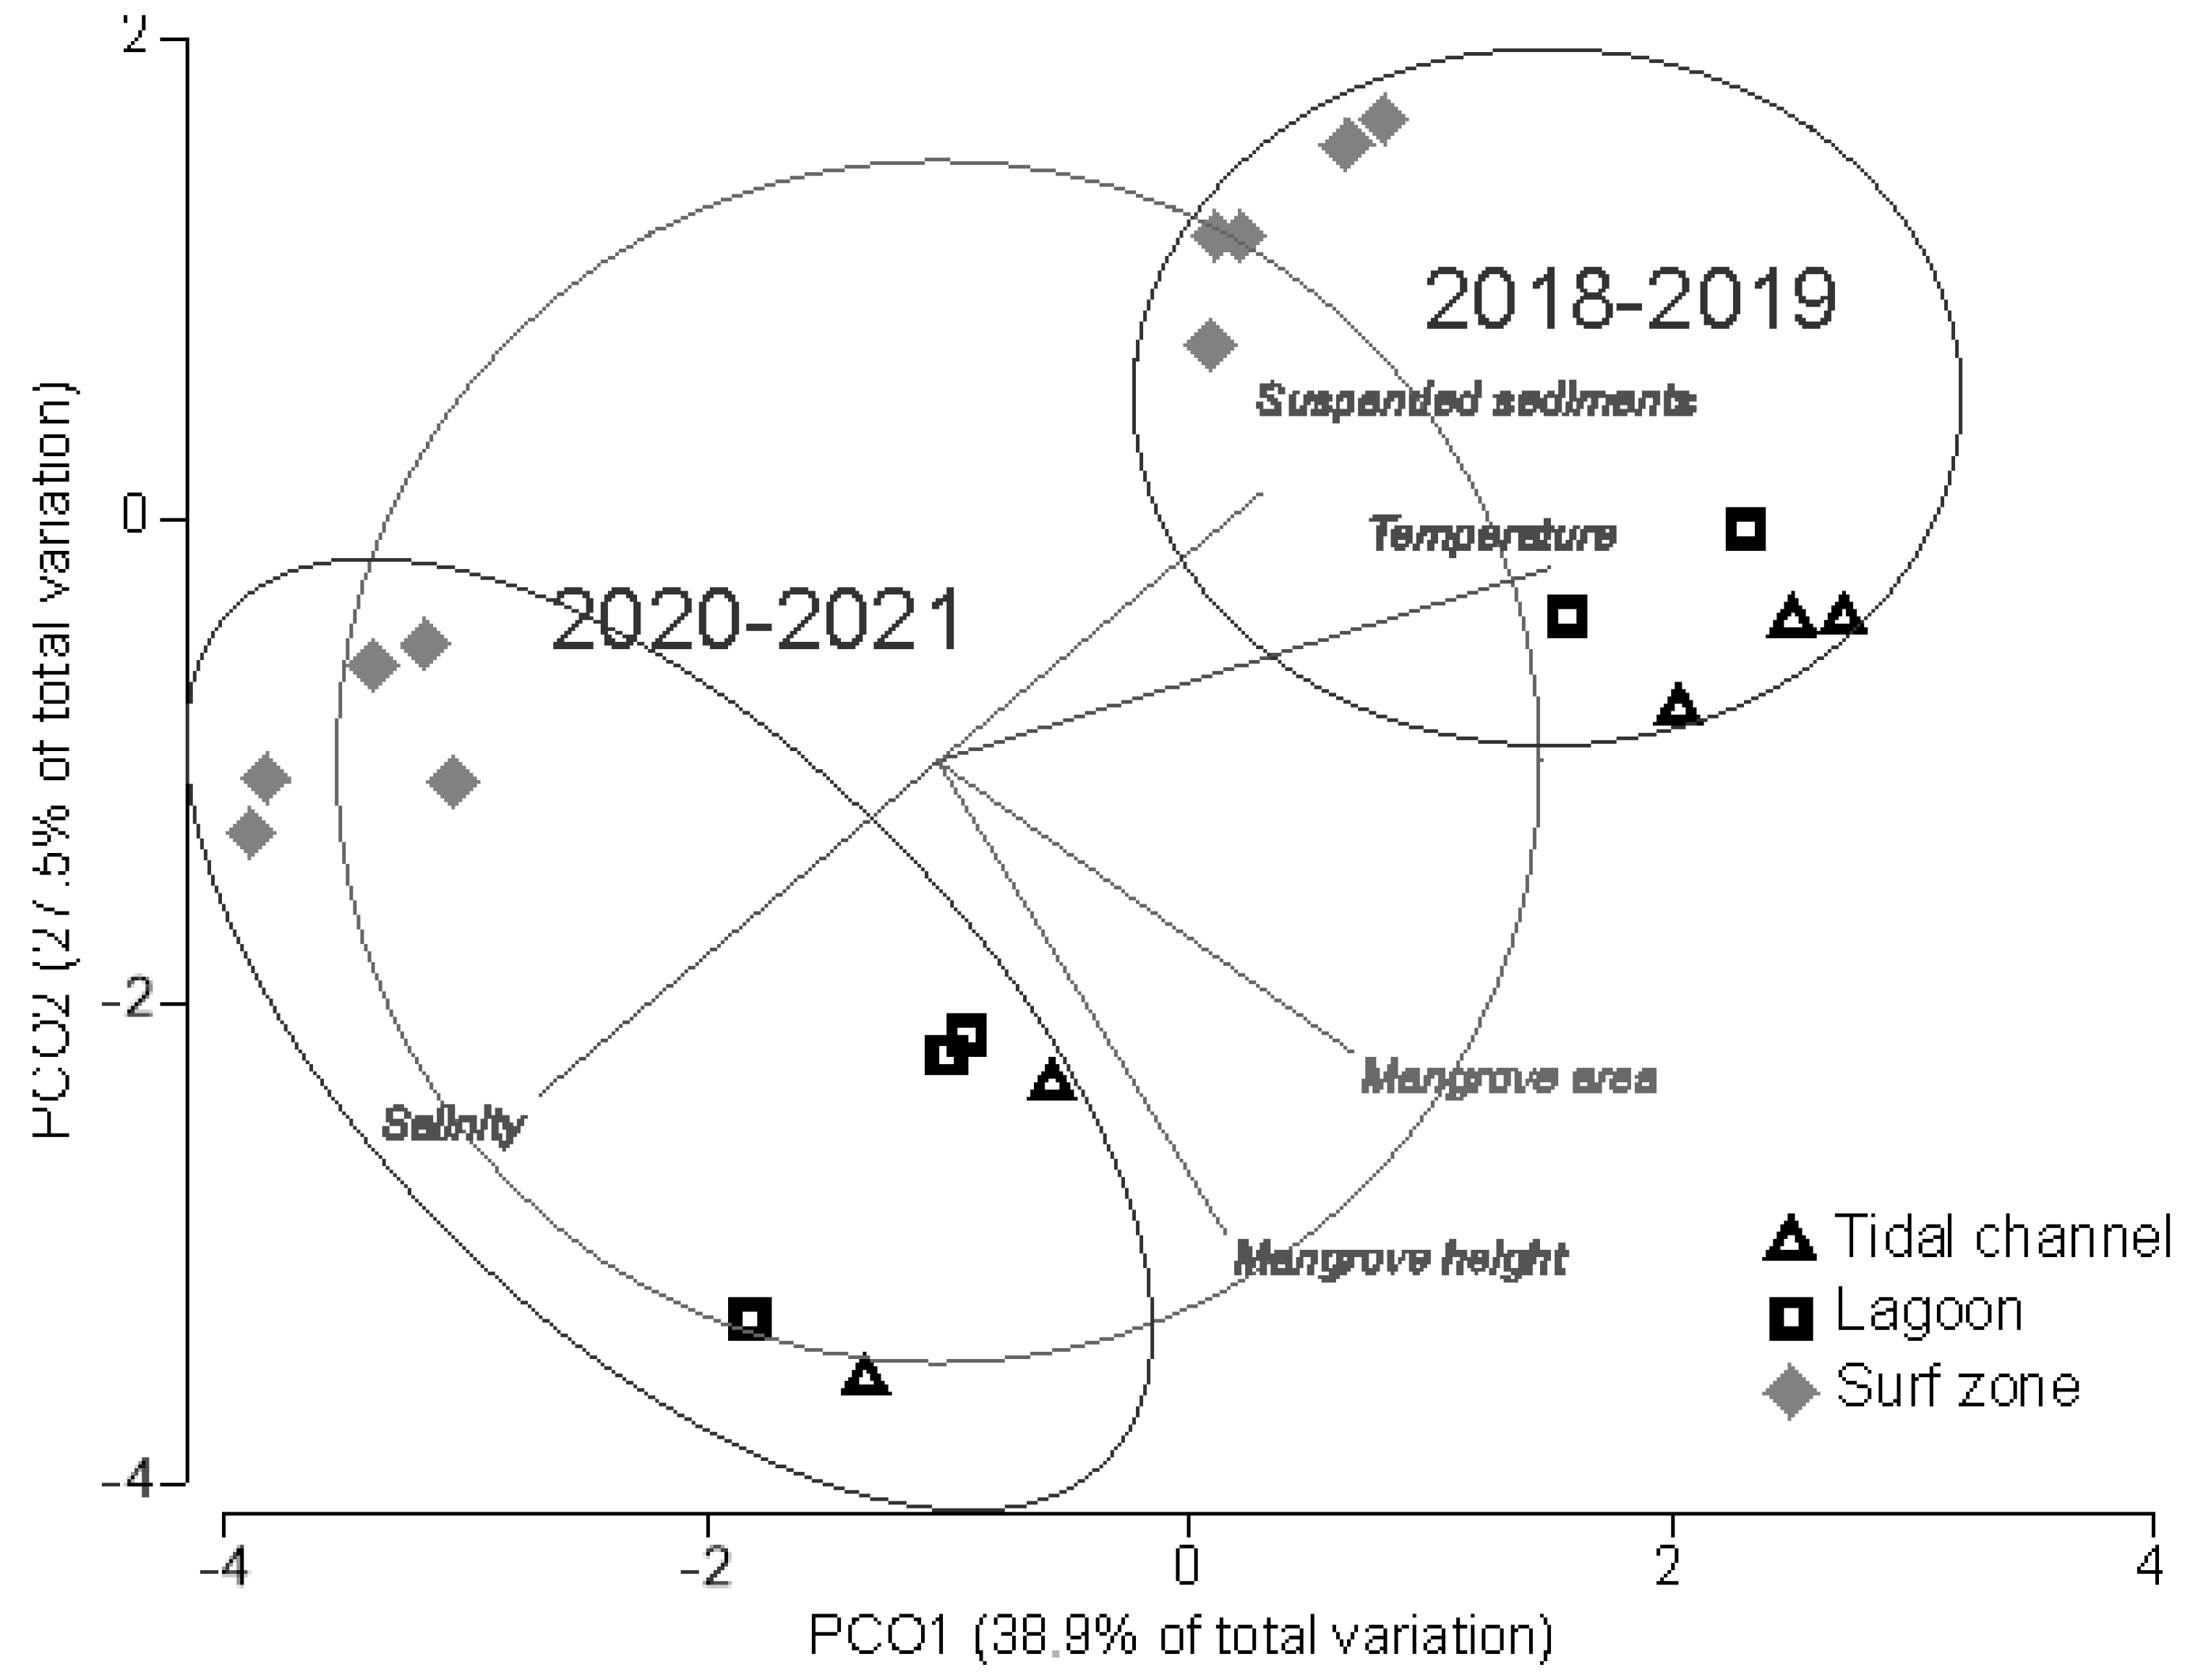
Based on environmental data, significant differences for the factor period (pseudo-F(1,19) = 3.90, p = 0.002) and zone (pseudo-F(2,19) = 7.68, p = 0.001) were revealed by PERMANOVA. In contrast, no significant differences were found between climatic seasons (pseudo-F(2,19) = 1.94, p > 0.05). Differences between zones were displayed in the PCoA graph (Figure 2), where the sampling stations exhibited horizontal separation (PCO1 explained 38.9% of the variation) and vertical separation (PCO2 explained 27.5% of the variation). According to the period, suspended sediments and temperature were relevant prior to the COVID-19 pandemic and then decreased during the anthropause, while salinity was relevant during the COVID-19 pandemic when this parameter increased and also was related to the separation between the surf area and the areas inside the coastal lagoon. According to zones, the relevant factors were the mangroves’ presence in the estuarine areas but absence in the surf zone. (Figure 2).

3.2. Analysis of Fish Assemblages

A total of 5947 fish individuals were collected, corresponding to 41 species, being the most important in terms of biomass the striped herring Lile stolifera (28.57%), the California halfbeak Hyporhamphus rosae (16.73%), the white mullet Mugil curema (9.88%), and the Pacific crevalle jack Carax caninus (9.40%). The estuarine zone was characterized by high biomass of the striped herring L. stolifera (59.48%), followed by the mullet M. curema (17.45%) and the dark-spot mojarra Eucinostomus entomelas (4.83%). In contrast, in the surf zone, the highest biomass corresponded to the California halfbeak H. rosae (38.3%), followed by the Pacific crevalle jack C. caninus (20.97%), and the yellowfin herring Pliosteostoma lutipinnis (13.34%). The remaining species represent less than 27.4% of the total biomass (Table 1).
In terms of total abundance, the striped herring L. stolifera (49.21%), the Pacific crevalle jack C. caninus (13.57%), and the California halfbeak H. rosae (8.38%) were the most relevant. In the estuarine zone, the most abundant species were the striped herring L. stolifera (75.95%), the mojarras E. entomelas (7.41%), and E. gracilis (5.05%). The most abundant species in the surf zone were the Pacific crevalle jack C. caninus 38.12%, the California halfbeak H. rosae (23.57%), and the Dove’s longfin herring Opisthopterus dovii (10.26%).
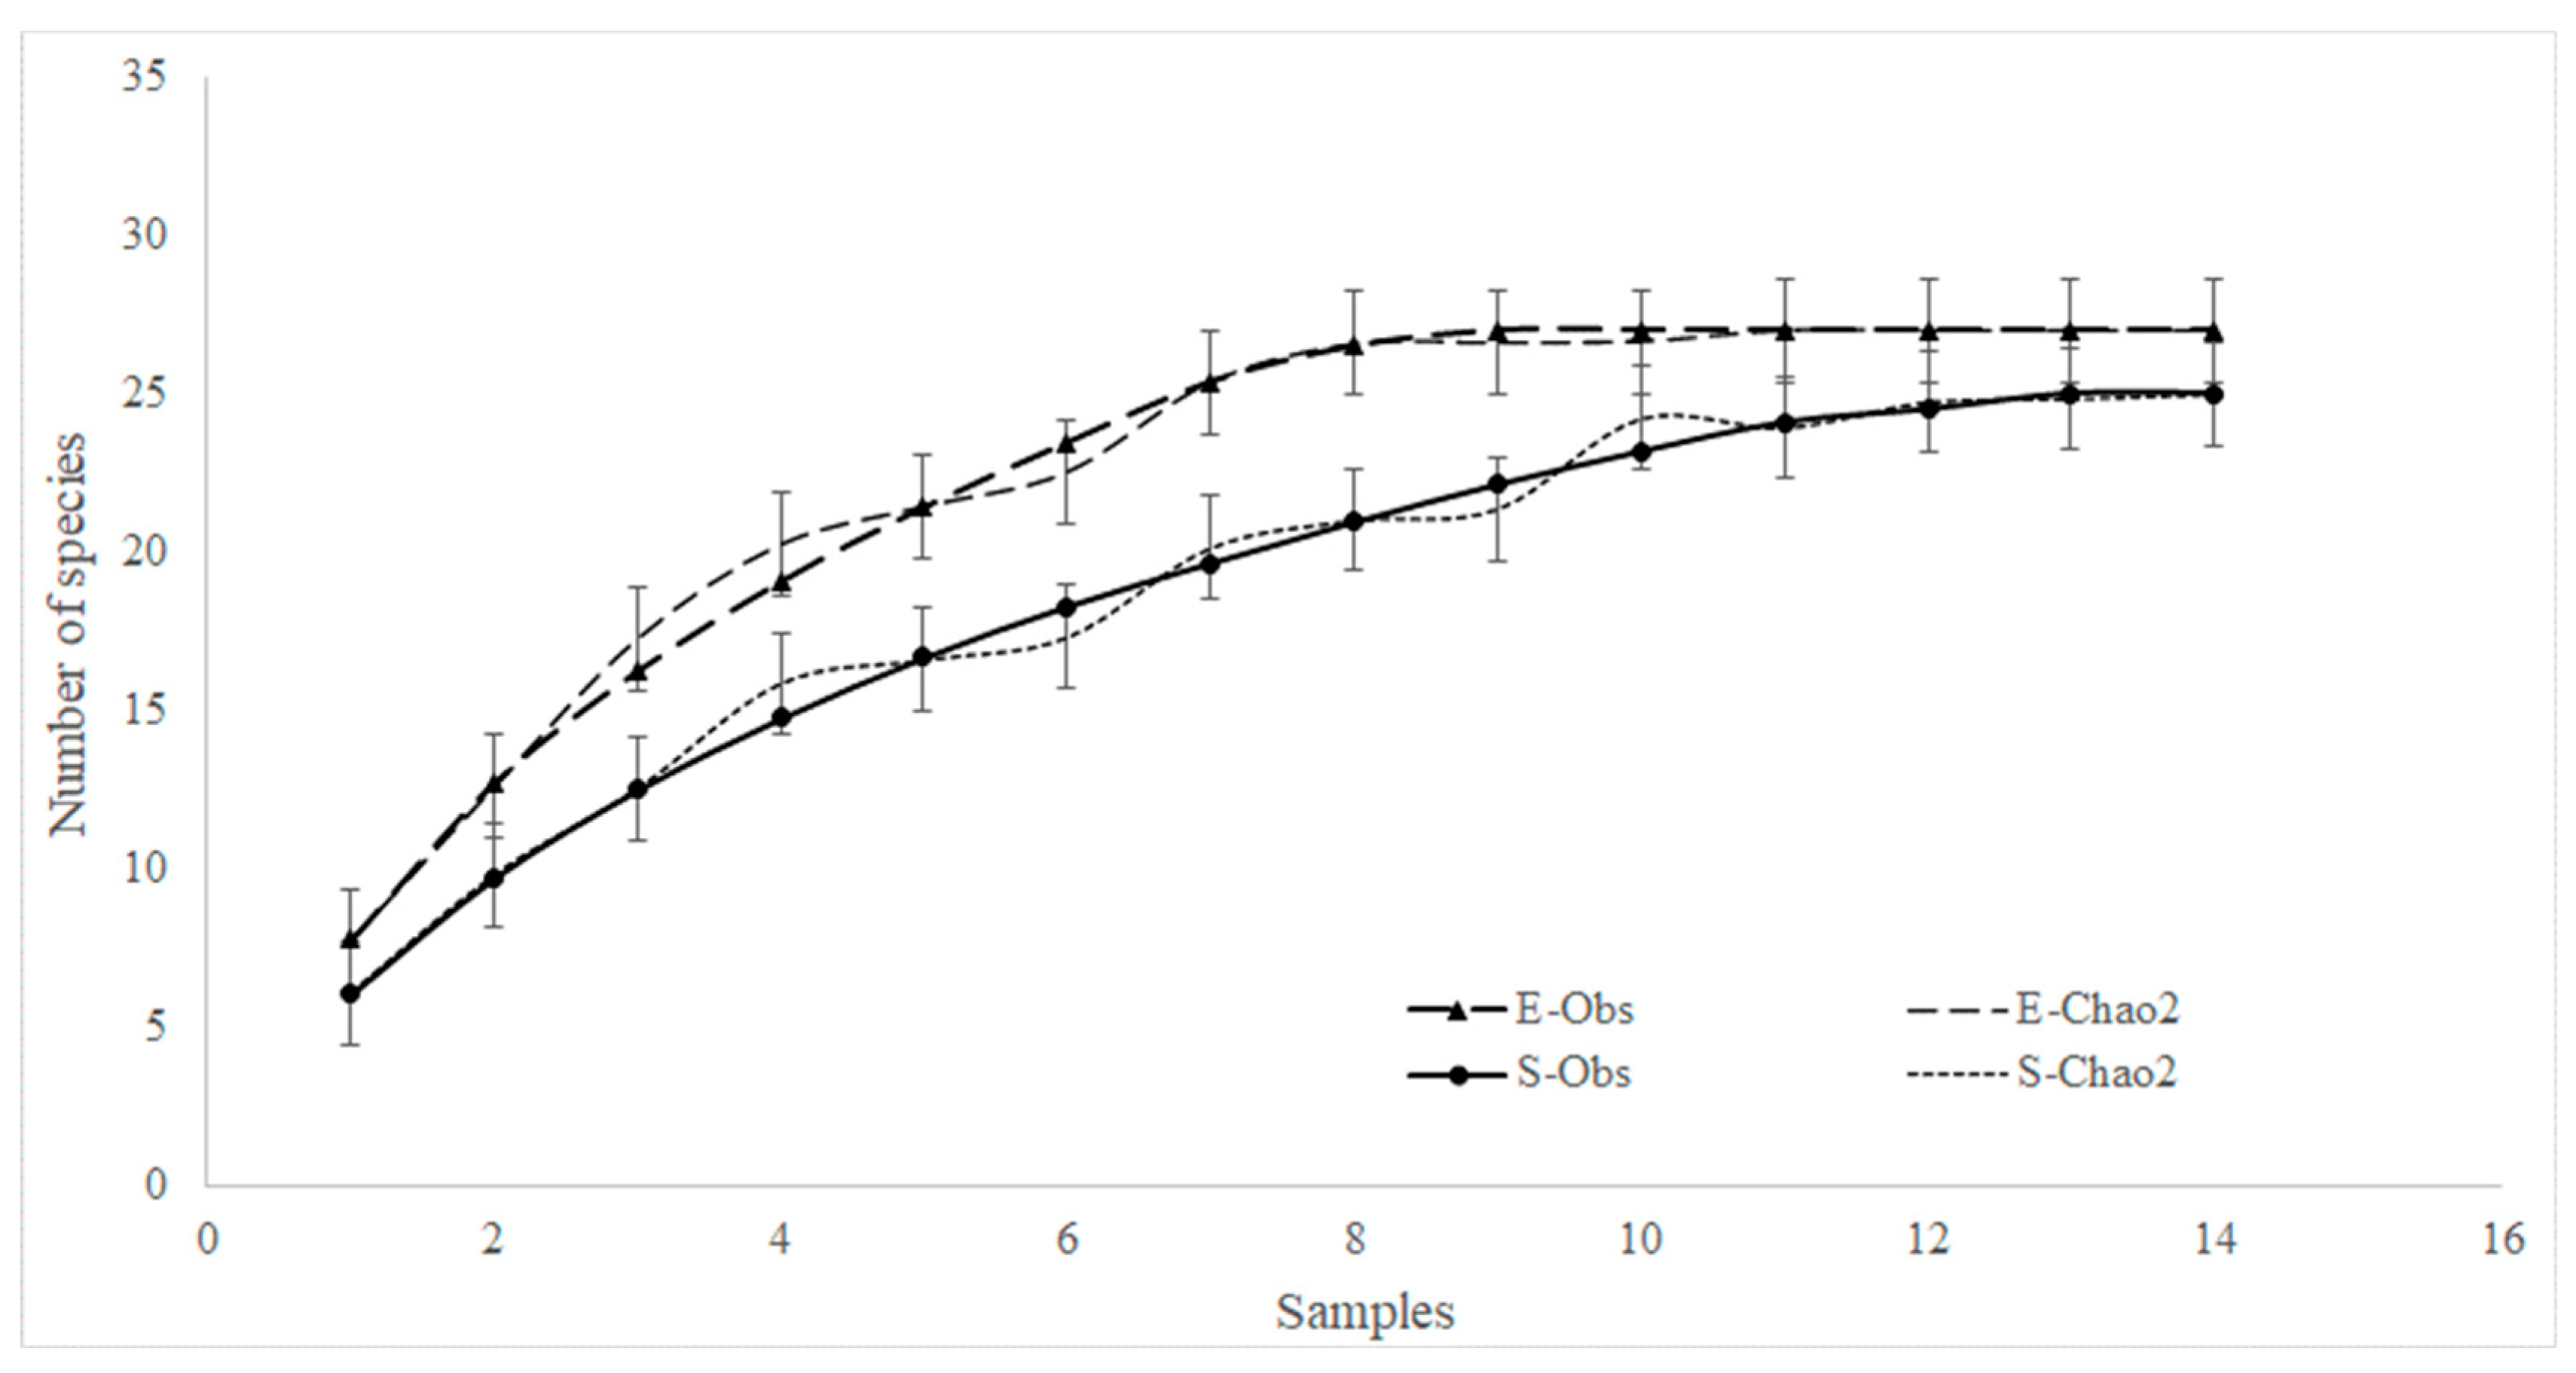
The sample-based rarefactions using the Chao 2 model showed that the sampling effort was representative of both studied zones (Figure 3), with equal values between potential and observed species for both systems.
PERMANOVA results showed significant differences in fish assemblages’ composition between periods (pseudo-F(1,19) = 1.83, p < 0.05) and zones (pseudo-F(2,19) = 2.79, p < 0.05) (Supplementary Material Table S1), but no differences were found between seasons (pseudo-F(2,19) = 1.38, p > 0.1). According to PERMDISP, the composition of the fish groups was homogeneous among the factors; that is, the data were only influenced by position effects according to the significance of the PERMANOVA test.
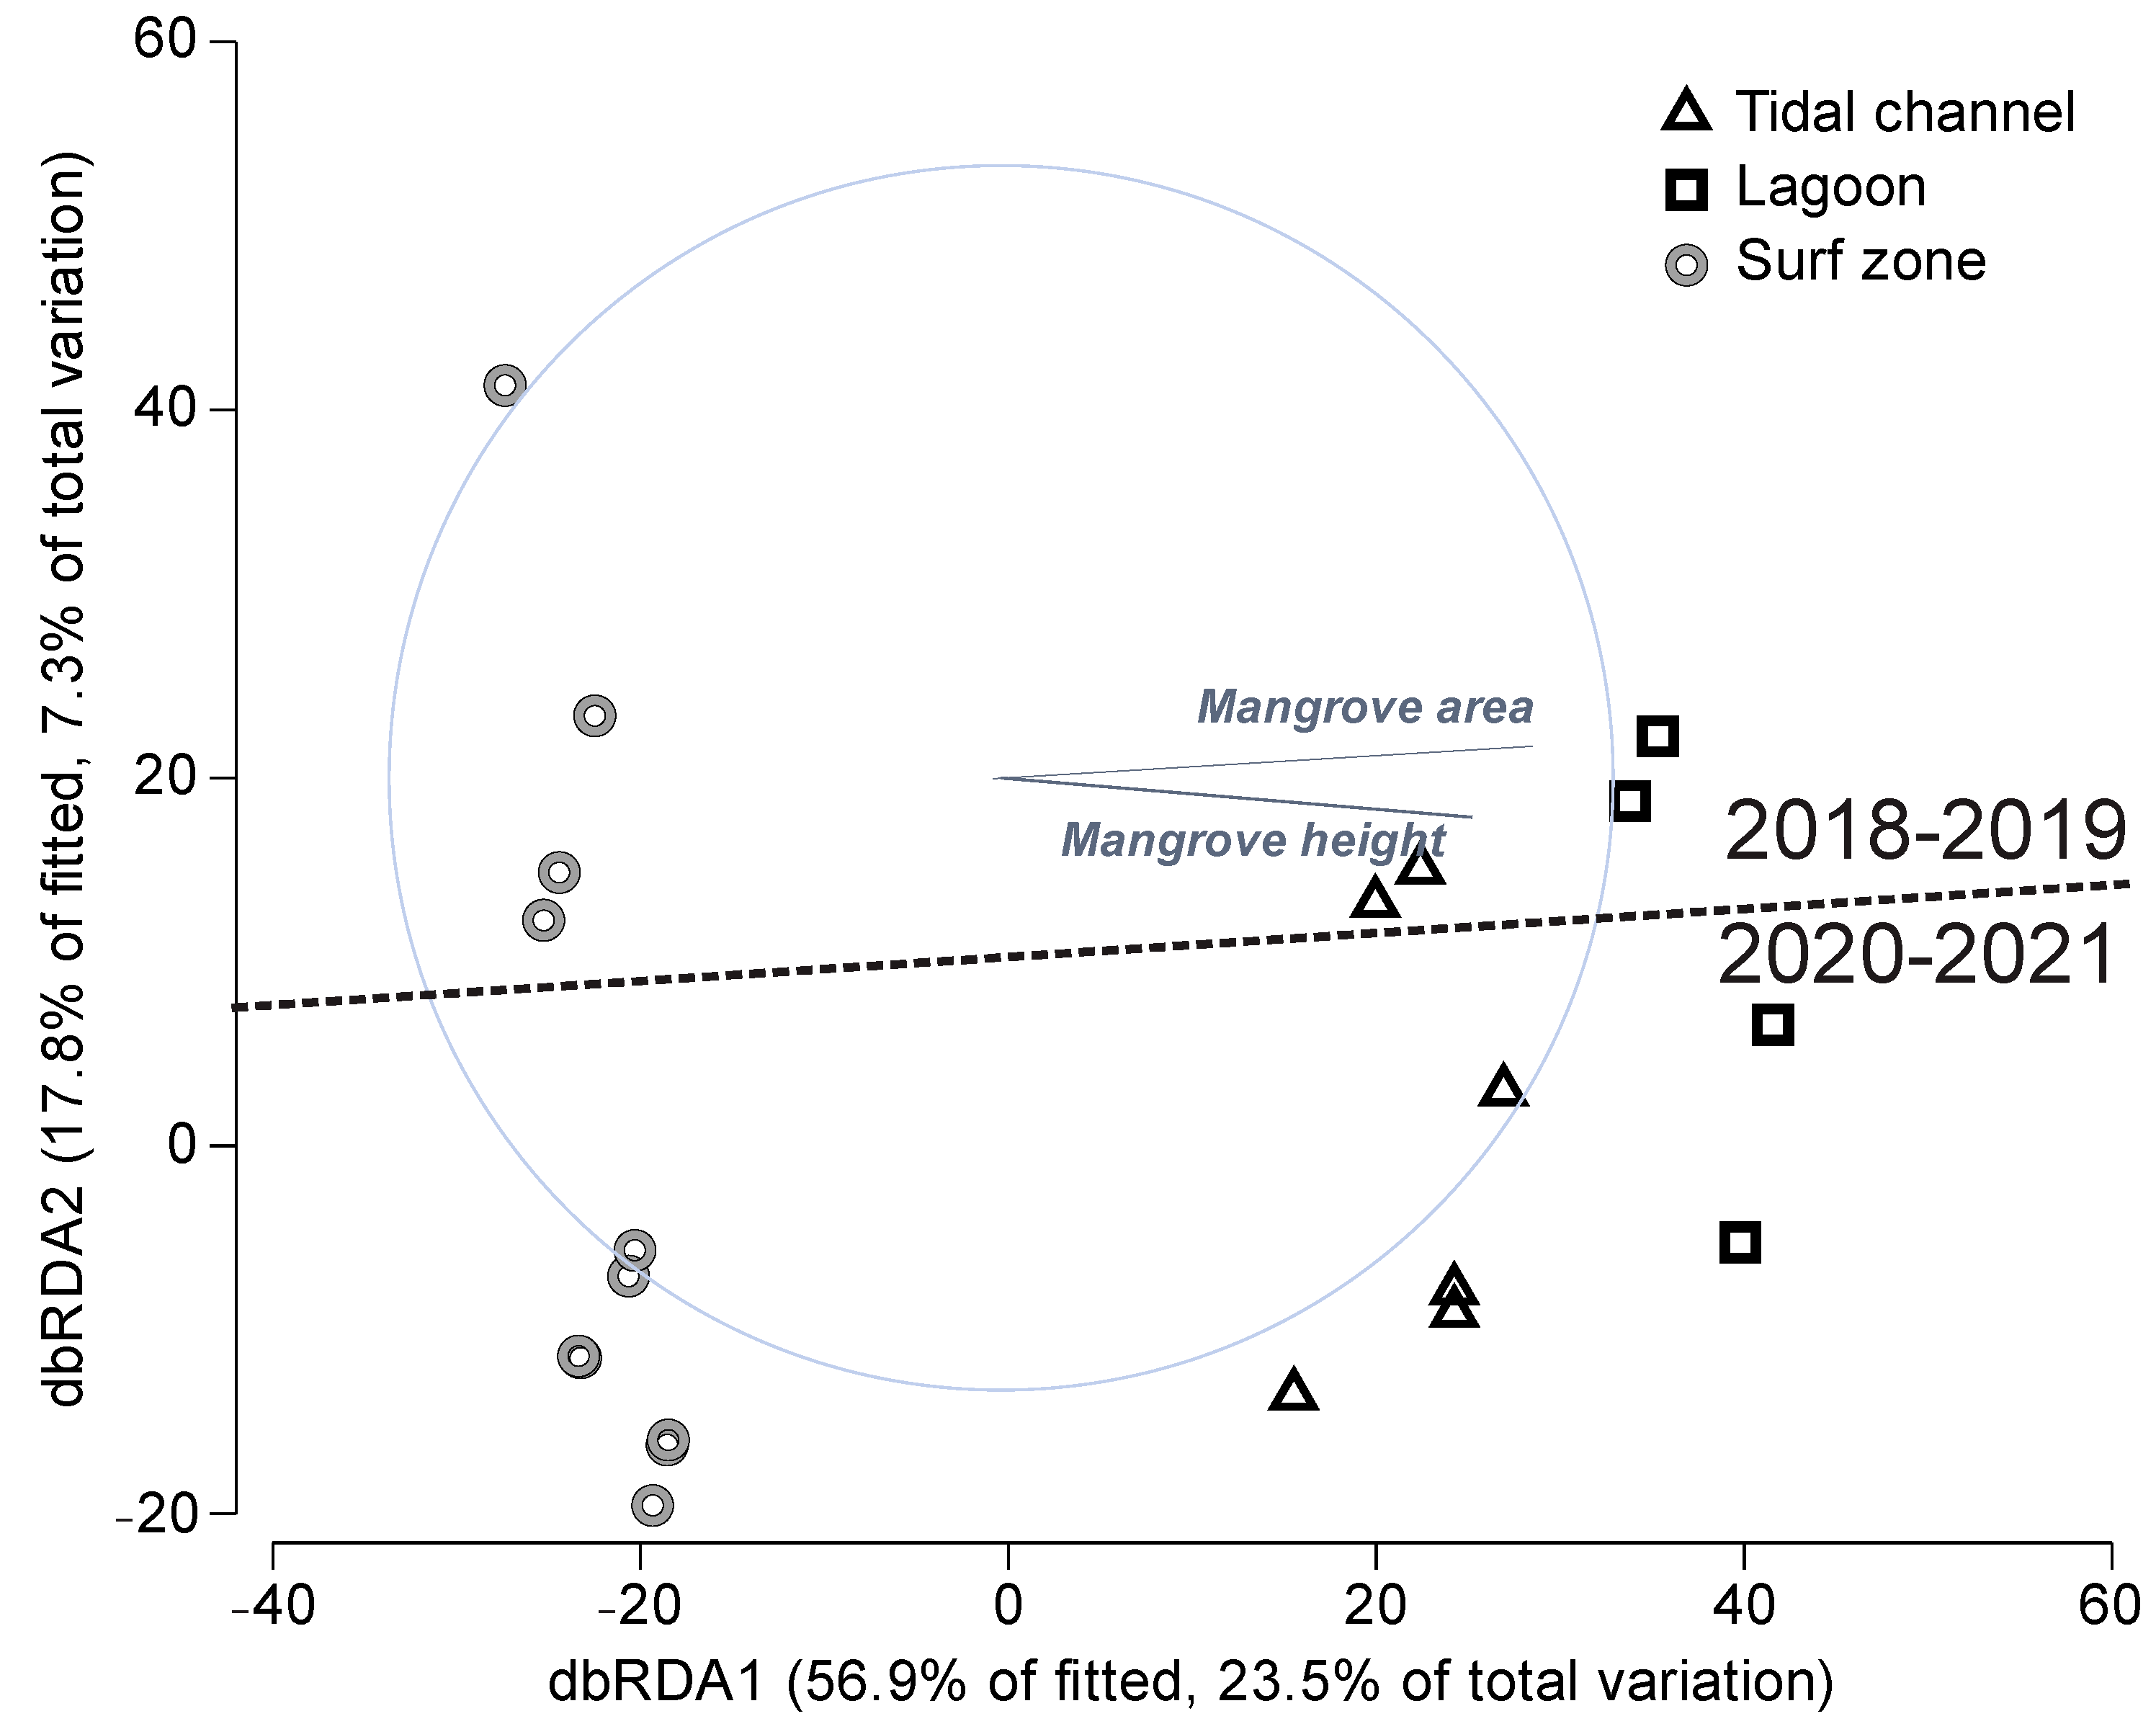
The DistLM marginal test (Supplementary Material Table S2) indicated that mangrove height and area were the most important predictors for fish assemblages’ composition. This pattern was exhibited in the dbRDA plot, which showed a clear aggrupation of fish assemblages according to the factors, explaining 74.7% of the variation. Most of the variation in the fitted model is explained by the horizontal axis (56.9%), which relates to the mangrove height and coverture. The fish assemblages in the estuarine zone were grouped to the right and separated from the sampling stations of the surf zone to the left (Figure 4). The vertical axis explained 17.8% of the variability in the fitted model, and it is related to variables that were not significant in the marginal test, such as salinity, temperature, and total suspended matter. However, these abiotic and biotic variables determined the separation of the fish assemblages on the vertical axis of the graph according to the period before–during the COVID-19 pandemic, which agrees with the significant differences in biomass obtained in PERMANOVA concerning this period (Figure 4).
SIMPER indicated that the Average Dissimilarity (AD) between the estuarine and surf zones was 68.34%. But when analyzing specific regions, this number changed considerably; the AD between the surf zone and the tidal channel was 0.49%, and between the surf zone and the lagoon zone was 88.8%. The fish species contributing prominently to the aggrupation of sampling stations of the surf zone were pelagic species such as the California halfbeak H. rosae, the Pacific crevalle jack C. caninus, the pompano T. paitensis, and the bobo P. aproximans. For the estuarine zone, fish species from benthopelagic and demersal habitats such as the striped herring L. stolifera, mullets M. curema, mojarras (E. currani, E. entomelas, E.gracilis.), snappers (L. argentiventris, L. Colorado, and L. novemfasciatus), and the Pacific ladyfish E. affinis, contributed to the separation of these habitats.
Regarding spatiotemporal factors, the AD between the periods before–during COVID-19 was 84.36%. In the surf zone prior to the COVID-19 pandemic, fish species such as the Pacific crevalle jack C. caninus, the bobo P. aproximans, the pompano T. paitensis, and the croaker M. elongatus were representative. In contrast, during pandemic restrictions, the California halfbeak H. rosae, the Pacific crevalle jack C. caninus, and the yellowfin herring P. lutipinnis dominated. In contrast, for the estuarine zones in pre-COVID-19 years, snapper L. Colorado, and mojarras (E. entomelas and G. simillimus) were representative, while the period during COVID-19 restrictions was characterized by the high presence and biomass of mullet (M. curema), striped herring L. stolifera, mojarra E. currani, and Pacific ladyfish E. affinis (Supplementary Material Table S3).
For the α-diversity indicators, no significant differences were found according to the factors analyzed (period, season, and zone) or their interactions. 0D values varied from 3 in the surf zone at the DWS during the COVID-19 pandemic period to 13 in the same period at the estuarine system during the RWS season; however, no significant differences were observed (p > 0.1). 1D also exhibited no significant differences (p > 0.1), with values from 1.4 at the estuarine system at the DWS during the COVID-19 restrictions, to 6.4 in the same system and period, but during the RWS season. 2D showed no significant differences (p > 0.1), but variation in its values, from 1.17 at both zones during the pandemic at the DWS and DCS, to 5.52 at the estuarine system at the RWS during COVID-19 restrictions.
According to the GAM, abiotic (temperature, salinity, and total matter suspended), biotic (mangrove area), temporal (season and period), and spatial (zone) variables affected fish biomass and diversity (Table 2). First, fish biomass was better explained by the variation in water temperature, mangrove area, and the period before–during the COVID-19 pandemic, with deviance explained at 58.3%, but only the former had significant differences. However, the period factor was kept in the model because if removed, the obtained explained deviance was 47.7%, and the factor’s temperature and mangrove extension lost significance. A similar situation occurred with the variables that were not significant in the richness model (Supplementary Material Table S4 and Figure S1).
Second, for species richness (0D), the analysis showed that salinity gradient, season, and zone affected this indicator. Still, only the first was significant, probably due to inter-intra-annual seasonality (Supplementary Material Table S5 and Figure S2). Third, for diversity 1D, the GAM showed that total suspended matter and season (deviance explained 52.4%) affected this indicator, but no statistical differences were found (Supplementary Material Table S6 and Figure S3). Finally, 2D seems better explained by total suspended matter and season, but no statistical differences were found (Supplementary Material Table S7 and Figure S4).
For β-diversity, the nestedness component (species richness differences) and the spatial turnover (species replacement) did not show significant differences between zones (Fβjne (2,17) = 0.159, p > 0.1; Fβjtu (2,17) = 0.757, p > 0.1) or seasons (Fβjne (2,17) = 0.397, p = 0.678; Fβjtu (2,17) = 1.65, p = 0.221). The nestedness component was different according to the period (tβjne (18) = 1.239, p < 0.05), but the spatial turnover during this period was not different (tβjtu (18) = −0.96865, p > 0.1).

4. Discussion

With the emergence of the COVID-19 pandemic, which triggered a decrease in many human activities worldwide, the effect of this event on biodiversity began to be studied [45,46,47]. Our study is the first analysis of changes in fish assemblages in a tropical estuarine system before and during this event in the Tropical Eastern Pacific.

4.1. Environmental Data and Habitat Characteristics

The measurement of physical, biological, and other environmental variables allowed us to identify zones within the studied system and temporal patterns. Within the estuarine system, the lagoon zone is bordered by tall red mangrove areas reduced by contiguous aquaculture ponds [27]. In contrast, the tidal channel is bordered by large areas of short black mangroves. Its reduced height is due to the stress induced by the higher salinity within this area and attributed to the large human settlements nearby [27,47,48]. Outside the system, the surf zone lacks vegetation and has a high connection with the estuarine system due to its location near the inlet.
The seasonal changes are related to the fluctuations in temperature and rain, causing lower temperatures and total suspended matter but high salinity during the DC season, higher total suspended matter and temperature and higher salinity during the DW season, and higher temperatures and total suspended matter, but lower salinities during the RW season. At the beginning of the rainy season, surface runoff of freshwater increases, causing a considerable amount of freshwater to enter the estuary and the ocean, provoking a decrease in salt concentration and an increase in total matter suspended dragged by the rains, while during the dry seasons, the total matter suspended dragged into the system decreases and salinity increases due to the increase in evaporation and the entry of seawater into the system [49,50]. However, the seasonal changes were not important when defining the spatiotemporal changes observed in the studied area, probably due to the shortness of the time series analyzed, which precluded us from finding significant results.
Multivariate results indicated that changes occurred in the total suspended matter, which was lower during the pandemic than before the closure, and the salinity, which was higher during confinement compared to the period before the pandemic. These results point to an effect of the COVID-19 pandemic on these factors. Previous studies have reported that during the anthropause, the levels of total suspended matter and total suspended solids decreased abnormally during confinement on some coasts of the world [51,52,53], thus improving the quality of the water, which is consistent with our research since the total suspended matter was significantly lower during the pandemic period; therefore, we attribute this effect to the probable decrease in wastewater discharges from the industrial, tourist, and fishing sectors into the Urías estuarine system during the contingency.
Concerning the behavior of the salinity and temperature, Shehhi et al., 2021 [54] mention that there was a cooling of 0.5 °C in the average surface temperature of various coastal areas dung the anthropause, while Sala et al., 2022 [55] mention that in this period there were also slightly higher salinities that are attributed to the decrease in wastewater discharges of the tourism sector, which also agrees with our results. Likewise, studies in other oceans have highlighted that as a consequence of the lockdown, the concentrations of nutrients, microplastics, and heavy metals decreased in the studied area [53,54]. Still, in the present study, those parameters were not assessed.
It is necessary to point out that our study period coincides with a change from a weak El Niño event, which occurred before the pandemic (2018–2019), to a moderate La Niña event during 2020–2021 [56]. As such, the observed changes could also be related to these oscillations, as the pre-pandemic years had higher temperatures and higher precipitation as a result of El Niño, which resulted in lower salinities and higher total matter suspended because of the runoff. In contrast, the period during the pandemic lockdown showed lower temperature, as a result of La Niña, and also total suspended matter, but higher salinity, which can be explained by the decrease in the temperature and the rainfall, causing droughts, which in turn increases the salinity and decreases the total matter suspended [56]. Unfortunately, we cannot confidently say whether the changes observed in environmental variables during the pandemic result from a joined effect of climatic variables and confinement since we did not study on a broader time scale where we could better observe these effects. Additionally, during 2021, the environmental variables tended to return to the values they presented before the pandemic, which could not be explained by climatic events, but probably by the reactivation and reopening of some socio-economic activities.

4.2. Fish Assemblages

According to the rarefaction model used, the species found in both the mangrove and surf zone adequately represented the fish species in the habitats analyzed within the system. In terms of species composition and biomass, the estuarine system is mainly inhabited by small pelagics and demersal species [18]; the typical estuarine conditions in this zone seem to favor the presence of estuarine resident species like L. stolifera and other regular visitors of these zones such as Gerreidae and Lujanidae. In contrast, the surf zone was inhabited by typical marine species that use this area as a nursery and refuge, as well as some predators that probably take advantage of the high abundance of juvenile organisms, such as the Pacific needlefish, T. pacificus, and other species of large jacks and pompanos eventually found in this zone.
Multivariate analyses allowed us to determine that the fish assemblage biomass and composition were clearly and significantly different between the estuarine zone, with values higher than the surf zone. The presence of mangrove forests was the variable with the highest effect on the structure and composition of the fish assemblages; the highest variation explained by the dbRDA plot across the horizontal axis indicates the importance of these ecosystems for fish assemblages in semi-arid regions [18]. This result is relevant information considering that an important part of these areas is reduced due to the urban and industrial growth that borders a large part of the lagoon [27]. The presence of mangrove forests also serves as a proxy for the hydrological regime and salinity variations, which are typical of estuarine conditions and favor the presence of certain fish species [18]. In contrast, the surf zone is a typical marine area influenced by the Urías estuarine system, but that is also used as a nursery and refuge zone by juvenile marine fish species, as the presence of waves creates conditions favorable to the early life stages of typical marine fish [57].
The other important variable for the observed grouping of fish assemblages was the temporary effect of the years prior to and during the COVID-19 pandemic. Some studies have indicated an increase in fish density and diversity as a consequence of the lockdown resulting from the COVID-19 pandemic [53,58]. Although changes in the fishing assemblages were evident, the mean abundances did not change significantly from one period to another, as neither changed the mean diversity values estimated using the Hill numbers. In contrast, the GAM indicated that the environmental parameters and their interactions determined the spatiotemporal variation of the fish assemblages; therefore, we tried to rescue the simplest models that best explained the variation in biomass and α diversity, which agreed with the results of the multivariate analyses contemplating the area of mangroves and period during–before COVID-19 as an important predictor of biomass, while the most important factors in defining diversity α of fish assemblages were temperature, salinity, total suspended matter, and season. According to the β-diversity, differences were only found in nestedness component (species richness differences) between the period before–during COVID-19.
At the beginning of the pandemic, there was a rapid change in the composition of fish species, but no significant changes in diversity or biomass were observed in this period. The carnivorous/omnivorous species that dominated before the pandemic were replaced by planktivorous species with a higher presence during the confinement. This observation coincided with the drastic reduction in human activities, as tourism was completely stopped and small-scale fishing was reduced; therefore, maritime traffic decreased, diminishing the pollution. However, these changes coincided with climatic fluctuations caused by El Niño Southern Oscillation (ENSO) as a change from La Niña to El Niño conditions. This climatic phenomenon was likely the case for the observed differences in environmental variables, and this has previously been discussed elsewhere [59,60].
As this study was not initially aimed to perform a comparison of fish assemblage’s structure and composition under these scenarios, it is not possible to ascertain the reason for these observed changes. For one part, it is known that some fish species can be more sensitive to noise from boats moving away from this type of disturbance, making it more difficult to fish or sight them; consequently, in the absence of noise, many fish return to occupy different micro-ecosystems within the estuary [58], which allows redistribution of species and their biomass. The higher presence of species that were not common before the confinement, and a decrease in the presence of species that dominated before the COVID-19 pandemic, could be a consequence. But for the other part, the climatic changes could also be responsible for these observed changes in fish assemblage structure and composition.
Previous studies have documented that the species composition, biomass, and diversity of estuarine fish have strong relationships with different environmental factors, especially temperature and salinity [61,62,63]. Results from this study confirm the importance of salinity, temperature, and total suspended matter in defining the composition of fish assemblages, as these factors could act as a physiological barrier that can shape the structure of fish assemblages [7,64,65,66], and these factors changed from one period to another. The observed changes in the structure of fish assemblages and the diversity may be a combined response of climatic changes and confinement, as it seems that the climatic effects were exacerbated by either an increment or decrement in human activities. So, although the changes in environmental variables have a delayed effect [67,68], human activities could cause these changes to be observed in shorter periods.
In conclusion, it is likely that the observed changes in the structure, composition, and diversity of fish assemblages, together with the changes in environmental variables before and during the COVID-19 pandemic, were related to the decrease in human activities as a consequence of the lockdown together with the climatic effects. This change indicates that fish assemblages respond to the surrounding environment in terms of habitat structure, including the vegetation and specific seasonal water conditions, but also respond to short- and medium-term changes in water quality due to human and climatic events. These results are relevant because they indicate the importance of human activities in shaping fish assemblages and how these could affect local fisheries, as these systems represent the livelihood for many small-scale fishers that depend on these ecosystems. Further studies would be convenient with larger time series in the area to know the true impact of climatic effects on fish communities in the studied area, as well as studies analyzing the concentration of pollutants prior to, during, and after the COVID-19 pandemic. However, this first approach provided an insight into the complexity of the studies in tropical estuarine systems, considering also human and climatic interactions.

Supplementary Materials

The following supporting information can be downloaded at: https://www.mdpi.com/article/10.3390/d15080934/s1.

Author Contributions

Conceptualization, Y.H.-Á., F.A., G.R.-O., F.F.-d.-S., V.M.-T. and D.A.-C.; methodology, Y.H.-Á., F.A., F.F.-d.-S., G.R.-O. and D.A.-C.; software, Y.H.-Á., F.A., F.F.-d.-S. and G.R.-O.; validation, F.A., F.F.-d.-S. and G.R.-O.; formal analysis, Y.H.-Á., F.A., F.F.-d.-S., F.A.-L. and G.R.-O.; investigation, Y.H.-Á., F.A., F.F.-d.-S. and F.A.-L.; resources, V.M.-T., F.A.-L., Y.H.-Á. and F.A.; data curation, F.A., G.R.-O., F.F.-d.-S. and Y.H.-Á.; writing—original draft preparation, F.A., G.R.-O., F.F.-d.-S. and Y.H.-Á.; writing—review and editing, V.M.-T., F.A., G.R.-O., F.F.-d.-S., F.A.-L., Y.H.-Á. and D.A.-C.; visualization, V.M.-T., F.A., G.R.-O., F.F.-d.-S., F.A.-L., D.A.-C. and Y.H.-Á.; supervision, F.A., G.R.-O., F.A.-L. and F.F.-d.-S.; project administration, F.A., F.F.-d.-S., F.A.-L. and G.R.-O.; funding acquisition, F.A.-L., F.A., V.M.-T. and F.F.-d.-S. All authors have read and agreed to the published version of the manuscript.

Funding

The National Autonomous University of México (UNAM), through the Institute of Marine Sciences and Limnology (ICMyL) funded the sapling program and laboratory research and analysis through the COVID-19 research grant and paid the processing charge fee for this article.

Institutional Review Board Statement

The study was conducted in accordance with the Ethics Code of the National Autonomous University of Mexico, and all the samples were legally obtained from fishers with the appropriate fishing permits issued by the National Commission for Fisheries and Aquaculture.

Data Availability Statement

Data supporting the reported results can be found at https://www.icmyl.unam.mx/uninmar/ (accessed on 29 May 2023).

Acknowledgments

We thank R. Cruz-García for his help processing the samples and sorting the database, C. Suárez for editing the figures, and all the fishers that participated in the sampling program for their help obtaining the fish samples and environmental data.

Conflicts of Interest

The authors declare no conflict of interest.

References

  1. Junk, W.J.; Brown, M.; Campbell, I.C.; Finlayson, M.; Gopal, B.; Ramberg, L.; Warner, B.G. The Comparative Biodiversity of Seven Globally Important Wetlands: A Synthesis. Aquat. Sci. 2006, 68, 400–414. [Google Scholar] [CrossRef]
  2. Tockner, K.; Stanford, J.A. Riverine Flood Plains: Present State and Future Trends. Environ. Conserv. 2002, 29, 308–330. [Google Scholar] [CrossRef]
  3. Junk, W.J.; Wantzen, K.M. The Flood Pulse Concept: New Aspects, Approaches and Applications-an Update. In Proceedings of the Second International Symposium on the Management of Large Rivers for Fisheries, Food and Agriculture Organization and Mekong River Commission, FAO Regional. Phnom Penh, Kingdom of Cambodia, 11–14 February 2004; pp. 117–149. [Google Scholar]
  4. Welcomme, R.L. Inland Fisheries: Ecology and Management. Food and Agriculture Organisation of the United Nations; Blackwell Science: Rome, Italy, 2001. [Google Scholar]
  5. Chu, C.; Minns, C.K.; Lester, N.P.; Mandrak, N.E. An Updated Assessment of Human Activities, the Environment, and Freshwater Fish Biodiversity in Canada. Can. J. Fish. Aquat. Sci. 2014, 72, 135–148. [Google Scholar] [CrossRef]
  6. Lara-Lara, R.; Arreola-Lizarraga, J.; Calderon-Aguilera, L.; Camacho-Ibar, V.; Lanza-Espino, D.L.G.; Escofet-Giansone, A.; Espejel, I.; Guzmán-Arroyo, M.; Ladah, L.; López-Hernández, M.; et al. Los Ecosistemas Costeros, Insulares y Epicontinentales. J. Comp. Capital. Nat. México 2008, 1, 109–134. [Google Scholar]
  7. Chaudhuri, A.; Mukherjee, S.; Homechaudhuri, S. Dinámica Estacional de Comunidades de Peces En Una Marisma Intermareal de Sundarbans Indio. Sci. Mar. 2013, 77, 301–311. [Google Scholar] [CrossRef]
  8. Newton, A.; Brito, A.C.; Icely, J.D.; Derolez, V.; Clara, I.; Angus, S.; Schernewski, G.; Inácio, M.; Lillebø, A.I.; Sousa, A.I.; et al. Assessing, Quantifying and Valuing the Ecosystem Services of Coastal Lagoons. J. Nat. Conserv. 2018, 44, 50–65. [Google Scholar] [CrossRef]
  9. Sreekanth, G.B.; Jaiswar, A.K.; Zacharia, P.U.; Pazhayamadom, D.G.; Chakraborty, S.K. Effect of Environment on Spatio-Temporal Structuring of Fish Assemblages in a Monsoon-Influenced Tropical Estuary. Environ. Monit. Assess. 2019, 191, 1–27. [Google Scholar] [CrossRef]
  10. Anthony, A.; Atwood, J.; August, P.; Byron, C.; Cobb, S.; Foster, C.; Fry, C.; Gold, A.; Hagos, K.; Heffner, L. Coastal Lagoons and Climate Change: Ecological and Social Ramifications in US Atlantic and Gulf Coast Ecosystems. Ecol. Soc. 2009, 14, 8. [Google Scholar] [CrossRef]
  11. Bayley, P.B. Understanding Large River: Floodplain Ecosystems. Bioscience 1995, 45, 153–158. [Google Scholar] [CrossRef]
  12. Chaudhuri, P.; Bhattacharyya, S. Impact of COVID-19 Lockdown on the Socioenvironmental Scenario of Indian Sundarban. In Environmental Resilience and Transformation in Times of COVID-19: Climate Change Effects on Environmental Functionality; Elsevier: Amsterdam, The Netherlands, 2021; pp. 25–36. [Google Scholar] [CrossRef]
  13. Zambrano-Monserrate, M.A.; Ruano, M.A.; Sanchez-Alcalde, L. Indirect Effects of COVID-19 on the Environment. Sci. Total Environ. 2020, 728, 138813. [Google Scholar] [CrossRef]
  14. World Health Organization Archived: WHO Timeline—COVID-19. Available online: https://www.who.int/news/item/27-04-2020-who-timeline—COVID-19 (accessed on 27 August 2022).
  15. Arora, S.; Bhaukhandi, K.D.; Mishra, P.K. Coronavirus Lockdown Helped the Environment to Bounce Back. Sci. Total Environ. 2020, 742, 140573. [Google Scholar] [CrossRef]
  16. Mallik, A.; Chakraborty, P.; Bhushan, S.; Nayak, B.B. Impact of COVID-19 Lockdown on Aquatic Environment and Fishing Community: Boon or Bane? Mar. Policy 2022, 141, 105088. [Google Scholar] [CrossRef] [PubMed]
  17. Saadat, S.; Rawtani, D.; Hussain, C.M. Environmental Perspective of COVID-19. Sci. Total Environ. 2020, 728, 138870. [Google Scholar] [CrossRef] [PubMed]
  18. Amezcua, F.; Ramirez, M.; Flores-Verdugo, F. Classification and Comparison of Five Estuaries in the Southeast Gulf of California Based on Environmental Variables and Fish Assemblages. Bull. Mar. Sci. 2019, 95, 139–159. [Google Scholar] [CrossRef]
  19. Bennett, N.J.; Finkbeiner, E.M.; Ban, N.C.; Belhabib, D.; Jupiter, S.D.; Kittinger, J.N.; Mangubhai, S.; Scholtens, J.; Gill, D.; Christie, P. The COVID-19 Pandemic, Small-Scale Fisheries and Coastal Fishing Communities. Coast. Manag. 2020, 48, 336–347. [Google Scholar] [CrossRef]
  20. Peces y Mariscos Comerciales | Biodiversidad Mexicana. Available online: https://www.biodiversidad.gob.mx/diversidad/alimentos/peces (accessed on 3 May 2023).
  21. Sbarbati, P. Impacto de la Pandemia de Enfermedad Por Coronavirus (COVID-19) en la Industria del Turismo de Cruceros en el Gran Caribe; Documentos de Proyectos(LC/TS.2022/66); Comisión Económica para América Latina y el Caribe (CEPAL): Santiago, Chile, 2022. [Google Scholar]
  22. Eliana, P.; Barleta; Ricardo, J. Sánchez Informe Portuario 2020: El Impacto de La Pandemia Del COVID-19 en El Comercio Marítimo, Transbordo y Throughput de Los Puertos de Contenedores de América Latina y El Caribe. Available online: https://perfil.cepal.org/l/es/pub/2020_ES.pdf (accessed on 22 May 2023).
  23. Amezcua-Linares, F. Peces Demersales Del Pacífico de México; Instituto de Ciencias del Mar y Limnología, Universidad Nacional Autónoma de México: Ciudad de México, Mexico, 2009; ISBN 978-970-764-558-5. [Google Scholar]
  24. Roy, P.S.; Williams, R.J.; Jones, A.R.; Yassini, I.; Gibbs, P.J.; Coates, B.; West, R.J.; Scanes, P.R.; Hudson, J.P.; Nichol, S. Structure and Function of South-East Australian Estuaries. Estuar. Coast. Shelf Sci. 2001, 53, 351–384. [Google Scholar] [CrossRef]
  25. Valderrama-Landeros, L.; Flores-Verdugo, F.; Rodríguez-Sobreyra, R.; Kovacs, J.M.; Flores-de-Santiago, F. Extrapolating Canopy Phenology Information Using Sentinel-2 Data and the Google Earth Engine Platform to Identify the Optimal Dates for Remotely Sensed Image Acquisition of Semiarid Mangroves. J. Environ. Manag. 2021, 279, 111617. [Google Scholar] [CrossRef]
  26. Amezcua, F. Introduction on Managing Fisheries in Estuarine Systems of Mexico and Central America. In Fisheries Management of Mexican and Central American Estuaries; Amezcua, F., Bellgraph, B., Eds.; Springer: Dordrecht, The Netherlands, 2014; pp. 1–28. ISBN 978-94-017-8916-5. [Google Scholar]
  27. Vasavilbazo Saucedo, A.; Covantes Rodríguez, C. Construcción Social de Inostenibilidad En El Estero de Urías, Mazatlán, Sinaloa, 1st ed.; Universidad Autónoma de Sinaloa: Mazatlán, Mexico, 2012; ISBN 9780415475976. [Google Scholar]
  28. Fischer, W.; Krupp, F.; Schneider, W.; Sommer, C.; Carpenter, K.; Niem, V. Guía FAO Para La Identificación de Especies Para Los Fines de La Pesca, Pacífico Centro-Oriental; FAO: Rome, Italy, 1995; ISBN 92-5-303408-4. [Google Scholar]
  29. Mishra, D.R.; Kumar, A.; Muduli, P.R.; Acharyya, T.; Acharya, P.; Singh, S.; Rastogi, G. Landfall Season Is Critical to the Impact of a Cyclone on a Monsoon-Regulated Tropical Coastal Lagoon. Sci. Total Environ. 2021, 770, 145235. [Google Scholar] [CrossRef]
  30. Anderson, M.J.; Gorley, R.N.; Clarke, K.R. Primer + for Permanova: Guide to Software and Statistical Methods. 214; Primer-e: Plymouth, UK, 2008. [Google Scholar]
  31. Anderson, M.J. Permutational Multivariate Analysis of Variance (PERMANOVA). Wiley StatsRef: Stat. Ref. Online 2017, 1, 1–15. [Google Scholar] [CrossRef]
  32. Tolimieri, N.; Holmes, E.E.; Williams, G.D.; Pacunski, R.; Lowry, D. Population Assessment Using Multivariate Time-Series Analysis: A Case Study of Rockfishes in Puget Sound. Ecol. Evol. 2017, 7, 2846–2860. [Google Scholar] [CrossRef]
  33. Chao, A. Nonparametric Estimation of the Number of Classes in a Population. Scand. J. Stat. 1984, 11, 265–270. [Google Scholar]
  34. Magurran, A.E. Measuring Biological Diversity, 1st ed.; Blakwell Publishing: Oxford, UK, 2004; ISBN 0-632-05633-9. [Google Scholar]
  35. Collins, N.R.; Williams, R. Zooplankton Communities in the Bristol Channel and Severn Estuary. Mar. Ecol. Prog. Ser. 1982, 9, 1–11. [Google Scholar] [CrossRef]
  36. Clarke, K.R.; Warwick, R.M. Similarity-Based Testing for Community Pattern: The Two-Way Layout with No Replication. Mar. Biol. 1994, 118, 167–176. [Google Scholar] [CrossRef]
  37. Jost, L. Partitioning Diversity into Independent Alpha and Beta Components. Ecology 2007, 88, 2427–2439. [Google Scholar] [CrossRef]
  38. Chao, A.; Chiu, C.-H.; Hsieh, T.C. Proposing a Resolution to Debates on Diversity Partitioning. Ecology 2012, 93, 2037–2051. [Google Scholar] [CrossRef]
  39. Jost, L. Entropy and Diversity. Oikos 2006, 113, 363–375. [Google Scholar] [CrossRef]
  40. Jaccard, P. The Distribution of The Flora in The Alpine Zone.1. New Phytol. 1912, 11, 37–50. [Google Scholar] [CrossRef]
  41. Clarke, K.R.; Warwick, R.M. Change in Marine Communities: An Approach to Statistical Analysis and Interpretation, 2nd ed.; Plumouth Marine Laboratory, Ed.; Plymouth Marine Laboratory: Plymouth, UK, 2001; ISBN 1855311402, 9781855311404. [Google Scholar]
  42. Dray, S.; Blanchet, G.; Borcard, D.; Clappe, S.; Guenard, G.; Jombart, T.; Larocque, G.; Legendre, P.; Madi, N.; Wagner, H.H. Package “Adespatial”. R Package Version 2018, 82, 3–8. [Google Scholar]
  43. Baselga, A. Partitioning the Turnover and Nestedness Components of Beta Diversity. Glob. Ecol. Biogeogr. 2010, 19, 134–143. [Google Scholar] [CrossRef]
  44. Team, R.C. R: A Language and Environment for Statistical Computing. R Foundation for Statistical Computing Website. Available online: https://www.r-project.org/ (accessed on 12 May 2022).
  45. Bates, A.E.; Primack, R.B.; Biggar, B.S.; Bird, T.J.; Clinton, M.E.; Command, R.J.; Richards, C.; Shellard, M.; Geraldi, N.R.; Vergara, V.; et al. Global COVID-19 Lockdown Highlights Humans as Both Threats and Custodians of the Environment. Biol. Conserv. 2021, 263, 109175. [Google Scholar] [CrossRef]
  46. Gilby, B.L.; Henderson, C.J.; Olds, A.D.; Ballantyne, J.A.; Bingham, E.L.; Elliott, B.B.; Jones, T.R.; Kimber, O.; Mosman, J.D.; Schlacher, T.A. Potentially Negative Ecological Consequences of Animal Redistribution on Beaches during COVID-19 Lockdown. Biol. Conserv. 2021, 253, 108926. [Google Scholar] [CrossRef]
  47. Sánchez-Rodríguez, M.A.; Calvario-Martínez, O. Evaluación Espacial y Estacional Del Estado Trófico En El Sistema Estuarino Urías, Mazatlán, México. Ideas Cienc. Ing. 2019, 1, 9–26. [Google Scholar]
  48. Zúñiga-Zataráin, C.R. Capacidad de Carga del Estero de Urías; Sinaloa POR: Mazatlán, Mexico, 2011; p. 167. [Google Scholar]
  49. Serrano, D.; Valle-Levinson, A. Effects of River Discharge and the California Current on Pycnocline Depth at the Eastern Entrance to the Gulf of California. Cont. Shelf Res. 2021, 215, 104356. [Google Scholar] [CrossRef]
  50. Paez-Ozuna, F.; Montaño-Ley, Y.; Bojorquez-Leyva, H. Intercambio de Agua, Fosforo y Material Suspendido Entre El Sistema Lagunar Del Puerto de Mazatlán y Las Aguas Costeras Adyacentes. Rev. Int. Contam. Ambient. 2010, 6, 19–32. [Google Scholar]
  51. Jayaram, C.; Roy, R.; Chacko, N.; Swain, D.; Punnana, R.; Bandyopadhyay, S.; Choudhury, S.B.; Dutta, D. Anomalous Reduction of the Total Suspended Matter During the COVID-19 Lockdown in the Hooghly Estuarine System. Front. Mar. Sci. 2021, 8, 454. [Google Scholar] [CrossRef]
  52. Azidane, H.; Primadona, N.P.; Boko, M.; Elbouhaddioui, M.; Magrane, B. Impacts of COVID-19 Lockdowns on Water Quality along the Coast of Morocco. Water Pract. Technol. 2023, 18, 901–910. [Google Scholar] [CrossRef]
  53. Patterson Edward, J.K.; Jayanthi, M.; Malleshappa, H.; Immaculate Jeyasanta, K.; Laju, R.L.; Patterson, J.; Diraviya Raj, K.; Mathews, G.; Marimuthu, A.S.; Grimsditch, G. COVID-19 Lockdown Improved the Health of Coastal Environment and Enhanced the Population of Reef-Fish. Mar. Pollut. Bull. 2021, 165, 112124. [Google Scholar] [CrossRef]
  54. Al Shehhi, M.R.; Abdul Samad, Y. Effects of the COVID-19 Pandemic on the Oceans. Remote Sens. Lett. 2021, 12, 325–334. [Google Scholar] [CrossRef]
  55. Sala, M.M.; Peters, F.; Sebastián, M.; Cardelús, C.; Calvo, E.; Marrasé, C.; Massana, R.; Pelejero, C.; Sala-Coromina, J.; Vaqué, D.; et al. COVID-19 Lockdown Moderately Increased Oligotrophy at a Marine Coastal Site. Sci. Total Environ. 2022, 812, 151443. [Google Scholar] [CrossRef]
  56. Center, N.C.P. NOAA’s Climate Prediction Center. Available online: https://origin.cpc.ncep.noaa.gov/products/analysis_monitoring/ensostuff/ONI_v5.php (accessed on 21 October 2022).
  57. Ayvazian, S.G.; Hyndes, G.A. Surf-Zone Fish Assemblages in South-Western Australia: Do Adjacent Nearshore Habitats and the Warm Leeuwin Current Influence the Characteristics of the Fish Fauna? Mar. Biol. 1995, 122, 527–536. [Google Scholar] [CrossRef]
  58. Olán-González, M.; Reyes-Bonilla, H.; Arreola-Alarcon, I.M.; Uribe, R.V.; Olivier, D. COVID-19 Lockdown Reveals Fish Density May Be Much Higher in Marine Reserves. bioRxiv 2022, 492376. [Google Scholar] [CrossRef]
  59. Funes-Rodríguez, R.; Zárate-Villafranco, A.; Hinojosa-Medina, A.; González-Armas, R.; Hernández-Trujillo, S. Mesopelagic Fish Larval Assemblages during El Niño-Southern Oscillation (1997–2001) in the Southern Part of the California Current. Fish. Oceanogr. 2011, 20, 329–346. [Google Scholar] [CrossRef]
  60. Andreotti, G.F.; Alves, J.C.; Alves, D.C.; Agostinho, A.A.; Gomes, L.C. The Response of Fish Functional Diversity to the El Niño Southern Oscillation (ENSO) in a Neotropical Floodplain. Hydrobiologia 2021, 848, 1207–1218. [Google Scholar] [CrossRef]
  61. Pittman, S.; Mcalpine, C.; Pittman, K. Linking Fish and Prawns to Their Environment: A Hierarchical Landscape Approach. Mar. Ecol. Prog. Ser. 2004, 283, 233–254. [Google Scholar] [CrossRef]
  62. Pittman, S. Linking Fish and Prawns to Their Environment in Shallow Water-Marine Landscapes; University of Oxford: Oxford, UK, 2003. [Google Scholar]
  63. Whitfield, A.K.; Pattrick, P. Habitat Type and Nursery Function for Coastal Marine Fish Species, with Emphasis on the Eastern Cape Region, South Africa. Estuar. Coast. Shelf Sci. 2015, 160, 49–59. [Google Scholar] [CrossRef]
  64. Barletta, M.; Barletta-Bergan, A.; Saint-Paul, U.; Hubold, G. The Role of Salinity in Structuring the Fish Assemblages in a Tropical Estuary. J. Fish. Biol. 2005, 66, 45–72. [Google Scholar] [CrossRef]
  65. Vega-Cendejas, M.E.; Hernández De Santillana, M. Fish Community Structure and Dynamics in a Coastal Hypersaline Lagoon: Rio Lagartos, Yucatan, Mexico. Estuar. Coast. Shelf Sci. 2004, 60, 285–299. [Google Scholar] [CrossRef]
  66. Faunce, C.H.; Serafy, J.E.; Lorenz, J.J. Density-Habitat Relationships of Mangrove Creek Fishes within the Southeastern Saline Everglades (USA), with Reference to Managed Freshwater Releases. Wetl. Ecol. Manag. 2004, 12, 377–394. [Google Scholar] [CrossRef]
  67. Moraes, L.E.; Paes, E.; Garcia, A.; Möller, O.; Vieira, J. Delayed Response of Fish Abundance to Environmental Changes: A Novel Multivariate Time-Lag Approach. Mar. Ecol. Prog. Ser. 2012, 456, 159–168. [Google Scholar] [CrossRef]
  68. Hofmann, E.E.; Powell, T.M. Environmental Effects-Marine Fisheries S23 Environmental Variability Effects ON Marine Fisheries: Four Case Histories. Ecol. Appl. 1998, 8, 23–32. [Google Scholar] [CrossRef]
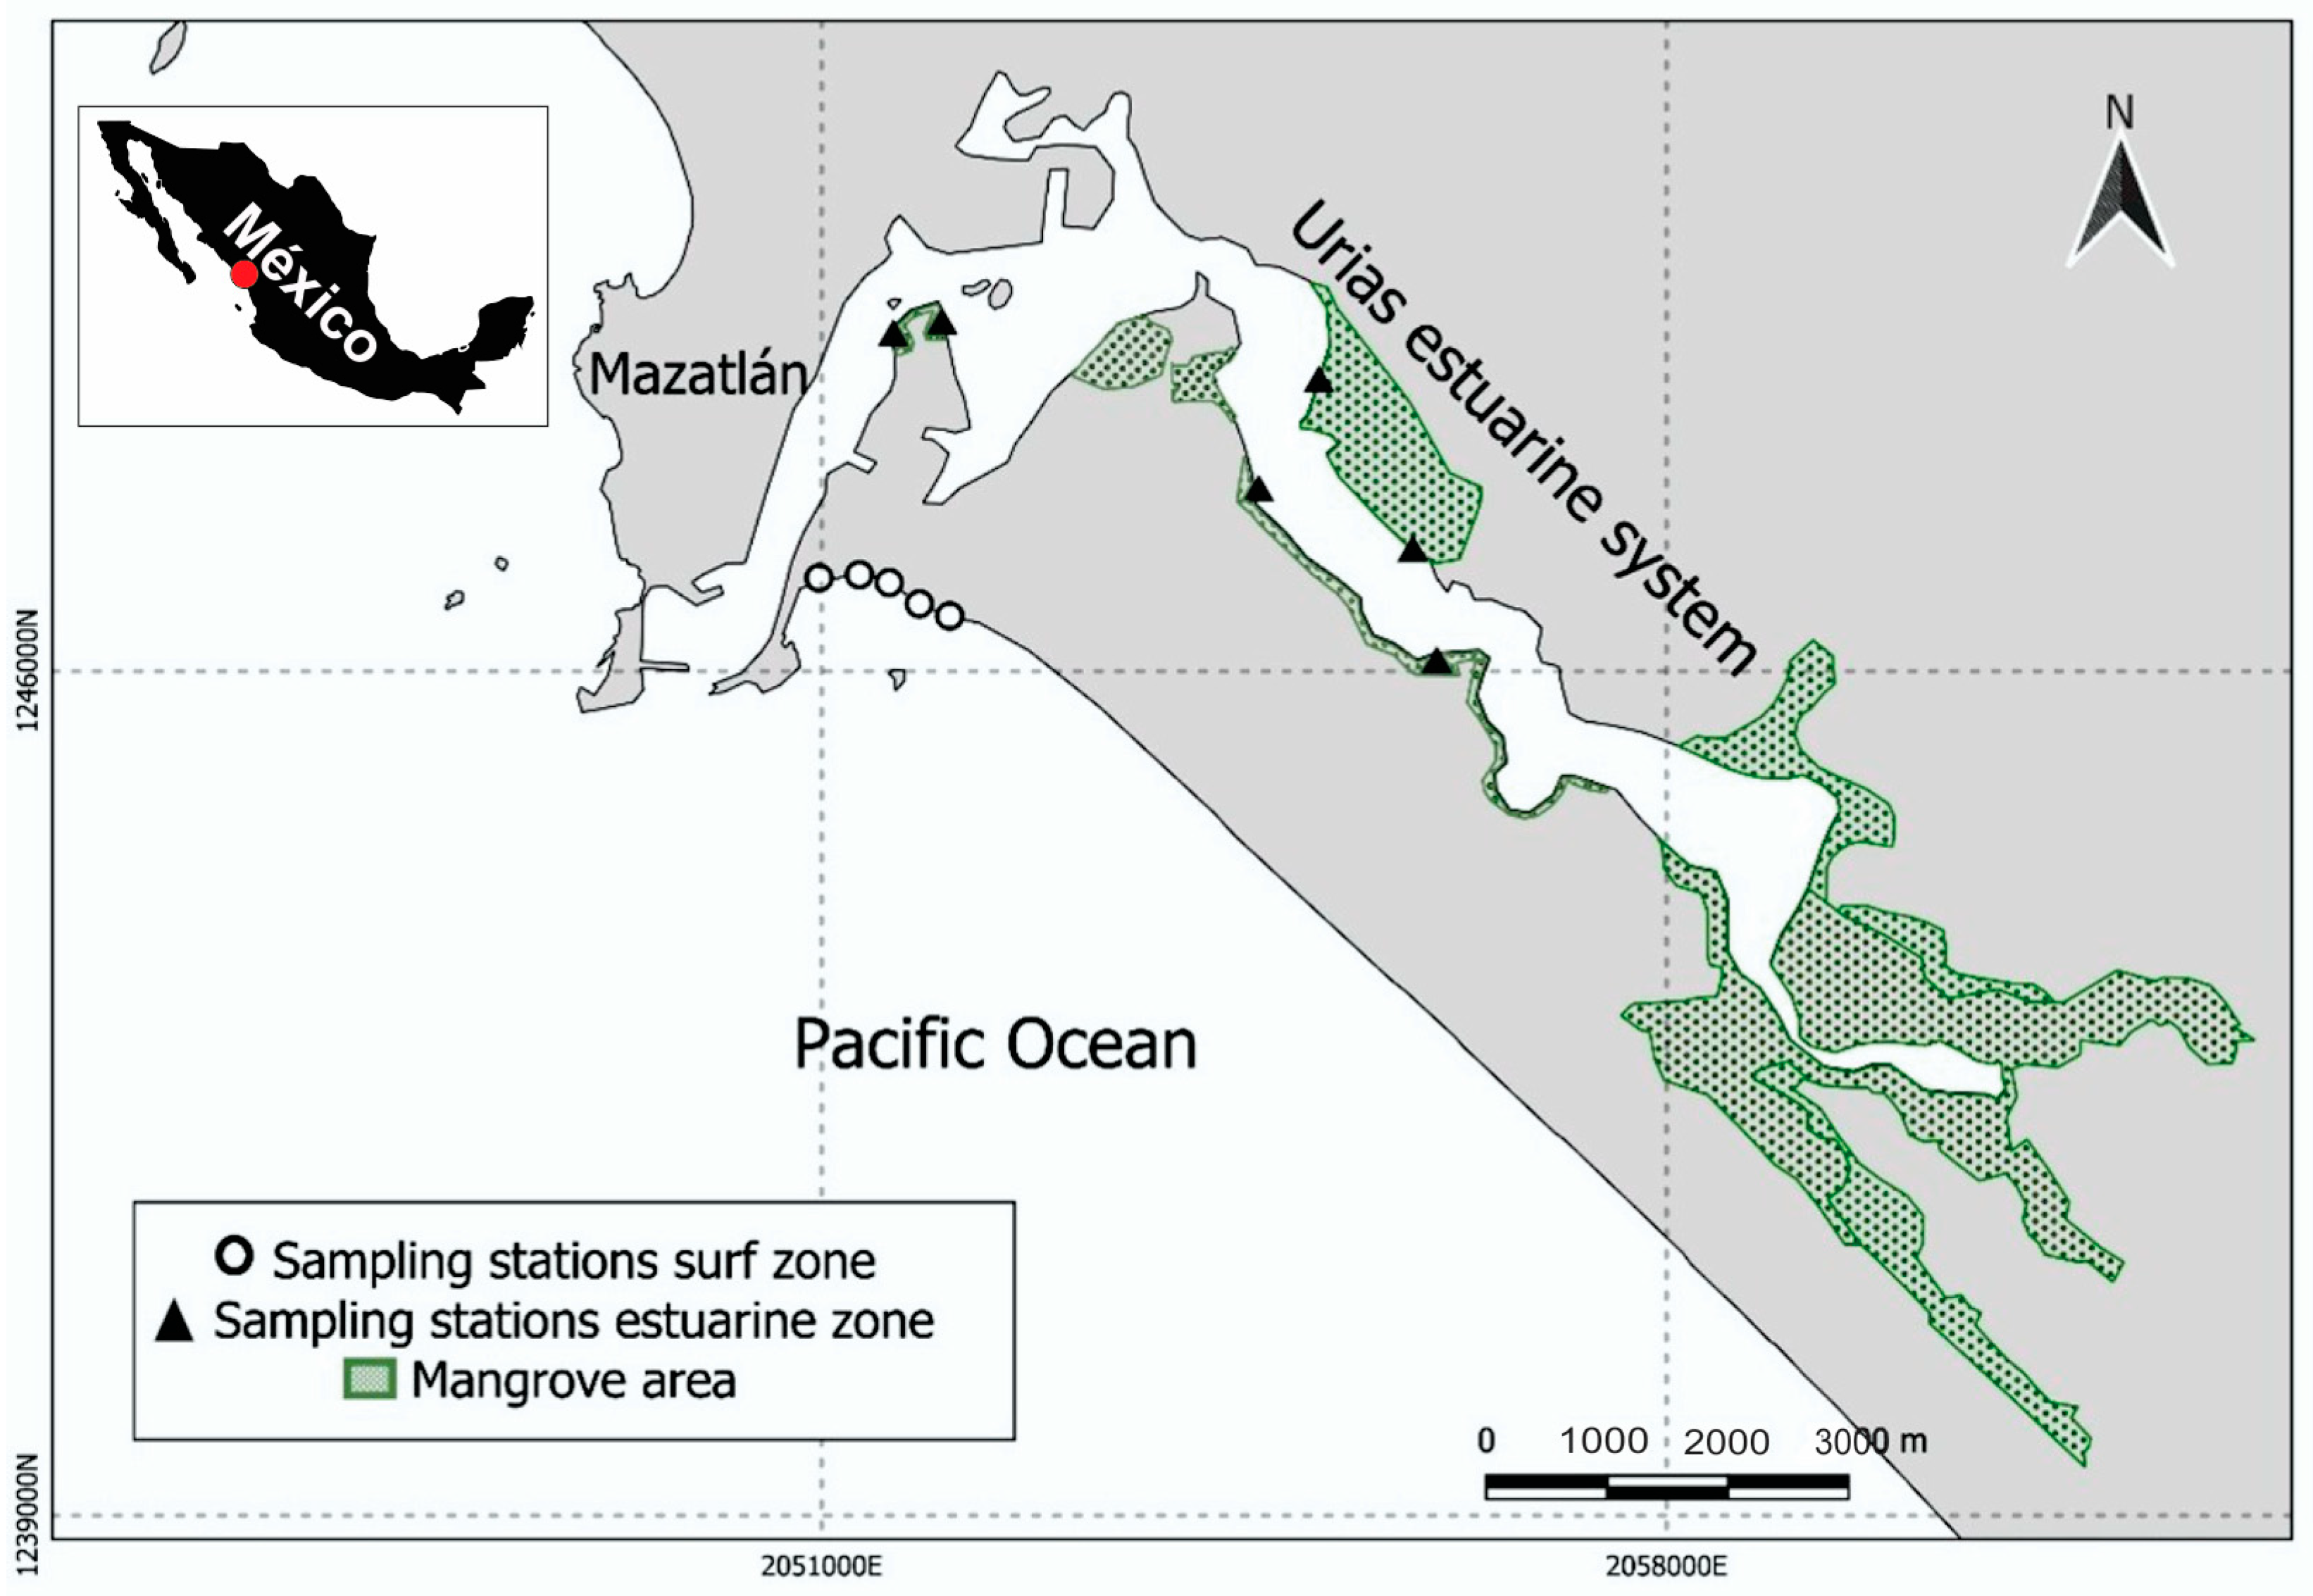
Figure 1. Urías estuarine system (red dot) in the Mexican North Pacific. White circles and blacktriangles indicate the sampling stations at the studied zones.
Diversity 15 00934 g001
Figure 2. Principal coordinate analysis (PCoA) plot showing relationships between environmental and spatiotemporal variables.
Diversity 15 00934 g002
Figure 3. Observed and estimated fish species accumulation curves for the studied zones. E-Obs: observed species in the estuarine zone. S-Obs: observed species in the surf zone. E-Chao2: estimated species in the estuarine zone. S-Chao2: estimated species in the surf zone. Estimated species were calculated using Chao’s 2 estimator based on presence/absence data.
Diversity 15 00934 g003
Figure 4. Distance-based redundancy analysis (dbRDA) plot performed from the distance-based linear model permutation test (DistLM) that describes the aggrupation of sampling stations due to its fish assemblages’ composition. Vectors indicate environmental variables with significant effect, markers correspond to studied zones (estuarine and surf zones), while the dotted line divides samples in the previous (2018–2019) and during (2020–2021) COVID-19 restriction periods.
Diversity 15 00934 g004
Table 1. Abundance (a) and biomass (b, g/m2) of the fish species in the Urías system in the period 2018 to 2021 per zone. EZ = estuarine zone, SZ = surf zone, T = total for both zones combined.
FamilySpeciesaEZaSZaTbEZbSZbT
ElopidaeElops affinis101114.311.015.33
PristigasteridaePliosteostoma lutipinnis0101101017.5317.53
Opisthopterus dovii021521502.192.19
EngraulidaeAnchoa naus5050.100.1
Anchoa walkeri0656501.541.54
ClupeidaeHarengula thrissina08800.970.97
Lile stolifera293002930115.610115.61
Opisthonema libertate03300.060.06
PoeciliidaePoeciliopsis latidens5050.00100.001
GobiidaeCtenogobius sagittula131140.0900.09
Gobiosoma paradoxum9090.0200.02
Rhinogobiops nicholsii5050.00600.006
MugilidaeMugil curema931010333.924.3638.28
Mugil cephalus400402.1802.18
CichlidaeOreochromis sp.1120.0150.0150.03
AtherinopsidaeLeuresthes sp.77921690.130.300.43
Atherinella sp.1010.00200.002
CarangidaeCaranx caninus97998081.3127.6929.00
Oligoplites saurus1010.1300.13
Oligoplites refulgens215170.040.150.19
Selene brevoortii01100.10.1
Trachinotus kennedyi09900.220.22
Trachinotus paitensis660660.362.042.40
HemiramphidaeHemiramphus saltator01100.090.09
Hyporhamphus rosae54944990.5950.3450.93
BelonidaeTylosurus pacificus01105.085.08
CyclopsettidaeCitharichthys gilberti1010.0200.02
GerreidaeDiapterus brevirostris05500.10.1
Eucinostomus dowii740743.9503.95
Eucinostomus currani597662.761.133.88
Eucinostomus entomelas28602869.3909.39
Eucinostomus gracilis19501957.1107.11
Gerres simillimus120127.3707.37
HaemulidaeRhencus macracanthus6060.1800.18
LutjanidaeLutjanus argentiventris3030.5200.52
Lutjanus colorado66122.258.4810.74
Lutjanus novemfasciatus1012.0202.02
ScianidaeMenticirrhus elongatus0323201.571.57
Umbrina xanti0474702.972.97
PolynemidaePolydactylus approximans011511503.883.88
Polydactylus opercularis02200.230.23
Table 2. A summary of GAM used. * indicates statistically significant results. DV = deviance explained, AIC = Akaike information criterion, R2 = coefficient of determination. 0D = Hill number order 0, 1D = Hill number order 1, 2D = Hill number order 2.
Response VariableSelect Variables% DVAICR2
Biomasss(Temperature) * + Mangrove area * + Period58.3149.050.465
0Ds(Salinity) * + Season + Zone61.186.070.447
1Ds(Total matter suspended) + Season52.476.890.424
2Ds(Total matter suspended) + Season49.571.590.386
Disclaimer/Publisher’s Note: The statements, opinions and data contained in all publications are solely those of the individual author(s) and contributor(s) and not of MDPI and/or the editor(s). MDPI and/or the editor(s) disclaim responsibility for any injury to people or property resulting from any ideas, methods, instructions or products referred to in the content.