


Comparative Phylogeography, Historical Demography, and Population Genetics of Three Common Coastal Fauna in Spartina Marshes of the Northwestern Gulf of Mexico


Abstract
1. Introduction
2. Materials and Methods
3. Results
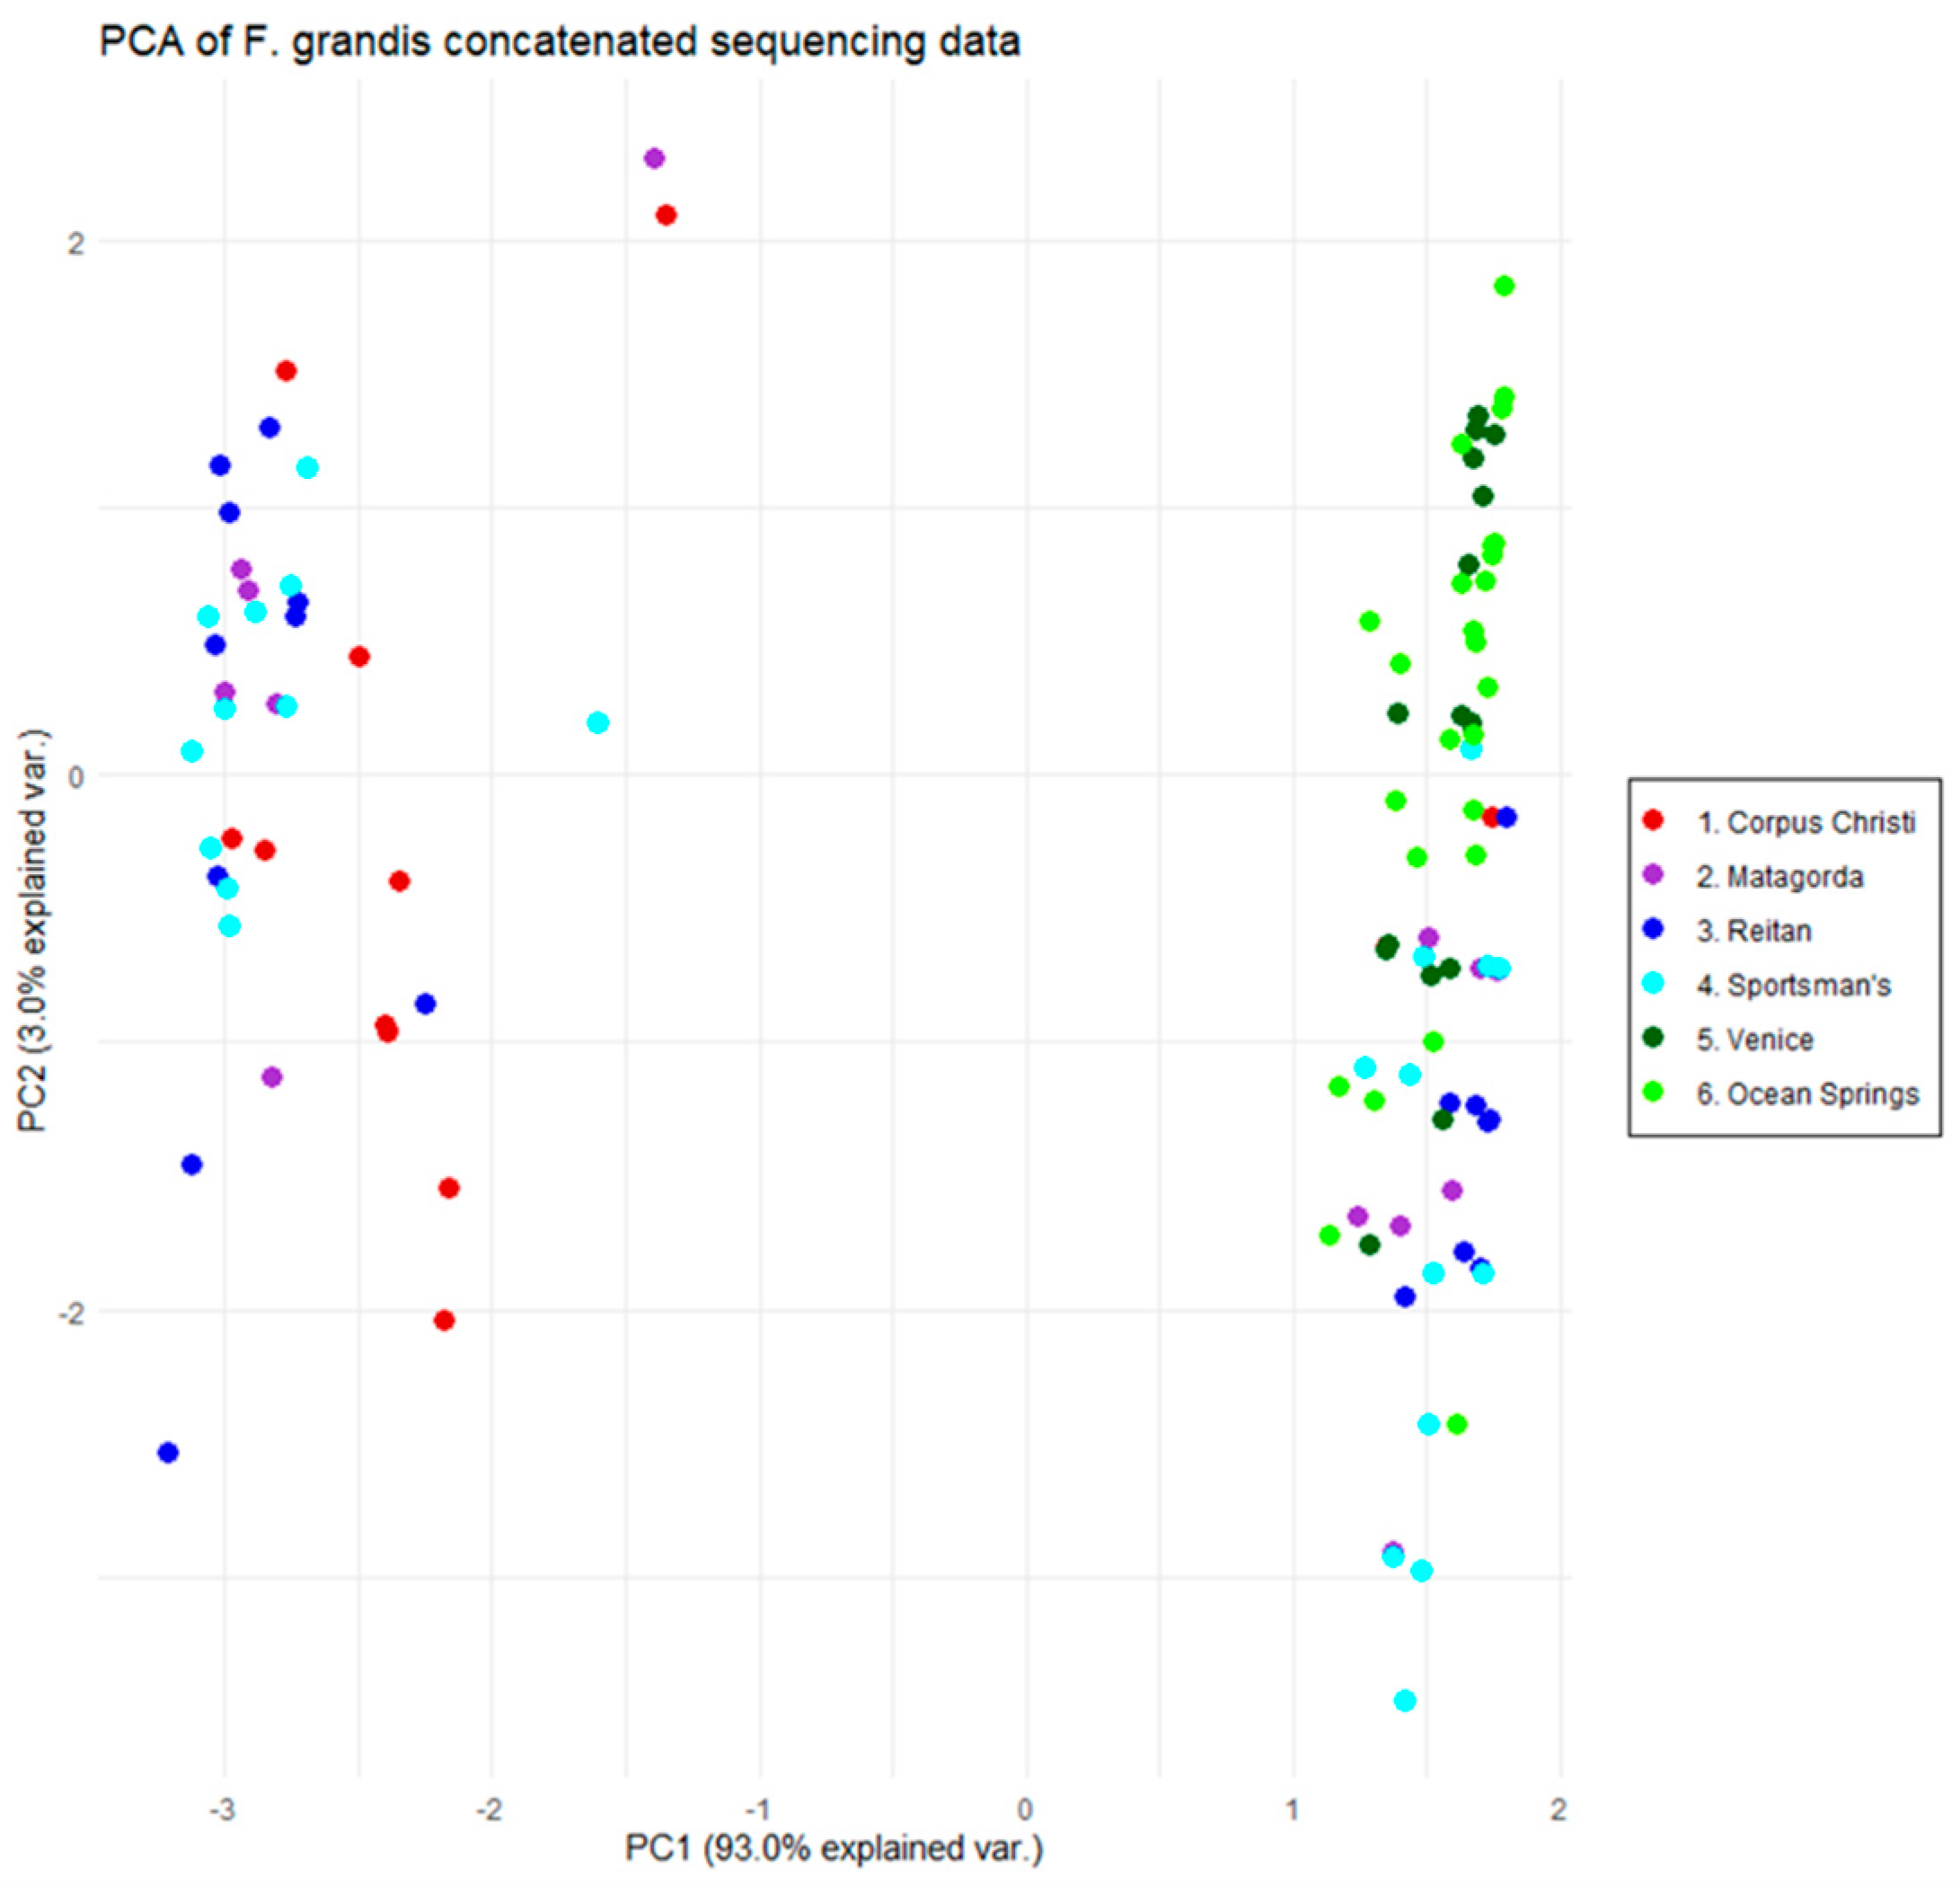
3.1. The Gulf Killifish, Fundulus grandis
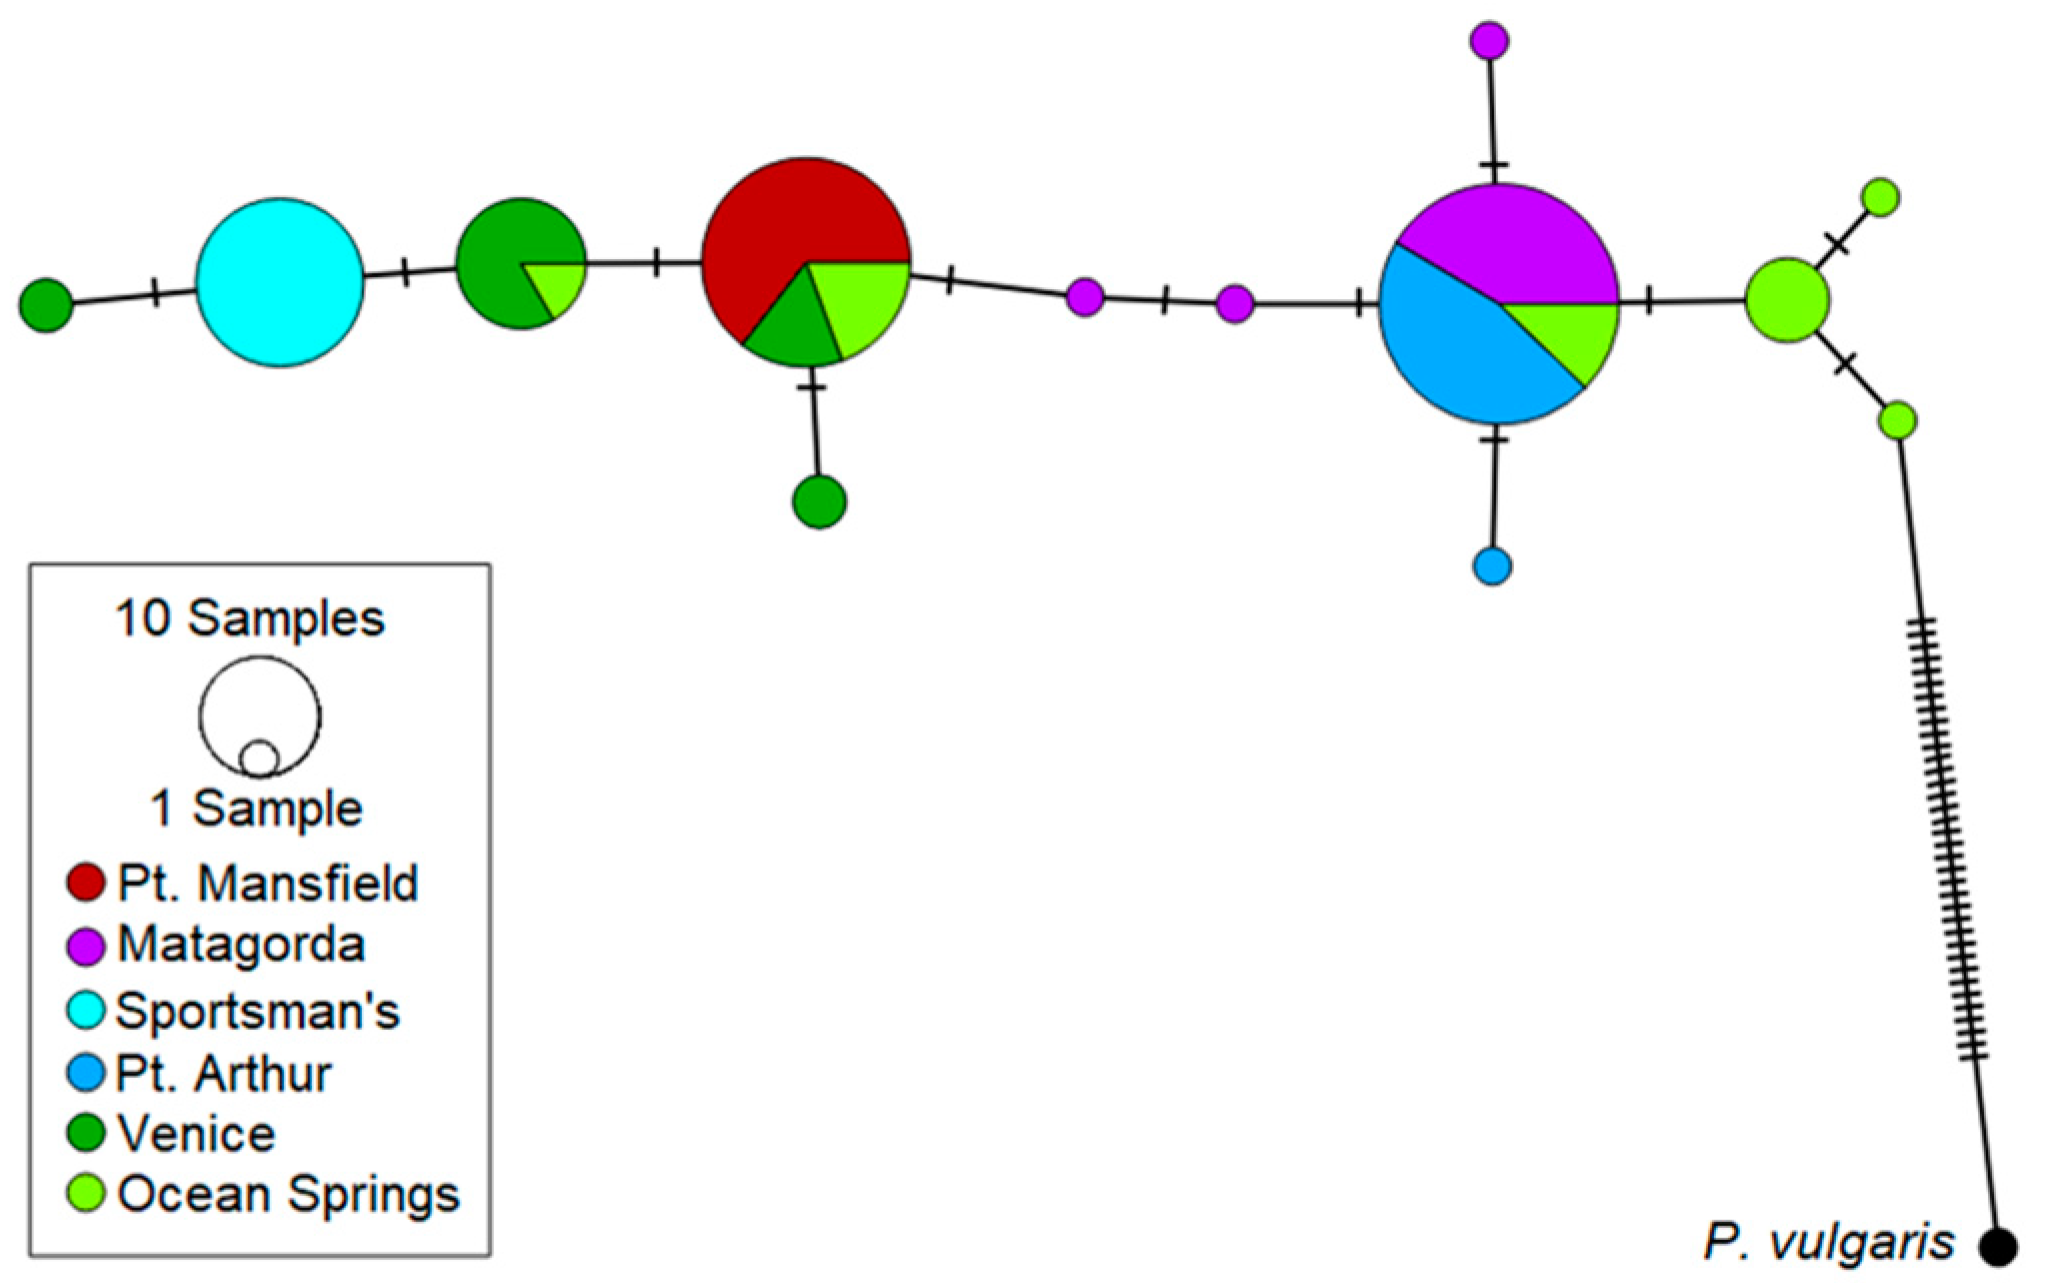
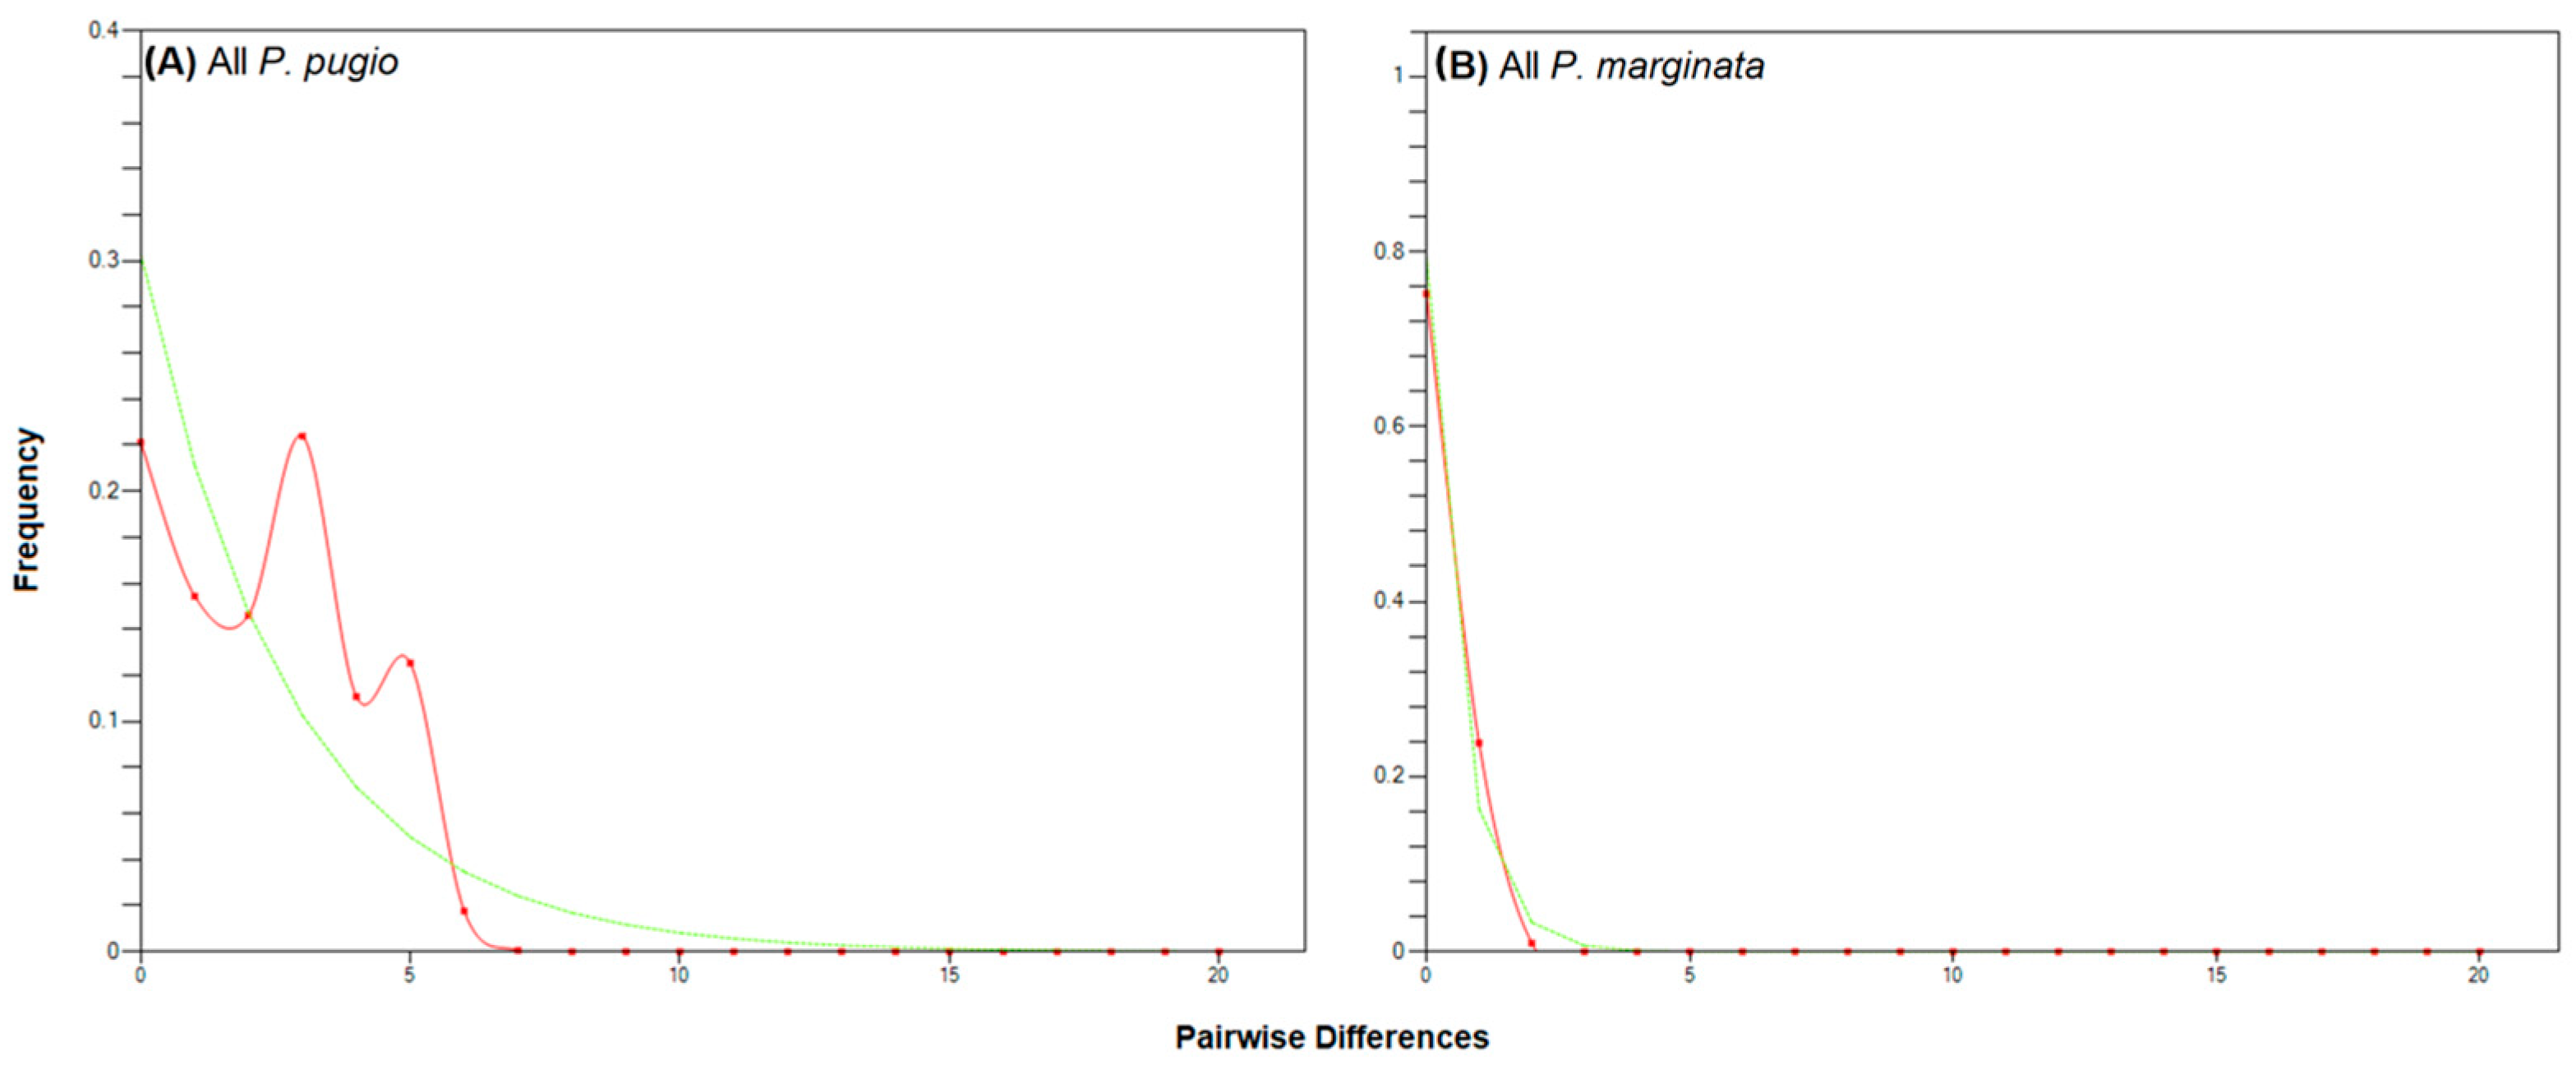
3.2. Daggerblade Grass Shrimp P. pugio
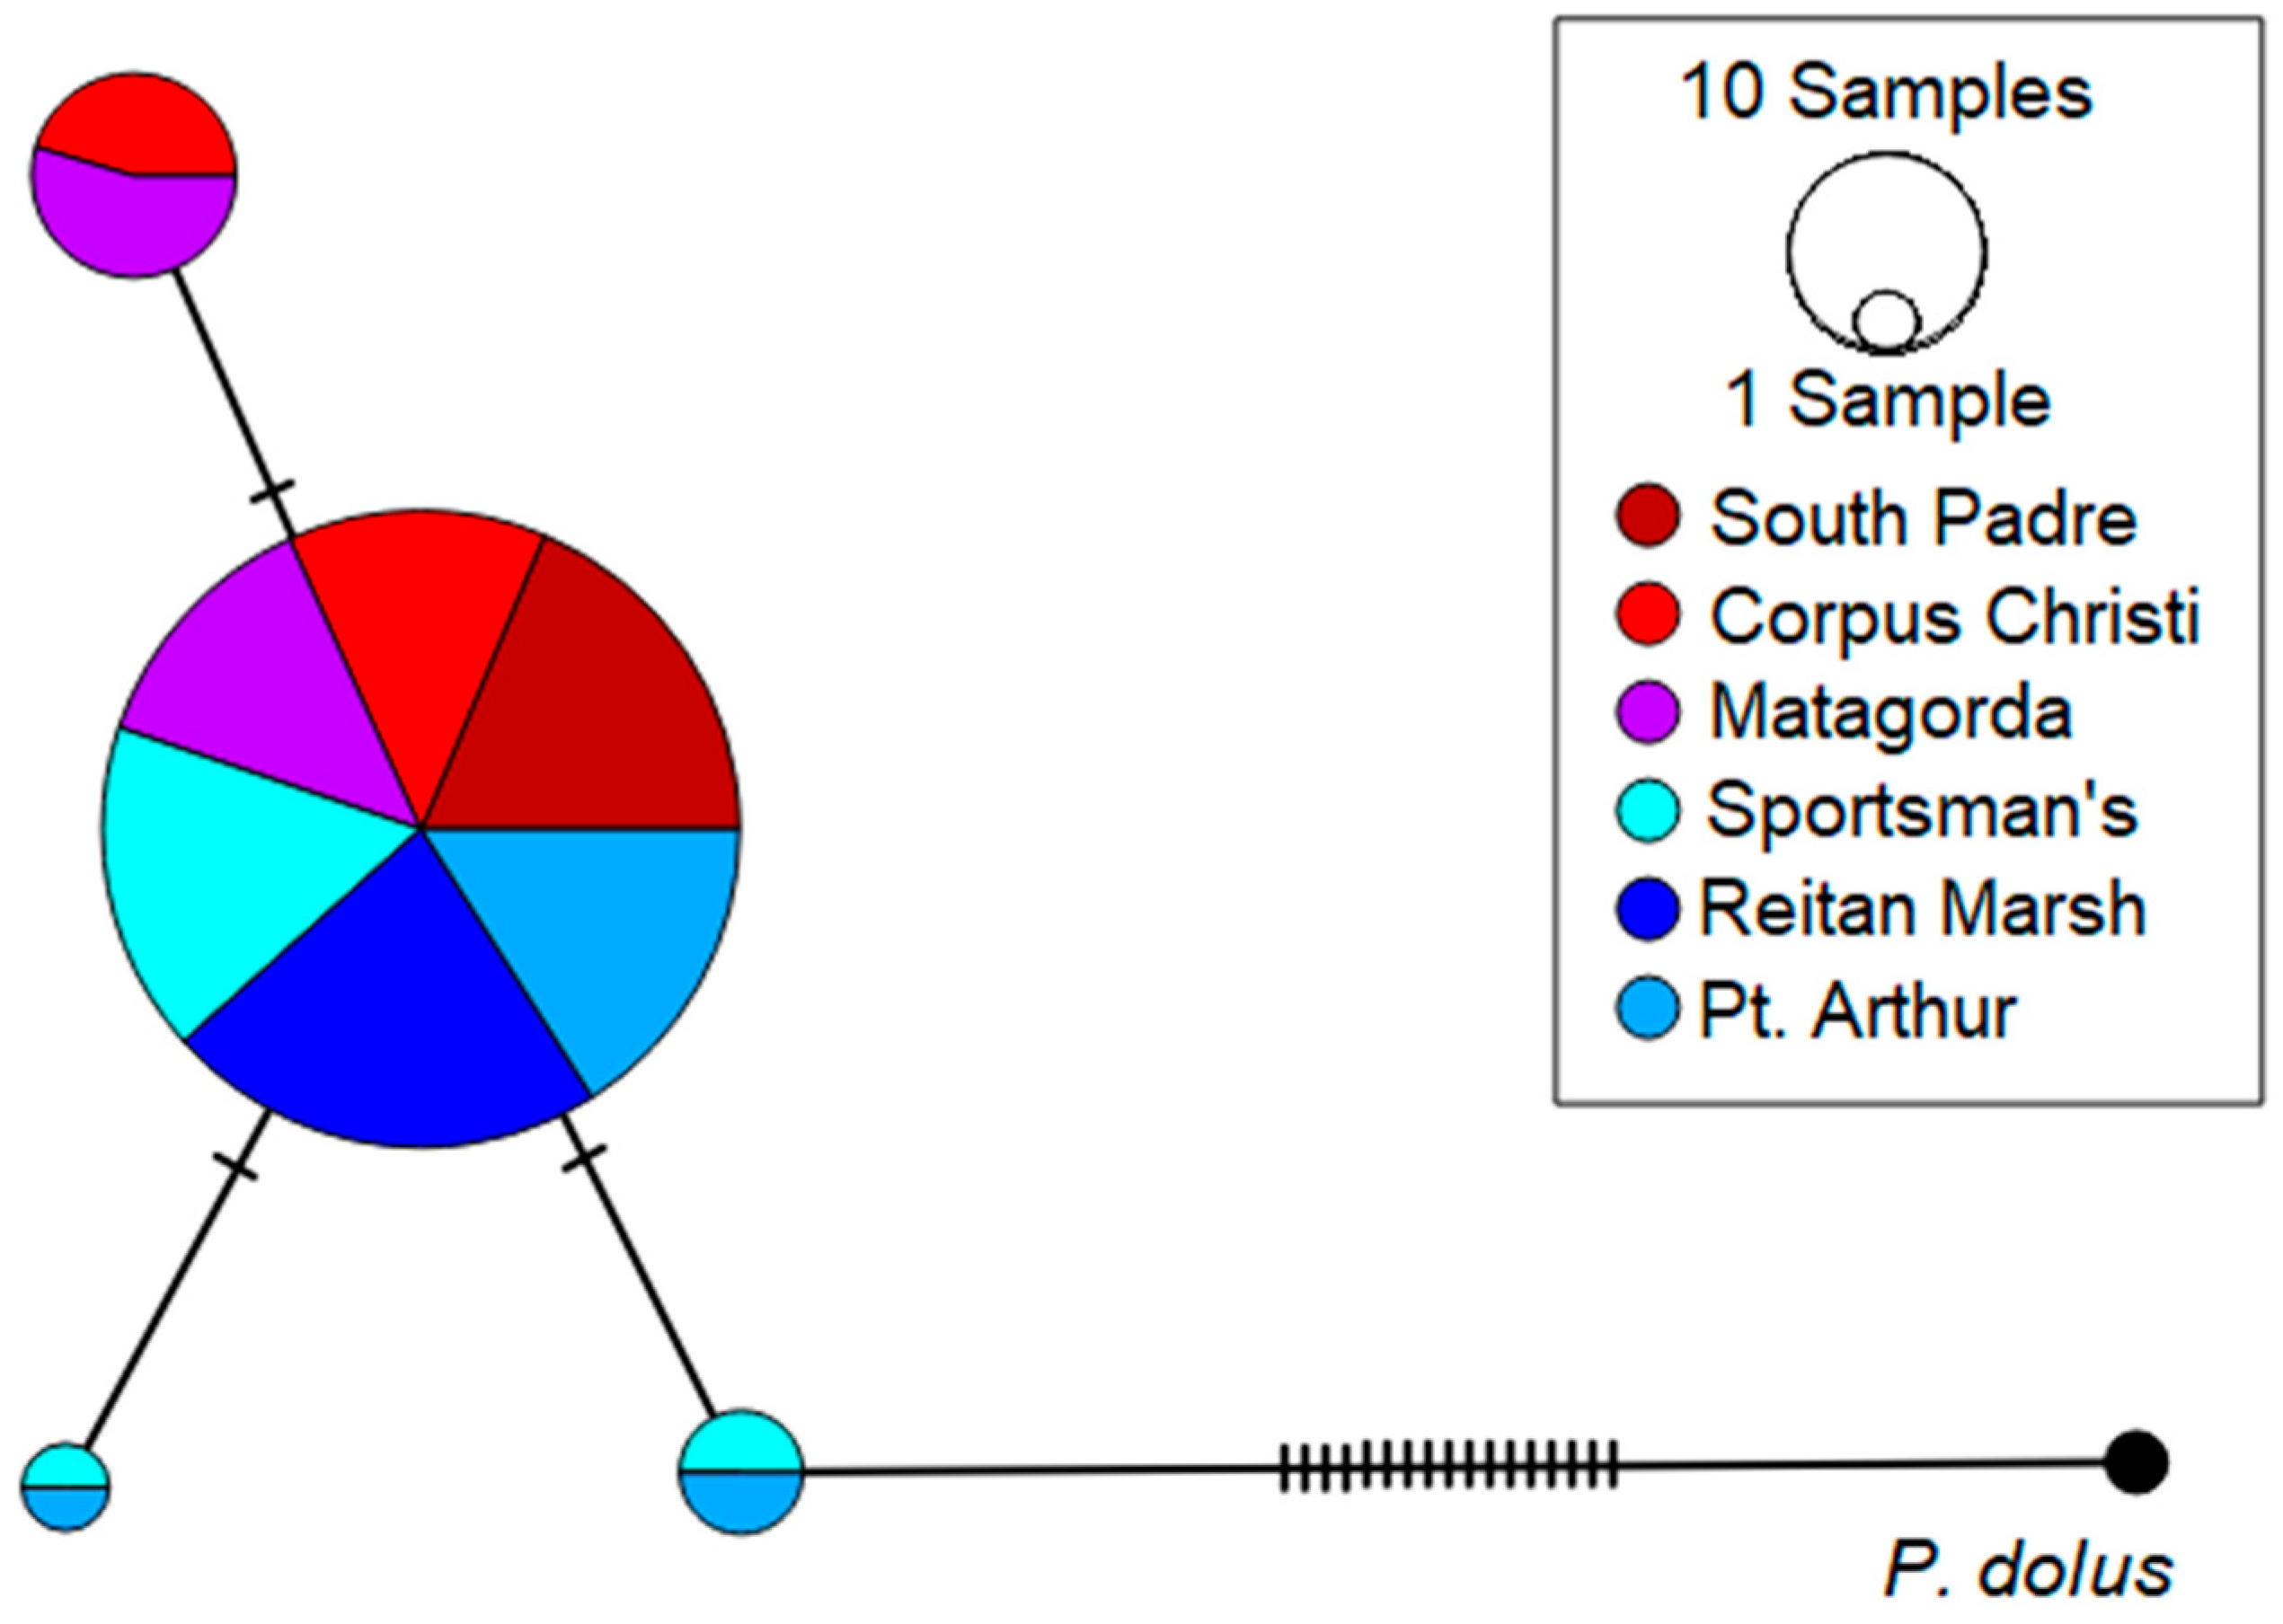
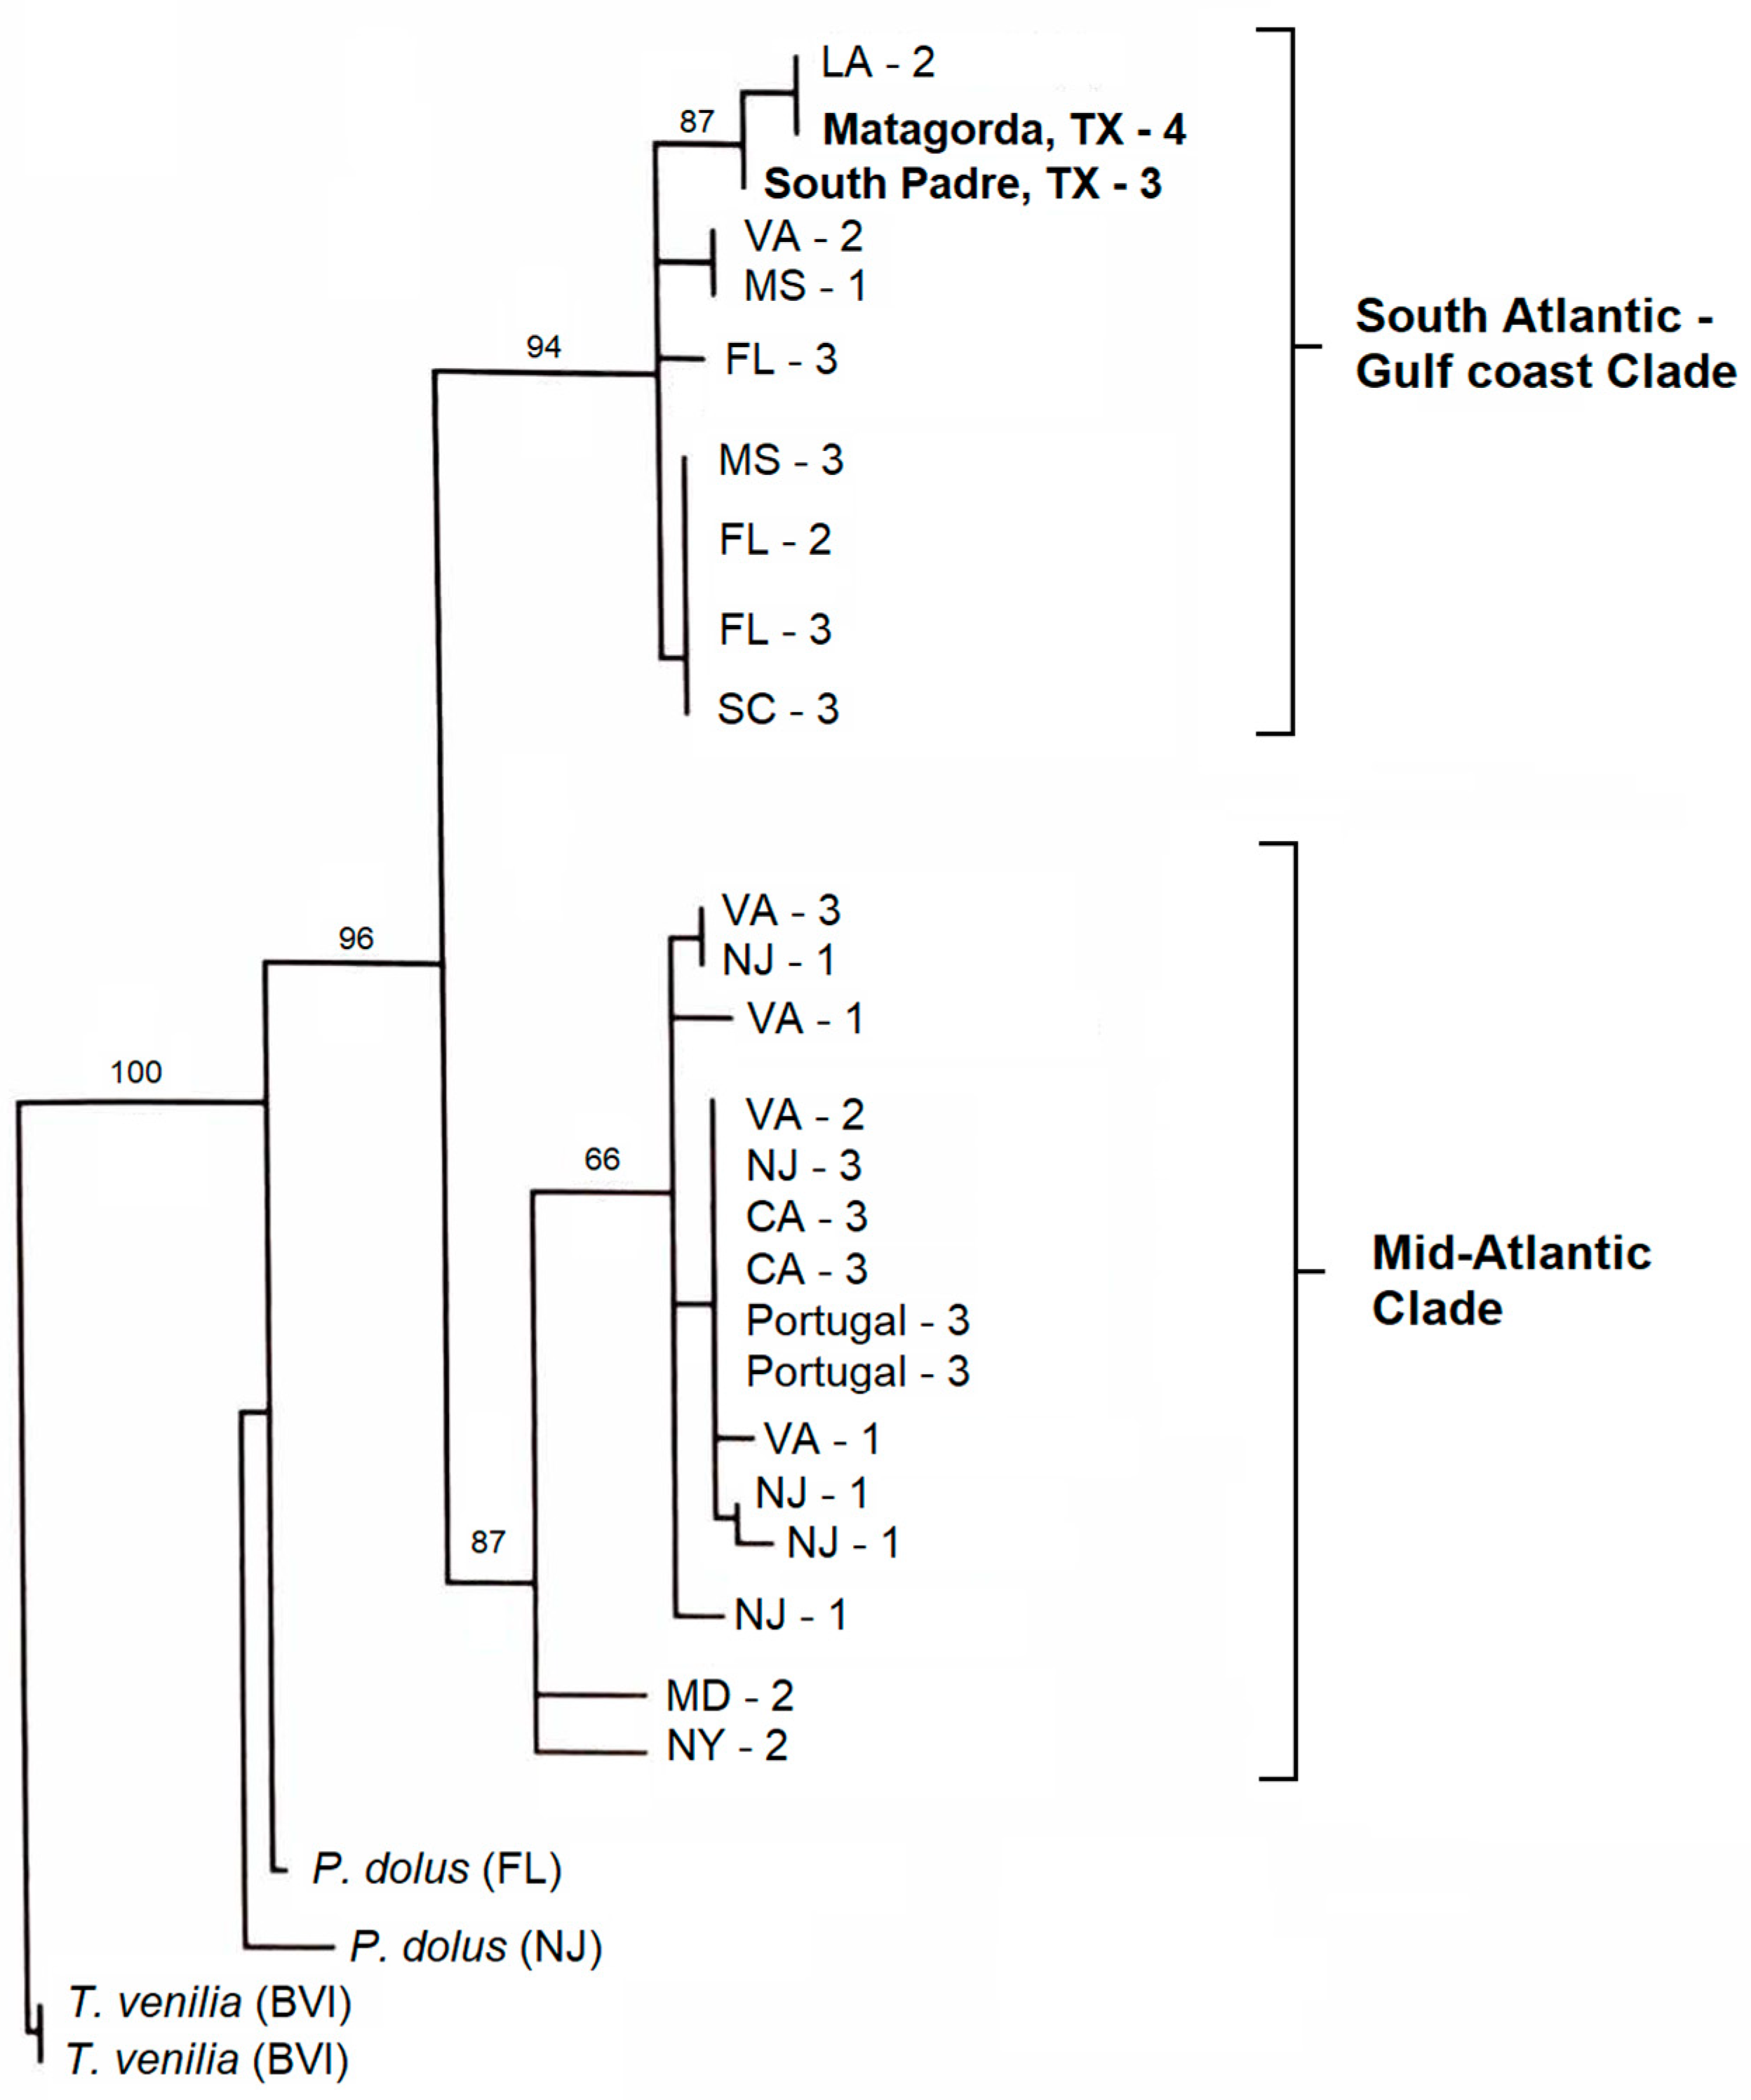
3.3. The Planthopper P. marginata
4. Discussion
4.1. The Gulf Killifish F. grandis
4.2. Grass Shrimp P. pugio
4.3. The Planthopper P. marginata
5. Conclusions
Supplementary Materials
Author Contributions
Funding
Institutional Review Board Statement
Data Availability Statement
Acknowledgments
Conflicts of Interest
References
- Engle, V.D. Estimating the Provision of Ecosystem Services by Gulf of Mexico Coastal Wetlands. Wetlands 2011, 31, 179–193. [Google Scholar] [CrossRef]
- Moulton, D.W.; Dall, D.M.; Dahl, T.E.; Fish, U.S.; Wildlife, S. Texas Coastal Wetlands: Status and Trends, Mid-1950s to Early 1990s; U.S. Department of the Interior, Fish and Wildlife Service, Southwestern Region: Albuquerque, NM, USA, 1997; p. 32.
- Dahl, T.E. Status and Trends of Wetlands in the Conterminous United States 2004 to 2009; Department of the Interior, US Fish and Wildlife Service: Washington, DC, USA, 2011.
- Dahl, T.E.; Stedman, S.-M. Status and Trends of Wetlands in the Coastal Watersheds of the Conterminous United States 2004 to 2009; US Department of the Interior, US Fish and Wildlife Service and National: Washington, DC, USA, 2013.
- Fahrig, L. Effects of Habitat Fragmentation on Biodiversity. Annu. Rev. Ecol. Evol. Syst. 2003, 34, 487–515. [Google Scholar] [CrossRef]
- Ewers, R.M.; Didham, R.K. Confounding factors in the detection of species responses to habitat fragmentation. Biol. Rev. 2005, 81, 117–142. [Google Scholar] [CrossRef] [PubMed]
- Finke, D.L.; Denno, R.F. Predator diversity and the functioning of ecosystems: The role of intraguild predation in dampening trophic cascades. Ecol. Lett. 2005, 8, 1299–1306. [Google Scholar] [CrossRef]
- Finke, D.L.; Denno, R.F. Predator diversity dampens trophic cascades. Nature 2004, 429, 407–410. [Google Scholar] [CrossRef]
- Deegan, L.A.; Bowen, J.L.; Drake, D.; Fleeger, J.W.; Friedrichs, C.T.; Galván, K.A.; Hobbie, J.E.; Hopkinson, C.; Johnson, D.S.; Johnson, J.M.; et al. Susceptibility of salt marshes to nutrient enrichment and predator removal. Ecol. Appl. 2007, 17, S42–S63. [Google Scholar] [CrossRef]
- Avise, J.C. Molecular Markers, Natural History, and Evolution; Sinauer Associates: Sunderland, MA, USA, 2004. [Google Scholar]
- Bijlsma, R.; Loeschcke, V. Genetic erosion impedes adaptive responses to stressful environments. Evol. Appl. 2012, 5, 117–129. [Google Scholar] [CrossRef]
- Palkovacs, E.P.; Kinnison, M.T.; Correa, C.; Dalton, C.M.; Hendry, A.P. Fates beyond traits: Ecological consequences of human-induced trait change. Evol. Appl. 2012, 5, 183–191. [Google Scholar] [CrossRef]
- Hughes, A.R.; Inouye, B.D.; Johnson, M.T.J.; Underwood, N.; Vellend, M. Ecological consequences of genetic diversity. Ecol. Lett. 2008, 11, 609–623. [Google Scholar] [CrossRef]
- Reynolds, L.K.; McGlathery, K.J.; Waycott, M. Genetic Diversity Enhances Restoration Success by Augmenting Ecosystem Services. PLoS ONE 2012, 7, e38397. [Google Scholar] [CrossRef]
- Hartig, E.K.; Gornitz, V.; Kolker, A.; Mushacke, F.; Fallon, D. Anthropogenic and climate-change impacts on salt marshes of Jamaica Bay, New York City. Wetlands 2002, 22, 71–89. [Google Scholar] [CrossRef]
- Wigand, C.; McKinney, R.A.; Charpentier, M.A.; Chintala, M.M.; Thursby, G.B. Relationships of nitrogen loadings, residential development, and physical characteristics with plant structure in New England salt marshes. Estuaries 2003, 26, 1494–1504. [Google Scholar] [CrossRef]
- Konisky, R.A.; Burdick, D.M. Effects of stressors on invasive and halophytic plants of New England salt marshes: A framework for predicting response to tidal restoration. Wetlands 2004, 24, 434–447. [Google Scholar] [CrossRef]
- Simas, T.; Nunes, J.P.; Ferreira, J.G. Effects of global climate change on coastal salt marshes. Ecol. Model. 2001, 139, 1–15. [Google Scholar] [CrossRef]
- Denno, R.F.; Schauff, M.E.; Wilson, S.W.; Olmstead, K.L. Practical diagnosis and natural history of two sibling salt marsh-inhabiting planthoppers in the genus Prokelisia (Homoptera: Delphacidae). Proc. Entomol. Soc. Wash. 1987, 89, 687–700. [Google Scholar]
- Minello, T.J.; Zimmerman, R.J. Utilization of natural and transplanted Texas salt marshes by fish and decapod crustaceans. Mar. Ecol. Prog. Ser. 1992, 90, 13. [Google Scholar] [CrossRef]
- Minello, T.J.; Webb, J.W., Jr. Use of natural and created Spartina alterniflora salt marshes by fishery species and other aquatic fauna in Galveston Bay, Texas, USA. Mar. Ecol. Prog. Ser. 1997, 151, 14. [Google Scholar] [CrossRef]
- Denno, R.F. Life History Variation in Planthoppers. In Planthoppers: Their Ecology and Management; Denno, R.F., Perfect, T.J., Eds.; Springer US: Boston, MA, USA, 1994; pp. 163–215. [Google Scholar] [CrossRef]
- Olmstead, K.L.; Denno, R.F.; Morton, T.C.; Romeo, J.T. Influence of Prokelisia Planthoppers on Amino Acid Composition and Growth of Spartina alterniflora. J. Chem. Ecol. 1997, 23, 303–321. [Google Scholar] [CrossRef]
- Alvarado Bremer, J.R.; Viñas, J.; Mejuto, J.; Ely, B.; Pla, C. Comparative phylogeography of Atlantic bluefin tuna and swordfish: The combined effects of vicariance, secondary contact, introgression, and population expansion on the regional phylogenies of two highly migratory pelagic fishes. Mol. Phylogenet. Evol. 2005, 36, 169–187. [Google Scholar] [CrossRef]
- Bowen, B.W.; Shanker, K.; Yasuda, N.; Celia, M.; Malay, M.C.D.; von der Heyden, S.; Paulay, G.; Rocha, L.A.; Selkoe, K.A.; Barber, P.H.; et al. Phylogeography unplugged: Comparative surveys in the genomic era. Bull. Mar. Sci. 2014, 90, 13–46. [Google Scholar] [CrossRef]
- Avise, J.C. Molecular Population Structure and the Biogeographic History of a Regional Fauna: A Case History with Lessons for Conservation Biology. Oikos 1992, 63, 62–76. [Google Scholar] [CrossRef]
- Wood, C.E. Physioecology of the grass shrimp, Palaemonetes pugio, in the Galveston Bay estuarine system. Contrib. Mar. Sci. 1967, 12, 25. [Google Scholar]
- Rozas, L.P.; Reed, D.J. Nekton use of marsh-surface habitats in Louisiana (USA) deltaic salt marshes undergoing submergence. Mar. Ecol. Prog. Ser. 1993, 96, 147–157. [Google Scholar] [CrossRef]
- Rozas, L.P.; Zimmerman, R.J. Small-scale patterns of nekton use among marsh and adjacent shallow nonvegetated areas of the Galveston Bay Estuary, Texas (USA). Mar. Ecol. Prog. Ser. 2000, 193, 217–239. [Google Scholar] [CrossRef]
- Denno, R.F.; McClure, M.S. Introduction: Variability: A Key to Understanding Plant-Herbivore Interactions. In Variable Plants and Herbivores in Natural and Managed Systems; Denno, R.F., Ed.; Academic Press: Cambridge, MA, USA, 1983; pp. 1–12. [Google Scholar]
- Denno, R.F.; Peterson, M.A.; Gratton, C.; Cheng, J.; Langellotto, G.A.; Huberty, A.F.; Finke, D.L. Feeding-Induced Changes in Plant Quality Mediate Interspecific Competition between Sap-Feeding Herbivores. Ecology 2000, 81, 1814–1827. [Google Scholar] [CrossRef]
- Greeley, M.S.; MacGregor, R. Annual and Semilunar Reproductive Cycles of the Gulf Killifish, Fundulus grandis, on the Alabama Gulf Coast. Copeia 1983, 1983, 711–718. [Google Scholar] [CrossRef]
- Lipcius, R.N.; Subrahmanyam, C.B. Temporal factors influencing killifish abundance and recruitment in Gulf of Mexico salt marshes. Estuar. Coast. Shelf Sci. 1986, 22, 101–114. [Google Scholar] [CrossRef]
- Nordlie, F.G. Patterns of reproduction and development of selected resident teleosts of Florida salt marshes. Hydrobiologia 2000, 434, 165–182. [Google Scholar] [CrossRef]
- Green, C.C.; Gothreaux, C.T.; Lutz, C.G. Reproductive Output of Gulf Killifish at Different Stocking Densities in Static Outdoor Tanks. N. Am. J. Aquac. 2010, 72, 321–331. [Google Scholar] [CrossRef]
- Nelson, T.R.; Sutton, D.; DeVries, D.R. Summer Movements of the Gulf Killifish (Fundulus grandis) in a Northern Gulf of Mexico Salt Marsh. Estuaries Coasts 2014, 37, 1295–1300. [Google Scholar] [CrossRef]
- Garcia, T.I.; Shen, Y.; Crawford, D.; Oleksiak, M.F.; Whitehead, A.; Walter, R.B. RNA-Seq reveals complex genetic response to deepwater horizon oil release in Fundulus grandis. BMC Genom. 2012, 13, 474. [Google Scholar] [CrossRef] [PubMed]
- Whitehead, A.; Dubansky, B.; Bodinier, C.; Garcia, T.I.; Miles, S.; Pilley, C.; Raghunathan, V.; Roach, J.L.; Walker, N.; Walter, R.B.; et al. Genomic and physiological footprint of the Deepwater Horizon oil spill on resident marsh fishes. Proc. Natl. Acad. Sci. USA 2012, 109, 20298–20302. [Google Scholar] [CrossRef] [PubMed]
- Dubansky, B.; Whitehead, A.; Miller, J.T.; Rice, C.D.; Galvez, F. Multitissue Molecular, Genomic, and Developmental Effects of the Deepwater Horizon Oil Spill on Resident Gulf Killifish (Fundulus grandis). Environ. Sci. Technol. 2013, 47, 5074–5082. [Google Scholar] [CrossRef] [PubMed]
- Dubansky, B.; Whitehead, A.; Rice, C.D.; Galvez, F. Response to Comment on “Multi-Tissue Molecular, Genomic, and Developmental Effects of the Deepwater Horizon Oil Spill on Resident Gulf Killifish (Fundulus grandis)”. Environ. Sci. Technol. 2014, 48, 7679–7680. [Google Scholar] [CrossRef]
- Oziolor, E.M.; Bigorgne, E.; Aguilar, L.; Usenko, S.; Matson, C.W. Evolved resistance to PCB- and PAH-induced cardiac teratogenesis, and reduced CYP1A activity in Gulf killifish (Fundulus grandis) populations from the Houston Ship Channel, Texas. Aquat. Toxicol. 2014, 150, 210–219. [Google Scholar] [CrossRef]
- Oziolor, E.M.; Dubansky, B.; Burggren, W.W.; Matson, C.W. Cross-resistance in Gulf killifish (Fundulus grandis) populations resistant to dioxin-like compounds. Aquat. Toxicol. 2016, 175, 222–231. [Google Scholar] [CrossRef]
- Dubansky, B.; Rice, C.D.; Barrois, L.F.; Galvez, F. Biomarkers of Aryl-hydrocarbon Receptor Activity in Gulf Killifish (Fundulus grandis) From Northern Gulf of Mexico Marshes Following the Deepwater Horizon Oil Spill. Arch. Environ. Contam. Toxicol. 2017, 73, 63–75. [Google Scholar] [CrossRef]
- Welsh, B.L. The Role of Grass Shrimp, Palaemonetes pugio, in a Tidal Marsh Ecosystem. Ecology 1975, 56, 513–530. [Google Scholar] [CrossRef]
- Anderson, G. Species Profiles: Life Histories and Environmental Requirements of Coastal Fisheries and Invertebrates (Gulf of Mexico)—Grass Shrimp; U.S. Fish and Wildlife Service Biological Report 82(11.35); U.S. Army Corps of Engineers, TR EL-82-4; U.S. Fish and Wildlife Service: Washington, DC, USA, 1985; 19p.
- Cházaro-Olvera, S. Growth, Mortality, and Fecundity of from a Lagoon System Inlet in the Southwestern Gulf of Mexico. J. Crustac. Biol. 2009, 29, 201–207. [Google Scholar] [CrossRef]
- Allen, D.; Harding, J.; Stroud, K.; Yozzo, K. Movements and site fidelity of grass shrimp (Palaemonetes pugio and P. vulgaris) in salt marsh intertidal creeks. Mar. Biol. 2015, 162, 1275–1285. [Google Scholar] [CrossRef]
- Adams, S.M.; Angelovic, J.W. Assimilation of detritus and its associated bacteria by three species of estuarine animals. Chesap. Sci. 1970, 11, 249–254. [Google Scholar] [CrossRef]
- Odum, E.W.; Heald, J.E. Trophic Analyses of an Estuarine Mangrove Community. Bull. Mar. Sci. 1972, 22, 671–738. [Google Scholar]
- Lewis, M.A.; Foss, S.S. A caridean grass shrimp (Palaemonetes pugio Holthius) as an indicator of sediment quality in Florida coastal areas affected by point and nonpoint source contamination. Environ. Toxicol. 2000, 15, 234–242. [Google Scholar] [CrossRef]
- DeLorenzo, M.E.; Eckmann, C.A.; Chung, K.W.; Key, P.B.; Fulton, M.H. Effects of salinity on oil dispersant toxicity in the grass shrimp, Palaemonetes pugio. Ecotoxicol. Environ. Saf. 2016, 134, 256–263. [Google Scholar] [CrossRef]
- Gray, A.D.; Weinstein, J.E. Size- and shape-dependent effects of microplastic particles on adult daggerblade grass shrimp (Palaemonetes pugio). Environ. Toxicol. Chem. 2017, 36, 3074–3080. [Google Scholar] [CrossRef]
- Denno, R.F.; Olmstead, K.L.; McCloud, E.S. Reproductive cost of flight capability: A comparison of life history traits in wing dimorphic planthoppers. Ecol. Entomol. 1989, 14, 31–44. [Google Scholar] [CrossRef]
- Denno, R.F.; Roderick, G.K.; Olmstead, K.L.; Dobel, H.G. Density-Related Migration in Planthoppers (Homoptera: Delphacidae): The Role of Habitat Persistence. Am. Nat. 1991, 138, 1513–1541. [Google Scholar] [CrossRef]
- Williams, D.A.; Brown, S.D.; Crawford, D.L. Contemporary and historical influences on the genetic structure of the estuarine-dependent Gulf killifish Fundulus grandis. Mar. Ecol. Prog. Ser. 2008, 373, 111–121. [Google Scholar] [CrossRef]
- Williams, L.M.; Ma, X.; Boyko, A.R.; Bustamante, C.D.; Oleksiak, M.F. SNP identification, verification, and utility for population genetics in a non-model genus. BMC Genet. 2010, 11, 32. [Google Scholar] [CrossRef]
- Fuller, B.; (Houston, TX, USA). Genetic Variability in Palaemonetes pugio in Habitats Open and Closed to Migration. Unpublished Masters’s Thesis, University of Houston, Houston, TX, USA, 1977. [Google Scholar]
- Fuller, B.; Lester, L.J. Correlations of Allozymic Variation with Habitat Parameters Using the Grass Shrimp, Palaemonetes pugio. Evolution 1980, 34, 1099–1104. [Google Scholar] [CrossRef]
- Flowers, M.A. Population Genetics Analysis of the Grass Shrimp Palaemonetes pugio Using Single Strand Conformation Polymorphism. Master’s Thesis, Georgia Southern University, Statesboro, GA, USA, 2004. [Google Scholar]
- Denno, R.F.; Peterson, M.A.; Weaver, M.R.; Hawthorne, D.J. Life-History and Evolution in Native and Introduced Populations. In Specialization, Speciation, and Radiation; Tilmon, K.J., Ed.; University of California Press: Los Angeles, CA, USA, 2008; pp. 296–310. [Google Scholar]
- Wood, C.E. Key to the Natantia (Crustacea, Decapoda) of the Coastal Waters on the Texas Coast. In Contributions in Marine Science; The University of Texas, Marine Science Institute: Port Aransas, TX, USA, 1974; Volume 18, pp. 35–56. [Google Scholar]
- Heady, S.E.; Wilson, S.W. The Planthopper Genus Prokelisia (Homoptera: Delphacidae): Morphology of Female Genitalia and Copulatory Behavior. J. Kans. Entomol. Soc. 1990, 63, 267–278. [Google Scholar]
- Paterson, H.E.H. The Recognition of Cryptic Species Among Economically Important Insects. In Heliothis: Research Methods and Prospects; Zalucki, M.P., Ed.; Springer: New York, NY, USA, 1991; pp. 1–10. [Google Scholar] [CrossRef]
- Bickford, D.; Lohman, D.J.; Sodhi, N.S.; Ng, P.K.L.; Meier, R.; Winker, K.; Ingram, K.K.; Das, I. Cryptic species as a window on diversity and conservation. Trends Ecol. Evol. 2007, 22, 148–155. [Google Scholar] [CrossRef] [PubMed]
- Espinoza, G.J.; Alvarado Bremer, J.R. Genetic species identification of ecologically important planthoppers (Prokelisia spp.) of coastal Spartina saltmarshes using High Resolution Melting Analysis (HRMA). Sci. Rep. 2019, 9, 20073. [Google Scholar] [CrossRef] [PubMed]
- Whitehead, A. Comparative mitochondrial genomics within and among species of killifish. BMC Evol. Biol. 2009, 9, 11. [Google Scholar] [CrossRef]
- Koressaar, T.; Remm, M. Enhancements and modifications of primer design program Primer3. Bioinformatics 2007, 23, 1289–1291. [Google Scholar] [CrossRef]
- Untergasser, A.; Cutcutache, I.; Koressaar, T.; Ye, J.; Faircloth, B.C.; Remm, M.; Rozen, S.G. Primer3--new capabilities and interfaces. Nucleic Acids Res. 2012, 40, e115. [Google Scholar] [CrossRef]
- Alvarado Bremer, J.R.; Baker, A.J.; Mejuto, J. Mitochondrial DNA control region sequences indicate extensive mixing of swordfish (Xiphias gladius) populations. Can. J. Fish. Aq. Sci. 1995, 52, 1720–1732. [Google Scholar] [CrossRef]
- Crandall, K.A.; Fitzpatrick, J.F., Jr. Crayfish Molecular Systematics: Using a Combination of Procedures to Estimate Phylogeny. Syst. Biol. 1996, 45, 1–26. [Google Scholar] [CrossRef]
- Simon, C.; Frati, F.; Beckenbach, A.; Crespi, B.; Liu, H.; Flook, P. Evolution, Weighting, and Phylogenetic Utility of Mitochondrial Gene Sequences and a Compilation of Conserved Polymerase Chain Reaction Primers. Ann. Entomol. Soc. Am. 1994, 87, 651–701. [Google Scholar] [CrossRef]
- Cruscanti, M.; Innocenti, G.; Alvarado Bremer, J.; Galil, B.S. First report of the brown shrimp Penaeus aztecus Ives, 1891 (Crustacea, Decapoda, Penaeidae) in the Tyrrhenian Sea. Mar. Biodivers. Rec. 2015, 8, e81. [Google Scholar] [CrossRef]
- Rozas, J.; Ferrer-Mata, A.; Sánchez-DelBarrio, J.C.; Guirao-Rico, S.; Librado, P.; Ramos-Onsins, S.E.; Sánchez-Gracia, A. DnaSP 6: DNA Sequence Polymorphism Analysis of Large Data Sets. Mol. Biol. Evol. 2017, 34, 3299–3302. [Google Scholar] [CrossRef]
- Excoffier, L.; Laval, G.; Schneider, S. Arlequin (version 3.0): An integrated software package for population genetics data analysis. Evol. Bioinform. Online 2005, 1, 47–50. [Google Scholar] [CrossRef]
- Reynolds, J.; Weir, B.S.; Cockerham, C.C. Estimation of the coancestry coefficient: Basis for a short-term genetic distance. Genetics 1983, 105, 767. [Google Scholar] [CrossRef]
- Weir, B.S.; Cockerham, C.C. Estimating F-Statistics for the Analysis of Population Structure. Evolution 1984, 38, 1358–1370. [Google Scholar] [CrossRef]
- Slatkin, M. Inbreeding coefficients and coalescence times. Genet. Res. 1991, 58, 167–175. [Google Scholar] [CrossRef]
- Raymond, M.; Rousset, F. An Exact Test for Population Differentiation. Evolution 1995, 49, 1280–1283. [Google Scholar] [CrossRef] [PubMed]
- Slatkin, M. Isolation by Distance in Equilibrium and Non-Equilibrium Populations. Evolution 1993, 47, 264–279. [Google Scholar] [CrossRef]
- Benjamini, Y.; Hochberg, Y. Controlling the False Discovery Rate: A Practical and Powerful Approach to Multiple Testing. J. R. Stat. Soc. Ser. B. 1995, 57, 289–300. [Google Scholar] [CrossRef]
- Jafari, M.; Ansari-Pour, N. Why, When and How to Adjust Your P Values? Cell. J. 2019, 20, 604–607. [Google Scholar] [CrossRef]
- Salicrú, M.; Menendez, M.L.; Morales, D.; Pardo, L. Asymptotic distribution of (h, φ)-entropies. Commun. Stat. Theory Methods 1993, 22, 2015–2031. [Google Scholar] [CrossRef]
- Bandelt, H.J.; Forster, P.; Rohl, A. Median-joining networks for inferring intraspecific phylogenies. Mol. Biol. Evol. 1999, 16, 37–48. [Google Scholar] [CrossRef] [PubMed]
- Leigh, J.W.; Bryant, D. popart: Full-feature software for haplotype network construction. Methods Ecol. Evol. 2015, 6, 1110–1116. [Google Scholar] [CrossRef]
- R Development Core Team. R: A Language and Environment for Statistical Computing; V. 3.6.1; R Foundation for Statistical Computing: Vienna, Austria, 2006. [Google Scholar]
- Dupanloup, I.; Schneider, S.; Excoffier, L. A simulated annealing approach to define the genetic structure of populations. Mol. Ecol. 2002, 11, 2571–2581. [Google Scholar] [CrossRef] [PubMed]
- Excoffier, L.; Smouse, P.E.; Quattro, J.M. Analysis of Molecular Variance Inferred from Metric Distances among DNA Haplotypes: Application to Human Mitochondrial DNA Restriction Data. Genetics 1992, 131, 479–491. [Google Scholar] [CrossRef] [PubMed]
- Roman, J.; Palumbi, S.R. Whales Before Whaling in the North Atlantic. Science 2003, 301, 508. [Google Scholar] [CrossRef]
- Garcia-Merchan, V.H.; Robainas-Barcia, A.; Abello, P.; Macpherson, E.; Palero, F.; Garcia-Rodriguez, M.; Gil de Sola, L.; Pascual, M. Phylogeographic patterns of decapod crustaceans at the Atlantic-Mediterranean transition. Mol. Phylogenet. Evol. 2012, 62, 664–672. [Google Scholar] [CrossRef]
- Goodman, K.R. Emerging Biodiversity: Diversification of the Hawaiian Nesosydne Planthoppers. Ph.D. Dissertation, University of California, Berkeley, Berkeley, CA, USA, 2010. [Google Scholar]
- Rogers, A.R.; Harpending, H. Population growth makes waves in the distribution of pairwise genetic differences. Mol. Biol. Evol. 1992, 9, 552–569. [Google Scholar] [CrossRef]
- Rogers, A.R. Genetic evidence for a Pleistocene population explosion. Evolution 1995, 49, 608–615. [Google Scholar] [CrossRef]
- Tajima, F. Evolutionary relationship of DNA sequences in finite populations. Genetics 1983, 105, 437–460. [Google Scholar] [CrossRef]
- Ramos-Onsins, S.E.; Rozas, J. Statistical properties of new neutrality tests against population growth. Mol. Biol. Evol. 2002, 19, 2092–2100. [Google Scholar] [CrossRef]
- Beerli, P.; Felsenstein, J. Maximum-likelihood estimation of migration rates and effective population numbers in two populations using a coalescent approach. Genetics 1999, 152, 763–773. [Google Scholar] [CrossRef]
- Hedgecock, D.; Pudovkin, A. Sweepstakes Reproductive Success in Highly Fecund Marine Fish and Shellfish: A Review and Commentary. Bull. Mar. Sci. 2011, 87, 971–1002. [Google Scholar] [CrossRef]
- Gricius, E.E. Population Structure in the Gulf Killifish Fundulus grandis (Teleostei: Cyprinodontidae) Inferred from Allozymes and Mitochondrial DNA. Master’s Thesis, Texas A&M University, College Station, TX, USA, 1994. [Google Scholar]
- Neigel, J.E. Population Genetics and Biogeography of the Gulf of Mexico. In Gulf of Mexico—Origins, Waters, and Biota. Biodiversity; Felder, D.L., Camp, D.K., Eds.; Texas A&M Univeristy Press: College Station, TX, USA, 2009; pp. 1353–1369. [Google Scholar]
- Portnoy, D.S.; Gold, J.R. Evidence of multiple vicariance in a marine suture-zone in the Gulf of Mexico. J. Biogeogr. 2012, 39, 1499–1507. [Google Scholar] [CrossRef]
- Portnoy, D.S.; Hollenbeck, C.M.; Belcher, C.N.; Driggers III, W.B.; Frazier, B.S.; Gelsleichter, J.; Grubbs, R.D.; Gold, J.R. Contemporary population structure and post-glacial genetic demography in a migratory marine species, the blacknose shark, Carcharhinus acronotus. Mol. Ecol. 2014, 23, 5480–5495. [Google Scholar] [CrossRef]
- King, T.L.; Ward, R.; Zimmerman, E.G. Population Structure of Eastern Oysters (Crassostrea virginica) Inhabiting the Laguna Madre, Texas, and Adjacent Bay Systems. Can. J. Fish. Aquat. Sci. 1994, 51, 215–222. [Google Scholar] [CrossRef]
- Barnwell, F.H.; Thurman, C.L. Taxonomy and biogeography of the fiddler crabs (Ocypodidae: Genus Uca) of the Atlantic and Gulf coasts of eastern North America. Zool. J. Linn. Soc. 2008, 81, 23–87. [Google Scholar] [CrossRef]
- McCusker, M.R.; Bentzen, P. Positive relationships between genetic diversity and abundance in fishes. Mol. Ecol. 2010, 19, 4852–4862. [Google Scholar] [CrossRef]
- Rogers, A.R.; Fraley, A.E.; Bamshad, M.J.; Watkins, W.S.; Jorde, L.B. Mitochondrial mismatch analysis is insensitive to the mutational process. Mol. Biol. Evol. 1996, 13, 895–902. [Google Scholar] [CrossRef]
- Harpending, H.C. Signature of Ancient Population Growth in a Low-Resolution Mitochondrial DNA Mismatch Distribution. Hum. Biol. 1994, 66, 591–600. [Google Scholar]
- Greenwood, M.F.D.; Stevens, P.W.; Matheson, R.E. Effects of the 2004 hurricanes on the fish assemblages in two proximate southwest Florida estuaries: Change in the context of interannual variability. Estuaries Coasts 2006, 29, 985–996. [Google Scholar] [CrossRef]
- Martin, C.W. Avoidance of oil contaminated sediments by estuarine fishes. Mar. Ecol. Prog. Ser. 2017, 576, 125–134. [Google Scholar] [CrossRef]
- Delcourt, P.A.; Delcourt, H.R. Late Pleistocene and Holocene distributional history of the deciduous forest in the southeastern United States. Veröffentlichen. Geobot. Forsch. Rübel Zur. 1979, 68, 29. [Google Scholar]
- Reeb, C.A.; Avise, J.C. A genetic discontinuity in a continuously distributed species: Mitochondrial DNA in the American oyster, Crassostrea virginica. Genetics 1990, 124, 397–406. [Google Scholar] [CrossRef] [PubMed]
- Quan, J.; Lu, X.; Zhuang, Z.; Dai, J.; Deng, J.; Zhang, Y. Low genetic variation of Penaeus chinensis as revealed by mitochondrial COI and 16S rRNA Gene Sequences. Biochem. Genet. 2001, 39, 6. [Google Scholar] [CrossRef]
- Mayr, E. Origin and History of Some Terms in Systematic and Evolutionary Biology. Syst. Zool. 1978, 27, 83–88. [Google Scholar] [CrossRef]
- Barton, N.H.; Charlesworth, B. Genetic Revolutions, Founder Effects, and Speciation. Annu. Rev. Ecol. Syst. 1984, 15, 133–164. [Google Scholar] [CrossRef]
- Denno, R.F.A.; Roderick, G.K. Population Biology of Planthoppers. Annu. Rev. Entomol. 1990, 35, 489–520. [Google Scholar] [CrossRef]
- Waples, R.S. Separating the wheat from the chaff: Patterns of genetic differentiation in high gene flow species. J. Hered. 1998, 89, 438–450. [Google Scholar] [CrossRef]
- Bohonak, A.J. Dispersal, Gene Flow, and Population Structure. Q. Rev. Biol. 1999, 74, 21–45. [Google Scholar] [CrossRef]
- Park, D.-S.; Foottit, R.; Maw, E.; Hebert, P.D.N. Barcoding Bugs: DNA-Based Identification of the True Bugs (Insecta: Hemiptera: Heteroptera). PLoS ONE 2011, 6, e18749. [Google Scholar] [CrossRef]


| Locus | Primer Names | Primer Sequence | Fragment Size | Annealing Temp. (°C) |
|---|---|---|---|---|
| F. grandis CR-1 1 | L15998-FG CSBD-H-FG | 5′ CGC CCC TAG CTC CCA AAG CTA 3′ 5′ AAT AGG AAC CAA ATG CCA G 3′ | 400 bp | 50 |
| F. grandis ND-2 2 | L4173ND2-FG H4634ND2-FG | 5′ CAT CAT CCC CGA GCC GTT GA 3′ 5′ GGA AGG TTA AGG ATG GGA AG 3′ | 421 bp | 50 |
| F. grandis ND-5 2 | L12137ND5-FG H12717ND5-FG | 5′ GCA GAA ACG GTA GTG TCC AC 3′ 5′ GTA CTT GAA TGC AGT AGG GC 3′ | 540 bp | 50 |
| P. pugio 16sRNA 3 | L-16sRNA-PP H-16sRNA-PP | 5′ TGC CCT GTT TAT CAA AAA CAT 3′ 5′ AGA TAG AAA CCC AAC CTG G 3′ | 470 bp | 50 |
| P. marginata COI 4 | C1-J-1751 C1-N-2197 | 5′ GGA TCA CCT GAT ATA GCA TTC CC 3′ 5′ CCC GGT AAA ATT AAA ATA TAA ACT TC 3′ | 400 bp | 57 |
| Location | N | M | h (SD) | π (SD) | S | Ts | Tv | I/D |
|---|---|---|---|---|---|---|---|---|
| Corpus Christi | 26 | 15 | 0.945 (0.024) | 0.013 (0.007) | 64 | 55 | 7 | 2 |
| Matagorda | 18 | 16 | 0.980 (0.028) | 0.019 (0.010) | 64 | 55 | 9 | 2 |
| Reitan Marsh | 29 | 24 | 0.988 (0.012) | 0.019 (0.010) | 77 | 71 | 5 | 2 |
| Sportsman’s | 24 | 23 | 0.956 (0.015) | 0.020 (0.010) | 80 | 70 | 10 | 3 |
| Venice | 36 | 18 | 0.886 (0.037) | 0.004 (0.002) | 37 | 30 | 8 | 0 |
| Ocean Springs | 33 | 26 | 0.983 (0.012) | 0.007 (0.003) | 54 | 43 | 13 | 1 |
| All Samples | 166 | 109 | 0.987 (0.003) | 0.018 (0.009) | 176 | 142 | 34 | 4 |
| Corpus Christi | Matagorda | Reitan Marsh | Sportsman’s | Venice | Ocean Springs | |
|---|---|---|---|---|---|---|
| Corpus Christi | −0.949 | −1.603 | −0.389 | 1.338 | −1.416 | |
| Matagorda | 0.18880 ** | −0.263 | 0.756 | 2.026 * | −0.098 | |
| Reitan Marsh | 0.13947 ** | −0.01239 | 1.666 * | 2.622 ** | 0.295 | |
| Sportsman’s | 0.20315 ** | −0.02873 | −0.00191 | 1.753 * | −1.406 | |
| Venice | 0.67054 ** | 0.42053 ** | 0.44186 ** | 0.37772 ** | −2.494 ** | |
| Ocean Springs | 0.63133 ** | 0.37057 ** | 0.40474 ** | 0.34059 ** | 0.03746 * |
| Corpus Christi | Matagorda | Reitan Marsh | Sportsman’s | Venice | Ocean Springs | |
|---|---|---|---|---|---|---|
| Corpus Christi | 0.03221 | 0.03032 | 0.03539 | 0.08943 | 0.03664 | |
| Matagorda | 0.03274 | 0.00638 | 0.01289 | 0.07185 | 0.01846 | |
| Reitan Marsh | 0.03079 | 0.00640 | 0.00000 | 0.06613 | 0.01480 | |
| Sportsman’s | 0.03602 | 0.01297 | 0.00000 | 0.06741 | 0.01578 | |
| Venice | 0.09355 | 0.07449 | 0.06836 | 0.06973 | 0.03300 | |
| Ocean Springs | 0.03732 | 0.01863 | 0.01491 | 0.01591 | 0.03355 |
| Source of Variation | d.f. | Sum of Squares | Variance Components | Percentage of Variation |
|---|---|---|---|---|
| Among Groups | 2 | 485.23 | 4.5071 Va | 39.45 |
| Among Populations Within Groups | 3 | 21.83 | 0.0135 Vb | 0.12 |
| Within Populations | 163 | 1125.51 | 6.9050 Vc | 60.43 |
| Total | 168 | 1632.57 | 11.42551 | |
| Fixation Indices | p-values (≥) | |||
| FSC: | 0.45064 ± 0.01396 | |||
| FST: | 0.00000 ± 0.00000 | |||
| FCT: | 0.01271 ± 0.00366 | |||
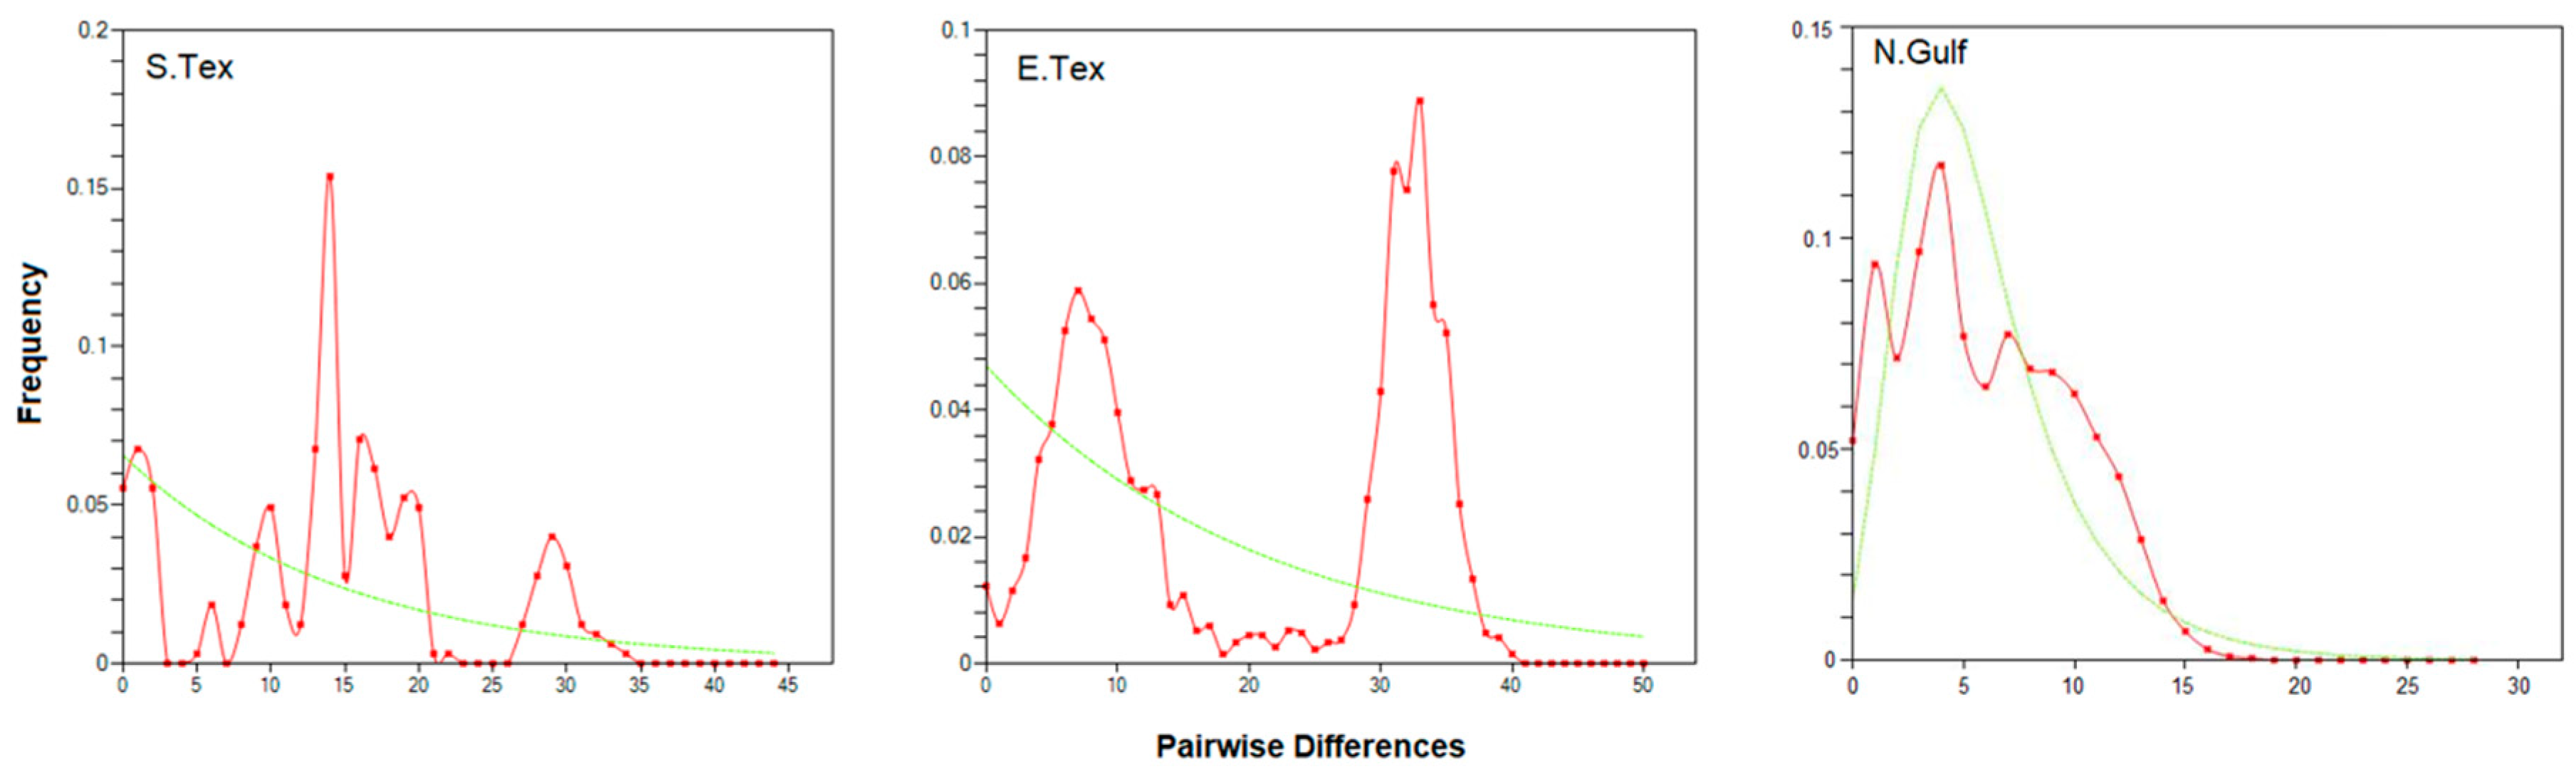
| Population | Da | τ | D (p) | R2 (p) | T | Nef |
|---|---|---|---|---|---|---|
| S.Tex | 0.076 | 6.50 | −0.483 (0.346) | 0.109 (0.368) | 0.50 | 50.48 |
| 1.25 | 126.21 | |||||
| 4.8 | 484.65 | |||||
| E.Tex | 0.072 | 8.62 | −0.343 (0.424) | 0.888 (0.417) | 0.50 | 80.74 |
| 1.25 | 201.84 | |||||
| 4.8 | 775.07 | |||||
| CN.Gulf | 0.078 | 2.95 | −2.058 (0.003) | 0.035 (0.001) | 0.50 | 18.89 |
| 1.25 | 47.23 | |||||
| 4.8 | 181.35 |
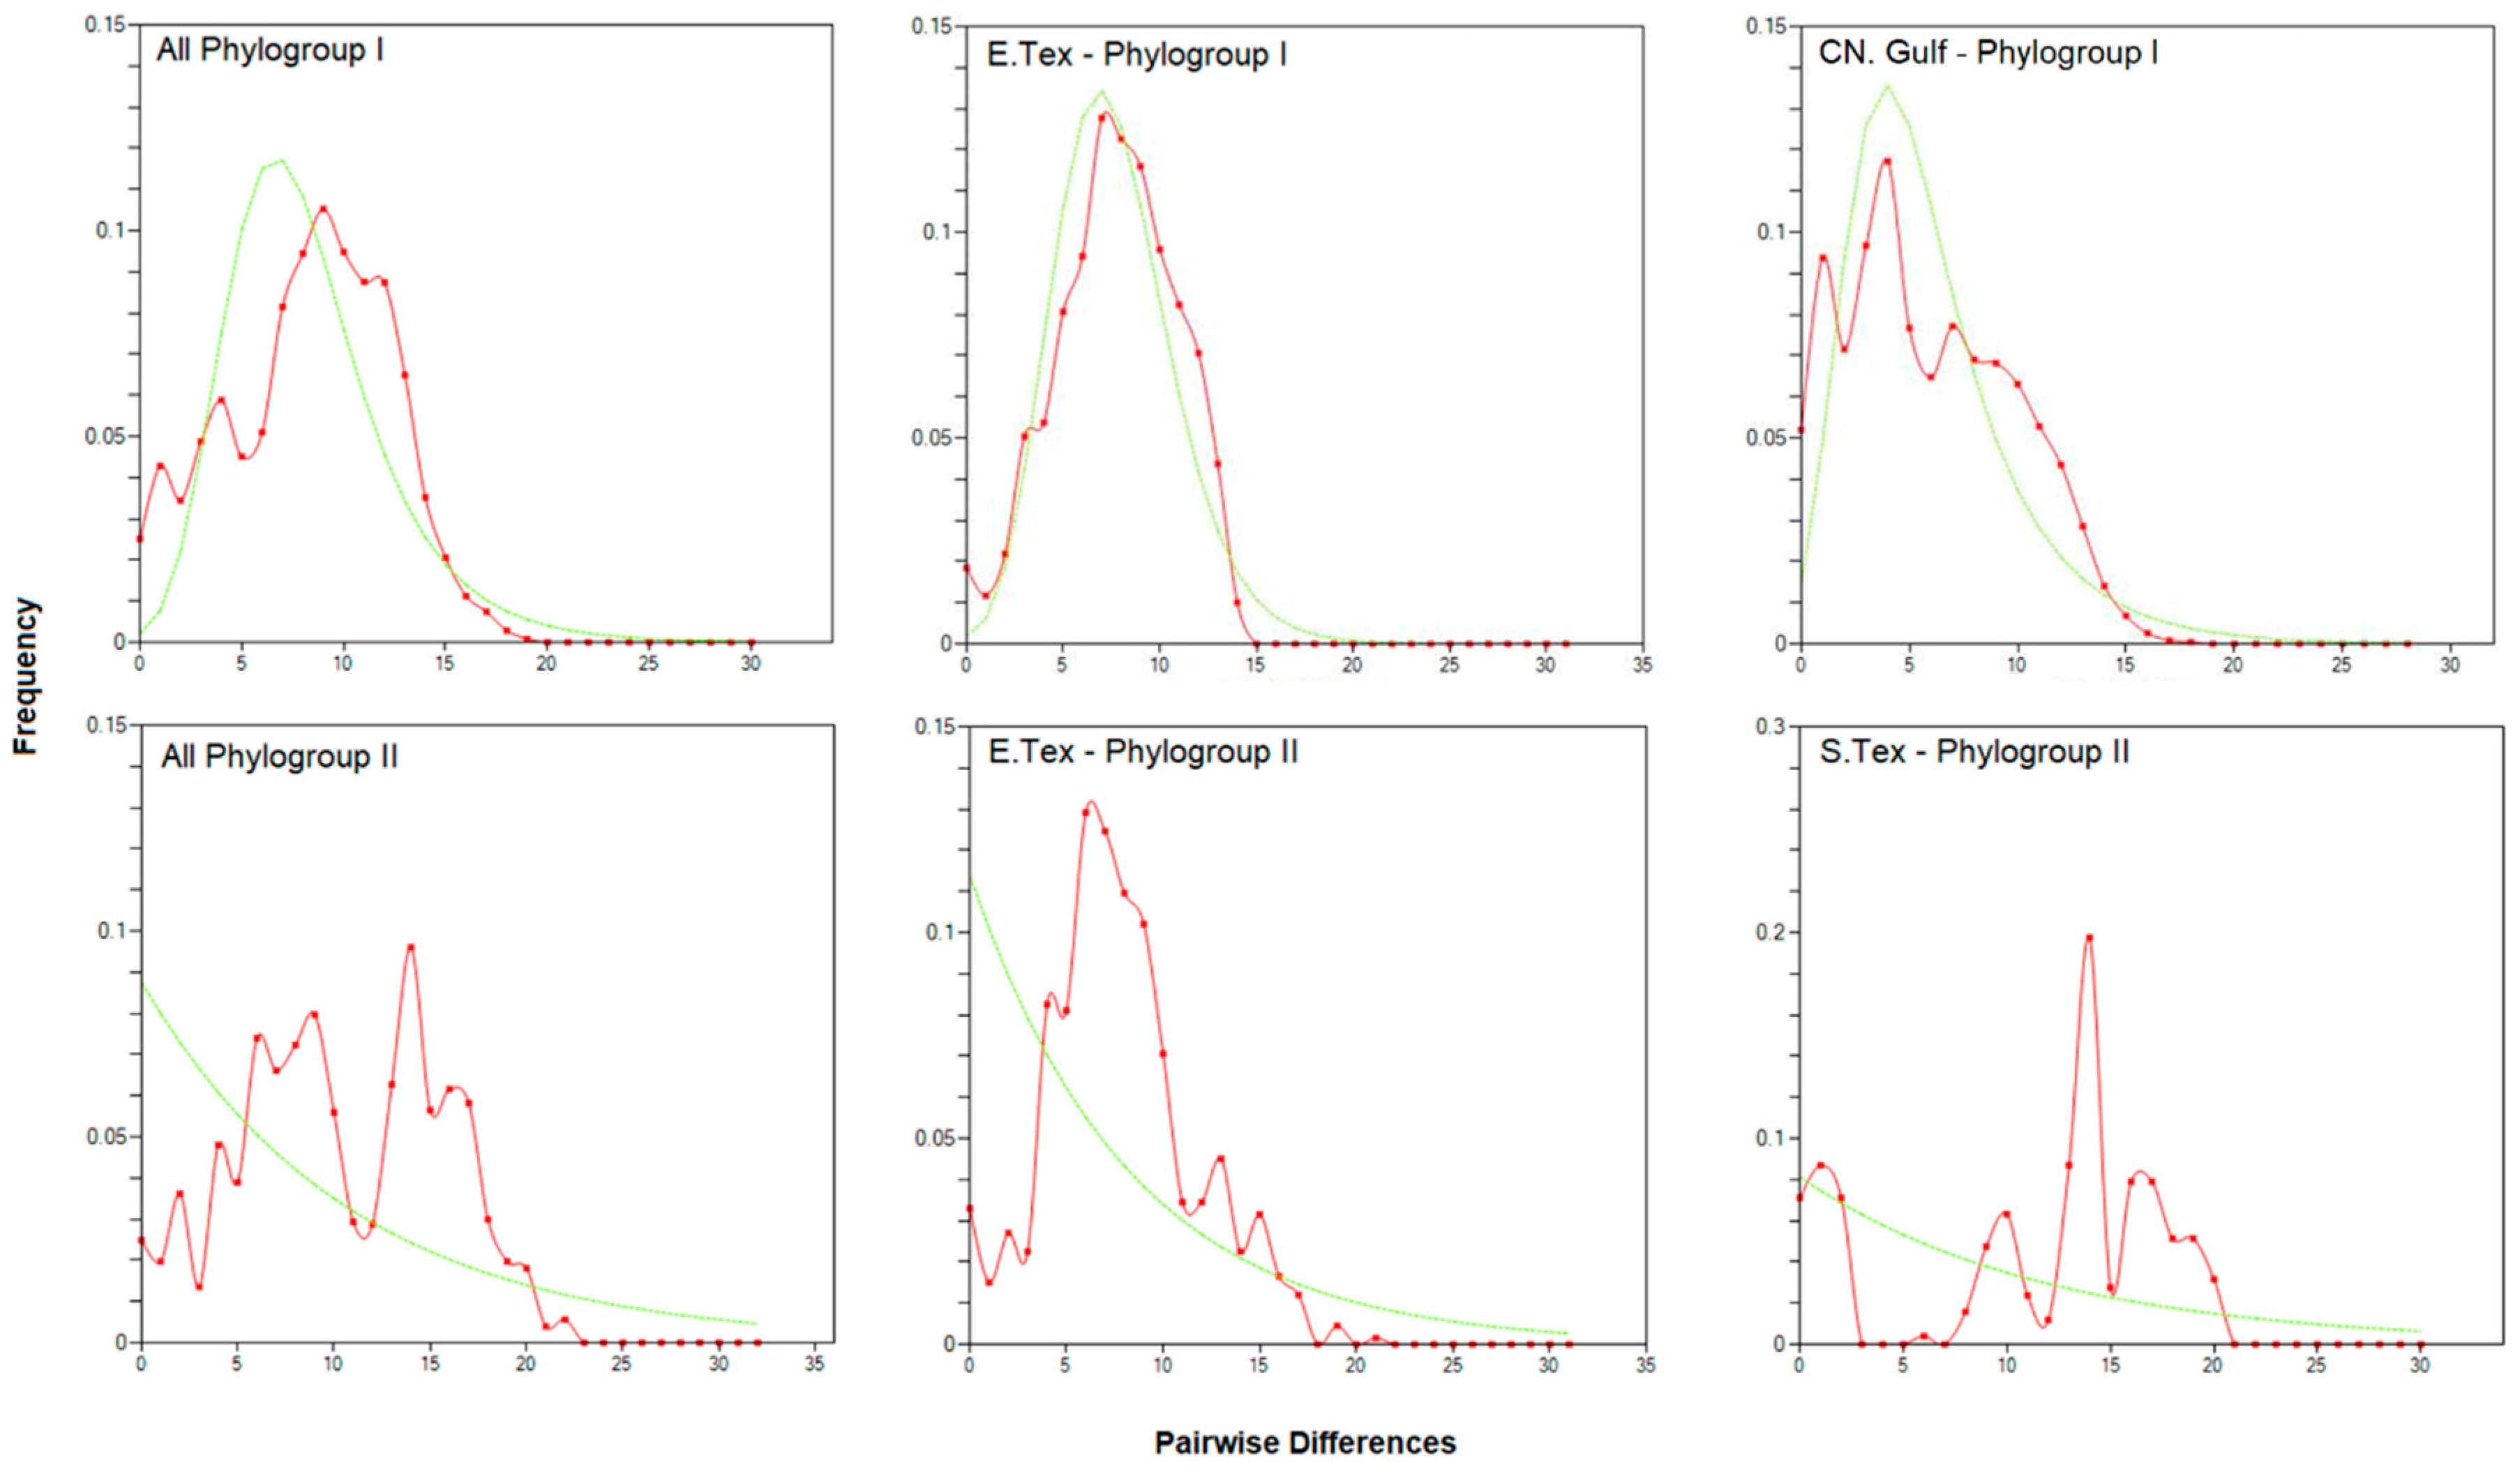
| Grouping | Da | τ | D (p) | R2 (p) | T | Nef |
|---|---|---|---|---|---|---|
| Phylogroup I | 0.076 | 5.63 | −2.019 (0.003) | 0.034 (0.005) | 0.50 | 17.76 |
| All Lineages | 1.25 | 44.39 | ||||
| 4.8 | 170.43 | |||||
| Phylogroup I | 0.074 | 6.34 | −1.578 (0.043) | 0.059 (0.011) | 0.50 | 9.41 |
| E.Tex Linages | 1.25 | 23.51 | ||||
| 4.8 | 90.29 | |||||
| Phylogroup I | 0.078 | 2.95 | −2.058 (0.003) | 0.035 (0.001) | 0.50 | 18.89 |
| CN.Gulf Lineages | 1.25 | 47.23 | ||||
| 4.8 | 181.35 | |||||
| Phylogroup II | 0.79 | 6.19 | −1.106 (0.127) | 0.069 (0.127) | 0.50 | 26.10 |
| All Lineages | 1.25 | 65.25 | ||||
| 4.8 | 250.57 | |||||
| Phylogroup II | 0.81 | 5.16 | −1.312 (0.076) | 0.071 (0.064) | 0.50 | 16.14 |
| E.Tex Lineages | 1.25 | 40.34 | ||||
| 4.8 | 150.25 |
| Location | N | M | h (SD) | π (SD) | S | Ts | Tv | I/D |
|---|---|---|---|---|---|---|---|---|
| Port Mansfield, TX | 20 | 1 | 0.000 (0.000) | 0.000 (0.000) | 0 | 0 | 0 | 0 |
| Matagorda, TX | 20 | 4 | 0.284 (0.128) | 0.001 (0.000) | 3 | 1 | 1 | 0 |
| Sportsman’s Rd, TX | 20 | 1 | 0.000 (0.000) | 0.000 (0.000) | 0 | 0 | 0 | 0 |
| Pt. Arthur, TX | 20 | 2 | 0.100 (0.088) | 0.001 (0.000) | 1 | 0 | 0 | 0 |
| Venice, LA | 19 | 4 | 0.667 (0.086) | 0.002 (0.002) | 3 | 1 | 1 | 0 |
| Ocean Springs, MS | 20 | 6 | 0.811 (0.047) | 0.003 (0.003) | 5 | 2 | 2 | 0 |
| All Samples | 119 | 13 | 0.779 (0.021) | 0.005 (0.003) | 9 | 6 | 3 | 0 |
| Pt. Mansfield | Matagorda | Sportsman’s | Pt. Arthur | Venice | Ocean Springs | |
|---|---|---|---|---|---|---|
| Pt. Mansfield | −2.219 * | 0.000 | −1.136 | −7.756 ** | −17.255 ** | |
| Matagorda | 0.93285 ** | 2.219 * | 1.185 | −2.484 ** | −3.865 ** | |
| Sportsman’s | 1.000000 ** | 0.96026 ** | −1.136 | −7.756 ** | −17.255 ** | |
| Pt. Arthur | 0.98361 ** | 0.02105 | 0.99010 ** | −4.608 ** | −7.127 ** | |
| Venice | 0.45823 ** | 0.81601 ** | 0.65339 ** | 0.86007 ** | −1.469 | |
| Ocean Springs | 0.46252 ** | 0.40897 ** | 0.73527 ** | 0.47953 ** | 0.41360 ** |
| Source of Variation | d.f. | Sum of Squares | Variance Components | Percentage of Variation |
|---|---|---|---|---|
| Among Groups | 4 | 104.55 | 1.1235 Va | 80.72 |
| Among Populations Within Groups | 1 | 0.18 | −0.0049 Vb | −0.35 |
| Within Populations | 113 | 30.87 | 0.2732 Vc | 19.63 |
| Total | 118 | 135.60 | ||
| Fixation Indices | p-values (≥) | |||
| FSC: | 0.49365 ± 0.01428 | |||
| FST: | 0.00000 ± 0.00000 | |||
| FCT: | 0.06940 ± 0.00845 | |||
| Species | Da | τ | μ | D (p) | R2 (p) | Nef |
|---|---|---|---|---|---|---|
| P. pugio | 0.0695 | 1.435 | 0.009 | 0.893 (0.824) | 0.126 (0.832) | 2.359 |
| 0.011 | 1.930 | |||||
| P. marginata | 0.0470 | 0.258 | 0.027 | −0.927 (0.214) | 0.043 (0.168) | 0.444 |
| Location | N | M | h (SD) | π (SD) | S | Ts | Tv | I/D |
|---|---|---|---|---|---|---|---|---|
| South Padre | 20 | 1 | 0.000 (0.000) | 0.000 (0.000) | 0 | 0 | 0 | 0 |
| Corpus Christi | 19 | 2 | 0.409 (0.100) | 0.001 (0.001) | 1 | 1 | 0 | 0 |
| Matagorda | 20 | 2 | 0.442 (0.088) | 0.001 (0.001) | 1 | 1 | 0 | 0 |
| Reitan Marsh | 24 | 1 | 0.000 (0.000) | 0.000 (0.000) | 0 | 0 | 0 | 0 |
| Sportsman’s | 21 | 3 | 0.267 (0.120) | 0.001 (0.001) | 2 | 2 | 0 | 0 |
| Pt. Arthur | 20 | 3 | 0.279 (0.012) | 0.001 (0.001) | 2 | 2 | 0 | 0 |
| All Samples | 124 | 4 | 0.248 (0.049) | 0.001 (0.001) | 3 | 3 | 0 | 0 |
| Source of Variation | d.f. | Sum of Squares | Variance Components | Percentage of Variation |
|---|---|---|---|---|
| Among Groups | 1 | 2.20 | 0.399 Va | 26.39 |
| Among Populations Within Groups | 4 | 0.27 | −0.0023 Vb | −1.50 |
| Within Populations | 118 | 13.40 | 0.1135 Vc | 75.11 |
| Total | 123 | 135.60 | 1.31703 | |
| Fixation Indices | p-values (≥) | |||
| FSC: | 0.64027 ± 0.01649 | |||
| FST: | 0.00000 ± 0.00000 | |||
| FCT: | 0.07136 ± 0.00884 | |||
| South Padre | Corpus Christi | Matagorda | Reitan Marsh | Sportsman’s | Pt. Arthur | |
|---|---|---|---|---|---|---|
| South Padre | −4.090 ** | −5.023 ** | 0.000 | −2.225 * | −23.250 ** | |
| Corpus Christi | 0.93285 ** | −0.248 | 4.090 ** | 0.909 | 1.291 | |
| Matagorda | 1.000000 ** | 0.96026 ** | 5.023 ** | 1.176 | 1.835 * | |
| Reitan Marsh | 0.98361 ** | 0.02105 | 0.99010 ** | −2.225 * | −23.250 ** | |
| Sportsman’s | 0.45823 ** | 0.81601 ** | 0.65339 ** | 0.86007 ** | −0.099 | |
| Pt. Arthur | 0.46252 ** | 0.40867 ** | 0.73527 ** | 0.47953 ** | 0.41360 ** |
Disclaimer/Publisher’s Note: The statements, opinions and data contained in all publications are solely those of the individual author(s) and contributor(s) and not of MDPI and/or the editor(s). MDPI and/or the editor(s) disclaim responsibility for any injury to people or property resulting from any ideas, methods, instructions or products referred to in the content. |
© 2023 by the authors. Licensee MDPI, Basel, Switzerland. This article is an open access article distributed under the terms and conditions of the Creative Commons Attribution (CC BY) license (https://creativecommons.org/licenses/by/4.0/).
Share and Cite
Espinoza, G.J.; Alvarado Bremer, J.R. Comparative Phylogeography, Historical Demography, and Population Genetics of Three Common Coastal Fauna in Spartina Marshes of the Northwestern Gulf of Mexico. Diversity 2023, 15, 792. https://doi.org/10.3390/d15060792
Espinoza GJ, Alvarado Bremer JR. Comparative Phylogeography, Historical Demography, and Population Genetics of Three Common Coastal Fauna in Spartina Marshes of the Northwestern Gulf of Mexico. Diversity. 2023; 15(6):792. https://doi.org/10.3390/d15060792
Chicago/Turabian StyleEspinoza, Gloria Janelle, and Jaime R. Alvarado Bremer. 2023. "Comparative Phylogeography, Historical Demography, and Population Genetics of Three Common Coastal Fauna in Spartina Marshes of the Northwestern Gulf of Mexico" Diversity 15, no. 6: 792. https://doi.org/10.3390/d15060792
APA StyleEspinoza, G. J., & Alvarado Bremer, J. R. (2023). Comparative Phylogeography, Historical Demography, and Population Genetics of Three Common Coastal Fauna in Spartina Marshes of the Northwestern Gulf of Mexico. Diversity, 15(6), 792. https://doi.org/10.3390/d15060792