Article

Distribution Patterns of Large Jellyfish and Their Effects on the Zooplankton Community in the Northern Chinese Coastal Seas during the Summer of 2021

1
CAS Key Laboratory of Marine Ecology and Environmental Sciences, Institute of Oceanology, Chinese Academy of Sciences, Qingdao 266071, China
2
College of Marine Science, University of Chinese Academy of Sciences, Qingdao 266071, China
3
Jiaozhou Bay National Marine Ecosystem Research Station, Institute of Oceanology, Chinese Academy of Sciences, Qingdao 266071, China
*
Authors to whom correspondence should be addressed.
These authors contributed equally to this work.
Diversity 2023, 15(6), 729; https://doi.org/10.3390/d15060729
Submission received: 4 April 2023 / Revised: 27 April 2023 / Accepted: 29 May 2023 / Published: 1 June 2023

Abstract

:
The northern Chinese coastal seas have been observed to constitute a large jellyfish blooming hotspots during the las decades. The spatial distribution of the abundance and biomass of large jellyfish was investigated in this area through a bottom trawl survey during the summer of 2021. Nemopilema nomurai, Cyanea spp., Aurelia coerulea, Aequorea spp., and Ulmaridae (undefined sp.) were identified during the investigation. The realized niches of the three most abundant species (N. nomurai, Cyanea spp., and A. coerulea) were measured through the maximum entropy (MaxEnt) model to explain their spatial distribution patterns. Nemopilema nomurai was used as a representative species to estimate the feeding rate and feeding pressure of large jellyfish on the zooplankton. During N. nomurai blooms, the potential consumption of zooplankton by N. nomurai was enormous and even exceeded the zooplankton productivity in regions where N. nomurai assembled in this study. Reductions in absolute and relative abundance were noted in small copepods at mid-bloom and bloom stations compared to non-bloom stations. The realized niches of large jellyfish and their relationships with the zooplankton in this study would be helpful for understanding their biogeographic distribution and ecological roles in the northern Chinese coastal seas under future climate change scenarios.

1. Introduction

In recent decades, large jellyfish blooms have been reported in various marine areas, and fluctuations in the population size of large jellyfish have attracted increasing worldwide attention due to their detrimental impact on marine fisheries and aquaculture [1,2,3,4]. Large jellyfish blooms are thought to be influenced by changes in the coastal environment resulting from both climate change and anthropogenic disturbances [5,6,7,8]. The global ecosystem is undergoing rapid and widespread change, and climate change will continue to increase [9]. Predicting the population variations of large jellyfish under future scenarios is critical to managing fishery resources and marine ecosystem health.
The northern Chinese coastal seas (i.e., the northern East China Sea (nECS), Yellow Sea (YS), and Bohai Sea (BS)) are one of the largest jellyfish blooming hotspots [10,11,12,13,14]. There has been a general increase in blooms of large jellyfish in summer and autumn in this area, such as Nemopilema nomurai, Cyanea spp., and Aurelia coerulea, over the past few decades. However, this trend has reversed or paused in the past 10 years, with a decline in jellyfish abundance observed during this period [10,11,12,13,15]. Scientists have conducted a large number of field studies on the northern Chinese coastal seas and laboratory experiments to demonstrate the population dynamics and spatial–temporal distribution [11,13,16], bloom mechanisms [17,18,19], and ecological roles of large jellyfish [12,20,21]. Among them, N. nomurai is one of the most dominant species, with an extensive distribution in this area, and it has exhibited high interannual variability in its population size since the consecutive outbreaks in 2002 [11,13,16,22]. Compared to N. nomurai, Cyanea spp. is a warmer-water species that is distributed mainly in the East China Sea and BS [10,11]. Cyanea spp. has a complex trophic relationship with other zooplankton. The stable isotope result showed that there was an intraguild predation of C. nozakii on N. nomurai and small medusae in the nECS [20]. Aurelia coerulea is a cosmopolitan scyphomedusan that blooms mainly in harbors and inshore areas, including Jiaozhou Bay and the BS, in the Chinese seas [10,23]. Due to the lack of a whole and systematic survey of large jellyfish in the northern Chinese coastal seas, an overall analysis of large jellyfish in this area is limited. According to previous research, the interannual variation of the large jellyfish population was related to climate variability [5,6,7,24]. The Pacific Decadal Oscillation (PDO), a significant climate mode that controls the North Pacific ecosystems [25], moves into a negative phase in 2020 after an oscillation (https://www.ncei.noaa.gov/pub/data/cmb/ersst/v5/index/ersst.v5.pdo.dat, accessed on 1 December 2022). Thus, this study is also an important data supplement to the mechanisms research of large jellyfish interannual variation.
Research on the realized niches of plankton is beneficial to better reveal the relationships between environmental variables and plankton, which is valuable for understanding the mechanisms of their temporal and spatial distribution, as well as their population variation under climate change [26,27,28]. The realized niches, which could be inferred from species distribution data and associated environmental data through the maximum entropy (MaxEnt) model, describe the environmental and biotic conditions occupied by a species [26]. Compared to the fundamental niche, where a species could persist according to its physiology, the realized niche includes the effects of ecological interactions as a subset of the fundamental niche where the species is found [27]. This method has been used to explain the response of plankton to fluctuations in multiple environmental variables—for example, the ecological response of phytoplankton species to environmental variables in the North Atlantic [27], the mechanisms explanation for biogeographic patterns of phytoplankton communities in the South China Sea [28], the comparison of copepod niches between the North Atlantic and Southern Ocean [29], and the future global distribution map of Craspedacusta sowerbii under climate change scenarios [30].
In addition to population variations, interest in the ecology of large jellyfish has expanded during the last three decades due to the frequent appearance of these gelatinous organisms and their consequences on ecosystems [31,32]. The fluctuations in large jellyfish populations may affect fishery stocks by affecting the zooplankton community composition [2,3,15,33]. The results of gastric content and stable isotope analyses showed that large jellyfish predominantly prey on micro- and mesozooplankton such as copepods, ciliates, and fish eggs and may act as potential competitors with zooplanktivorous fish [20,34,35]. Mature Cyanea nozakii individuals feed mainly on zooplankton, with copepods being an important food source [20]. The feeding rate and feeding pressure of N. nomurai on the standing stock and production rate of zooplankton during the blooming period in the nECS and southern YS in summer 2006 and 2007 were estimated, indicating that the potential consumption of zooplankton at N. nomurai assemblage areas was enormous and damaging to the zooplankton community [36]. The number of fish species and catch per unit effort (CPUE) declined in summer 2003 (a bloom year with large jellyfish ≥14 × 103 kg·h−1) compared to 1999–2001 (non-bloom years with large jellyfish ≤3 × 10³ kg·h−1) in large-jellyfish-dense regions of the nECS [37]. Thus, it is recognized that the high feeding pressure of large jellyfish blooms could control the abundance of zooplankton via top-down control [20,38,39,40,41]. Although an important fishing ground, there is a lack of research on the relationship between large jellyfish and zooplankton in the northern Chinese coastal seas—for example, on the community composition, spatial distribution, and abundance fluctuation of large jellyfish and zooplankton.
Here, a comprehensive, large-scale fishery survey was designed and conducted in summer 2021 in the northern Chinese coastal seas. By investigating environmental variables, the species composition, abundance, and biomass, realized niches of large jellyfish, abundance, production rate, and composition of zooplankton, and grazing rate of N. nomurai on zooplankton, the following scientific issues were tested. The first research goal was to construct the distribution patterns of large jellyfish in summer 2021 in the surveyed area and to provide a database for studying the interannual variations in large jellyfish population size. The second research goal was to characterize the realized niches for large jellyfish, which will be helpful to understand their biogeographic distribution in this area and to forecast possible consequences of climate change. The third research goal was to determine whether the large jellyfish bloom would have a negative effect on the zooplankton community.

2. Materials and Methods

2.1. Study Area

The bottom trawl survey was conducted in the northern East China Sea (ECS), Yellow Sea (YS), and Bohai Sea (BS) aboard the R/V “Beidou” from August 2nd to September 11th, 2021, to investigate the characteristics of the large jellyfish population and its relationship with the zooplankton community. The sampling stations during the cruise are shown in Figure 1. The sampling depth ranged from 13 to 83 m. To compare the ecological characteristics of large jellyfish in different regions, the whole study area was divided into three parts from south to north: the nECS, YS, and BS (Figure 1).

2.2. Sampling

Large jellyfish individuals were collected using a bottom trawl net with a total length of 83.2 m, an opening circumference of 167.2 m (836 mesh × 20 cm), an opening height of 7 m, an opening width of 22 m, and a 10 cm mesh size cod-end with a 2.4 cm mesh liner [11]. During trawling, the towing speed was approximately 3 kt·h−1 (5.556 km·h−1), and the duration of the trawl hauls at each station was approximately 0.5 h. As soon as the trawl was hauled onboard, the species and number of large jellyfish were enumerated, and the bell diameter of each specimen was unintentionally measured. The abundance and biomass of each large jellyfish were estimated according to Zhang et al. [11] and expressed as ind.·km−2 and kg·km−2, respectively.
Zooplankton (>160 µm) samples were collected vertically at ~1 m·s−1 from the bottom to the surface of the water column using a plankton net (mesh size 160 μm, 50 cm mouth diameter, 0.2 m2 mouth area) in the nECS and southern YS. The zooplankton samples were immediately preserved in 5% neutral formalin and then digitized with a ZooScan (Hydroptic, Occitanie, France) digital imaging system with an 11 × 24 cm scanning frame and 4800 dpi. Following that, the samples were examined using Zooprocess software, and all individuals were counted, quantified, and identified [42]. Plankton Identifier software was used for automatic recognition through supervised learning [43]. To understand the ecological role of large jellyfish and their relationship with zooplankton, the zooplankton community was classified into seven functional groups in this study: giant crustaceans (euphausiids, luciferidae, amphipods, etc.), large copepods (>1000 μm), small copepods (<1000 μm), tunicates, chaetognaths, medusae (hydromedusae, siphonophore, ctenophore, etc.), and other organisms, according to the zooplankton functional groups [44] and the prey size of N. nomurai [40]. The abundance of each zooplankton group was calculated and expressed as ind.·m−3.
Environmental data including temperature (°C), salinity, and chlorophyll a concentration (mg·m−3) were sampled at the sea bottom layer at each station throughout the whole cruise using a Seabird-25 PLUS conductivity–temperature–depth (CTD). “Sea bottom layer” refers to the deepest depth that the CTD instrument could lower to.

2.3. Data Analysis

2.3.1. Realized Niches of Large Jellyfish

The realized niches of large jellyfish were calculated through the maximum entropy models (MaxEnt; https://biodiversityinformatics.amnh.org/open_source/maxent/, accessed on 1 September 2022, version 3.4.4) that combine large jellyfish with corresponding environmental data [27,28,45]. The MaxEnt method is a statistical machine-learning technique that utilizes species presence-only records along with corresponding environmental data to estimate the functional relationships with the full environmental data as background. Data on species absence, abundance and biomass are not required in MaxEnt [45]. Before modeling, pair plots of environmental variables were used to check for collinearity with the R package ‘GGally’, using an |r| > 0.70 to remove multiple collinearity [46]. According to the results of the collinearity analysis, depth and temperature, as well as depth and chlorophyll a concentration, exhibited a high degree of collinearity with |r| > 0.70 (Figure S1). Thus, the environmental variables used to calculate the realized niches of large jellyfish in this study were temperature, salinity, and chlorophyll a concentration. Two sets of models were constructed through MaxEnt software: one set using all of the environmental factors to assess the model feasibility, and another set including only one environmental factor at a time to characterize how the species responded to each environmental condition individually, as advised by the MaxEnt software tutorial [27,45]. During the MaxEnt analysis, 75% of the presence data was randomly selected for model training, and the rest was used to test the model performance. The MaxEnt analysis performed 100 bootstrap resampling replicates for each species and recorded the logistic probability. All the other adjustable parameters in the MaxEnt software were kept at their default settings. The model formations were created as follows:
p ( y = 1 | x ) = p y = 1   f 1   x / f x
where  p ( y = 1 | x )  was estimated through the MaxEnt method, representing the conditional probability of finding the species in a particular environment.  p y = 1  was the probability that the species would be found in a random sample, regardless of the environment.  f x  and  f 1 x  were the probabilities estimated for the environmental variables of all the stations (considered background data) and for the environmental variables of the stations where the species were known to exist, respectively. The accuracy of the MaxEnt model was confirmed by receiver operating characteristic (ROC) curve analysis and further summarized by the area under the ROC curve (AUC). The AUC value of the MaxEnt model ranges from 0 to 1, and an AUC closer to 1 indicates a better model fit [27,47].
The mean realized niche ( u ) and breadth of the realized niche ( σ ) were defined based on the univariate response function  f x  derived from the MaxEnt software, representing a simple description of the realized niche of a species [27]. Furthermore, the realized niches for pairs of environmental variables were compared, two variables at a time, to examine the similarities and differences across all large jellyfish species [28]. The mean and breadth of the realized niche were calculated as follows:
u = x f x d x / ( f x d x )
σ 2 = x u 2 f x d x / ( f x d x )

2.3.2. The Feeding Pressure of Large Jellyfish on Zooplankton

Considering that N. nomurai accounted for more than 95% of the biomass of large jellyfish in summer 2021 in the nECS and southern YS, N. nomurai can be used as the representative research target to represent the feeding rate of large jellyfish and their feeding pressure on the standing stock and production rate of zooplankton, as well as the relationship between fluctuations in the population size of large jellyfish and zooplankton communities. The feeding rate ( F j e l l y , mgC·m−2·d−1) included the amount of carbon required for metabolism and the amount required for individual growth [40].
F j e l l y = K × R × R Q j e l l y × 24 × W W j e l l y / A e + g × C W j e l l y / A e
where  F j e l l y  represented the feeding rate of N. nomurai, the conversion constant ( K ) was 0.375 mgC·mgO2−1 [36], and the respiration rate ( R ) was 17.15 mg O2·kg−1·h−1 [40]. The  g  represented the growth rate, which was set as 0.02 [36]. The  W W j e l l y  represented the wet biomass (mg·m−2), and  C W j e l l y  represented the carbon biomass (mgC·m−2), which was equivalent to 0.28% of the  W W j e l l y  [36]. The assimilation efficiency ( A e ) and respiratory entropy ( R Q j e l l y ) were 0.8 [48].
The wet weight ( W W z o o , mg·m−2) of zooplankton was directly obtained in the laboratory using an electronic balance. The dry weight ( D W z o o , mg·m−2) of zooplankton was converted from the  W W z o o  according to Wiebe et al. [49], and the carbon weight ( C W z o o , mgC·m−2) was 40% of the  D W z o o  [50]. The zooplankton production rate ( P z o o d a i l y , mgC·m−2·d−1) was calculated according to Huo et al. [51]. The zooplankton productivity ( P z o o , mgC·animal−1·h−1) was calculated through the respiration rates ( R O 2 , μLO2·animal−1·h−1), which depended on the dry weight of the zooplankton ( D W z o o , mg·animal−1) and temperature ( T , °C) of the habitat [52]. After that, the respiration rate ( R O 2 ) was expressed in terms of carbon units ( R C , mgC·animal−1·h−1), assuming an  R Q z o o  of 0.8 [53]. The gross growth efficiency and assimilation efficiency of zooplankton were considered to be 0.3 and 0.7, respectively [52]. The zooplankton productivity ( P z o o ) was equal to 0.75· R C  [54]. The daily zooplankton production rate ( P z o o d a i l y ) was equal to the productivity ( P z o o ) multiplied by the zooplankton abundance (ind./m3), 24 h and depth (m). The calculation process of zooplankton production was as follows:
l n R O 2 = 0.2512 + 0.7886 × l n W z o o + 0.0490 × T
R C = R O 2 × R Q z o o × 12 / 1000 × 24
P z o o d a i l y = P z o o × A b u n d a n c e × 24 × d e p t h
The feeding pressure (%) of N. nomurai on the carbon biomass and production rate of zooplankton was as follows:
F b i o m a s s = F j e l l y C W z o o × 100 %
F p r o d u c t i o n = F j e l l y P z o o d a i l y × 100 %
where  F b i o m a s s   and   F p r o d u c t i o n  represented the feeding pressure of N. nomurai on the zooplankton carbon biomass and production rate, respectively.  C W z o o   and   P z o o d a i l y  represented the carbon biomass and production rate of zooplankton, respectively. The feeding pressure of N. nomurai on zooplankton estimates excluded stations with Noctiluca and phytoplankton blooms.

2.3.3. Statistical Analyses

A Kruskal–Wallis test was employed to examine the variations in environmental variables and large jellyfish populations among the three regions, as well as zooplankton and small copepod abundance under different population sizes of N. nomurai. A principal component analysis (PCA) was conducted within the R packages ‘Factoextra’ and ‘FactoMINER’ to portray the spatial patterns of the environmental factors [55]. Before the PCA, all the environmental variables were normalized to values between 0 and 1. All statistical analyses in this study were conducted using R software [55].

3. Results

3.1. Spatial Variation in Environmental Variables

The regional distribution of the depth, temperature, salinity, and chlorophyll a concentration in the surveyed area is shown in Table 1. All environmental variables were significantly (Kruskal–Wallis test, p < 0.05) different across the three regions. The temperature ranged from 7.71 to 27.50 °C, with the lowest value occurring in the Yellow Sea (YS). The salinity range in summer 2021 in the whole study area was 25.09–34.31. The chlorophyll a concentration ranged from 0.16 to 2.85 mg·m−3.
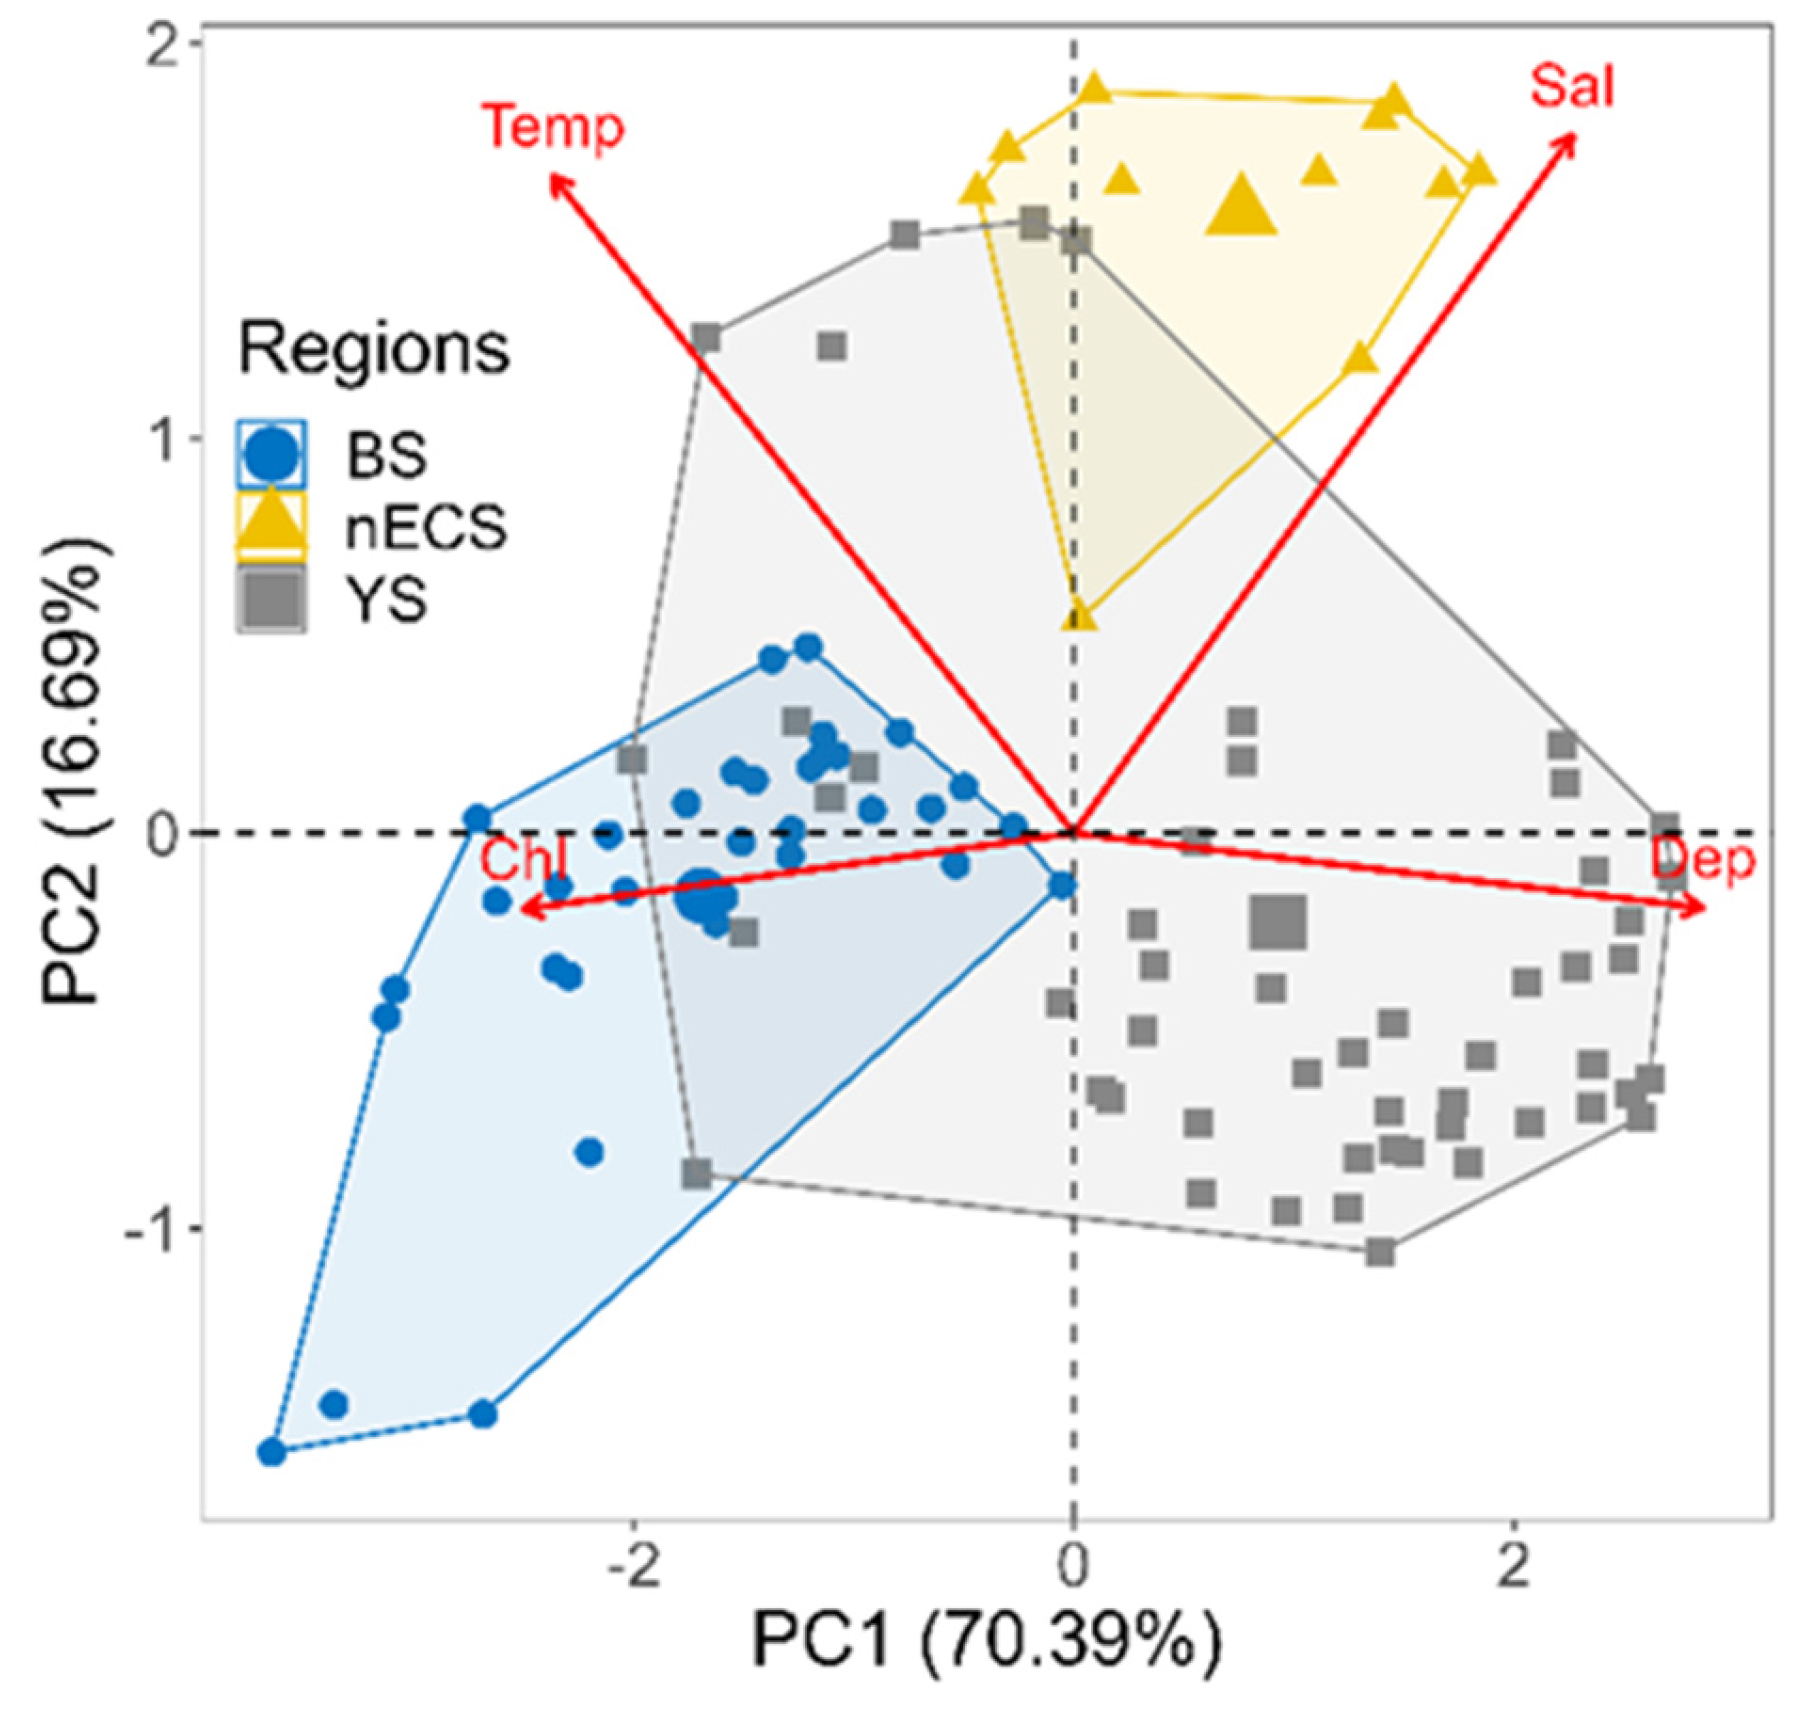
The first two principal component analysis (PCA) axes accounted for approximately 87.08% of the variability in the environmental variables across the three regions in summer 2021 (Figure 2). The Bohai Sea (BS) region was generally characterized by a high chlorophyll a concentration. The Yellow Sea (YS) region had a great depth and low temperature. The northern East China Sea (nECS) region was characterized by high salinity.

3.2. Distribution of Large Jellyfish Abundance and Biomass

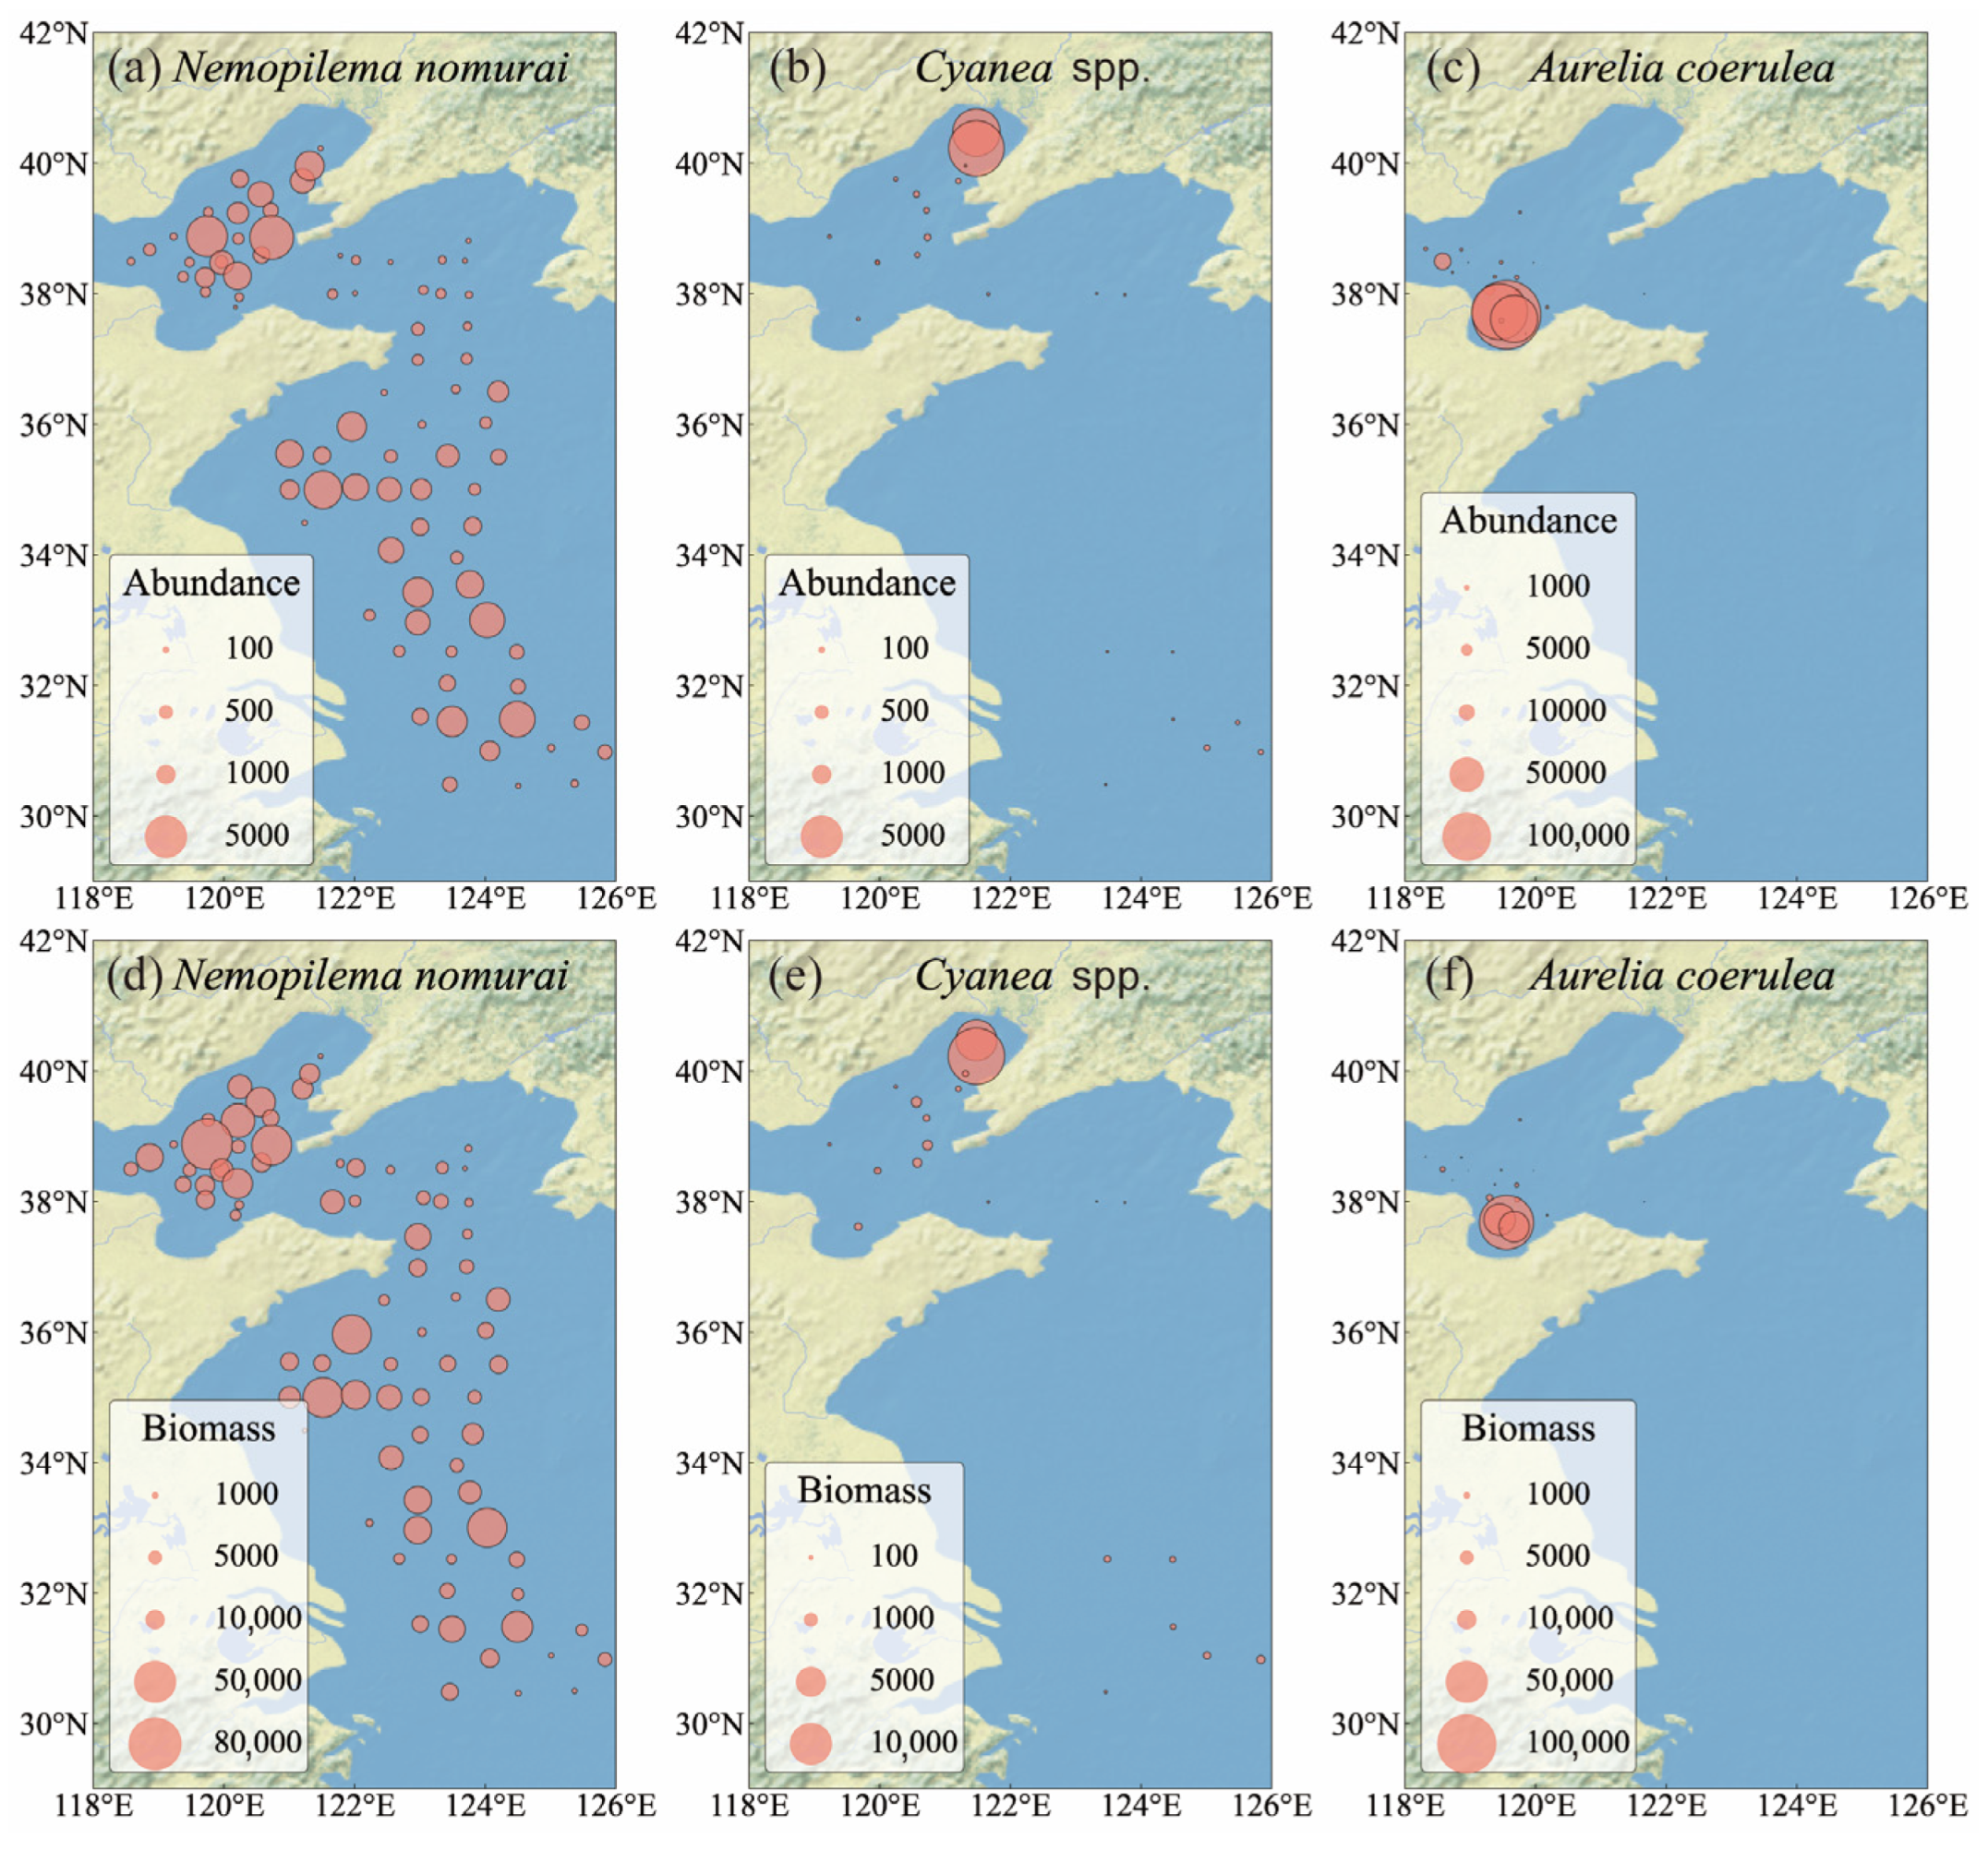
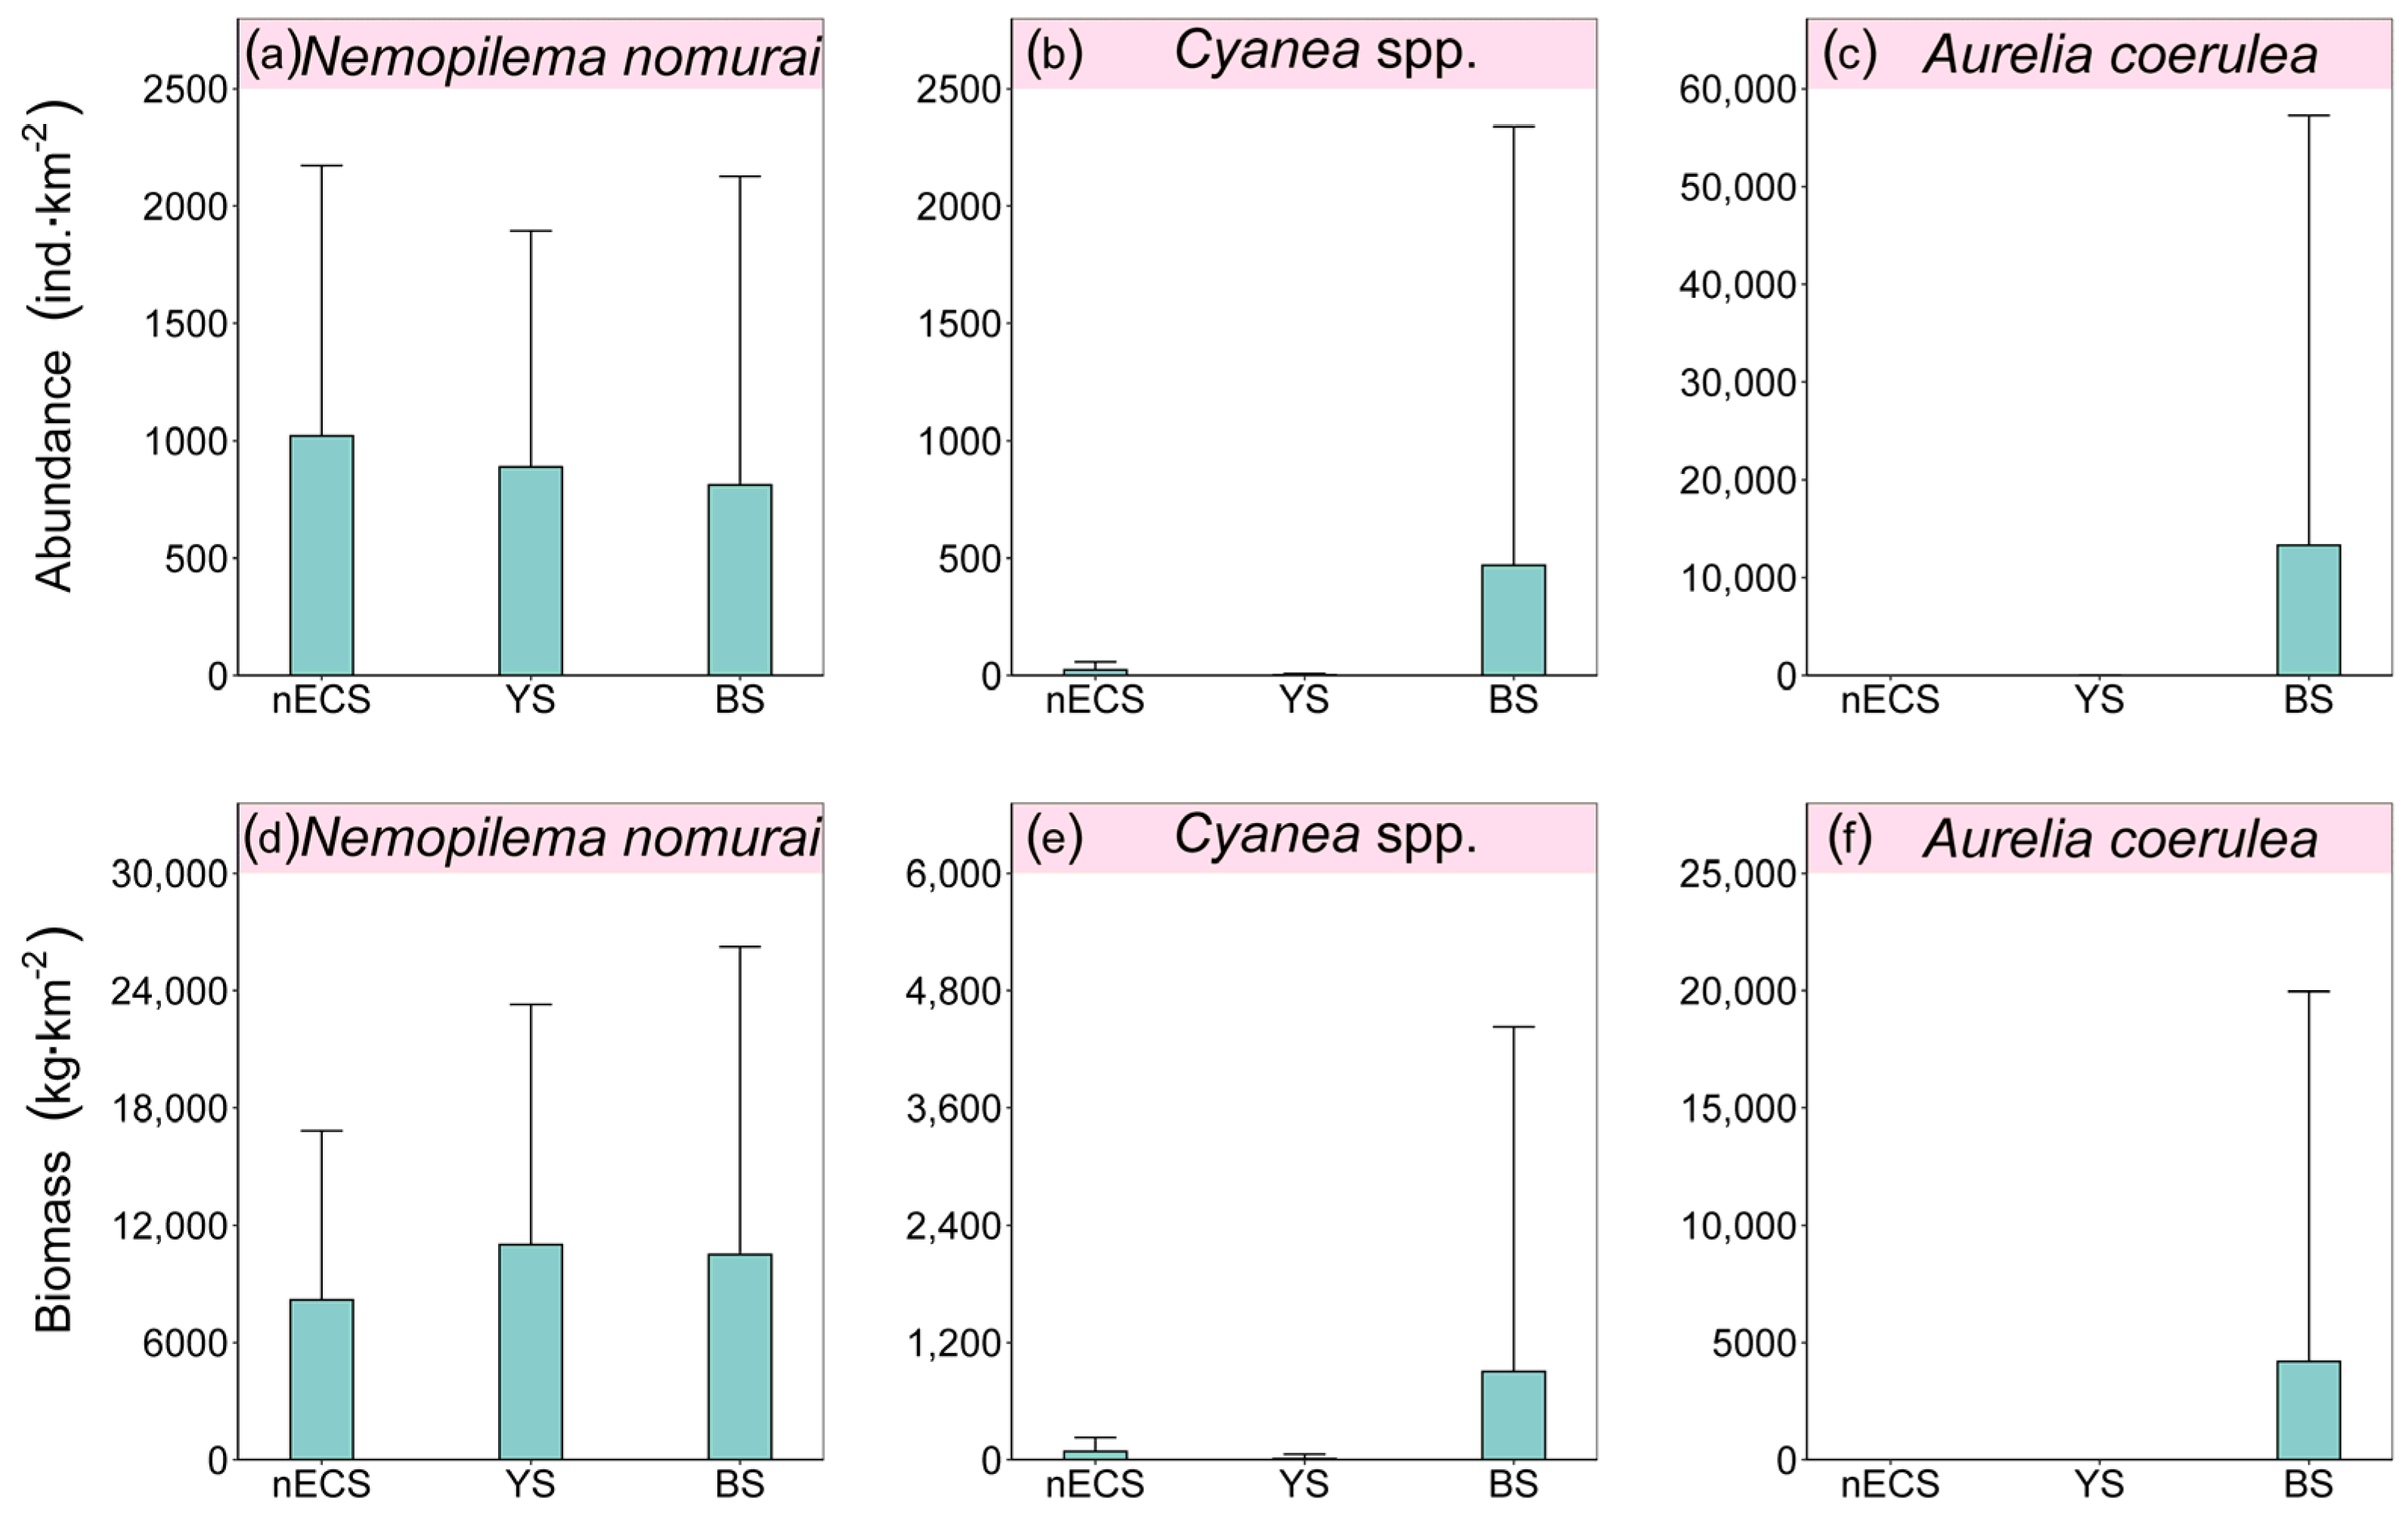
The principal species of large jellyfish collected during this cruise were as follows: Nemopilema nomurai, Cyanea spp., Aurelia coerulea, Aequorea spp., and Ulmaridae (undefined sp.). The geographical distribution of abundance and biomass varied among the large jellyfish species. Nemopilema nomurai was the dominant species and was widely distributed throughout the whole surveyed area, with an abundance and biomass of 876.18 ± 1131.46 ind.·km−2 and 10,513 ± 13,208.01 kg·km−2, respectively (Figure 3a,d). Nemopilema nomurai assembled mainly in the southern YS and central BS (Figure 3a,d). There were no significant differences in the abundance and biomass of N. nomurai among the three regions in summer 2021 ( χ a b u n 2 = 3.65 p a b u n > 0.05 χ b i o 2 = 1.04 p b i o > 0.05 , Figure 4a,d). Compared with N. nomurai, the distribution of Cyanea spp. was significantly different in the study area ( χ a b u n 2 = 13.11 p a b u n < 0.05 χ b i o 2 = 11.01 p b i o < 0.05 , Figure 4b,e). Cyanea spp. was distributed mainly in the BS, with an abundance and biomass of 469.53 ± 1868.76 ind.·km−2 and 903.34 ± 3523.20 kg·km−2, respectively (Figure 3b,e). The high abundance and biomass of Cyanea spp. were concentrated in Liaodong Bay in the northern part of the BS. Cyanea spp. sporadically distributed in the nECS and YS, with abundance and biomass ranging from 0.00 to 93.38 ind.·km−2 and 0.00 to 399.82 kg·km−2, respectively (Figure 3b,e). Aurelia coerulea was distributed mainly in the BS, with an abundance and biomass of 13,314.37 ± 43,946.48 ind.·km−2 and 4190.57 ± 15,768.42 kg·km−2, respectively (Figure 3c,f). Aurelia coerulea congregated in large numbers in Laizhou Bay in the southern part of the BS and occurred at only one station in the YS in the surveyed area (Figure 3c,f). There were significant differences in the abundance and biomass of A. coerulea among three regions in summer 2021 ( χ a b u n 2 = 34.21 p a b u n < 0.05 χ b i o 2 = 34.08 p b i o < 0.05 , Figure 4c,f). Furthermore, Aequorea spp. and Ulmaridae (undefined sp.) were only sporadically distributed in the region of the YS (Figure S2).

3.3. Realized Niches of Large Jellyfish

By combining presence-only records of large jellyfish with corresponding environmental data, the response of each large jellyfish to important environmental variables was estimated using MaxEnt models. The AUC values for N. nomurai, Cyanea spp., and A. coerulea obtained from the 100 bootstrapped resampling were 0.655, 0.819, and 0.912, respectively (Table 2). Generally, the distribution of large jellyfish in summer 2021 in northern Chinese coastal seas was influenced by temperature and salinity, although there were considerable species-specific differences. Among them, salinity was the more important factor for N. nomurai and A. coerulea, whereas temperature was more important for Cyanea spp. (Table 2, Figure S3). As salinity increased, the probability of N. nomurai occurrence increased in the approximate range of 28–31, being insensitive to salinity at salinity of 31–34 (Figure S3b). In contrast to that of N. nomurai, the occurrence probability of A. coerulea decreased with salinity in the approximate range of 29–33 (Figure S3h). The distribution pattern of Cyanea spp. was significantly influenced by temperature, exhibiting a unimodal distribution in which the occurrence probability increased and then decreased with increasing temperature until ~26 °C. The occurrence probability of Cyanea spp. exhibited a high plateau at a temperature of approximately 20 °C (Figure S3d). Chlorophyll a concentration was the least important environmental variable, accounting for less than 20% of the general importance in the distribution of large jellyfish in this study (Table 2).
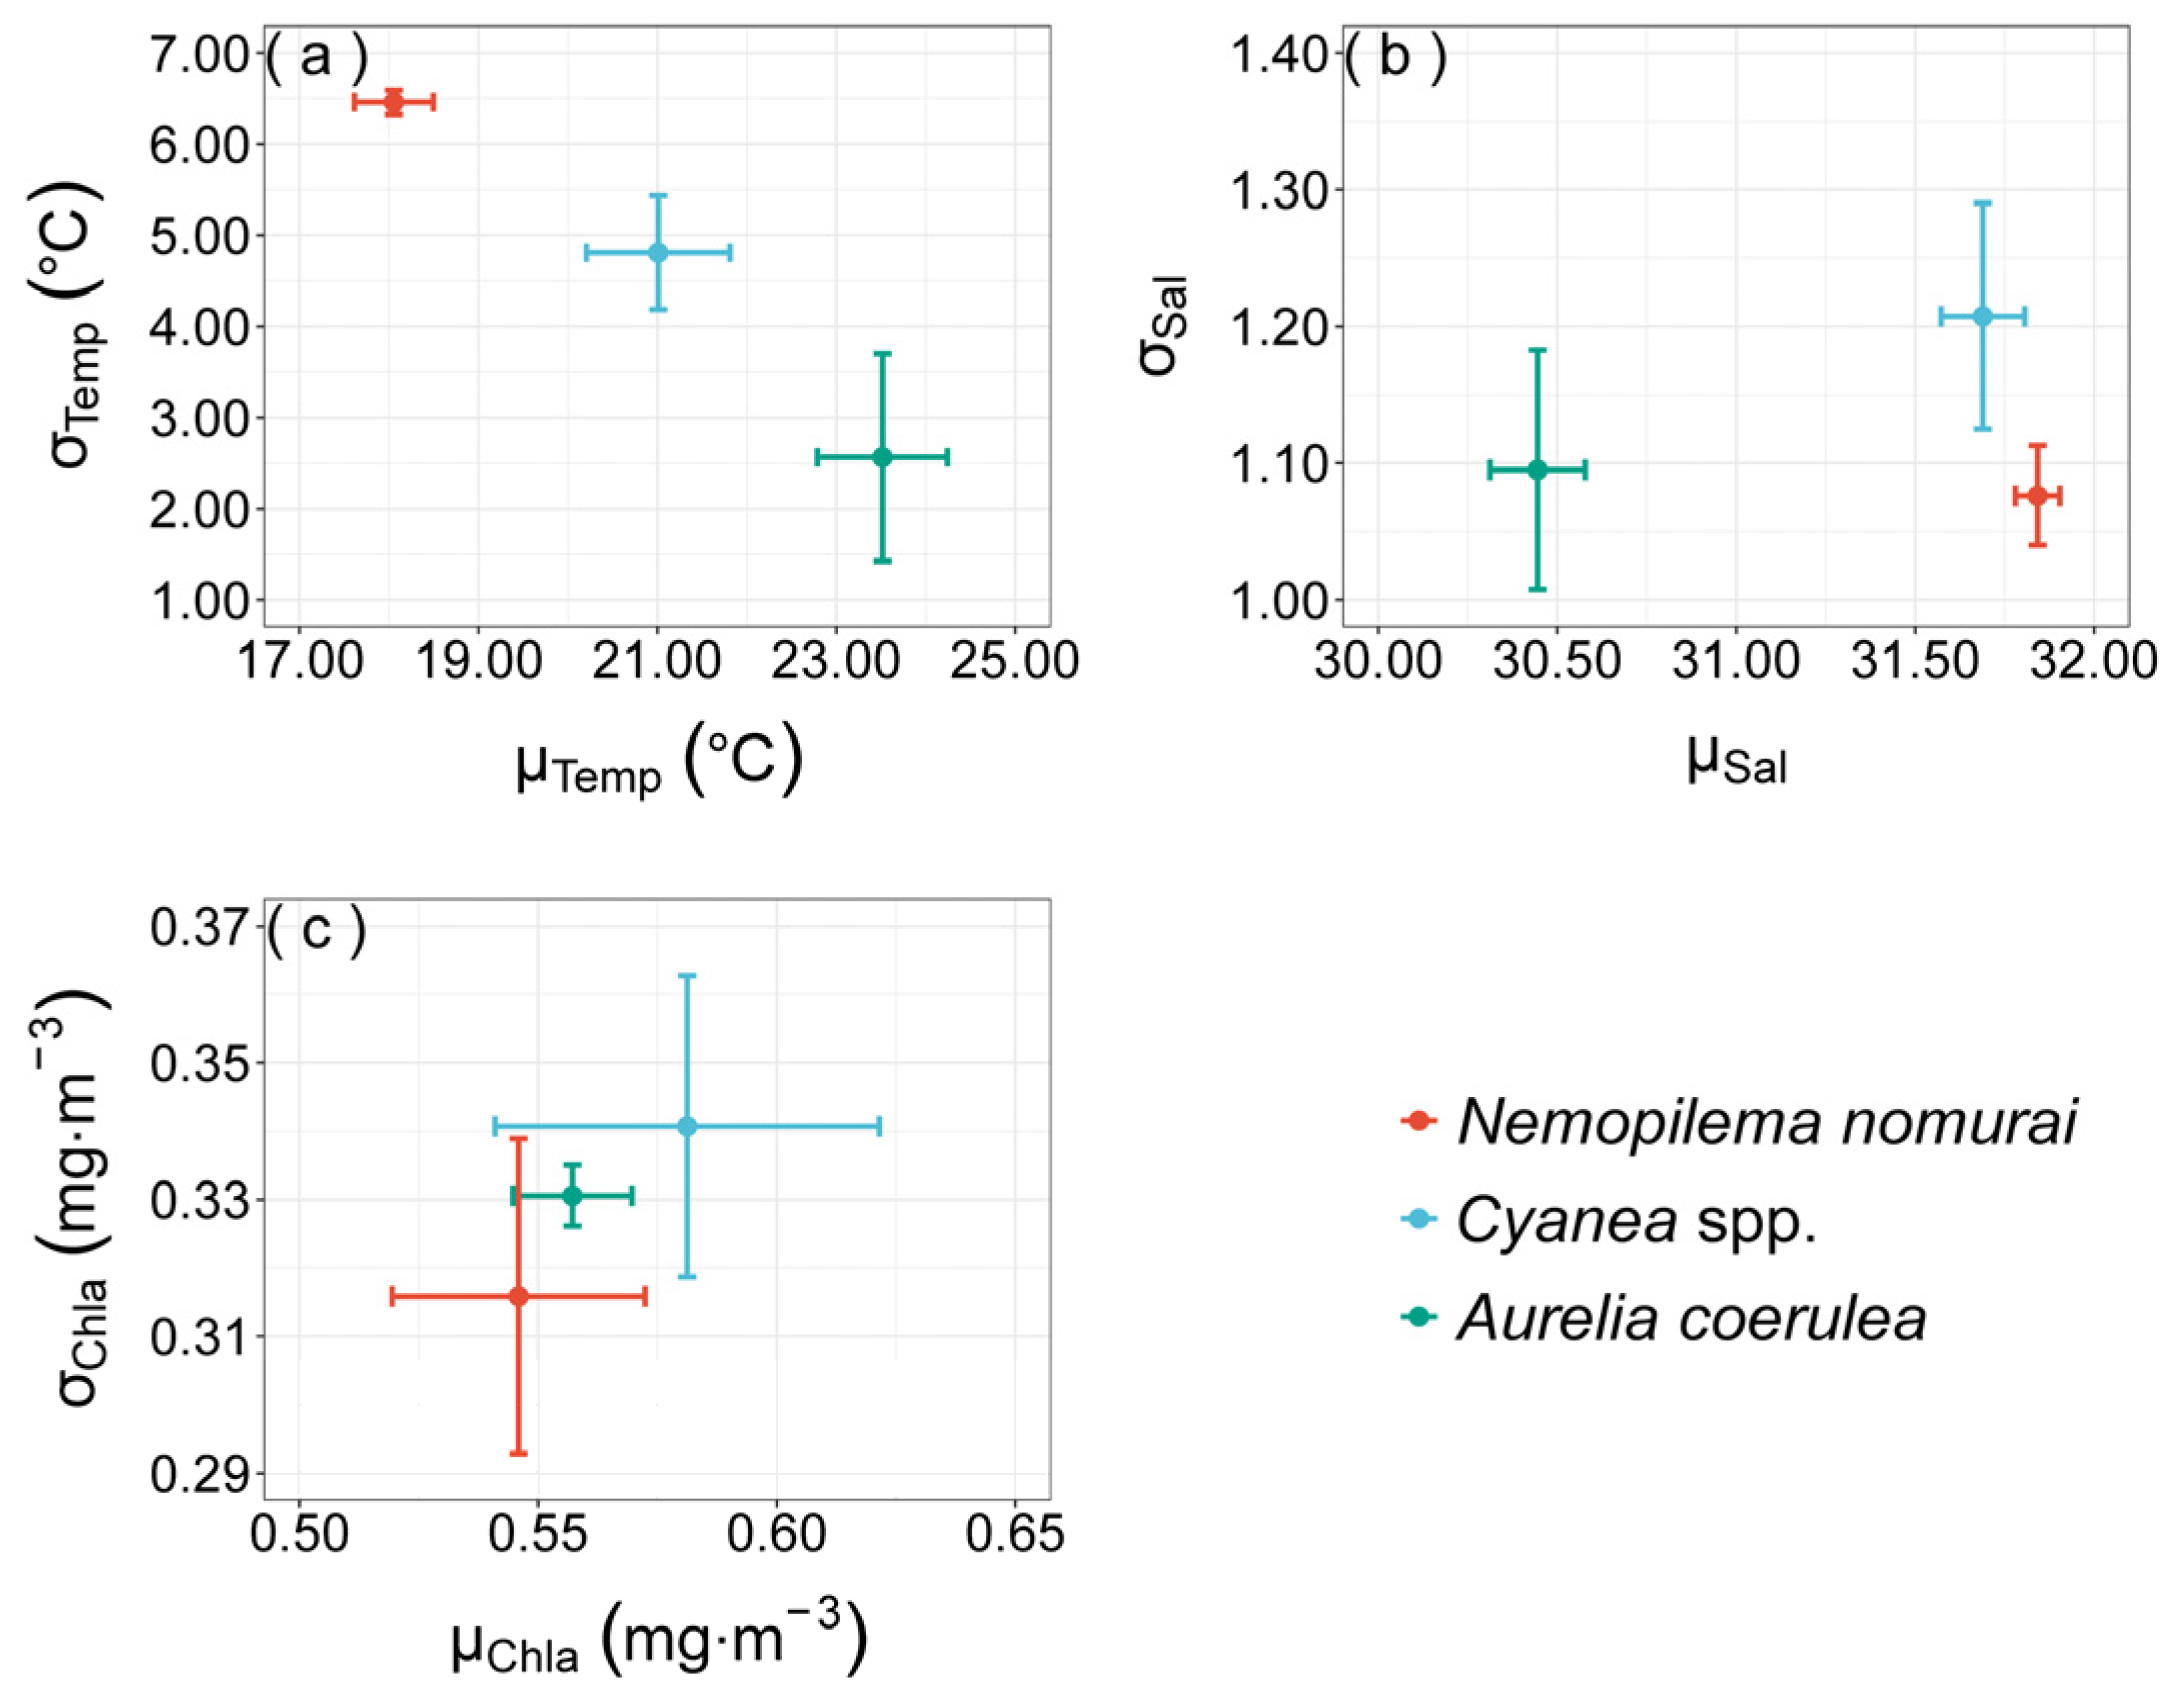
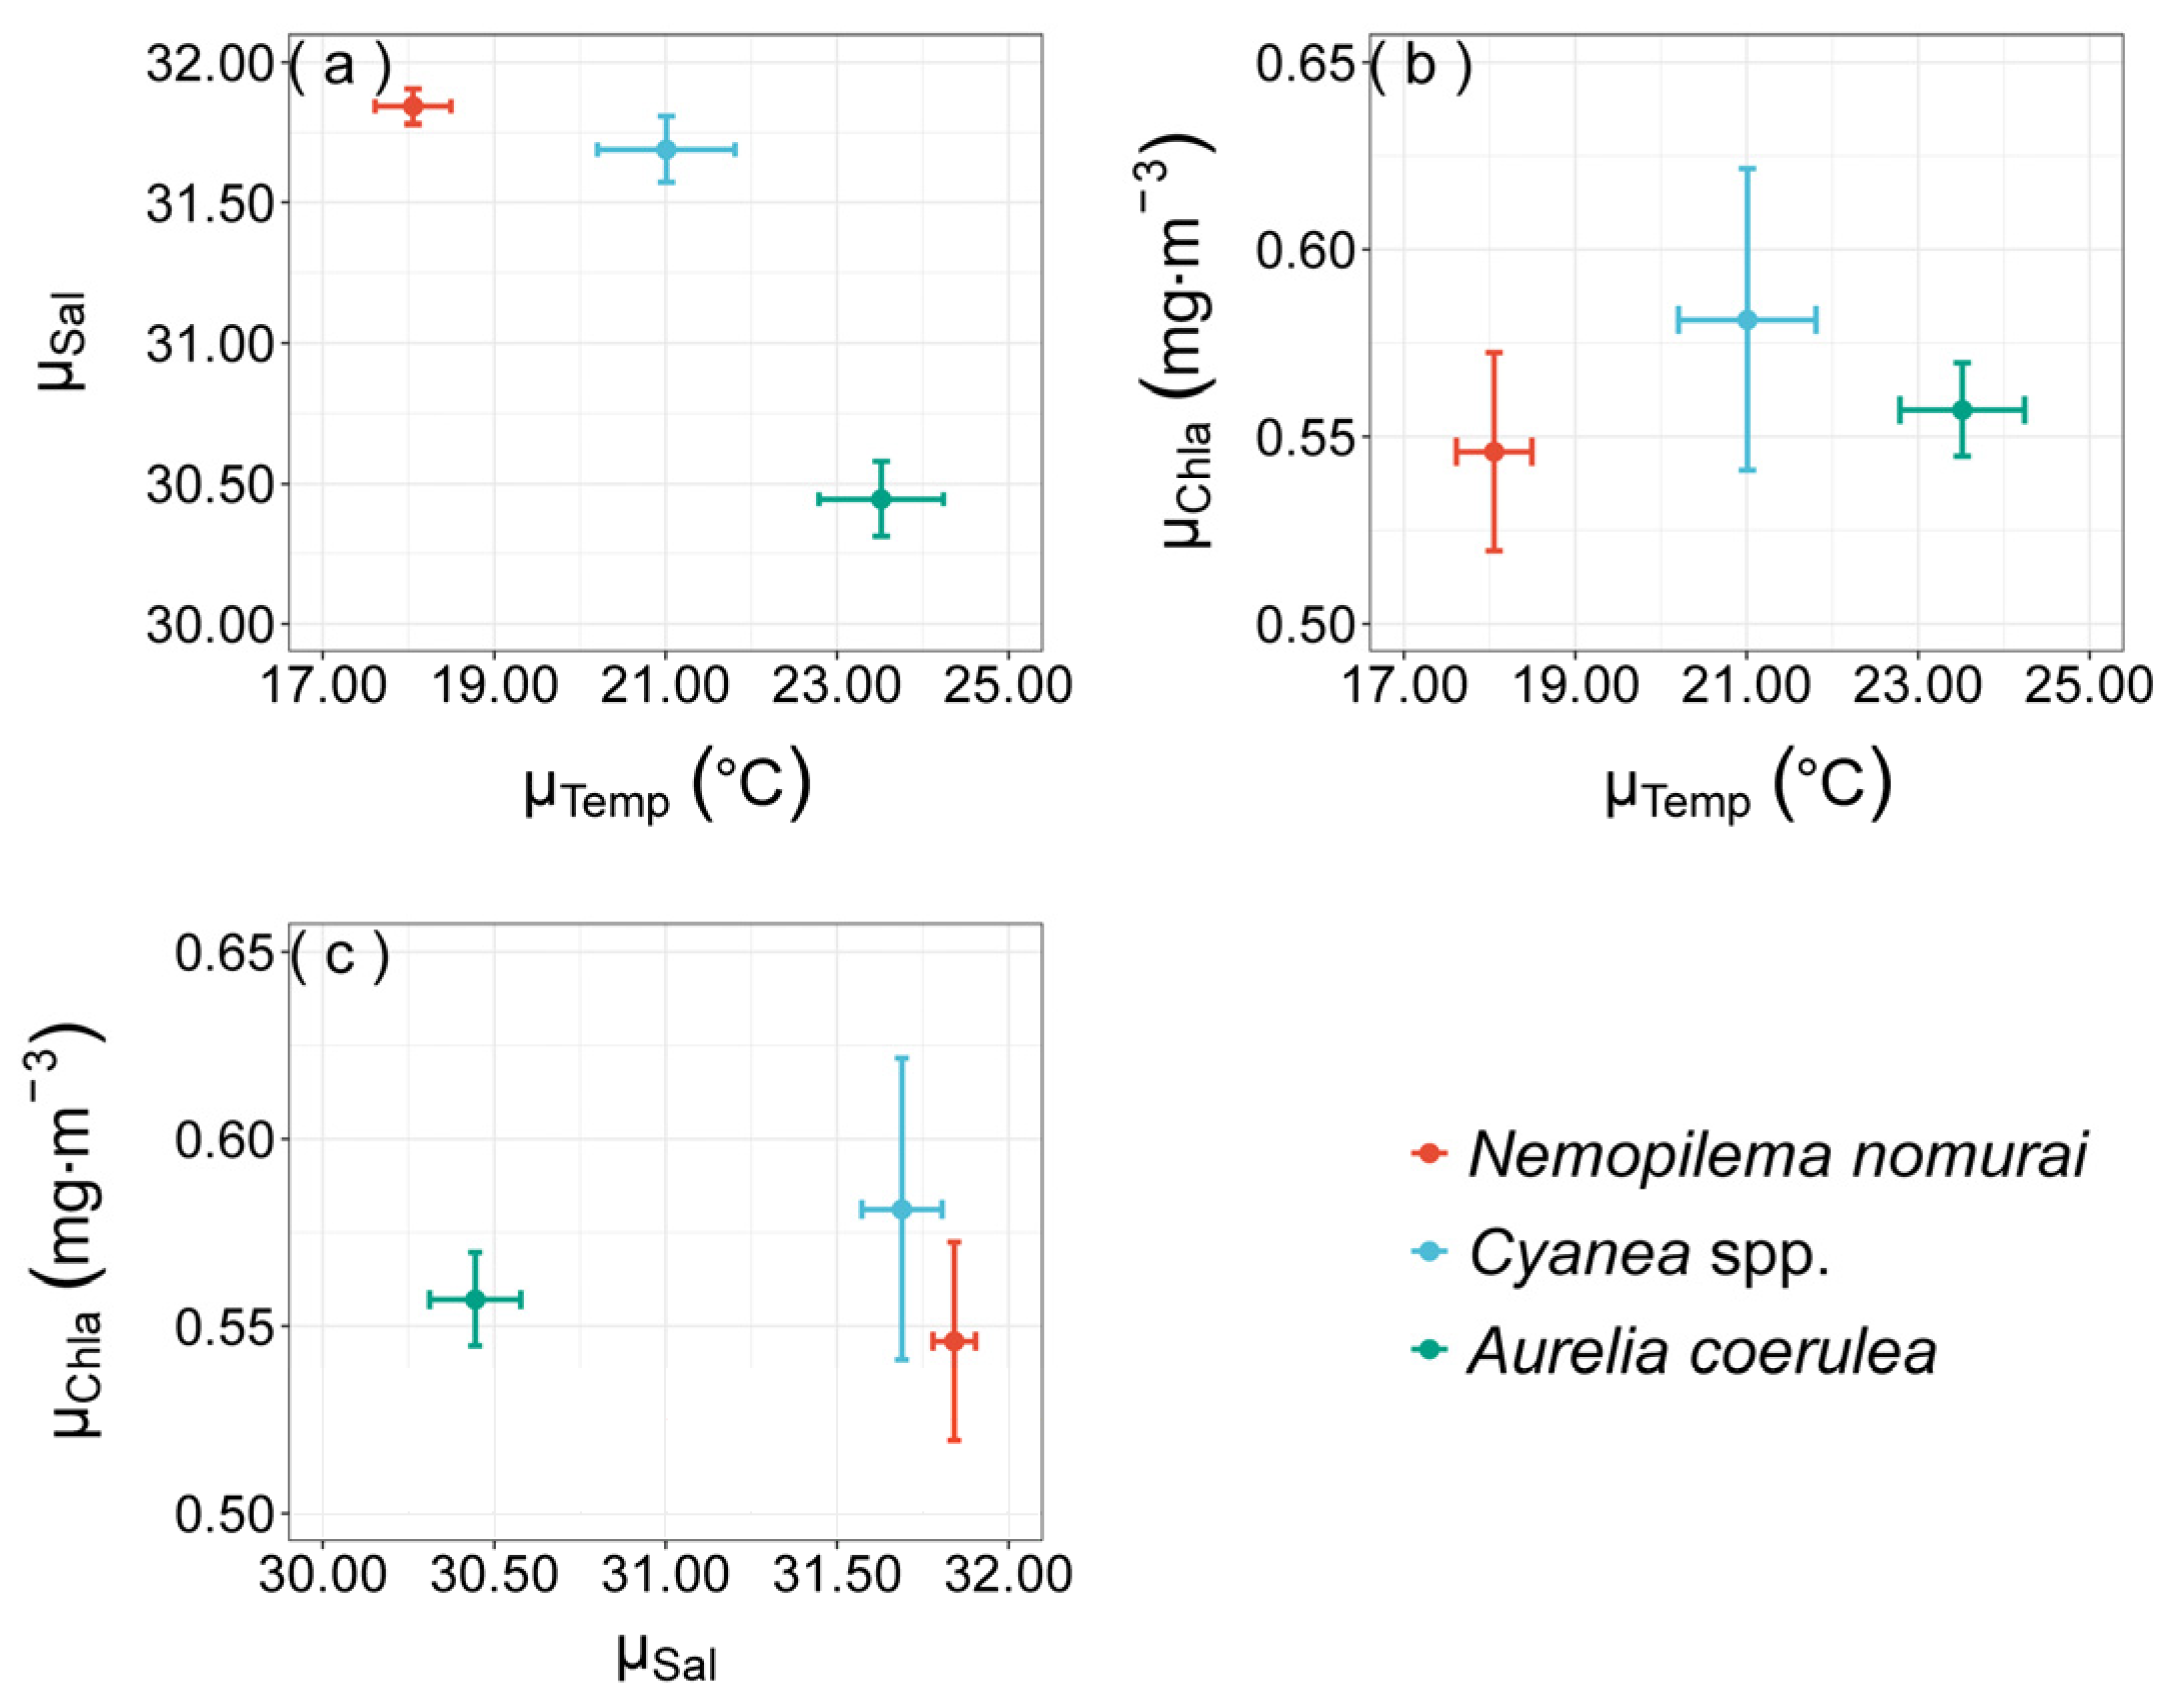
The niches of large jellyfish differed greatly in terms of temperature and salinity (Figure 5 and Figure 6), while for chlorophyll a concentration, the niches of large jellyfish were narrow and centered around intermediate environmental conditions. Nemopilema nomurai was distinguished from other species by its broad temperature niche breadth ( σ T e m p = 6.46   ° C ), low mean temperature niche ( u T e m p = 18.05   ° C ), and high mean salinity niche ( u S a l = 31.84 ). Cyanea spp. was distinct from the other species by its intermediate mean temperature niche ( u T e m p = 21.01   ° C ) and broad salinity niche ( σ S a l = 1.21 ). The niche of A. coerulea was distinguishable from those of other species in terms of temperature and salinity. Its temperature niche was narrow ( σ T e m p = 2.56   ° C ), with a high mean temperature niche ( u T e m p = 23.52   ° C ) and a low mean salinity niche ( u S a l = 30.44 ).

3.4. Relationship between Large Jellyfish and the Zooplankton Community

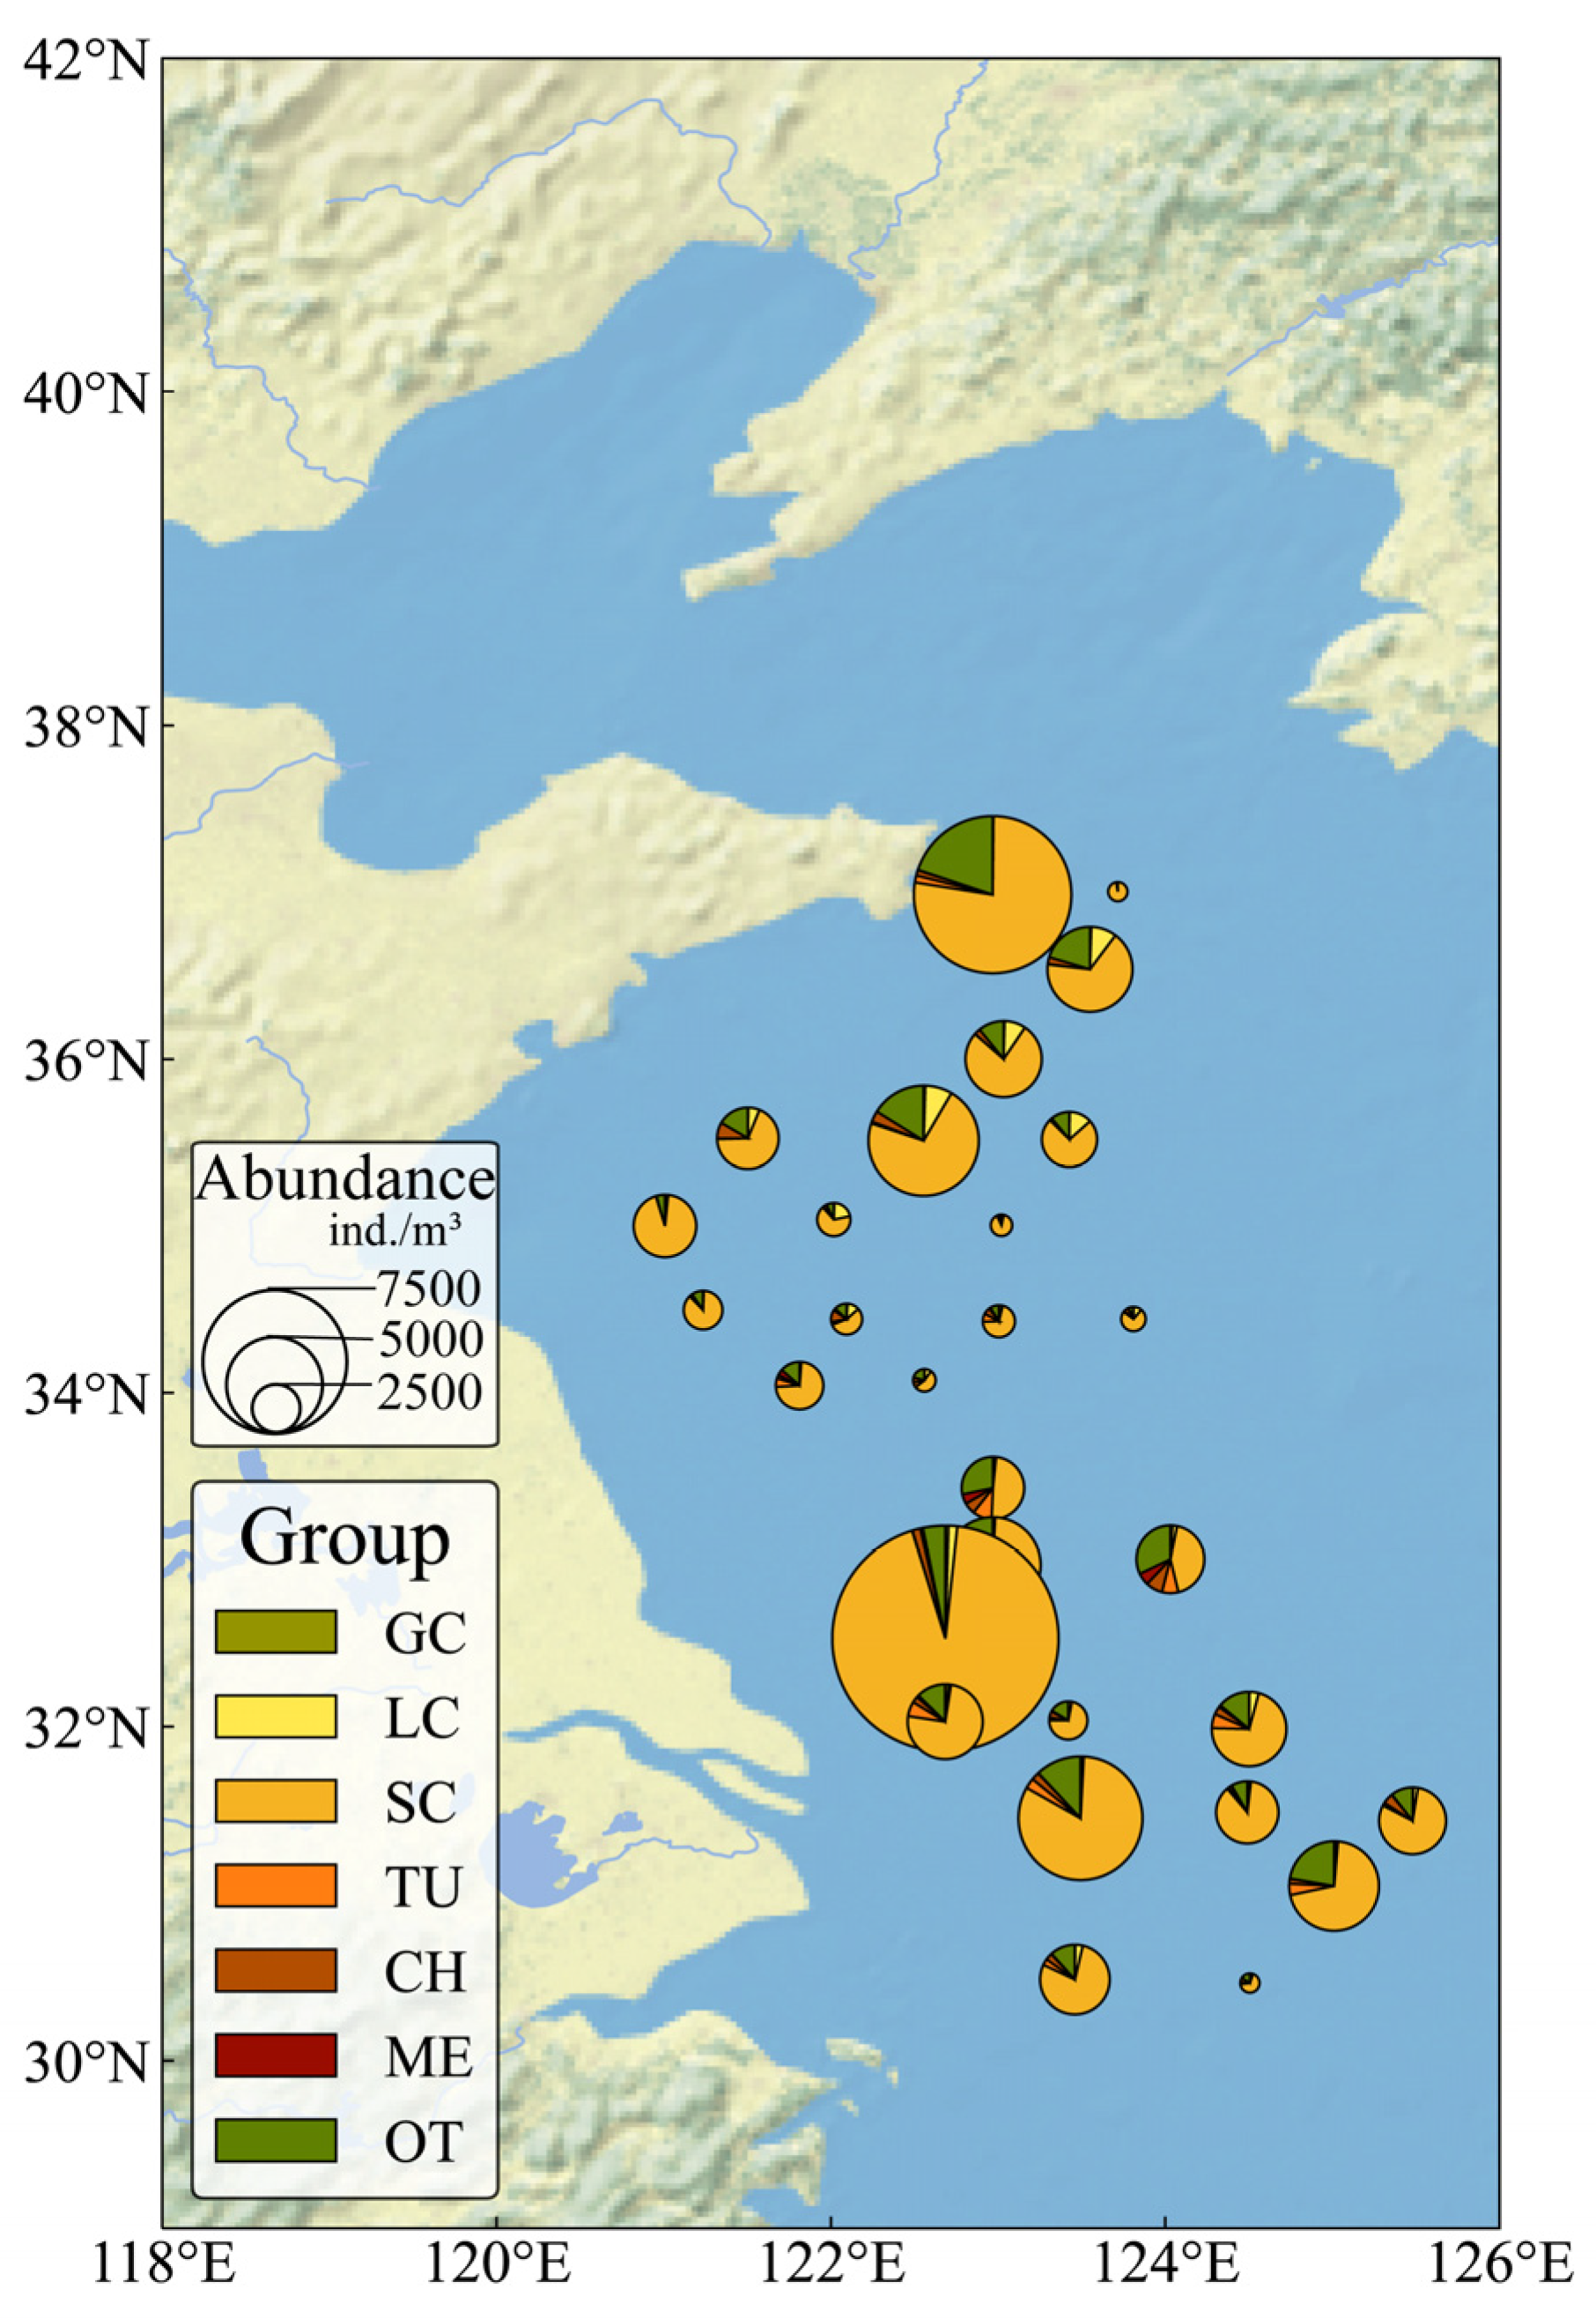
The zooplankton community in this study was composed of giant crustaceans, large copepods (>1000 μm), small copepods (<1000 μm), tunicates, chaetognaths, small medusae, and other organisms. The abundance distributions of these zooplankton taxa are shown in Figure 7. The average abundance of total zooplankton was 3690.05 ± 2329.29 ind.·m−3. The small copepods were the dominant zooplankton group in terms of abundance in summer 2021 in the nECS and southern YS, comprising 72.93 ± 12.39% of the total zooplankton abundance.
Table 3 shows the standing stock and production rate of zooplankton, as well as the feeding rate of N. nomurai and their feeding pressure on zooplankton in summer 2021 in the nECS and southern YS. The average carbon biomass of zooplankton in the study region was 453.37 ± 301.67 mgC·m−2, ranging from 51.09 to 1267.85 mgC·m−2. The average production rate was 59.38 ± 33.42 mgC·m−2·d−1, with a range of 9.54 to 121.04 mgC·m−2·d−1. The feeding rate of N. nomurai in this study was 21.05 ± 18.75 mgC·m−2·d−1, and the feeding rate ranged from 0.00 to 62.94 mgC·m−2·d−1 when the capture rate of N. nomurai was 0.1. If all the zooplankton samples collected by the plankton net were assumed to be prey of N. nomurai and the capture rate of N. nomurai was 0.1, then the feeding pressure of N. nomurai on the standing stock of zooplankton was 7.70 ± 8.04%, with a range of 0.00 to 25.51%. The feeding pressure of N. nomurai on the production rate of zooplankton was 55.16 ± 55.52%, with a range of 0.00 to 183.45%.
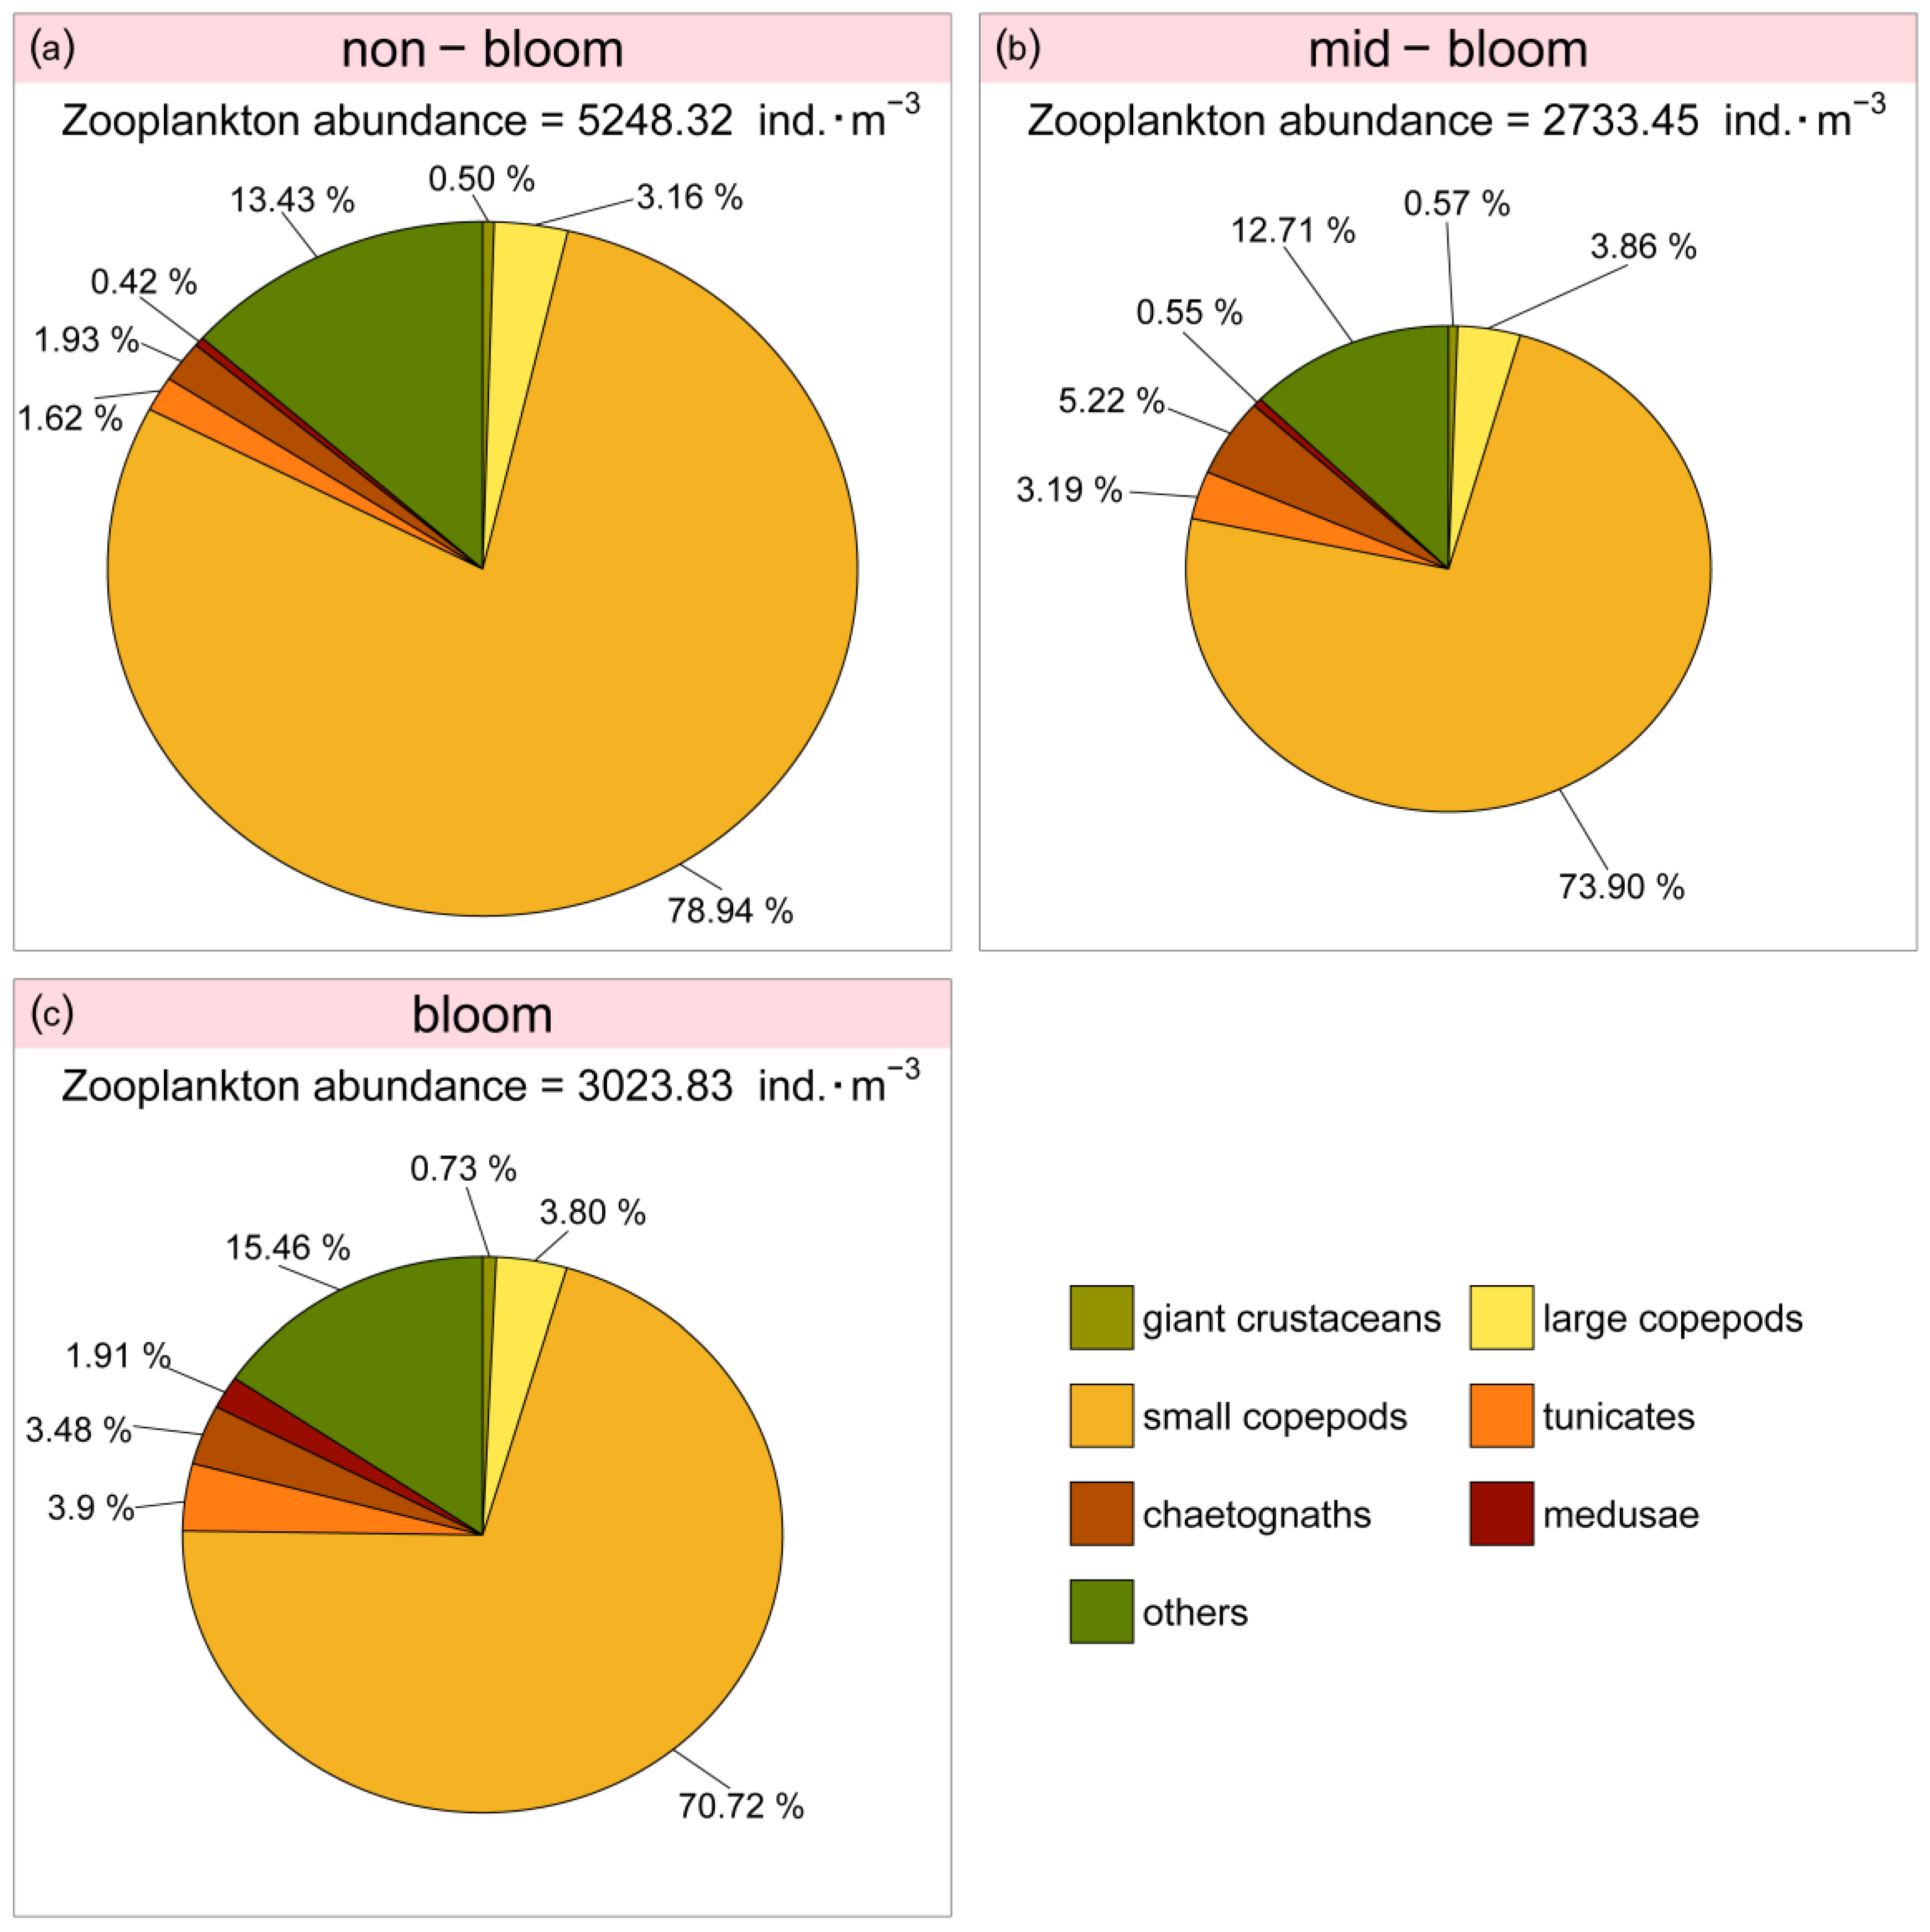
High values of a zooplankton abundance occurred at stations off the Changjiang estuary and the Shandong Peninsula (Figure 7). There was a non-overlap in the spatial distribution between the high population size of N. nomurai and zooplankton abundance (Figure 3a,d and Figure 7). According to the abundance of N. nomurai, the stations in the nECS and southern YS were divided into non-bloom stations (<500 ind.·km−2), mid-bloom stations (500–1000 ind.·km−2), and bloom stations (>1000 ind.·km−2). Compared to the non-bloom stations, significant decreases were noted for zooplankton and small copepods at the mid-bloom stations and bloom stations (Figure 8). The absolute and relative abundances of small copepods were 2138.15 ind.·m−3 and 70.71% at the bloom stations and 2020.29 ind.·m−3 and 73.91% at the mid-bloom stations, which were less than 4143.02 ind.·m−3 and 78.94% at the non-bloom stations, respectively (Figure 9).

4. Discussion

4.1. Distribution of Large Jellyfish Abundance and Biomass

Nemopilema nomurai was extensively distributed in summer 2021 in the surveyed area (Figure 3a,d), with a broad range of temperature niches and a high mean salinity niche (Figure 5a,b). Nemopilema nomurai was the dominant species of large jellyfish in terms of abundance and biomass in this study. Based on historical long-term data from the southern Yellow Sea (YS), the N. nomurai population was at a mid-bloom level [13,56] (our unpublished data). A previous study demonstrated that N. nomurai abundance ranged from 34 to 4951 ind.·km−2 in the southern YS [13]. The abundance and biomass of N. nomurai in the YS were 888.38 ± 1005.45 ind.·km−2 and 11,008.805 ± 12,284.80 kg·km−2 (Figure 4a,d), respectively, in summer2021, which was similar to those in 2013 [13]. Nemopilema nomurai assembled in the central Bohai Sea (BS), with abundance and biomass values as high as 4878.19 ind.·km−2 and 75,346.77 kg·km−2, respectively (Figure 3a,d). There were no N. nomurai individuals collected in Laizhou Bay in this study (Figure 3a,d). The maximum entropy (MaxEnt) results showed that occurrence probability of N. nomurai increased with salinity in the approximate range of 28–31 (Figure S3b), indicating saltier water may be beneficial to the distribution of N. nomurai. This may be one of the reasons for the rare occurrence of N. nomurai in Laizhou Bay, a low-salinity coastal water mass.
Compared to N. nomurai, Cyanea spp. was considered to be a warm-water species with a higher mean temperature niche (Figure 5a and Figure 6a) that was distributed mainly in the northern East China Sea (nECS) and BS in this study (Figure 3b,e). The abundance and biomass of Cyanea spp. in the nECS were 23.19 ± 34.61 ind.·km−2 and 86.13 ± 144.27 kg·km−2, respectively (Figure 4b,e). Compared to the distribution of Cyanea spp. in the nECS in late August 2006 [11], Cyanea spp. was more widespread and closer to the pelagic zone in summer 2021. Cyanea spp. was distributed mainly in the BS and assembled in Liaodong Bay in this study, with abundance and biomass values as high as 9058.92 ind.·km−2 and 18,765.13 kg·km−2, respectively (Figure 3b,e), while N. nomurai individuals were collected at only a few stations in summer 2021 in Liaodong Bay (Figure 3a,d) compared to those in September 2014 [14] and June 2016 [57]. The assemblage of Cyanea spp. may be one of the reasons for the low N. nomurai population size in Liaodong Bay in this study (Figure 3b,e). The results of the stable isotope analysis revealed that N. nomurai comprised 9.54% of the diet of larger Cyanea nozakii individuals, which indicated that there was an intraguild predation relationship between these two species [20]. A similar phenomenon also occurred in Liaodong Bay in July 2004; the number of N. nomurai individuals decreased dramatically, whereas the number of C. nozakii individuals increased significantly [58].
Compared to N. nomurai and Cyanea spp., Aurelia coerulea had a high mean temperature and a low mean salinity niche (Figure 6a), and assembled mainly in Laizhou Bay in the BS and occurred at only one station in the YS in this study (Figure 3c,f). According to a previous study, A. coerulea appeared at only a few stations in Laizhou Bay with a low biomass in July 2011 and broke out in October 2011 with a biomass value as high as 45,454 kg·km−2 at individual stations [59]. In this study, the highest biomass of A. coerulea in Laizhou Bay was 86,410.58 kg·km−2, indicating that the population size was larger than that in 2011. The regional temperature may be one of the reasons for the differences in A. coerulea population size in Laizhou Bay between 2021 and 2011. The average sea surface temperature of the BS from July to September 2021 was higher than that of 2011 based on the sea surface temperature data from MODIS-Aqua (https://oceancolor.gsfc.nasa.gov/, accessed on 1 December 2022). The increased temperature may have a direct effect on the asexual reproduction and metabolic rate of Aurelia species and has been recognized as a major factor affecting their population scale [60]. High temperatures were also beneficial to earlier blooms of A. coerulea in the Korean Peninsula [7]. This phenomenon has been reported in other regions as well. The population size of Aurelia spp. in the northern Gulf of Mexico appeared to be larger than their long-term averages when sea surface temperatures were higher than average from July to September [6]. Markedly large blooms of Aurelia spp. were found in anomalously warm years due to enhanced medusae growth [61].
The realized niches for the three most abundant large jellyfish, namely Nemopilema nomurai, Cyanea spp., and Aurelia coerulea, were characterized by combining their distribution data and environmental data (Figure 5 and Figure 6). The temperature and salinity were more important environmental factors than chlorophyll a concentration in the distribution of large jellyfish (Table 2). These realized niches can be utilized for analyzing the distribution patterns of large jellyfish, providing valuable insights into their biogeography and community dynamics in response to climate change. The investigated large jellyfish exhibit a typical life cycle, consisting of a pelagic medusa stage and a benthic polyp stage [12,17,19,60]. Important to note is that the realized niches estimated in this study pertained to the environmental conditions inhabited by large jellyfish in the pelagic stage. Due to the challenge of accurately identifying benthic polyp locations and the paucity of sample data, the benthic polyp stage was not taken into consideration in this study. Additionally, factors such as predation, competition, and prey availability may also influence the population size of large jellyfish [8,19,20,21]. In the future, assessment of the large jellyfish population in northern Chinese coastal seas should consider both benthic and pelagic stages, as well as biotic and abiotic variables, to achieve more precise predictions.

4.2. Relationship between Large Jellyfish and the Zooplankton Community

Previous studies have shown that blooms of large jellyfish imposed relatively high predation pressure on micro- and mesozooplankton [36,40,62,63]. The abundance and biomass of large jellyfish in this study were estimated through a bottom trawl survey [11]. Unfortunately, there was no corresponding capture rate as a reference for this method to evaluate the abundance and biomass of large jellyfish [36]. Taking into account the swimming ability of large jellyfish and their vertical distribution in the water column, the capture rate of large jellyfish in bottom trawls in this study was assumed to be similar to that of pelagic fishes (0.1–0.4), and a capture rate of 0.1 was used to estimate the maximum abundance and biomass, while a capture rate of 0.4 was used to estimate the minimum abundance and biomass [11,36,64]. Given that N. nomurai accounted for over 95% of the biomass of large jellyfish in August and September 2021 in the nECS and southern YS, N. nomurai was used as the representative research target to study whether the large jellyfish blooms in summer would have a negative impact on the zooplankton community.
In this study, the feeding pressure of N. nomurai on the standing stock and production rate of zooplankton was 7.70% and 55.16%, respectively, when all the zooplankton samples collected by the plankton net were assumed to be prey of N. nomurai and the capture rate of N. nomurai was 0.1 (Table 3). At the stations where the N. nomurai assembled, their feeding pressure on zooplankton exceeded the zooplankton productivity rate, indicating that the potential consumption of N. nomurai on zooplankton was significant. If the capture rate of N. nomurai was 0.4, their feeding rate and feeding pressure on the standing stock and production rate of zooplankton were a fourth as much as those when the capture rate of N. nomurai was 0.1 (Table 3). During the large jellyfish bloom period near Tsushima Island in late July 2005, the feeding pressure of medusae on mesozooplankton was approximately 24% [40]. During the N. nomurai outbreak in early September 2006 in the southern YS, the average feeding pressure of N. nomurai on the standing stock and production rate of zooplankton was 6.4% and 76.6%, respectively [36]. As their mouthlet diameters expand to ca. 1 mm when the ephyra become medusae, the prey of N. nomurai was restricted to micro- and mesozooplankton [40]. The gastric pouch of N. nomurai near Oki Island, Shimane Prefecture, in November 2005 contained many copepods and gastropod shells [40]. Stable isotope analysis showed that small copepods comprised over 30% of the diet of N. nomurai in August 2016 in the YS [60]. This indicated that the feeding pressure of N. nomurai would be more pronounced on micro- and mesozooplankton compared to the hypothesis that all the zooplankton samples collected were assumed to be the prey of N. nomurai. Thus, it is interesting to determine whether the N. nomurai population could impact the zooplankton community during the summer. Sun et al. [41] showed that the potential predator–prey relationship between small jellyfish and Calanus sinicus eggs and nauplii may be the reason for their non-overlapping geographical distribution in the northern YS. The composition of zooplankton communities may be impacted by the population size of N. nomurai in this study. Compared to non-bloom stations, decreases in absolute and relative abundance were noted in small copepods at mid-bloom stations and bloom stations in summer 2021 in the nECS and southern YS (Figure 8 and Figure 9). There was a non-overlapping regional distribution between the areas of high abundance of N. nomurai and those of small copepods (Figure 3a and Figure 7), which also indicated that the N. nomurai blooms may exert a high feeding pressure on these small organisms and alter the zooplankton communities.
Long-term field research revealed that large jellyfish aggregations were often accompanied by a decline in zooplankton and fishery population size. During 1982–1984 and 1991–1994, when A. coerulea abundance varied between 0.3 and 23 individuals per 100 m3, there was a negative relationship between A. coerulea and zooplankton biomass in Kiel Fjord [65]. The total abundance of zooplankton fluctuated greatly in the summer when A. coerulea aggregated in Jiaozhou Bay. According to long-term observations at fixed stations, the highest value of total zooplankton abundance was lower in A. coerulea bloom years than in other years [66,67]. This impact of large jellyfish on zooplankton was a critical factor in the energy transfer from primary producers to higher trophic levels, impacting the ecosystem function and fisheries recruitment [44,68,69]. Mass occurrence of medusae, along with overfishing, caused a collapse of fisheries such as the anchovy fishery in the Black Sea in 1989 [70] and the Pacific herring fishery in the Bering Sea in 2010 [36]. The energy consumed by jellyfish accounted for approximately 30% of the combined fish–jellyfish energy consumption in recent years (since 1999) in the Northern California Current and the Black Sea [71]. To date, limited information was available on the relationship between the population fluctuations of large jellyfish and the abundance and community composition of zooplankton in the northern Chinese coastal seas. As mentioned above, the predation pressure of large jellyfish during bloom on zooplankton was potentially high. It is theoretically possible that during years of large jellyfish blooms, the production of zooplankton available for fishery resources may decrease, potentially impacting the sustainable development of fisheries. More field investigations and other tools such as models are necessary to accurately analyze the effects of large jellyfish blooms on zooplankton and fishery resources in the future.

5. Conclusions

The large jellyfish groups collected in summer 2021 in the northern Chinese coastal seas included Nomepilema nomurai, Cyanea spp., Aurelia coerulea, Aequorea spp., and Ulmaridae (undefined sp.). Among them, N. nomurai was the dominant species in terms of abundance and biomass, followed by Cyanea spp. and A. coerulea. Aequorea spp. and Ulmaridae (undefined sp.) were only sporadically distributed in the Yellow Sea (YS). Based on historical long-term data from the southern YS, the N. nomurai population in summer 2021 was at a mid-bloom level. Through the maximum entropy (MaxEnt) method, the realized niches of the three most abundant large jellyfish species (N. nomurai, Cyanea spp., and A. coerulea) were fitted to explain their distribution patterns in the study area and responses to multiple environmental variables. The realized niches of large jellyfish differed substantially in terms of temperature and salinity. The feeding pressure of N. nomurai on zooplankton exceeded zooplankton productivity at the stations where N. nomurai assembled. Reductions in absolute and relative abundance were noted in small copepods at mid-bloom stations and bloom stations compared to non-bloom stations, indicating that blooms of large jellyfish may have an important influence on zooplankton abundance and community composition through top-down control.

Supplementary Materials

The following supporting information can be downloaded at: https://www.mdpi.com/article/10.3390/d15060729/s1, Figure S1: Pairplots of environmental variables, Figure S2: Distribution pattern of abundance (ind.·km−2) and biomass (kg·km−2) of Aequorea spp. (a,c) and Ulmaridae (b,d) in 2021 summer in the northern Chinese coastal seas, Figure S3: Univariate response functions of large jellyfish to environmental variables using the MaxEnt method.

Author Contributions

D.G., F.Z. and S.S. contributed to administration, conception, and design of the study. D.G. and P.W. executed the field investigation and sampling. D.G. carried out the sample processing, organized the database, and performed the statistical analysis. D.G., F.Z. and S.S. led the writing of this study. All authors have read and agreed to the published version of the manuscript.

Funding

This work was financially supported by Laoshan Laboratory (No. 2021QNLM040001, No. 2021QNLM040001-4), the National Natural Science Foundation of China [grant numbers 42076166, 42130411], Laoshan Laboratory (No. LSKJ202204005), Mount Tai Scholar Climbing Plan to Sun Song, and the Innovation Team of Fishery Resources and Ecology in the Yellow Sea and Bohai Sea [grant number 2020TD01].

Institutional Review Board Statement

Not applicable.

Data Availability Statement

Data is contained within the article or Supplementary Materials.

Acknowledgments

We thank Xiujuan Shan for contributing CTD data. We thank the captain and crew of the R/V “Beidou” for their efforts in the field and the people who provided support during our sampling. We thank Song Feng for helpful comments and suggestions on the manuscript. We also thank Yanjun Wang and Xinjiang Wan for their help with data analysis and visualization.

Conflicts of Interest

The authors declare no conflict of interest.

References

  1. Lynam, C.P.; Gibbons, M.J.; Axelsen, B.E.; Sparks, C.A.J.; Coetzee, J.; Heywood, B.G.; Brierley, A.S. Jellyfish Overtake Fish in a Heavily Fished Ecosystem. Curr. Biol. 2006, 16, R492–R493. [Google Scholar] [CrossRef] [PubMed]
  2. Brodeur, R.D.; Suchman, C.L.; Reese, D.C.; Miller, T.W.; Daly, E.A. Spatial Overlap and Trophic Interactions between Pelagic Fish and Large Jellyfish in the Northern California Current. Mar. Biol. 2008, 154, 649–659. [Google Scholar] [CrossRef]
  3. Chiaverano, L.M.; Robinson, K.L.; Tam, J.; Ruzicka, J.J.; Quiñones, J.; Aleksa, K.T.; Hernandez, F.J.; Brodeur, R.D.; Leaf, R.; Uye, S.-I.; et al. Evaluating the Role of Large Jellyfish and Forage Fishes as Energy Pathways, and Their Interplay with Fisheries, in the Northern Humboldt Current System. Prog. Oceanogr. 2018, 164, 28–36. [Google Scholar] [CrossRef]
  4. Bosch-Belmar, M.; Milisenda, G.; Basso, L.; Doyle, T.K.; Leone, A.; Piraino, S. Jellyfish Impacts on Marine Aquaculture and Fisheries. Rev. Fish. Sci. Aquac. 2020, 29, 242–259. [Google Scholar] [CrossRef]
  5. Lynam, C.P.; Hay, S.J.; Brierley, A.S. Interannual Variability in Abundance of North Sea Jellyfish and Links to the North Atlantic Oscillation. Limnol. Oceanogr. 2004, 49, 637–643. [Google Scholar] [CrossRef]
  6. Robinson, K.L.; Graham, W.M. Long-Term Change in the Abundances of Northern Gulf of Mexico Scyphomedusae Chrysaora sp. and Aurelia spp. with Links to Climate Variability. Limnol. Oceanogr. 2013, 58, 235–253. [Google Scholar] [CrossRef]
  7. Lee, S.H.; Hwang, J.S.; Kim, K.Y.; Molinero, J.C. Contrasting Effects of Regional and Local Climate on the Interannual Variability and Phenology of the Scyphozoan, Aurelia coerulea and Nemopilema nomurai in the Korean Peninsula. Diversity 2021, 13, 214. [Google Scholar] [CrossRef]
  8. Richardson, A.J.; Bakun, A.; Hays, G.C.; Gibbons, M.J. The Jellyfish Joyride: Causes, Consequences and Management Responses to a More Gelatinous Future. Trends Ecol. Evol. 2009, 24, 312–322. [Google Scholar] [CrossRef]
  9. IPCC. Climate Change 2021: The Physical Science Basis. In Contribution of Working Group I to the Sixth Assessment Report of the Intergovernmental Panel on Climate Change; Masson-Delmotte, V., Zhai, P., Pirani, A., Connors, S.L., Péan, C., Berger, S., Caud, N., Chen, Y., Goldfarb, L., Gomis, M.I., et al., Eds.; Cambridge University Press: Cambridge, UK; New York, NY, USA, 2021; p. 2391. [Google Scholar] [CrossRef]
  10. Dong, Z.J.; Liu, D.Y.; Keesing, J.K. Jellyfish Blooms in China: Dominant Species, Causes and Consequences. Mar. Pollut. Bull. 2010, 60, 954–963. [Google Scholar] [CrossRef]
  11. Zhang, F.; Sun, S.; Jin, X.S.; Li, C.L. Associations of Large Jellyfish Distributions with Temperature and Salinity in the Yellow Sea and East China Sea. Hydrobiologia 2012, 690, 81–96. [Google Scholar] [CrossRef]
  12. Feng, S.; Sun, S.; Li, C.L.; Zhang, F. Controls of Aurelia coerulea and Nemopilema nomurai (Cnidaria: Scyphozoa) Blooms in the Coastal Sea of China: Strategies and Measures. Front. Mar. Sci. 2022, 9, 1929. [Google Scholar] [CrossRef]
  13. Sun, S.; Zhang, F.; Li, C.L.; Wang, S.W.; Wang, M.X.; Tao, Z.C.; Wang, Y.T.; Zhang, G.T.; Sun, X.X. Breeding Places, Population Dynamics, and Distribution of the Giant Jellyfish Nemopilema nomurai (Scyphozoa: Rhizostomeae) in the Yellow Sea and the East China Sea. Hydrobiologia 2015, 754, 59–74. [Google Scholar] [CrossRef]
  14. Dong, J.; Wang, B.; Duan, Y.; Yoon, W.D.; Wang, A.Y.; Liu, X.Z.; Li, Y.L.; Sun, M.; Chai, Y. Initial Occurrence, Ontogenic Distribution-Shifts and Advection of Nemopilema nomurai (Scyphozoa: Rhizostomeae) in Liaodong Bay, China, from 2005–2015. Mar. Ecol. Prog. Ser. 2018, 591, 185–197. [Google Scholar] [CrossRef]
  15. Uye, S.-I. Human Forcing of the Copepod–Fish–Jellyfish Triangular Trophic Relationship. Hydrobiologia 2010, 666, 71–83. [Google Scholar] [CrossRef]
  16. Kitajima, S.; Hasegawa, T.; Nishiuchi, K.; Kiyomoto, Y.; Taneda, T.; Yamada, H. Temporal Fluctuations in Abundance and Size of the Giant Jellyfish Nemopilema nomurai Medusae in the Northern East China Sea, 2006–2017. Mar. Biol. 2020, 167, 75. [Google Scholar] [CrossRef]
  17. Kawahara, M.; Ohtsu, K.; Uye, S.-I. Bloom or Non-Bloom in the Giant Jellyfish Nemopilema nomurai (Scyphozoa: Rhizostomeae): Roles of Dormant Podocysts. J. Plankton Res. 2013, 35, 213–217. [Google Scholar] [CrossRef]
  18. Feng, S.; Zhang, F.; Sun, S.; Wang, S.W.; Li, C.L. Effects of Duration at Low Temperature on Asexual Reproduction in Polyps of the Scyphozoan Nemopilema nomurai (Scyphozoa: Rhizostomeae). Hydrobiologia 2015, 754, 97–111. [Google Scholar] [CrossRef]
  19. Feng, S.; Zhang, G.T.; Sun, S.; Zhang, F.; Wang, S.W.; Liu, M.T. Effects of Temperature Regime and Food Supply on Asexual Reproduction in Cyanea Nozakii and Nemopilema nomurai. Hydrobiologia 2015, 754, 201–214. [Google Scholar] [CrossRef]
  20. Wang, P.P.; Zhang, F.; Liu, M.T.; Sun, S.; Xian, H.C. Isotopic Evidence for Size-Based Dietary Shifts in the Jellyfish Cyanea nozakii in the Northern East China Sea. J. Plankton Res. 2020, 42, 689–701. [Google Scholar] [CrossRef]
  21. Shi, Y.Q.; Sun, S.; Zhang, G.T.; Wang, S.W.; Li, C.L. Distribution Pattern of Zooplankton Functional Groups in the Yellow Sea in June: A Possible Cause for Geographical Separation of Giant Jellyfish Species. Hydrobiologia 2015, 754, 43–58. [Google Scholar] [CrossRef]
  22. Yoon, W.D.; Yang, J.Y.; Shim, M.B.; Kang, H.K. Physical Processes Influencing the Occurrence of the Giant Jellyfish Nemopilema nomurai (Scyphozoa: Rhizostomeae) around Jeju Island, Korea. J. Plankton Res. 2008, 30, 251–260. [Google Scholar] [CrossRef]
  23. Purcell, J.E.; Brown, E.D.; Stokesbury, K.D.E.; Haldorson, L.H.; Shirley, T.C. Aggregations of the Jellyfish Aurelia labiata: Abundance, Distribution, Association with Age-0 Walleye Pollock, and Behaviors Promoting Aggregation in Prince William Sound, Alaska, USA. Mar. Ecol. Prog. Ser. 2000, 195, 145–158. [Google Scholar] [CrossRef]
  24. Condon, R.H.; Duarte, C.M.; Pitt, K.A.; Robinson, K.L.; Lucas, C.H.; Sutherland, K.R.; Mianzan, H.W.; Bogeberg, M.; Purcell, J.E.; Decker, M.B.; et al. Recurrent Jellyfish Blooms Are a Consequence of Global Oscillations. Proc. Natl. Acad. Sci. USA 2013, 110, 1000–1005. [Google Scholar] [CrossRef] [PubMed]
  25. Chiba, S.; Batten, S.; Sasaoka, K.; Sasai, Y.; Sugisaki, H. Influence of the Pacific Decadal Oscillation on Phytoplankton Phenology and Community Structure in the Western North Pacific. Geophys. Res. Lett. 2012, 39, 1–6. [Google Scholar] [CrossRef]
  26. McGinty, N.; Barton, A.D.; Record, N.R.; Finkel, Z.V.; Irwin, A.J. Traits Structure Copepod Niches in the North Atlantic and Southern Ocean. Mar. Ecol. Prog. Ser. 2018, 601, 109–126. [Google Scholar] [CrossRef]
  27. Irwin, A.J.; Nelles, A.M.; Finkel, Z.V. Phytoplankton Niches Estimated from Field Data. Limnol. Oceanogr. 2012, 57, 787–797. [Google Scholar] [CrossRef]
  28. Xiao, W.X.; Wang, L.; Laws, E.A.; Xie, Y.Y.; Chen, J.X.; Liu, X.; Chen, B.Z.; Huang, B.Q. Realized Niches Explain Spatial Gradients in Seasonal Abundance of Phytoplankton Groups in the South China Sea. Prog. Oceanogr. 2018, 162, 223–239. [Google Scholar] [CrossRef]
  29. McGinty, N.; Barton, A.D.; Finkel, Z.V.; Johns, D.G.; Irwin, A.J. Niche Conservation in Copepods between Ocean Basins. Ecography 2021, 44, 1653–1664. [Google Scholar] [CrossRef]
  30. Marchessaux, G.; Luskow, F.; Sara, G.; Pakhomov, E.A. Predicting the Current and Future Global Distribution of the Invasive Freshwater Hydrozoan Craspedacusta sowerbii. Sci. Rep. 2021, 11, 23099. [Google Scholar] [CrossRef]
  31. Condon, R.H.; Lucas, C.H.; Pitt, K.A.; Uye, S.-I. Jellyfish Blooms and Ecological Interactions. Mar. Ecol. Prog. Ser. 2014, 510, 109–110. [Google Scholar] [CrossRef]
  32. Lüskow, F.; Galbraith, M.D.; Hunt, B.P.V.; Perry, R.I.; Boersma, M.; Pakhomov, E.A. Gelatinous and Soft-Bodied Zooplankton in the Northeast Pacific Ocean: Phosphorus Content and Potential Resilience to Phosphorus Limitation. Hydrobiologia 2021, 849, 1543–1557. [Google Scholar] [CrossRef]
  33. Ruzicka, J.J.; Brodeur, R.D.; Emmett, R.L.; Steele, J.H.; Zamon, J.E.; Morgan, C.A.; Thomas, A.C.; Wainwright, T.C. Interannual Variability in the Northern California Current Food Web Structure: Changes in Energy Flow Pathways and the Role of Forage Fish, Euphausiids, and Jellyfish. Prog. Oceanogr. 2012, 102, 19–41. [Google Scholar] [CrossRef]
  34. Purcell, J.E. Predation on Zooplankton by Large Jellyfish, Aurelia labiata, Cyanea capillata and Aequorea aequorea, in Prince William Sound, Alaska. Mar. Ecol. Prog. Ser. 2003, 246, 137–152. [Google Scholar] [CrossRef]
  35. Kamiyama, T. Planktonic Ciliates as a Food Source for the Scyphozoan Aurelia aurita (S.L.): Feeding Activity and Assimilation of the Polyp Stage. J. Exp. Mar. Biol. Ecol. 2011, 407, 207–215. [Google Scholar] [CrossRef]
  36. Zhang, F.; Sun, S.; Li, C.L. Estimation on food requirement by large jellyfish Nemopilema nomurai in summer. Oceanol. Limnol. Sin. 2017, 48, 1355–1361, (In Chinese with English abstract). [Google Scholar] [CrossRef]
  37. Ding, F.Y.; Cheng, J.H. The analysis on fish stock characteristics in the distribution areas of large jellyfish during summer and autumn in the East China Sea region. Mar. Fish. 2005, 27, 120–128, (In Chinese with English abstract). [Google Scholar]
  38. Brodeur, R.D.; Sugisaki, H.; Hunt, G.L. Increases in Jellyfish Biomass in the Bering Sea: Implications for the Ecosystem. Mar. Ecol. Prog. Ser. 2002, 233, 89–103. [Google Scholar] [CrossRef]
  39. Moller, L.F.; Riisgard, H.U. Population Dynamics, Growth and Predation Impact of the Common Jellyfish Aurelia aurita and Two Hydromedusae, Sarsia tubulosa, and Aequorea vitrina in Limfjorden (Denmark). Mar. Ecol. Prog. Ser. 2007, 346, 153–165. [Google Scholar] [CrossRef]
  40. Uye, S.-I. Blooms of the Giant Jellyfish Nemopilema nomurai: A Threat to the Fisheries Sustainability of the East Asian Marginal Seas. Plankton Benthos Res. 2008, 3, 125–131. [Google Scholar] [CrossRef]
  41. Sun, X.H.; Sun, X.Y.; Zhu, L.X.; Li, X.; Sun, S. Seasonal and Spatial Variation in Abundance of the Copepod Calanus sinicus: Effects of Decreasing Dissolved Oxygen and Small Jellyfish Bloom in Northern Yellow Sea, China, Nearshore Waters. Mar. Pollut. Bull. 2020, 161, 111653. [Google Scholar] [CrossRef]
  42. Gorsky, G.; Ohman, M.D.; Picheral, M.; Gasparini, S.; Stemmann, L.; Romagnan, J.B.; Cawood, A.; Pesant, S.; Garcia-Comas, C.; Prejger, F. Digital Zooplankton Image Analysis Using the Zooscan Integrated System. J. Plankton Res. 2010, 32, 285–303. [Google Scholar] [CrossRef]
  43. Grosjean, P.; Picheral, M.; Warembourg, C.; Gorsky, G. Enumeration, Measurement, and Identification of Net Zooplankton Samples Using the Zooscan Digital Imaging System. ICES J. Mar. Sci. 2004, 61, 518–525. [Google Scholar] [CrossRef]
  44. Sun, S.; Huo, Y.Z.; Yang, B. Zooplankton Functional Groups on the Continental Shelf of the Yellow Sea. Deep Sea Res. Part II Top. Stud. Oceanogr. 2010, 57, 1006–1016. [Google Scholar] [CrossRef]
  45. Phillips, S.J.; Anderson, R.P.; Schapire, R.E. Maximum Entropy Modeling of Species Geographic Distributions. Ecol. Model. 2006, 190, 231–259. [Google Scholar] [CrossRef]
  46. Dormann, C.F.; Elith, J.; Bacher, S.; Buchmann, C.; Carl, G.; Carré, G.; Marquéz, J.R.G.; Gruber, B.; Lafourcade, B.; Leitão, P.J.; et al. Collinearity: A Review of Methods to Deal with It and a Simulation Study Evaluating Their Performance. Ecography 2013, 36, 27–46. [Google Scholar] [CrossRef]
  47. Duque-Lazo, J.; van Gils, H.; Groen, T.A.; Navarro-Cerrillo, R.M. Transferability of Species Distribution Models: The Case of Phytophthora cinnamomi in Southwest Spain and Southwest Australia. Ecol. Model. 2016, 320, 62–70. [Google Scholar] [CrossRef]
  48. Schneider, G. The Common Jellyfish Aurelia aurita: Standing Stock, Excretion and Nutrient Regeneration in the Kiel Bight, Western Baltic. Mar. Biol. 1989, 100, 507–514. [Google Scholar] [CrossRef]
  49. Wiebe, P.H.; Boyd, S.; Cox, J.L. Relationships between Zooplankton Displacement Volume, Wet Weight, Dry Weight and Carbon. Fish. Bull. 1975, 73, 777–786. [Google Scholar]
  50. Omori, M. Weight and Chemical Composition of Some Important Oceanic Zooplankton in the North Pacific Ocean. Mar. Biol. 1969, 3, 4–10. [Google Scholar] [CrossRef]
  51. Huo, Y.Z.; Sun, S.; Zhang, F.; Wang, M.X.; Li, C.L.; Yang, B. Biomass and Estimated Production Properties of Size-Fractionated Zooplankton in the Yellow Sea, China. J. Mar. Syst. 2012, 94, 1–8. [Google Scholar] [CrossRef]
  52. Ikeda, T. Metabolic Rates of Epipelagic Marine Zooplankton as a Function of Body Mass and Temperature. Mar. Biol. 1985, 85, 1–11. [Google Scholar] [CrossRef]
  53. Runge, J.A.; Roff, J.C. The Measurement of Growth and Reproductive Rates. In ICES Zooplankton Methodology Manual; Harris, R.P., Wiebe, P., Lenz, J., Huntley, M., Skjoldal, H.R., Eds.; Academic Press: Cambridge, MA, USA, 2000. [Google Scholar] [CrossRef]
  54. Ikeda, T.; Motoda, S. Estimated Zooplankton Production and Their Ammonia Excretion in the Kuroshio and Adjacent Seas. Fish. Bull. 1978, 76, 357–366. [Google Scholar]
  55. R Core Team. R: A Language and Environment for Statistical Computing; R Foundation for Statistical Computing: Vienna, Austria, 2022. [Google Scholar]
  56. Wang, J.J.; Li, C.L.; Yang, G.; Tao, Z.C.; Wang, Y.Q.; Xian, H.C. Dietary Preferences and Potential Ecological Impact on the Zooplankton Community of Nemopilema nomurai Based on Stable Isotope and Fatty Acid Analyses. J. Oceanol. Limnol. 2022, 40, 1085–1096. [Google Scholar] [CrossRef]
  57. Wang, P.P.; Zhang, F.; Sun, S.; Yang, T. Distribution of giant jellyfish in the Bohai Sea in June 2018. J. Oceanol. Limnol. 2020, 51, 85–94, (In Chinese with English abstract). [Google Scholar]
  58. Wang, B.; Li, Y.L.; Shen, H.; Li, T.P.; Wang, W.B.; Sun, M.; Dong, J. Quantity distribution of Cyanea nozakii in inshore waters of northern Liaodong Bay, Bohai Sea in 200–2013. Mar. Fish. 2014, 36, 146–154. [Google Scholar] [CrossRef]
  59. Zuo, T.; Wu, Q.; Wang, J.; Li, Z.Y. Annual survey of the species dicersity and assemblage dynamics of medusae in Laizhou Bay, Bohai Sea. Acta Ecol. Sin. 2016, 36, 5646–5656, (In Chinese with English abstract). [Google Scholar]
  60. Zang, W.X.; Zhang, F.; Chi, X.P.; Sun, S. Relationship between Asexual Reproduction of Aurelia coerulea Polyps and Jellyfish Blooms under the Influence of Temperature Dynamics in Winter and Spring. Front. Mar. Sci. 2022, 9, 948. [Google Scholar] [CrossRef]
  61. Henschke, N.; Stock, C.A.; Sarmiento, J.L. Modeling Population Dynamics of Scyphozoan Jellyfish (Aurelia spp.) in the Gulf of Mexico. Mar. Ecol. Prog. Ser. 2018, 591, 167–183. [Google Scholar] [CrossRef]
  62. Wang, L.; Xu, K.D. Spatiotemporal Distribution of Protozooplankton and Copepod Nauplii in Relation to the Occurrence of Giant Jellyfish in the Yellow Sea. Chin. J. Oceanol. Limnol. 2013, 31, 1226–1240. [Google Scholar] [CrossRef]
  63. Xiao, W.P.; Zeng, Y.; Liu, X.; Huang, X.G.; Chiang, K.P.; Mi, T.Z.; Zhang, F.; Li, C.L.; Wei, H.; Yao, Q.Z.; et al. The Impact of Giant Jellyfish Nemopilema nomurai Blooms on Plankton Communities in a Temperate Marginal Sea. Mar. Pollut. Bull. 2019, 149, 110507. [Google Scholar] [CrossRef]
  64. Jin, X.S.; Zhao, X.Y.; Meng, T.X.; Cui, Y. Biological Resources and Habitat of Yellow and Bohai Seas; Science Press: Beijing, China, 2005. [Google Scholar]
  65. Schneider, G.; Behrends, G. Top-Down Control in a Neritic Plankton System by Aurelia aurita Medusae—A Summary. Ophelia 1998, 48, 71–82. [Google Scholar] [CrossRef]
  66. Wang, W.C. Long-Term Changes of Zooplankton Functional Groups in Jiaozhou Bay. Doctoral Thesis, Institute of Oceanology, Chinese Academy of Sciences, Qingdao, China, 2017. (In Chinese with English abstract). [Google Scholar]
  67. Sun, S.; Zhou, K.; Yang, B.; Zhang, Y.S.; Ji, P. Ecology of zooplankton in the Jiaozhou Bay I. species composition. China J. Oceanol. Limnol. 2008, 39, 1–7+2. [Google Scholar]
  68. Eriksen, E.; Skjoldal, H.R.; Dolgov, A.V.; Strand, E.; Keulder-Stenevik, F.; Prokopchuk, I.P.; Prokhorova, T.A.; Prozorkevich, D.; Benzik, A.N. Diet and Trophic Structure of Fishes in the Barents Sea: Seasonal and Spatial Variations. Prog. Oceanogr. 2021, 197, 102663. [Google Scholar] [CrossRef]
  69. Lomartire, S.; Marques, J.C.; Gonçalves, A.M.M. The Key Role of Zooplankton in Ecosystem Services: A Perspective of Interaction between Zooplankton and Fish Recruitment. Ecol. Indic. 2021, 129, 107867. [Google Scholar] [CrossRef]
  70. Vinogradov, M.E.; Shushkina, E.A.; Bulgakova, Y.V.; Serobaba, I.I. The Consumption of Zooplankton by Comb Jelly Mnemiopsis leidyi and Pelagic Fishes in the Black Sea. Okeanologiya 1996, 35, 523–527. [Google Scholar]
  71. Opdal, A.F.; Brodeur, R.D.; Cieciel, K.; Daskalov, G.M.; Mihneva, V.; Ruzicka, J.J.; Verheye, H.M.; Aksnes, D.L. Unclear Associations between Small Pelagic Fish and Jellyfish in Several Major Marine Ecosystems. Sci. Rep. 2019, 9, 2997. [Google Scholar] [CrossRef]
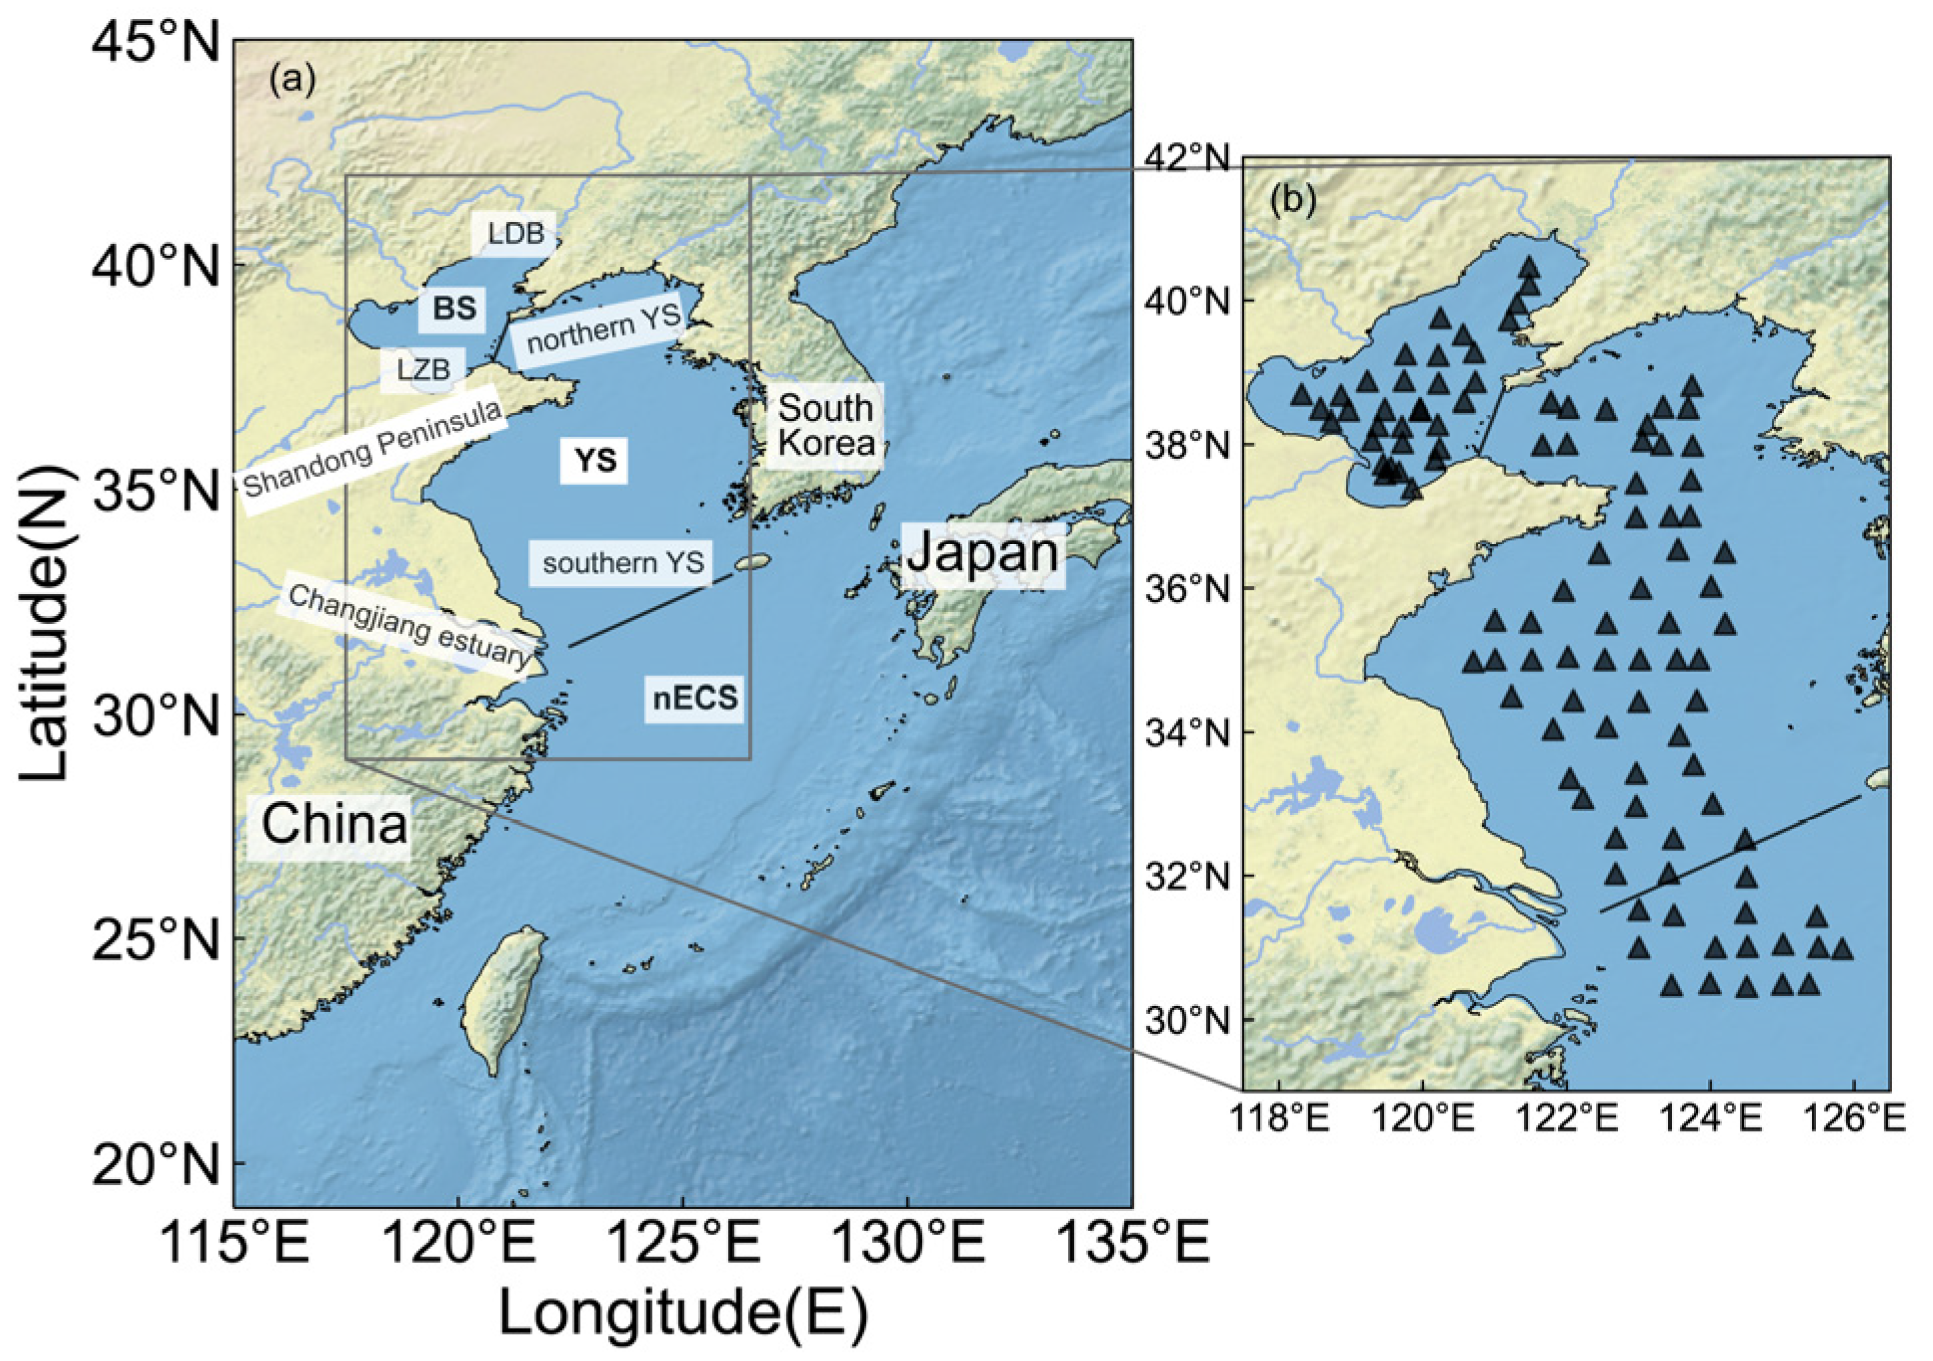
Figure 1. Sampling sites (triangles) within three sectors of the study area. nECS: northern East China Sea, YS: Yellow Sea, BS: Bohai Sea, LZB: Laizhou Bay, LDB: Liaodong Bay.
Diversity 15 00729 g001
Figure 2. Plots of the principal component analysis (PCA) for the environmental variables throughout the regions. nECS: northern East China Sea, YS: Yellow Sea, BS: Bohai Sea, Temp: temperature (°C), Sal: salinity, Chl: chlorophyll a concentration (mg·m−3), Dep: depth (m).
Diversity 15 00729 g002
Figure 3. Distribution pattern of abundance (ind.·km−2) and biomass (kg·km−2) of Nemopilema nomurai (a,d), Cyanea spp. (b,e), and Aurelia coerulea (c,f) in summer 2021 in the northern Chinese coastal seas.
Diversity 15 00729 g003
Figure 4. Distribution of mean abundance (ind.·km−2, ±standard deviation) and biomass (kg·km−2, ±standard deviation) of Nemopilema nomurai (a,d), Cyanea spp. (b,e), and Aurelia coerulea (c,f) in summer 2021 in the northern Chinese coastal seas. The y-axis scales vary among the plots. nECS: northern East China Sea, YS: Yellow Sea, BS: Bohai Sea.
Diversity 15 00729 g004
Figure 5. Realized niches of the univariate environmental variables for (a) temperature (°C), (b) salinity, and (c) chlorophyll a concentration (mg·m−3) for Nemopilema nomurai, Cyanea spp., and Aurelia coerulea. Colored lines indicated the 95% confidence intervals for each parameter from 100 bootstrapped resampling.
Diversity 15 00729 g005
Figure 6. Mean niches of paired environmental variables for large jellyfish. (a) Temperature and salinity, (b) temperature and chlorophyll a concentration, (c) salinity and chlorophyll a concentration. Colored lines indicated the 95% confidence intervals for each parameter from 100 bootstrapped resampling.
Diversity 15 00729 g006
Figure 7. Distribution of zooplankton abundance (ind.·m−3) in August and September 2021 in the northern East China Sea (nECS) and southern Yellow Sea (YS). GC: giant crustaceans, LC: large copepods, SC: small copepods, TU: tunicates, CH: chaetognaths, ME: medusae, and OT: other organisms.
Diversity 15 00729 g007
Figure 8. Abundance of zooplankton and small copepods under different population size of Nemopilema nomurai in August and September 2021 in the northern East China Sea (nECS) and southern Yellow Sea (YS).
Diversity 15 00729 g008
Figure 9. Zooplankton composition and relative abundance under different population sizes of Nemopilema nomurai in August and September 2021 in the northern East China Sea (nECS) and southern Yellow Sea (YS).
Diversity 15 00729 g009
Table 1. Sea bottom environmental variables (mean ± standard deviation) in summer 2021 in the northern Chinese coastal seas. nECS: northern East China Sea, YS: Yellow Sea, BS: Bohai Sea.
AreaNumberDepth (m)Temperature (°C)SalinityChlorophyll a (mg·m−3)
nECS1146.63 ± 14.7924.36 ± 2.2432.85 ± 2.210.37 ± 0.18
YS5052.88 ± 18.9014.22 ± 5.9432.11 ± 0.740.52 ± 0.47
BS3423.03 ± 9.2123.24 ± 2.6629.46 ± 4.780.79 ± 0.38
Table 2. The mean permutation importance (%) of the environmental variables in the MaxEnt analysis. AUC: area under the ROC curve, Temp: temperature (°C), Sal: salinity, Chl: chlorophyll a concentration (mg·m−3).
SpeciesAUCVariablePercent Contribution (%)
Nemopilema nomurai0.655Temp23.7
Sal57.2
Chl19.1
Cyanea spp.0.819Temp70.9
Sal13.7
Chl15.4
Aurelia coerulea0.912Temp27.3
Sal67.9
Chl4.7
Table 3. The standing stock (mgC·m−2) and production of zooplankton (mgC·m−2 d−1) and the feeding rate (mgC·m−2 d−1) and feeding pressure per day (%) of Nemopilema nomurai on the standing stock and production rate of zooplankton in summer 2021 in the northern Chinese coastal seas.
Capture RateMeanRange
Standing stock of zooplankton-453.3751.09–1267.85
Production rate of zooplankton-59.389.54–121.04
Feeding rate0.121.050.00–62.94
0.45.260.00–15.74
Feeding pressure on standing stock0.17.700.00–25.51
0.41.920.00–6.38
Feeding pressure on production rate0.155.160.00–183.45
0.413.790.00–45.86
Disclaimer/Publisher’s Note: The statements, opinions and data contained in all publications are solely those of the individual author(s) and contributor(s) and not of MDPI and/or the editor(s). MDPI and/or the editor(s) disclaim responsibility for any injury to people or property resulting from any ideas, methods, instructions or products referred to in the content.