Article

Isolating Greater Cane Rat Populations (Thryonomys swinderianus) from Eastern Arc Mountains, Tanzania: Linking Diversity to Morphometric and Molecular Characteristics

by
Shadia I. Kilwanila
1,2,3,*,
Charles M. Lyimo
4,
Rhodes H. Makundi
2 and
Alfan A. Rija
1
1
Department of Wildlife Management, Sokoine University of Agriculture (SUA), Chuo Kikuu, Morogoro P.O. Box 3073, Tanzania
2
Africa Centre of Excellence for Innovative Rodent Pest Management and Biosensor Technology Development, Sokoine University of Agriculture (SUA), Morogoro P.O. Box 3110, Tanzania
3
Department of Zoology and Wildlife Conservation, University of Dar es Salaam, Dar es Salaam P.O. Box 35064, Tanzania
4
Department of Animal Aquaculture and Range Sciences, Sokoine University of Agriculture (SUA), Chuo Kikuu, Morogoro P.O. Box 3004, Tanzania
*
Author to whom correspondence should be addressed.
Diversity 2023, 15(5), 626; https://doi.org/10.3390/d15050626
Submission received: 10 September 2022 / Revised: 16 April 2023 / Accepted: 20 April 2023 / Published: 4 May 2023
(This article belongs to the Section Phylogeny and Evolution)

Abstract

:
Evolutionary information on the greater cane rat (Thryonomys swinderianus) in the Eastern and Southern African regions is scarce, making population management and conservation of the species challenging. We studied T. swinderianus populations from two spatially isolated Eastern Arc Mountains in Tanzania to link molecular and geometric–morphological evidence to characterize these populations’ diversity. Fecal samples (n = 50) and skulls (n = 99) of T. swinderianus were collected from Udzungwa (north and south) and Uluguru mountains (urban and rural sites) and analyzed using molecular and geomorphometry techniques. Molecular analysis grouped the population into three distinct clades based on the location where the samples were collected, while the morphometric method was not able to distinctively separate the populations. Both methods revealed that the population obeyed the isolation by distance model with higher genetic distance between the Udzungwa and Uluguru populations and lower distance between Uluguru urban and rural populations. Both Mahalanobis and Procrustes distances in skull landmarks between the Udzungwa and Uluguru populations were significantly higher across the dorsal, ventral, and lateral views of the skulls, suggesting strongly that molecular and morphometric methods applied together can be useful in characterizing the population traits of the least known species. Our study suggests genetic and morphometric methods could complement each other in understanding the evolutionary biology and within-species diversity of vertebrate species that do not exhibit strong intra-species differentiation.

1. Introduction

Variability in organisms is one of the features useful in delineating species in biology. Several trait characteristics of the species including morphological, physiological, developmental, behavioral, ecological and genetic parameters have been useful in studying various taxa. The pattern of these traits is shaped by the evolutionary history of the species and is useful in inferring the biodiversity of an area [1,2]. Morphological characteristics such as cranial shape and size are widely used in diversity studies in many taxa [3,4,5]. In rodents, which comprise 42% of known mammalian species [6] for example, phenotypic variations such as the morphology of skulls have evolved to adapt to a wide range of ecological niches [7]. In such a mammal group, phenotypic traits have long been used in describing species diversity [8], although more recently, due to the phenotypic variability in rodents [9,10], evidence from genetic analyses is increasingly being applied to complement the description of species more accurately [11]. For example, Kawakami et al. [12], studying different strains of mice (Mus spp.) showed that genetically closely related strains do not always possess morphologically similar crania. This suggests that linking evidence from both morphology and genetics can be a useful way to accurately describe species that would otherwise be confused due to phenotypic variability. The greater cane rat (Thryonomys swinderianus) is a rodent species distributed across Eastern and Southern Africa, whose knowledge of morphometric and genetic traits is still lacking. Such information, when available, could be useful in managing the species in fragmented habitats where survival is threatened due to illegal hunting and habitat disturbances [13].
Many factors influence craniometric variations in rodents, although in our study, we were more concerned with the cranio-morphometric diversity and genetic differentiation of geographically isolated populations of cane rats. Some studies on vertebrates have highlighted the potential factors influencing such variations. For example, a study of the central African rodent, Praomys misonnei, indicated precipitation gradients influenced both genomic and craniometrics variations, which was most likely due to effects on vegetation structure [14]. Other studies have reported strong gene–environment associations in determining cranial morphology [7], a strong influence of geographical distances on skull shapes [15,16], and roles of environmental characteristics such as altitudinal variations, vegetation types, etc. on the skull shape of rodents [17] and in non-rodent species of vertebrates [18]. Furthermore, a study on Mastomys natalensis Smith 1834, a widely distributed species in Sub-Saharan Africa, has reported a micro-evolutionary process within populations inhabiting different environments using a geometric–morphometric approach [19]. These studies show that geometric–morphometric and molecular analysis approaches are increasingly being used to establish variations in isolated populations of the same species. Furthermore, rodents occupy a diverse range of environments and habitats ranging from farmland, woodlands, forests, savanna grasslands, and mountainous landscapes at varying altitudes [20] and therefore, geographically isolated populations are likely to form groups that are morphologically different in size and genetics [21]. For example, among the Muroid rodents, a remarkable anatomical variety of the head skeleton even among closely related lineages has been reported [22].
Quantitative craniometrical traits incorporated into population genetic methods can provide insight into the cane rats’ population structure in the Eastern Arc Mountains. Some studies on other vertebrate species have suggested that skull morphology has substantial potential to evolve and that craniometrical characters can provide consistent phylogenetic signals [23]. Kawakami et al. [24] suggested that the craniometry of rodents could provide a good systemic model to study the relationship between genetic variation and cranial shape evolution. Therefore, it is plausible that the morphological diversity of the cranium should reflect the phylogenetic and functional traits of a species inhabiting heterogeneous habitats where the populations are isolated from each other.
The greater cane rats show intra-species variability in body size, but the association between morphological variability and genetic differentiation is little known. The species has a wide geographical distribution across Africa [13], occupying diverse habitats. A molecular approach in addition to craniometrical measurements can confirm the variability between and within these populations. Many studies have been conducted on cane rats but more widely covering ecology and reproduction, with most of them concentrated in West Africa [13]. Other studies conducted in West Africa have focused on sexual dimorphism [1], gross morphology and morphometry of the spinal cord [25], the brain [26] and characterization of the morphology of the brain across age groups [27]. Igado et al. [28] investigated the craniofacial and ocular morphometrics of male T. swinderianus in Nigeria aimed at early detection of the characteristic facial appearance of some syndromes. Although these studies are useful in providing information about this species morphometrically, they are more confined to West Africa and on domesticated cane rats, which implies that they cannot be representative of all other regions in Africa. Furthermore, the studied populations in West Africa inhabit wet equatorial regions with a strong ecological contrast with the savanna and montane biomes in Eastern and Southern Africa. Comparable information on the cane rat population distribution in the savanna and montane eco-regions is necessary for augmenting this species’ biology across Africa.
The aim of this study was to investigate the molecular and cranial morphometric diversity in isolated populations of the greater cane rats in two mountain blocks of the Eastern Arc, which are located in Morogoro, Tanzania. We hypothesized that skull shape will be strongly associated with genetic variations of cane rat populations occupying geographically isolated habitats in the Eastern Arc Mountains. Specifically, we assessed how cranial shapes of three skull views—lateral, ventral and dorsal—are scaled with the age and species locality and how such insights are mirrored in the genetic diversity of the cane rat populations. These data add to the biological repertoire of this species and may be useful in devising potential population management strategies, conservation and game farming and ranching within its range of distribution in Eastern and Southern Africa.

2. Materials and Methods

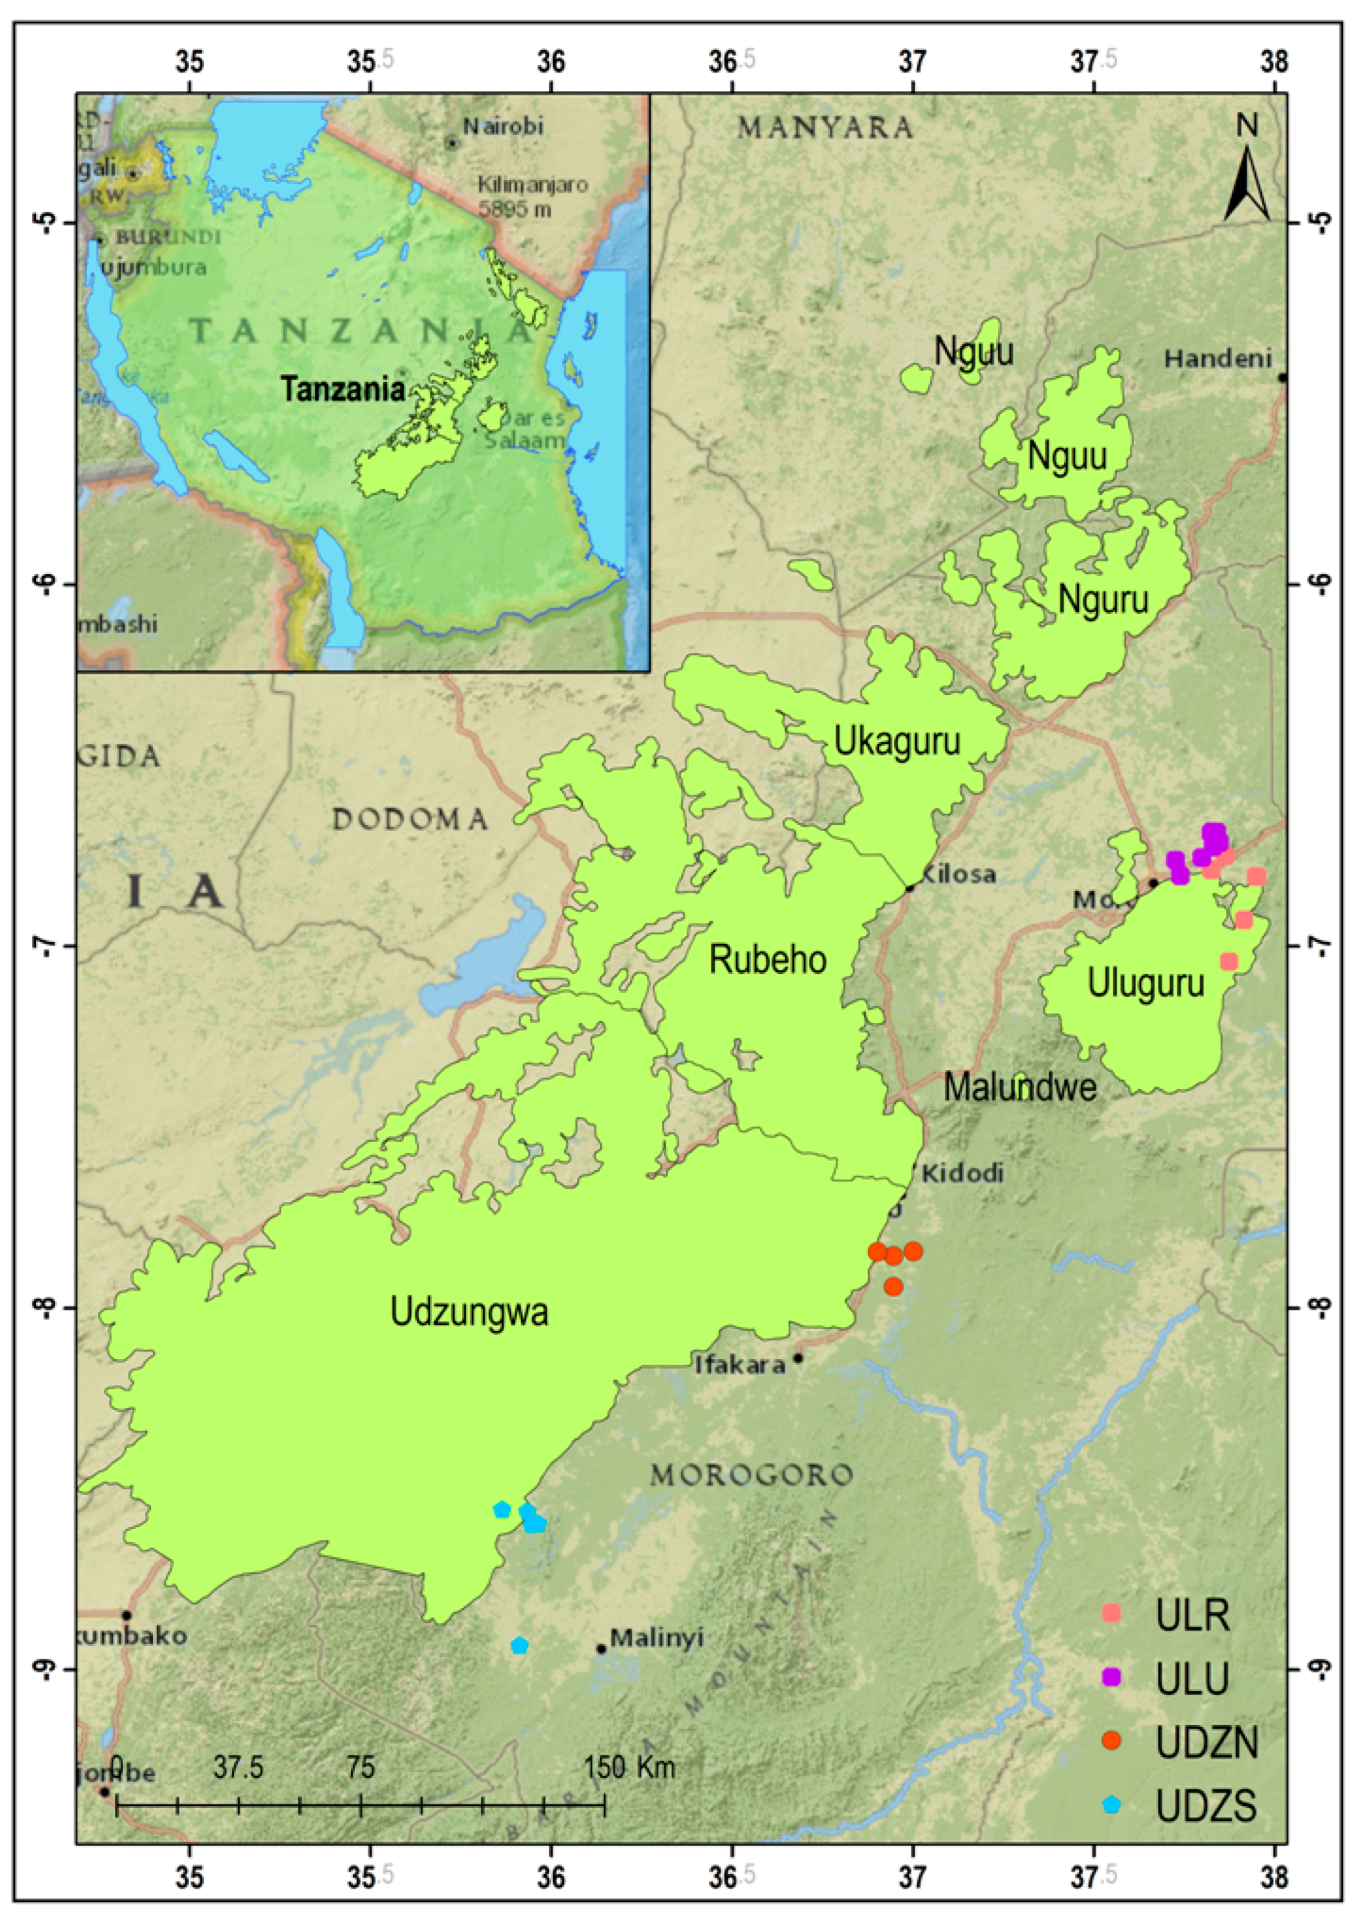
2.1. Sampling Sites and Sampling Procedure

Field data collection was conducted between April 2019 and December 2020 in Udzungwa and Uluguru mountains, which lie within the Eastern Arc Mountains in Tanzania (Figure 1). Uluguru populations were further divided into Uluguru urban and Uluguru rural depending on the location where samples were collected. Uluguru urban and Uluguru rural are distinct areas based on varying land use patterns and urbanization levels, which are known to greatly influence behavior of vertebrate species [29]. Cane rats were captured at altitudes ranging from 400 to 1200 m above sea level in fallow, grasslands or bushed grasslands in both Udzungwa and Uluguru Mountains. Samples from Udzungwa were collected from the northern and southern parts of the mountain block.
To collect data for morphometric analyses, we deployed experienced local hunters in each location to capture Thryonomys swinderianus using local methods, as there is no documented standardized method available for capturing greater cane rats in the wild. Cane rats are among the wild mammal species hunted for meat supply in rural communities surrounding the Eastern Arc Mountains [13,30]. The local hunters were deployed to obtain the required samples allowing them to retain the rest of the carcasses. The locality where an animal was captured or hunted was marked and was later visited by a research assistant to record the GPS coordinates. Because the hunters use locally made nets to trap cane rats which may capture juvenile animals, only sub-adults and adults were used for this study. A live captured Thryonomys swinderianus was sacrificed, and the head was removed for craniometric measurements of the skull. The age of each animal was recorded and was further refined in the laboratory as explained below. Heads were cleaned of tissue remains and debris using boiled water, sodium hypochlorite, and hydrogen peroxide after the outer skin had been removed with surgical blades [31]. Fecal samples were collected for molecular analysis.
DNA extraction was completed in 50 fecal samples using a zymo-research kit for fecal samples following the manufacturer’s protocol without modifications. Amplifications of the 515 bp region mt-DNA D-loop via Polymerase Chain Reaction (PCR) were performed using both forward and reverse primers following [32]. PCR was conducted under various conditions: initial denaturation at 95 °C for 2 min; 35 cycles of denaturation at 95 °C for 30 s, annealing at 55 °C for 30 s, extension at 74 °C for 1 min and a final extension at 74 °C for 7 min. The PCR products were Sanger sequenced by macrogen (Europe).
Refining the age classes of each skull was based on the eruption and wear of molar teeth and the degree of exposure [6,33]. Adults had the third molar fully erupted, showing signs of wear with exposed dentin on all teeth and roots partially exposed, whereas the sub-adults had all molars erupted with cusps still enameled, little exposed dentin and roots completely in the alveoli [33]. Furthermore, to create landmarks for analysis, each skull was photographed from the dorsal, ventral and left lateral views. Damaged skulls were photographed only in the view(s) with the landmark regions. The photographs were taken using a Nikon D3100 camera with a resolution of 14.2 megapixels. The camera lens was positioned parallel to the photographic background. For photographs of the dorsal view, specimens were positioned with the molar surface facing the background. For the ventral view, the specimens were placed with parietal bones facing the background. For photographs of the lateral view, skulls were fixed on the background by the zygomatic arch. The landmark digitization was carried out using 286 high-quality images out of the 386 photographs taken.

2.2. Data Analysis

2.2.1. Geometric Morphometric Assessment

To investigate the craniometric features of T. swinderianus, we made a TPS file from photographs with .jpg format using TPSUtil software ver 1.82 [34]. Thirteen two-dimensional landmarks were digitized in the ventral view (Figure 2; Supplementary Table S1), nine were digitized in the left lateral view of the skull (Figure 3; Supplementary Table S2) and twelve were digitized in the dorsal view (Figure 4; Supplementary Table S3), using the TPSDig software version 2.32 [34]. Depending on the quality of the skull (i.e., not broken), the number of digitized photographs of the skull varied in number with 80 ventral, 80 dorsal, and 96 lateral views. Damaged skulls were left out from analysis but were cataloged and archived in the Zoology laboratory at Sokoine University of Agriculture for future research. Landmarks were imported into MorphoJ software version 10.11 in TPS format, and coordinates were superimposed using the Generalized Procrustes Analysis (GPA) algorithm to extract shape information. GPA is a procedure that removes the effects of scale, orientation and position differences to avoid potential biases in the results [10] and leaves only shape variation. Procrustes analysis is a form of statistical shape analysis used to analyze the distribution of a set of shapes using landmarks. The size of each skull in each view was estimated from its centroid size, which is defined as the square root of the sum of squares of the distances of landmarks from the centroid [35]. Data distribution and the outliers were inspected graphically by plotting the cumulative distribution of the squared Mahalanobis distances against a multivariate normal distribution fitted to the data as described in MorphoJ [36]. To assess the morphometric differences that exist between samples collected from different locations, we used the centroid size of each population group to perform a Kruskal–Wallis test, which was implemented in software R version 3.6.3. Furthermore, to assess the patterns of shape variation that may exist among population groups under study, we used Canonical Variate Analysis (CVA) [37]. CVA works by transforming the original measurements of the specimen, e.g., landmarks into a set of new variables called canonical variates, which are uncorrelated with each other but capture the most importance sources of variation between groups. The number of canonical variates is equal to the number of groups minus one, and each one represents a specific combination of original variables that maximizes the separation between groups. The p-value of the CVA was checked by calculating Procrustes distances with 1000 iterations per comparison.
During analysis, confidence ellipses were set at a probability of 0.9. Mahalanobis and Procrustes distances were calculated and used to draw neighbor-joining phylogram using SplitsTree software ver. 5.3.0 [38] (Figure 5) to show the relationship that exists between populations. An individual Procrustes distance matrix was generated using the “geomorph” package in the R environment [39,40]. The Mantel test was then performed in R using the “vegan” package [40,41] with Procrustes distance and genetic distance matrices. The genetic distance matrix was generated in MEGA software version 6.0 [42] using the most appropriate substitution model as described in [43]. Furthermore, to assess the relative amount of shape variation (representing biological variation) among individuals, we ran a Procrustes analysis of variance (ANOVA) using location and age as classifiers.

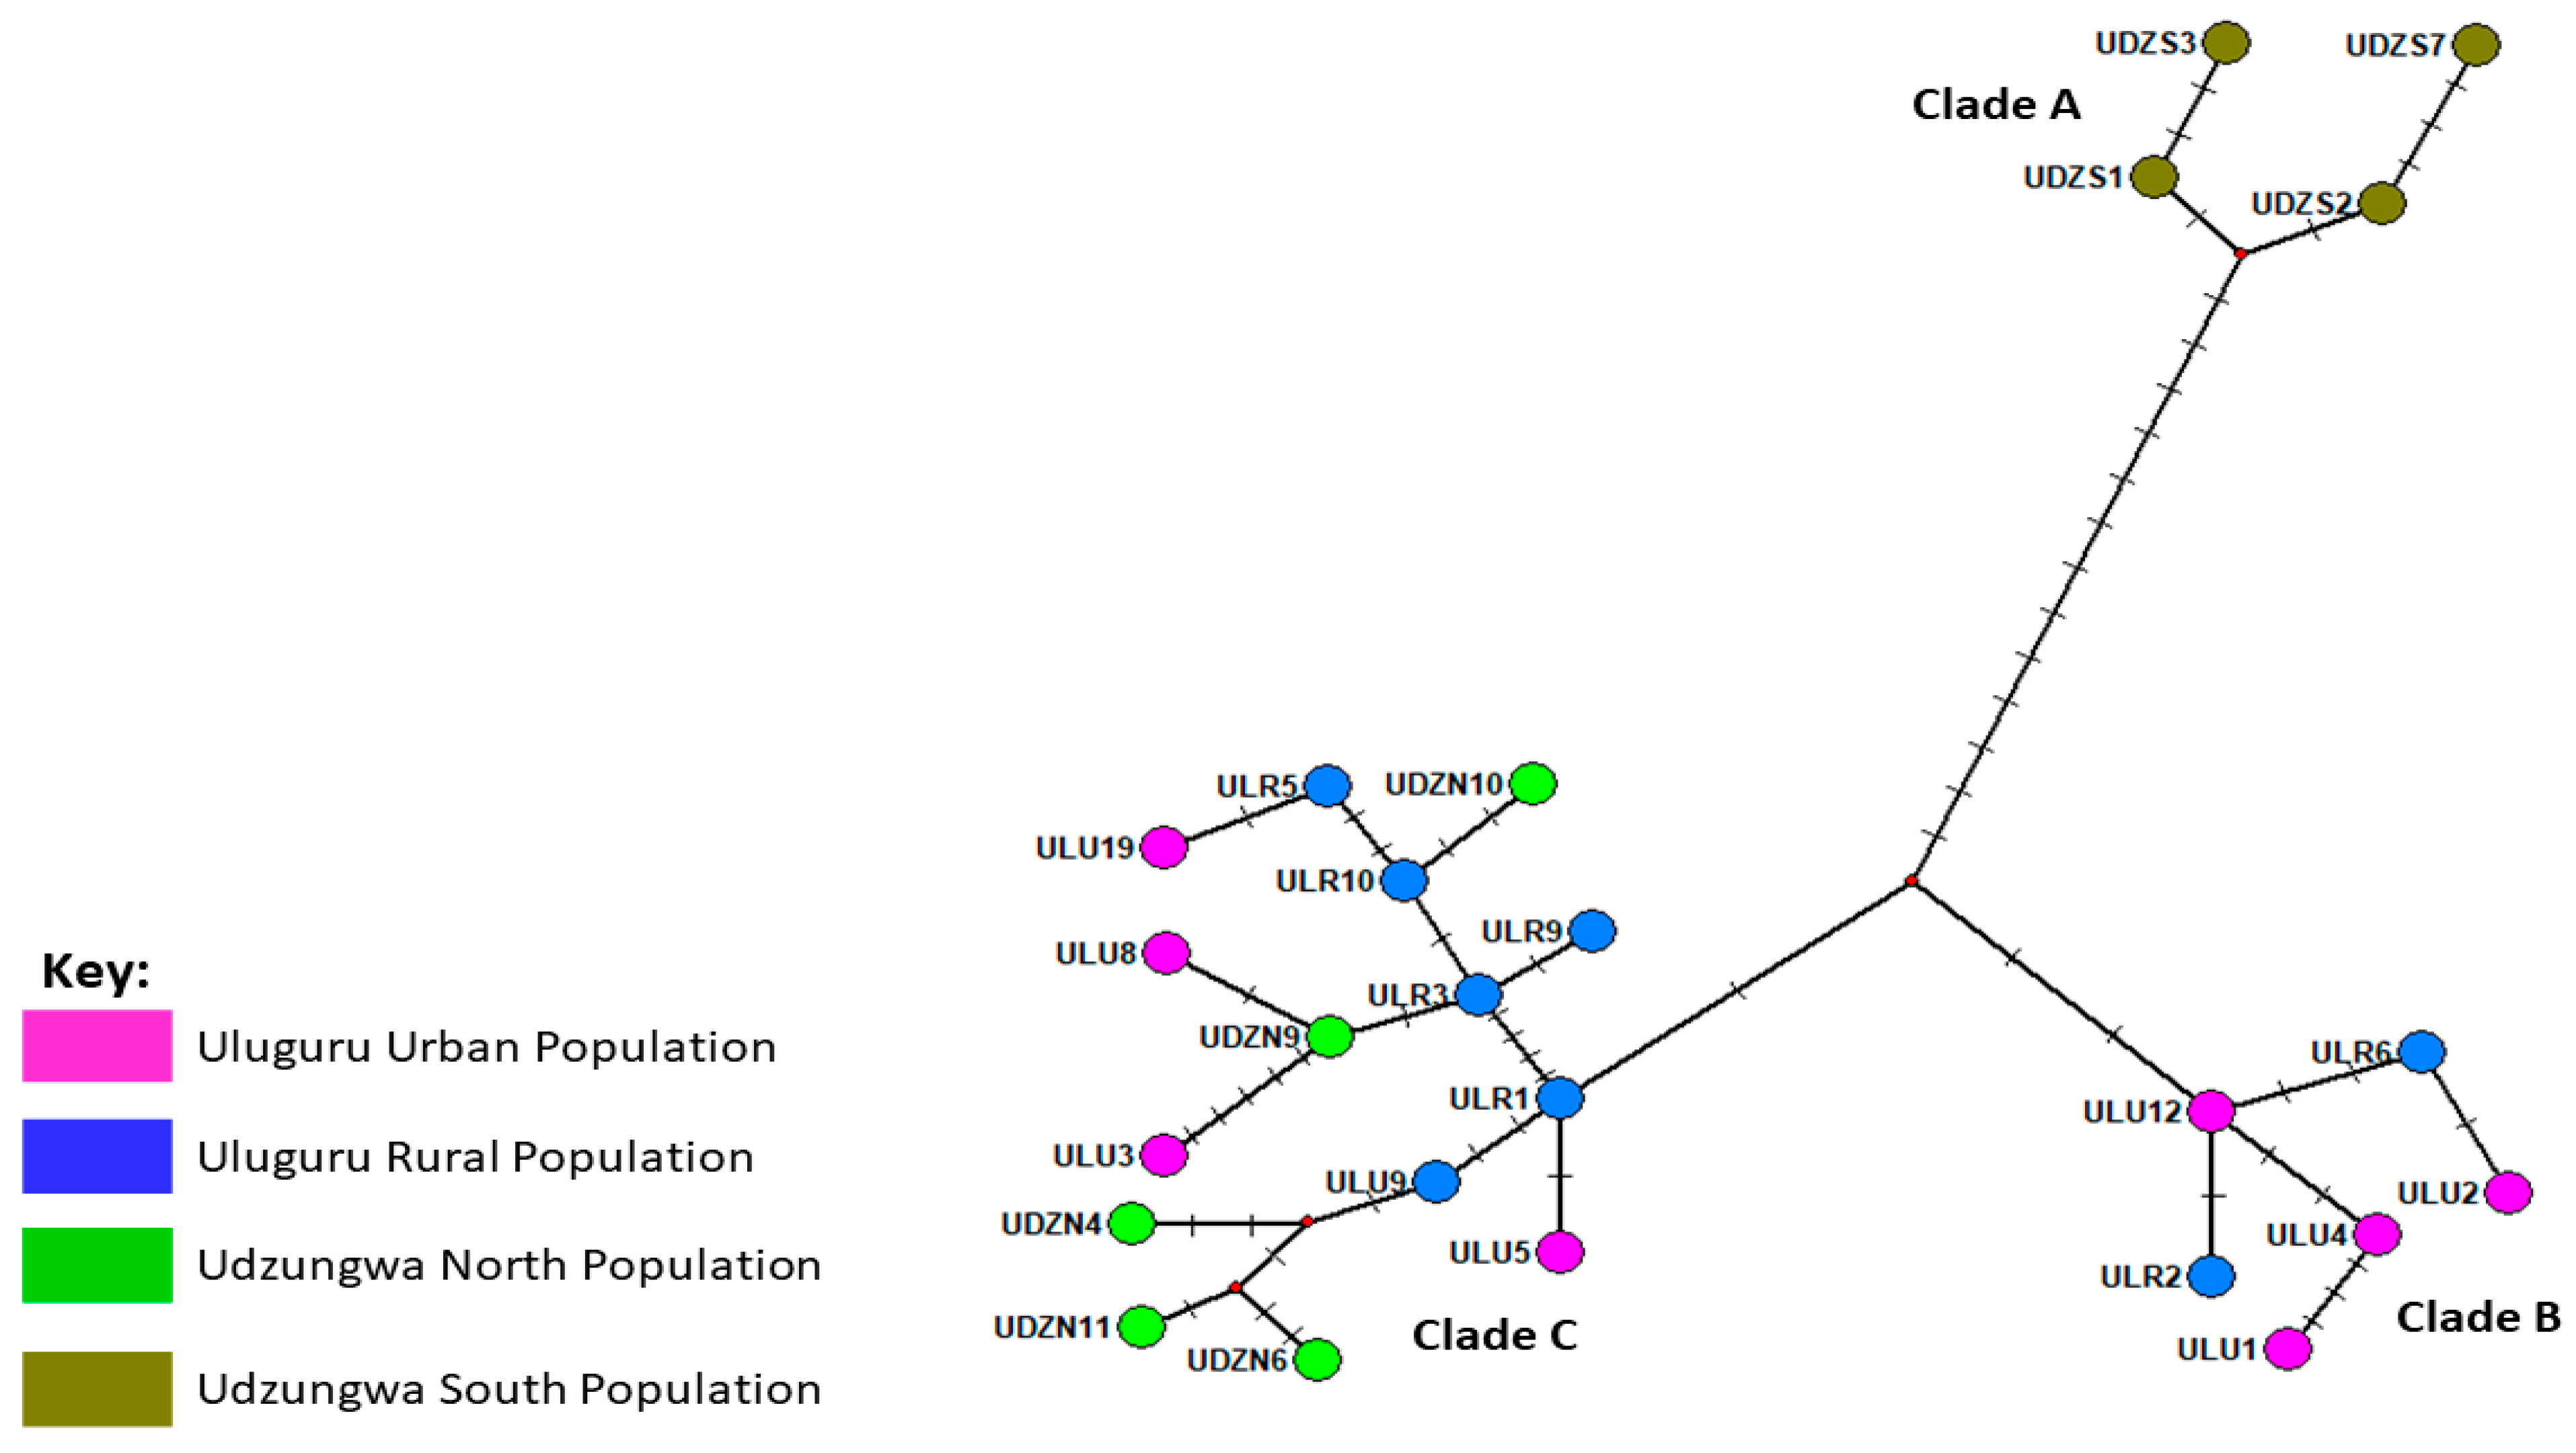
2.2.2. Molecular Analysis

Nucleotide sequence editing and alignment were carried out using the BioEdit program version 7.0.9.0 [44]. Following quality control procedures, 46 sequences were retained for analysis and were deposited in the NCBI gene bank with accession numbers OM475549-OM475594. Using MEGA program version 6.0, aligned sequences were used to infer the evolutionary history of T. swinderianus by constructing a neighbor-oining phylogenetic tree as explained in [43]. The nodes’ robustness was tested using 100,000 bootstraps. A median-joining network was built using 25 haplotypes implemented in Network software version 4.6 to observe haplotype phylogenetic and geographical relationships. The population structure of T. swinderianus was determined using Arlequin version 3.5.2.2 and Analysis of Molecular Variance (AMOVA). The sampling localities and significant clades discovered in the median-joining analysis were used to define hierarchical levels used in AMOVA. An Individual Pairwise FST was estimated using the algorithm proposed by [45] in the Arlequin program version 3.5.2.2.
A Mantel test was performed between geographic and genetic distances at 1,000,000 permutations in software R version 3.6.3 using “Geodist”, “ape” and “vegan” packages to establish isolation by distance pattern [46].

3. Results

3.1. Matching Geometric and Genetic Variation Evidence in T. swinderianus Populations

Differences between Populations

We found no significant differences between the four populations based on the centroid size in the ventral, dorsal and left lateral views. In addition, CVA revealed that there was non-significant shape variation among four populations in the scatter plots in all three views (Figure 3, Figure 4 and Figure 5).
In the ventral view, the first discriminant function explains 47.49% of the between-group variability, and the second discriminant function explains 17.512% of the between-group variability (Figure 3).
A higher differentiation in shape (Mahalanobis distance) was revealed for the Udzungwa south population when compared to the Uluguru urban (Mahalanobis distance = 2.7865, p = 0.1180) and Uuguru rural populations (Mahalanobis distance = 2.2598, p = 0.3564). Shape differentiation (Mahalanobis distance) between Uluguru rural and urban was low and non-significant (Mahalanobis distance = 1.5776, p = 0.0111). Furthermore, examining the absolute magnitude of shape deviation (Procrustes distance) of T. swinderiunus, we found the Udzungwa south population had higher but non-significant deviation from Uluguru urban (Procrustes distance = 0.0575, p = 0.4616) and Uluguru rural (Procrustes distance = 0.0218, p = 0.5781). In addition, the magnitude of shape deviation between Uluguru rural and urban was low and non-significant (Procrustes distance = 0.0462, p = 0.0895) (Table 1; Figure 3).
On the other hand, the amount of the variation between groups explained by the first discriminant function was 48.146%, while the second discriminant function explains (24.167%) in the left lateral view (Figure 4).
The Udzungwa south population had higher but non-significant shape differentiation (Mahalanobis distance) when compared to Uluguru urban (Mahalanobis distance = 2.5772, p = 0.0473) and Uluguru rural (Mahalanobis distance = 2.5284, p = 0.0418). In addition, we found no significant shape differentiation between Uluguru rural and urban (Mahalanobis distance = 0.9281, p = 0.2344; see Table 2). The absolute magnitude of shape differentiation (Procrustes distance) revealed a large but not significant deviation of the Udzungwa south population when compared to Uluguru urban (Procrustes distance = 0.0630, p = 0.0124) and Uluguru rural (Procrustes distance = 0.0628, p = 0.03941). The magnitude of the shape deviation between Uluguru urban and rural was low and non-significant (Procrustes distance = 0.0117, p = 0.7840; Table 2; Figure 4).
Analyzing the dorsal view (Figure 5), we found the first discriminant function explains 56.935% of the between group variation, while the second discriminant function explains only 16.574%. The shape differentiation (Mahalanobis distance) between Udzungwa north and Uluguru urban was high and non-significant (Mahalanobis = 2.7200, p = 0.0005) as was that between Uluguru rural (Mahalanobis distance = 2.4629, p = 0.0003). The Mahalanobis distance between Uluguru rural and Uluguru urban was low (Mahalanobis distance = 1.2913, p = 0.3434). There was also high but non-significant shape deviation (Procrustes distance) between Udzungwa north and Udzungwa south (Procrustes distance = 0.0341, p = 0.0182) as well as Udzungwa north and Uluguru rural (Procrustes distance = 0.0279, p = 0.0154), but it was low between Uluguru rural and urban (Procrustes distance = 0.0109, p = 0.5324) (Table 3; Figure 5).
Pooling evidence from the genetic analysis, we found 25 haplotypes were explained by three main clades/haplogroups based on their evolutionary relationships and the location where samples were collected. Clade A consisted of individuals from Udzungwa south populations only, clade B consisted of individuals from Uluguru urban and rural, while clade C consisted of individuals from all three populations (Udzungwa north, Uluguru rural and urban) (Figure 6 and Figure 7). We also found most of the differentiation (83.36%) of T. swinderianus was within the three clades, and only 16.64% was found between clades (Table 4). Examining the extent to which populations are similar or different from one another, a higher genetic distance for the Udzungwa south and Uluguru rural populations and low genetic distance between Uluguru rural and urban populations were reported in [43]. The haplotype and nucleotide diversity indices were also reported in [43]. The Mantel test revealed a positive correlation between geographic and genetic distance (r = 0.51, p < 0.0001) as well as between Procrustes and genetic distance (r = 0.7, p < 0.0001).

3.2. Variations in Skull Size

Procrustes ANOVA of the ventral view revealed no significant variations in the size of cane rat skulls between locations (F = 0.35, p = 0.7917) but significant between age classes (adult and sub-adult) (F = 24.16, p < 0.0001). Similarly, the left lateral view also depicted no significant differences in the skulls between locations (F = 1.05, p = 0.3087) and age (F = 0.12, p = 0.9503). For the dorsal view, non-significant variations in the size of skulls were observed between locations (F = 2.21, p = 0.0935), but a significant variation between age classes (adult and sub-adult) (F = 17.10, p < 0.0001) was evident (Supp1emantary Tables S4–S6).

3.3. Variations in Skull Shape

There were no significant skull shape differences in the ventral view between study sites (Pillai trace = 0.83, F = 1.47, p = 0.0091) and age classes (Pillai trace = 0.49, F = 1.48, p = 0.0708). However, the left lateral view showed no significant variations in the shape of the skulls between study sites (Pillai trace = 0.59, F = 1.58, p = 0.0109) and age classes (Pillai trace = 0.21, F = 0.63, p = 0.8417). On the other hand, the dorsal view revealed non-significant differences in the skull shapes between study sites (Pillai trace, 0.88, F = 1.79, p = 0.0002), while significant differences in skull shape between age classes were observed (Pillai trace = 0.36, F = 5.24, p < 0.0001) (Supplementary Material Tables S7–S9).

4. Discussion

The aim of this study was to link geometric and genetic evidence to the diversity of cane rat populations in the Eastern Arc Mountain blocks. The molecular analysis was able to differentiate four populations (Udzungwa north, Udzungwa south, Uluguru rural and Uluguru urban) collected from different localities. However, not all the morphometric measurements could substantiate the observed genetic distinction of four populations. Comparison using a phylogram derived from Procrustes and Mahalanobis distances also revealed four distinct populations. In contrast, the Procrustes ANOVA and Kruskal–Wallis test failed to differentiate between the four populations based on morphometric measurements.
The observed variations leading to four distinct populations could be due to the effect of isolation by distance; similar results were revealed by FST analysis. This was further supported by a positive correlation between Procrustes and genetic distances and between geographic and genetic distances using the Mantel test.
The Procrustes ANOVA results illustrated the importance of the dorsal view in both size and shape to demonstrate age differences within and between populations. The ventral view also showed size differences for individuals of different age classes within populations. This is consistent with the AMOVA results, which indicated high genetic variation within rather than between populations. In our study, we did not investigate sex-linked variations in skull morphometrics, but [1] in West Africa reported dimorphisms associated with the sex of individuals in T. swinderianus. Some studies have pointed out that genetics and food processing influence cranial size and shape [47]. Furthermore, variations in skull size and shape have also been attributed to local adaptations and morphological differentiations without genetic structuring [1]. Food availability also correlated to the multimammate rats’ cranial characteristics [1]. In our study areas in the EAM, human activities including vegetation clearing for settlements, agricultural activities, and burning of bushes have resulted in habitat fragmentation [48], which may consequently have led to limited dispersal events between populations. T. swinderianus populations locked in different mountain blocks, therefore, experience geographic isolation and barriers to gene flow and could result in morphological differentiation as observed in the cranial morphometry in our study. Studies elsewhere indicated that a loss of functional connectivity between landscapes reduces gene flow between populations and may lead to genetic variations [49,50,51].
Our study shows that the skull shapes and size were different between age classes and locations. Although not all variables were significantly different, it is obvious that the longer the separation by distance, the more likely these populations differed in skull shape because animals may respond to ecological variations by genetic and morphological adaptations [52]. The Procrustes distance, Mahalanobis distance and FST were high in populations separated by long distance (Udzungwa south and Uluguru urban) and were low in neighboring populations (Uluguru rural and Uluguru urban). These findings are consistent with the isolation-by-distance model, which predicts that gene flow will decrease with an increase in geographic distance, thus promoting a genetic divergence between “subgroups” [46]. Gene flow between populations is an important biological process, which shapes and maintains biodiversity [53]. Inter-population variations in skull morphology correlated with geographic distance, which is consistent with previous studies on echimyids [17] and murid rodents [54].
In our study, we were also able to evaluate the geographical distances by the Mantel test and to compare the genetic divergence (genetic distances) of the cane rat populations found in the Uluguru and Udzungwa mountain blocks. We found a positive correlation which indicated a spatial genetic divergence between these populations. Calculations of the genetic distances between these populations indicated a positive correlation between Procrustes and genetic distance. Our study also revealed the FST and Procrustes distances increased with geographical isolation between populations, supporting our hypothesis of genetic variability in cane rat populations due to isolation by distance. It is obvious that the Uluguru urban and Uluguru rural populations were genetically more similar, as these populations were much closer to each other than the Udzungwa south and north populations. These findings are consistent with studies on other vertebrates. For example, it was reported that in Lake Tanganyika, Tanzania, the genetic distances between populations were strongly associated with geographic distances [55]. Geographic distances limit dispersal, and therefore, the rate of migration becomes higher between nearby populations than between distant populations [56]. This pattern is consistent with our data for the dorsal and lateral views of the T. swinderianus skulls in which those from nearby localities (Uluguru urban and Uluguru rural) had small morphological distances, suggesting the existence of dispersal and gene exchange in these populations [43].
The observed cranial morphological variations in cane rats are probably widely found in rodents occupying different landscapes. For example, Lalis et al. [19] reported a population-level differentiation in M. natalensis with significant variation in skull shape attributed to different ecological conditions (e.g., rainfall, habitat heterogeneity, and seasonal variations) occupied by these populations. In this study, it is evident that there are morphological and genetic variations between populations occurring in different mountain blocks of the Eastern Arc. These variations suggest that gene flow between these populations is limited, and they have adapted to the prevailing conditions within each mountain block. These, coupled with environmental conditions such as vegetation type, could increase the fitness of the species in the local environment, enabling a continued evolutionary divergence process. Therefore, the phenotypic and genetic traits demonstrated in our study could be a common phenomenon in T. swinderianus across African landscapes where the species is found.
Some unknown environmental effects can also account for the observed variations. In other similar studies, for example, it has been shown that skull morphological differentiation in murids, Dipodillus [57], Mastomys [19], Taterillus [58], Ctenomys minutus [53] and the Japanese shrew-mole, Urotrichus talpoides [59], were attributed, among other factors, to environmental heterogeneity including vegetation type, rainfall, habitat variability, and altitude. Other variables known to limit gene flow and potentially influencing cane rat populations in the EAM, such as habitat heterogeneity, rainfall, anthropogenic activities and isolation, are worth further investigation.

Supplementary Materials

The following supporting information can be downloaded at: https://www.mdpi.com/article/10.3390/d15050626/s1, Table S1. Ventral view landmarks; Table S2. Left lateral landmarks; Table S3. Dorsal view landmarks; Table S4. Centroid size variation of the ventral view; Table S5. Centroid size variation of the left lateral view; Table S6. Centroid size variation of the dorsal view; Table S7. Shape variation based of the ventral view; Table S8. Shape variation based of the left lateral view; Table S9. Shape variation of the dorsal view.

Author Contributions

S.I.K. and A.A.R. designed the study, collected field data, and performed morphometric data analysis and part of molecular data analysis. C.M.L. performed analysis of the genetic aspects of the data. S.I.K. and R.H.M. prepared the first draft of the manuscript. All authors have read and agreed to the published version of the manuscript.

Funding

This study was funded by the Eastern and Southern Africa Higher Education Centers of Excellence Project—ACEII (Africa Centre of Excellence for Innovative Rodent Pest Management and Biosensor Technology Development—Sokoine University of Agriculture)—Credit no. 5799-TZ.

Institutional Review Board Statement

All applicable institutional guidelines for the care and use of animals were followed. The study was conducted after issuance of an ethical clearance from Directorate of Postgraduate Studies, Research, Technology Transfer and Consultancy of Sokoine University of Agriculture, Tanzania on 10 May 2019 with an Institutional Review Ref. No. SUA/ DPRTC/186/17.

Data Availability Statement

The sequences generated and analyzed in this study have been deposited in NCBI GenBank with accession number OM475549-OM475594. The skulls used for this study are at the department and may be made available on special request to the corresponding author.

Acknowledgments

The Tanzania Wildlife Research Institute (TAWIRI) and Tanzania Commission for Science and Technology (COSTECH) provided a research permit number 2020-247-NA-2020-158 to conduct this study. We thank various field assistants for helping with data collection in the field.

Conflicts of Interest

The authors declare no conflict of interest.

References

  1. Olude, M.A.; Mustapha, O.A.; Sonubi, A.C.; Falade, T.E.; Ogunbunmi, T.K.; Adebayo, A.O.; Akinloye, A.K. Morphometric study of the skull of the greater cane rat (Thryonomys swinderianus, Temmnick). Niger. Vet. J. 2014, 35, 1026–1037. [Google Scholar]
  2. Padial, J.M.; Miralles, A.; De La Riva, I.; Vences, M. The integrative future of taxonomy. Front. Zool. 2010, 7, 16. [Google Scholar] [CrossRef] [PubMed]
  3. Gurgis, G.P.; Daza, J.D.; Brennan, I.G.; Hutchinson, M.; Bauer, A.M.; Stocker, M.R.; Olori, J.C. Ecomor-phometric analysis of diversity in cranial shape of pygopodid geckos. Integr. Org. Biol. 2021, 3, obab013. [Google Scholar] [CrossRef] [PubMed]
  4. Bennett, C.V.; Goswami, A. Morphometric Analysis of Cranial Shape in Fossil and Recent Euprimates. Anat. Res. Int. 2012, 2012, 478903. [Google Scholar] [CrossRef] [PubMed]
  5. Evin, A.; Baylac, M.; Ruedi, M.; Mucedda, M.; Pons, J.-M. Taxonomy, skull diversity and evolution in a species complex of Myotis (Chiroptera: Vespertilionidae): A geometric morphometric appraisal. Biol. J. Linn. Soc. 2008, 95, 529–538. [Google Scholar] [CrossRef]
  6. Voss, R.S.; Marcus, L.F. Morphological evolution in muroid rodents II. Craniometric factor divergence in seven Neotropical genera, with experimental results from Zygodontomys. Evolution 1992, 46, 1918–1934. [Google Scholar] [CrossRef]
  7. Thomassen, H.A.; Buermann, W.; Milá, B.; Graham, C.H.; Cameron, S.E.; Schneider, C.J.; Pollinger, J.P.; Saatchi, S.; Wayne, R.K.; Smith, T.B. Modeling environmentally associated morphological and genetic variation in a rainforest bird, and its application to conservation prioritization. Evol. Appl. 2009, 3, 1–16. [Google Scholar] [CrossRef]
  8. Ordóñez-Garza, N.; Matson, J.O.; Strauss, R.E.; Bradley, R.D.; Salazar-Bravo, J. Patterns of phenotypic and genetic variation in three species of endemic Mesoamerican Peromyscus (Rodentia: Cricetidae). J. Mammal. 2010, 91, 848–859. [Google Scholar] [CrossRef]
  9. Bittner, N.K.J.; Mack, K.L.; Nachman, M.W. Gene expression plasticity and desert adaptation in house mice *. Evolution 2021, 75, 1477–1491. [Google Scholar] [CrossRef]
  10. Rohlf, F.J.; Marcus, L.F. A revolution morphometrics. Trends Ecol. Evol. 1993, 8, 129–132. [Google Scholar] [CrossRef]
  11. Czarnomska, S.D.; Jędrzejewska, B.; Borowik, T.; Niedziałkowska, M.; Stronen, A.V.; Nowak, S.; Mysłajek, R.W.; Okarma, H.; Konopiński, M.; Pilot, M.; et al. Concordant mitochondrial and microsatellite DNA structuring between Polish lowland and Carpathian Mountain wolves. Conserv. Genet. 2013, 14, 573–588. [Google Scholar] [CrossRef]
  12. Kawakami, M.; Yamamura, K.-I. Cranial bone morphometric study among mouse strains. BMC Evol. Biol. 2008, 8, 73. [Google Scholar] [CrossRef] [PubMed]
  13. Kilwanila, S.I.; Msalya, G.M.; Lyimo, C.M.; Rija, A.A. Geographic biases in cane rat (Thryonomyds) research may impede broader wildlife utilization and conservation in Africa: A systematic review. Sci. Afr. 2021, 12, e00785. [Google Scholar] [CrossRef]
  14. Morgan, K.; Mboumba, J.F.; Ntie, S.; Mickala, P.; Miller, C.A.; Zhen, Y.; Harrigan, R.J.; Le Underwood, V.; Ruegg, K.; Fokam, E.B.; et al. Precipitation and vegetation shape patterns of genomic and craniometric variation in the central African rodent Praomys misonnei. Proc. R. Soc. B 2020, 287, 20200449. [Google Scholar] [CrossRef] [PubMed]
  15. Nichols, V.; Akpatou, B.; Wendelen, W.I.M.; Kerbis Peterhans, J.U.L.I.A.N.; Olayemi, A.; Decher, J.A.N.; Colyn, M. Molecular and morphometric variation in two sibling species of the genus Praomys (Rodentia: Muridae): Implications for biogeography. Zool. J. Linn. Soc. 2010, 160, 397–419. [Google Scholar] [CrossRef]
  16. Blackford, C.; Germain, R.M.; Gilbert, B. Species Differences in Phenology Shape Coexistence. Am. Nat. 2020, 195, E168–E180. [Google Scholar] [CrossRef]
  17. Monteiro-Filho, E.L.; Monteiro, L.R.; dos Reis, S.F. Skull Shape and Size Divergence in Dolphins of the Genus Sotalia: A Tridimensional Morphometric Analysis. J. Mammal. 2002, 83, 125–134. [Google Scholar] [CrossRef]
  18. Roberts, R.B.; Hu, Y.; Albertson, R.C.; Kocher, T.D. Craniofacial divergence and ongoing adaptation via the hedgehog pathway. Proc. Natl. Acad. Sci. USA 2011, 108, 13194–13199. [Google Scholar] [CrossRef]
  19. Lalis, A.; Baylac, M.; Cosson, J.F.; Makundi, R.H.; Machangu, R.S.; Denys, C. Cranial morphometric and fine scale genetic variability of two adjacent Mastomys natalensis (Rodentia: Muridae) populations. Acta Theriol. 2009, 54, 171–181. [Google Scholar] [CrossRef]
  20. Auffray, C.; Imbeaud, S.; Roux-Rouquié, M.; Hood, L. From functional genomics to systems biology: Concepts and practices Molecular biology and genetics. Comptes Rendus Biol. 2003, 326, 879–892. [Google Scholar] [CrossRef]
  21. Eckert, C.G.; Samis, K.E.; Lougheed, S.C. Genetic variation across species’ geographical ranges: The central–marginal hypothesis and beyond. Mol. Ecol. 2008, 17, 1170–1188. [Google Scholar] [CrossRef] [PubMed]
  22. Voss, R.S.; Hubbard, C.; Jansa, S.A. Phylogenetic relationships of New World porcupines (Rodentia, Erethizontidae): Implications for taxonomy, morphological evolution, and biogeography. Am. Mus. Novit. 2013, 3769, 1–36. [Google Scholar] [CrossRef]
  23. Martínez-Abadías, N.; Esparza, M.; Sjøvold, T.; González-José, R.; Santos, M.; Hernández, M. Heritability of human cranial dimensions: Comparing the evolvability of different cranial regions. J. Anat. 2014, 214, 19–35. [Google Scholar] [CrossRef] [PubMed]
  24. Kawakami, K.; Ege, K.; Yamada, T. Method of producing flat skin and skeleton specimens of laboratory mice for exhibition at a university museum. Shimane J. Med. Sci. 2015, 32, 37–43. [Google Scholar]
  25. Mustapha, O.A.; Aderounmu, O.A.; Olude, M.A.; Okandeji, M.E.; Akinloye, A.K.; Oke, B.O.; Olopade, J.O. Anatomical studies on the spinal cord of the greater cane rat (Thryonomys swinderianus, Temminck) I: Gross morphometry. Niger. Vet. J. 2015, 36, 1192–1202. [Google Scholar]
  26. Mustapha, O.; Ezekiel, O.; Olaolorun, F.; Awala-Ajakaiye, M.; Popoola, E.; Olude, M.; Olopade, J. Morpho-logical Characterization of the Developing Greater Cane Rat (Thryonomys swinderianus) Brain. Dev. Neurosci. 2020, 42, 114–123. [Google Scholar] [CrossRef]
  27. Olude, M.A.; Mustapha, O.A.; Olopade, J.O. Morphological characterization of the African Giant Rat (Cricetomys gambianus, Waterhouse) brain across age groups: Gross features of cortices. Niger. J. Physiol. Sci. 2016, 31, 133–138. [Google Scholar]
  28. Igado, O.O.; Adebayo, A.O.; Oriji, C.C.; Oke, B.O. Cranio-facial and ocular morphometrics of the male greater cane rat (Thryonomys swinderianus). Niger. Vet. J. 2016, 37, 54–63. [Google Scholar]
  29. Biseko, B.B.; Rija, A.A. Correlates of flight response in some common birds of a rapidly expanding African city. J. East Afr. Ornithol. 2022, 42, 10–22. [Google Scholar]
  30. Rija, A.A.; Critchlow, R.; Thomas, C.D.; Beale, C.M. Global extent and drivers of mammal population declines in protected areas under illegal hunting pressure. PLoS ONE 2020, 15, e0227163. [Google Scholar] [CrossRef]
  31. Adenyo, C.; Hayano, A.; Kayang, B.B.; Owusu, E.H.; Inoue-Murayama, M. Mitochondrial D-loop diversity of grasscutter (Thryonomys swinderianus Rodentia: Hystricomorpha) in Ghana. Open J. Anim. Sci. 2013, 3, 145–153. [Google Scholar] [CrossRef]
  32. Carleton, M.D.; Musser, G.G. Systematic studies of oryzomyine rodents (Muridae, Sigmodontinae): A Synopsis of Microryzomys. Bulletin of the AMNH; no. 191. 1989. Available online: http://hdl.handle.net/2246/953 (accessed on 15 October 2022).
  33. Olivera-Angel, M.; Betancur, J. Body shape variation between farms of tilapia (Oreochromis sp.) in Colombian Andes using landmark-based geometric morphometrics Geometric morphometrics tilapia. Lat. Am. J. Aquat. Res. 2019, 47, 194–200. [Google Scholar]
  34. Rohlf, F.J. The tps series of software. Hystrix 2015, 26, 9–12. [Google Scholar] [CrossRef]
  35. Bookstein, F.L.; Grayson, B.; Cutting, C.B.; Kim, H.-C.; McCarthy, J.G. Landmarks in three dimensions: Reconstruction from cephalograms versus direct observation. Am. J. Orthod. Dentofac. Orthop. 1991, 100, 133–140. [Google Scholar] [CrossRef] [PubMed]
  36. Klingenberg, C.P. MorphoJ: An integrated software package for geometric morphometrics. Mol. Ecol. Resour. 2011, 11, 353–357. [Google Scholar] [CrossRef]
  37. Adams, D.C.; Rohlf, F.J.; Slice, D.E. Geometric morphometrics: Ten years of progress following the ‘revo-lution’. Ital. J. Zool. 2004, 71, 5–16. [Google Scholar] [CrossRef]
  38. Huson, D.H.; Bryant, D. Application of Phylogenetic Networks in Evolutionary Studies. Mol. Biol. Evol. 2005, 23, 254–267. [Google Scholar] [CrossRef]
  39. Adams, D.C.; Collyer, M.L. On the comparison of the strength of morphological integration across morphometric datasets. Evolution 2016, 70, 2623–2631. [Google Scholar] [CrossRef]
  40. Adams, D.C.; Otárola-Castillo, E. Geomorph: An R package for the collection and analysis of geometric morphometric shape data. Methods Ecol. Evol. 2013, 4, 393–399. [Google Scholar] [CrossRef]
  41. Oksanen, J.; Kindt, R.; Legendre, P.; O’Hara, B.; Stevens, M.H.H.; Oksanen, M.J.; Suggests, M.A.S.S. The vegan package. Community Ecol. Package 2007, 10, 719. [Google Scholar]
  42. Kumar, S.; Stecher, G.; Li, M.; Knyaz, C.; Tamura, K. MEGA X: Molecular Evolutionary Genetics Analysis across Computing Platforms. Mol. Biol. Evol. 2018, 35, 1547–1549. [Google Scholar] [CrossRef] [PubMed]
  43. Kilwanila, S.I.; Lyimo, C.M.; Rija, A.A. Mitochondrial genetic diversity of the Greater Cane rat (Thryonomys swinderianus) populations from the Eastern Arc Mountains ecosystem, Tanzania. Mol. Biol. Rep. 2022, 49, 10431–10442. [Google Scholar] [CrossRef] [PubMed]
  44. Hall, T. BioEdit version 7.0. 0. Distributed by the Author. 2004. Available online: www.mbio.ncsu.edu/BioEdit/bioedit.html (accessed on 12 October 2022).
  45. Excoffier, L.; Lischer, H.E.L. Arlequin suite ver 3.5: A new series of programs to perform population genetics analyses under Linux and Windows. Mol. Ecol. Resour. 2010, 10, 564–567. [Google Scholar] [CrossRef] [PubMed]
  46. Wright, S. Isolation by distance. Genetics 1943, 28, 114. [Google Scholar] [CrossRef] [PubMed]
  47. Lieberman, D.E.; Krovitz, G.E.; Yates, F.W.; Devlin, M.; Claire, M.S. Effects of food processing on masticatory strain and craniofacial growth in a retrognathic face. J. Hum. Evol. 2004, 46, 655–677. [Google Scholar] [CrossRef]
  48. Kilawe, C.J.; Kaaya, O.E.; Kolonel, C.P.; Macrice, S.A.; Mshama, C.P.; Lyimo, P.J.; Emily, C.J. Wildfires in the Eastern Arc Mountains of Tanzania: Burned areas, underlying causes and management challenges. Afr. J. Ecol. 2020, 59, 204–215. [Google Scholar] [CrossRef]
  49. Stevens, K.; Harrisson, K.A.; Hogan, F.E.; Cooke, R.; Clarke, R.H. Reduced gene flow in a vulnerable species reflects two centuries of habitat loss and fragmentation. Ecosphere 2018, 9, e02114. [Google Scholar] [CrossRef]
  50. Hanski, I. Metapopulation dynamics. Nature 1998, 396, 41–49. [Google Scholar] [CrossRef]
  51. Frankham, R.; Bradshaw, C.J.; Brook, B.W. Genetics in conservation management: Revised recommendations for the 50/500 rules, Red List criteria and population viability analyses. Biol. Conserv. 2014, 170, 56–63. [Google Scholar] [CrossRef]
  52. Freudiger, A.; Josi, D.; Thünken, T.; Herder, F.; Flury, J.M.; Marques, D.A.; Taborsky, M.; Frommen, J.G. Ecological variation drives morphological differentiation in a highly social vertebrate. Funct. Ecol. 2021, 35, 2266–2281. [Google Scholar] [CrossRef]
  53. Fornel, R.; Cordeiro-Estrela, P.; Freitas, T.R.O. Skull shape and size variation in Ctenomys minutus (Rodentia: Ctenomyidae) in geographical, chromosomal polymorphism, and environmental contexts. Biol. J. Linn. Soc. 2010, 101, 705–720. [Google Scholar] [CrossRef]
  54. Fadda, C.; Corti, M. Three dimensional geometric morphometric study of the Ethiopian Myomys-Stenocephalemys complex (Murinae, Rodentia). Hystrix Ital. J. Mammal. 2000, 11, 131–143. [Google Scholar]
  55. Kerschbaumer, M.; Mitteroecker, P.; Sturmbauer, C. Evolution of body shape in sympatric versus non-sympatric Tropheus populations of Lake Tanganyika. Heredity 2013, 112, 89–98. [Google Scholar] [CrossRef]
  56. Bradburd, G.S.; Ralph, P.L.; Coop, G.M. Disentangling the effects of geographic and ecological isolation on genetic differentiation. Evolution 2013, 67, 3258–3273. [Google Scholar] [CrossRef]
  57. Abiadh, A.; Colangelo, P.; Capanna, E.; Lamine-Cheniti, T.; Chetoui, M. Morphometric analysis of six Gerbillus species (Rodentia, Gerbillinae) from Tunisia. Comptes Rendus Biol. 2010, 333, 680–687. [Google Scholar] [CrossRef]
  58. Dobigny, G.; Baylac, M.; Denys, C. Geometric morphometrics, neural networks and diagnosis of sibling Taterillus species (Rodentia, Gerbillinae). Biol. J. Linn. Soc. 2002, 77, 319–327. [Google Scholar] [CrossRef]
  59. Wilson, V.J. Mammalian Vestibular Physiology; Springer Science & Business Media: Berlin/Heidelberg, Germany, 2013. [Google Scholar]
Figure 1. Map of study site, showing the Eastern Arc Mountains and locations (colored bullets) where data collection took place in the Udzungwa and Uluguru Mountains. The lower inset map is Tanzania with the Eastern Arc Mountains.
Diversity 15 00626 g001
Figure 2. Landmarks locations with the name of each location mentioned (each landmark is represented by a number in the photo) in the Supplementary Material, Table S1, and scatter plots of the ventral view of the T. swinderianus from four populations. The points on the graph represent individuals in the morphospace.
Diversity 15 00626 g002
Figure 3. Landmarks locations with the name of each location mentioned (each landmark is represented by a number in the photo) in the Supplementary Material, Table S2, and scatter plots of the lateral view of the T. swinderianus from four populations. The points on the graph represent individuals in the morphospace.
Diversity 15 00626 g003
Figure 4. Landmarks locations with the name of each location mentioned (each landmark is represented by a number in the photo) in the Supplementary Material, Table S3, and scatter plots of the dorsal view of the T. swinderianus from four populations. The points on the graph represent individuals in the morphospace.
Diversity 15 00626 g004
Figure 5. Phylogram showing the relationship between T. swinderianus populations using Procrustes and Mahalanobis distances.
Diversity 15 00626 g005
Figure 6. Median-joining network of 25 haplotypes of greater cane rats inhabiting Udzungwa and Uluguru urban and rural areas.
Diversity 15 00626 g006
Figure 7. Neighbor-joining phylogenetic tree of mitochondrial D-loop nucleotide sequences based on 25 haplotypes of greater cane rats.
Diversity 15 00626 g007
Table 1. Mahalanobis and Procrustes distances of the four populations generated from the Canonical Variate Analysis of the ventral view. The numbers outside the brackets are the distances and the numbers inside the brackets are the p-values generated from permutations.
Mahalanobis Distance
PopulationUdzungwa NorthUdzungwa SouthUluguru Urban
Udzungwa south2.2472 (0.7864)
Uluguru urban2.1609 (0.0548)2.7865 (0.1180)
Uruguru rural1.8783 (0.0582)2.2598 (0.3564)1.5776 (0.0111)
Procrustes Distance
PopulationUdzungwa NorthUdzungwa SouthUluguru Urban
Udzungwa south0.0202 (0.7139)
Uluguru urban0.0572 (0.3530)0.0575 (0.4616)
Uruguru rural0.0244 (0.2347)0.0218 (0.5781)0.0462 (0.0895)
Table 2. Mahalanobis and Procrustes distances of the four populations generated from the Canonical Variate Analysis of the left lateral view. The numbers outside the brackets are the distances, and the numbers inside the brackets are the p-values generated from permutations.
Mahalanobis Distance
PopulationsUdzungwa NorthUdzungwa SouthUluguru Rural
Udzungwa south2.5012 (0.2837)
Uluguru rural1.6627 (0.01092.5284 (0.0418)
Uluguru urban1.7111 (0.0142)2.5772 (0.0473)0.9281(0.2344)
Procrustes Distance
PopulationsUdzungwa NorthUdzungwa SouthUluguru Rural
Udzungwa south0.0501 (0.3014)
Uluguru rural0.0285(0.2059)0.0628 (0.0394)
Uluguru urban0.0292 (0.1532)0.0630 (0.0124)0.0117 (0.7840)
Table 3. Mahalanobis and Procrustes distances of the four populations generated from the Canonical Variate Analysis of the dorsal view. The numbers outside the brackets are the distances, and the numbers inside the brackets are the p-values generated from permutations.
Mahalanobis Distance
PopulationUdzungwa NorthUdzungwa SouthUluguru Rural
Udzungwa South2.2643 (0.1584)
Uluguru rural2.4629 (0.0003)1.7541(0.0725)
Uluguru urban2.7200 (0.0005)2.2279 (0.0040)1.2913 (0.3434)
Procrustes Distance
PopulationUdzungwa NorthUdzungwa SouthUluguru Rural
Udzungwa South0.0341 (0.0182)
Uluguru rural0.0279 (0.0154)0.0150 (0.3154)
Uluguru urban0.0239 (0.0828)0.0196 (0.0927)0.0109 (0.5324)
Table 4. Molecular Variance (AMOVA) of greater cane rats from the four study sites showing significant differences between samples sourced from different localities.
Source of VariationdfSum of SquaresVariance ComponentsPercentage of VariationsFSTp-Value
Between Populations371.4522.14201 40.300.402970.00001
Within Population42133.2873.17349 59.70
Total45204.7394.86248
Disclaimer/Publisher’s Note: The statements, opinions and data contained in all publications are solely those of the individual author(s) and contributor(s) and not of MDPI and/or the editor(s). MDPI and/or the editor(s) disclaim responsibility for any injury to people or property resulting from any ideas, methods, instructions or products referred to in the content.

