Communication

Genetic Diversity and Population Structure of the Slender Racer (Orientocoluber spinalis) in South Korea

1
Division of Science Education, Kangwon National University, Chuncheon 24341, Republic of Korea
2
Department of Biology, Incheon National University, Incheon 22012, Republic of Korea
*
Author to whom correspondence should be addressed.
Diversity 2023, 15(4), 543; https://doi.org/10.3390/d15040543
Submission received: 10 February 2023 / Revised: 23 March 2023 / Accepted: 8 April 2023 / Published: 9 April 2023
(This article belongs to the Special Issue Ecology, Systematics and Biodiversity of Reptiles)

Abstract

:
The slender racer, Orientocoluber spinalis, is a monotypic species found in northeast Asia. We collected 67 O. spinalis samples from the Republic of Korea (hereafter, South Korea) and 7 from China and Mongolia and investigated their genetic diversity and population structure. In South Korea, O. spinalis populations were mainly found on Oeyeondo, Uido, and Udo islands and Woraksan Mountain and showed low genetic diversity in the analysis of concatenated mitochondrial sequences of the cytochrome b (Cytb) and NADH dehydrogenase subunit 4 (ND4) genes. Orientocoluber spinalis populations in South Korea showed low differentiation and likely diverged recently. Orientocoluber spinalis may have colonized the Korean Peninsula from China and Mongolia, but this route is not confirmed due to the lack of samples from the Democratic People’s Republic of Korea and middle eastern China. Considering its extreme rarity, low population density, and low genetic diversity, O. spinalis should be designated an endangered species in South Korea, as it is in Russia, Mongolia, and Kazakhstan.

1. Introduction

Rare species are often habitat-specific, have fragmented populations, and have low population densities [1,2,3,4,5]. Genetic flow between fragmented populations is generally limited, and conversely, the possibility of inbreeding within the population is high, resulting in low genetic diversity [6,7]. In various species, populations with low genetic diversity have been reported to be susceptible to genetic drift [8,9,10,11]. To identify the potential threats to rare species and develop conservation strategies, their ecological characteristics and genetic stability should first be evaluated [12,13,14]. Despite this necessity, studying rare species is often challenging because it is extremely difficult to collect enough specimens for study [15,16]. For this reason, population stability is sometimes overestimated even when only a few individuals are observed in an area [17]. Therefore, there is a great need to analyze the genetic diversity of captured individuals as well as perform population density surveys [13,18]. Among reptiles in the Republic of Korea (hereafter, South Korea), Orientocoluber spinalis and Scincella huanrenensis are considered rare species [19,20].
The slender racer (O. spinalis) is distributed across northeast Asia, including Korea, China, Mongolia, Kazakhstan, and Russia [21,22]. It is a nonvenomous, medium-sized snake with a total body length of 50–90 cm. It has a distinctive long yellowish-white stripe from the head to the tail on the dorsum [21,23]. The snakes are mainly found in lowland grasslands adjoined by low mountains and feed on frogs, lizards, small snakes, and small mammals [23,24]. Orientocoluber spinalis was recently reclassified into the genus Orientocoluber from the genus Hierophis based on morphological characteristics and phylogenetic findings [25,26,27]. Orientocoluber spinalis is a monotypic species and is extremely rarely observed across its distribution range. Therefore, the species is designated an endangered species in Russia [28], Mongolia [29], and Kazakhstan [30] and a threatened species in South Korea [31]. Nevertheless, there have been very few studies on the slender racer. Studies on the genetic diversity and structure of O. spinalis field populations have not been performed in any country due to the difficulty of sampling. Recent studies by the authors include mitochondrial DNA genome sequence analysis [32], food source research [24], and species distribution modeling [22]. In some countries, there are only discovery reports such as in Russia [21,28]. To identify risks and develop conservation plans, population genetic studies are necessary. In particular, this information could be crucial to the next national evaluation of endangered species in South Korea.
In this study, we evaluated the genetic diversity and investigated the genetic structure of the O. spinalis population across South Korea by analyzing the mitochondrial cytochrome b (Cytb) and NADH dehydrogenase subunit 4 (ND4) genes. In addition, we also aimed to determine the phylogenetic relationships between South Korean populations and the populations in China and Mongolia.

2. Materials and Methods

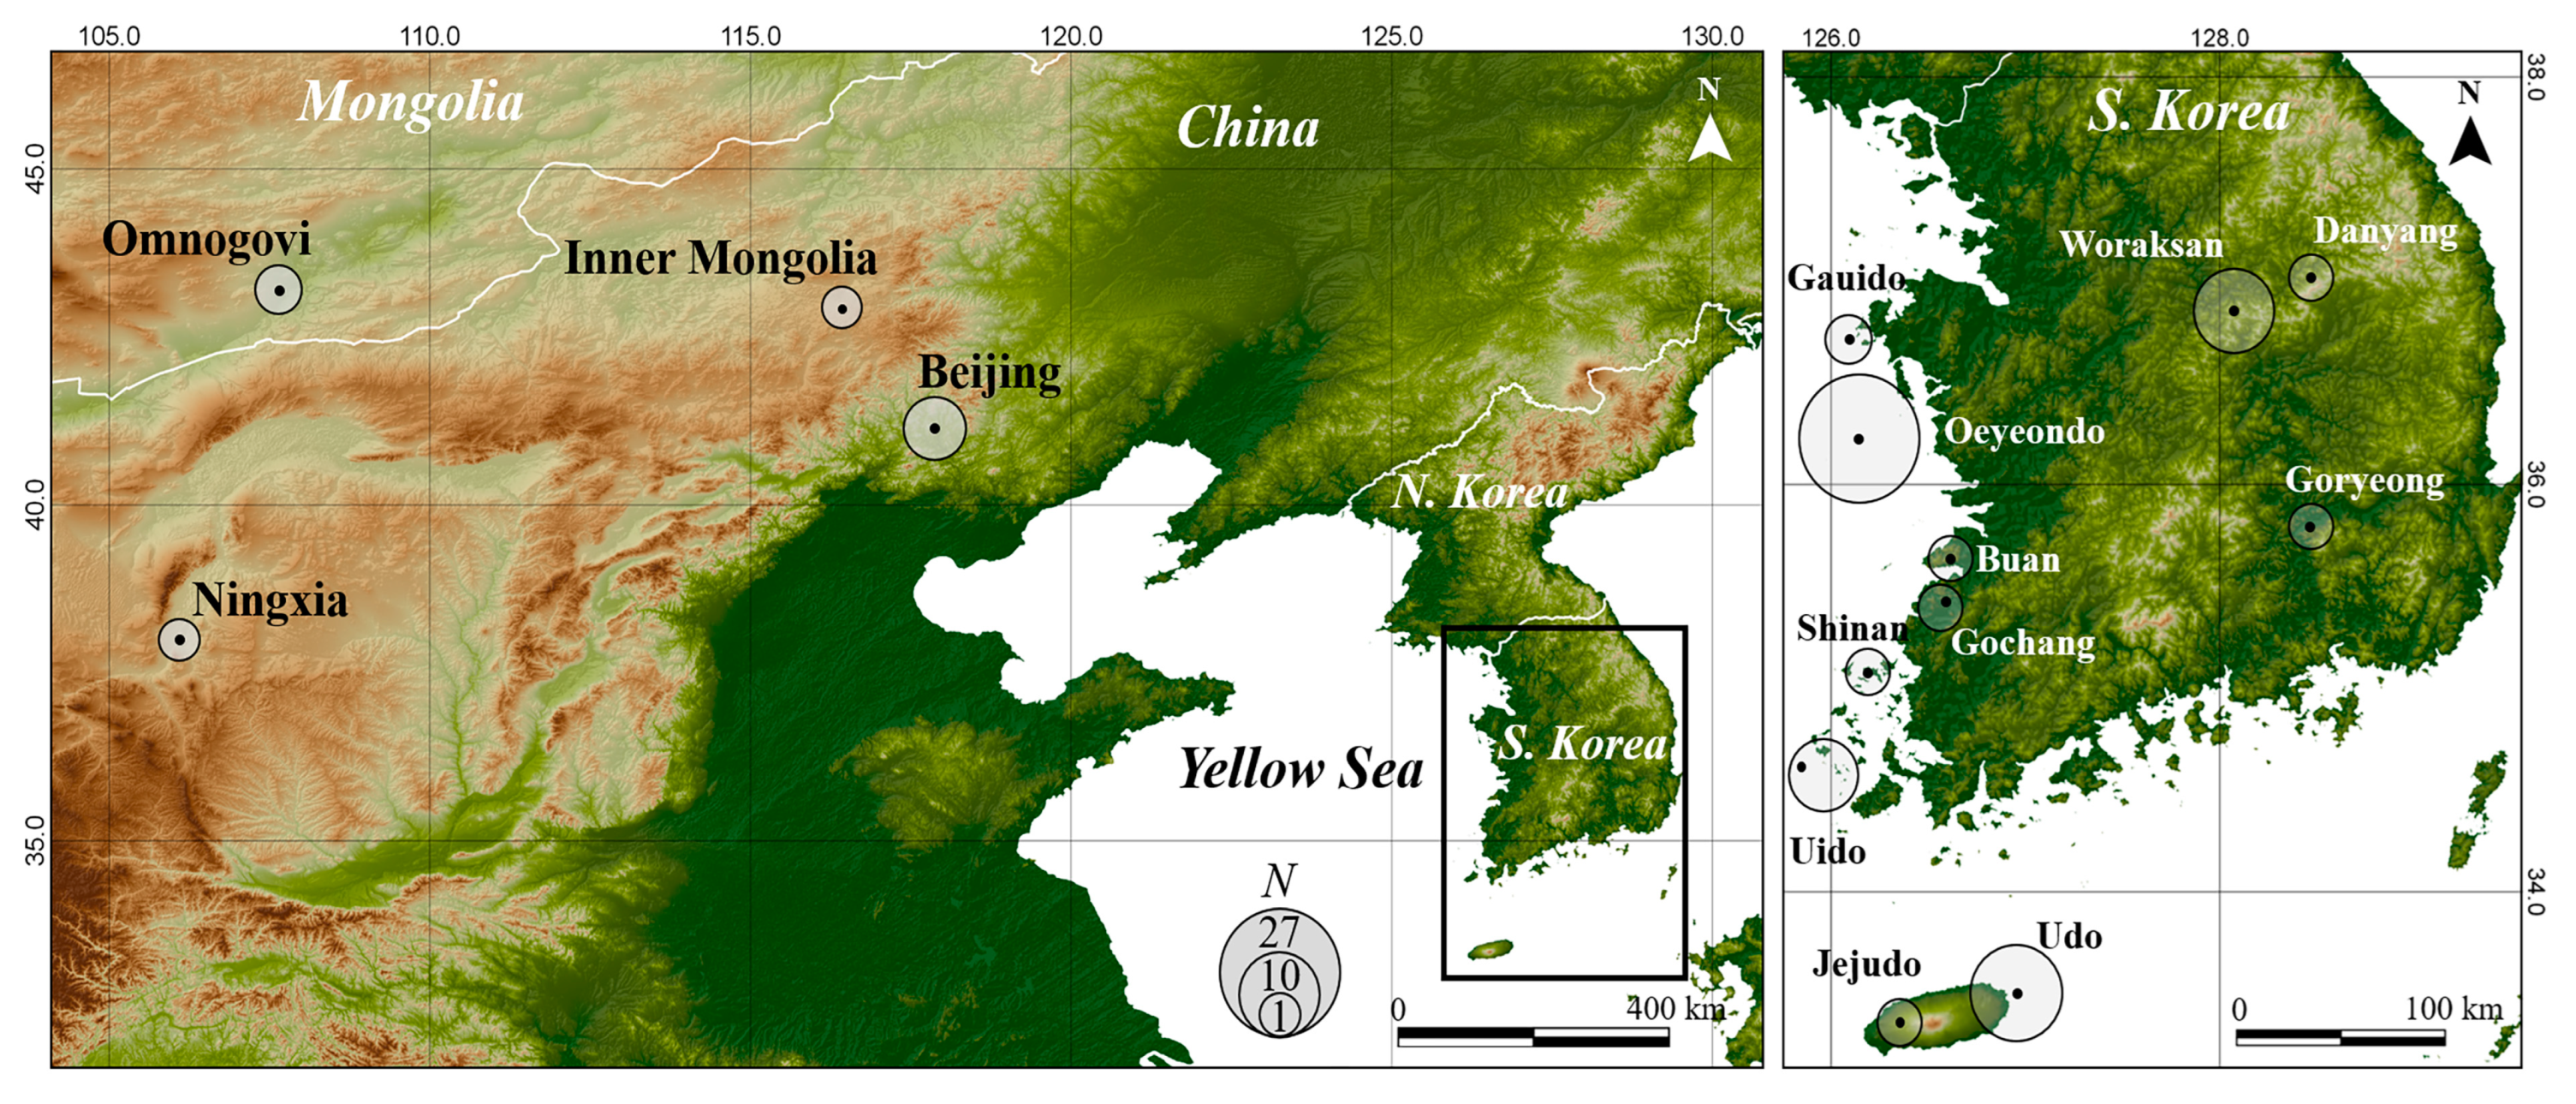
2.1. Sample Collection

Between 2020 and 2022, we sampled a total of 72 O. spinalis, 66 from 11 sites in South Korea and 6 from 3 foreign sites (Table 1, Figure 1). We sampled throughout South Korea, but the main sampling was performed on Oeyeondo Island (hereafter, Oeyeondo, Chungnam, South Korea), Udo Island (Udo, Jeonnam, South Korea), Uido Island (Uido, Jeju, South Korea), and Woraksan Mountain (Woraksan, Chungbuk, South Korea), where the population density was relatively high. A small sample was taken from the tip of the tail, measuring approximately 1 cm long, to obtain genetic material. In the case of foreign countries, tail tissues from six snakes collected from Beijing and Inner Mongolia, China, and Omnogovi, Mongolia, were provided by foreign researchers. All samples were preserved in 99.5% ethanol at −20 °C until DNA extraction. Additionally, the genetic sequences of one O. spinalis from Woraksan (NC 049067) and one from the Hui Autonomous Region of Ningxia (hereafter, Ningxia), China (AY486924 and AY487056), were obtained from GenBank and added to the analysis. Therefore, a total of 74 samples were used in the analyses.

2.2. PCR Amplification and Sequencing

Genomic DNA extraction from tail tissues was performed using the Qiagen DNeasy Blood and Tissue Kit (Qiagen, Hilden, Germany) following the manufacturer’s protocol. We analyzed the mitochondrial Cytb and ND4 genes because these genes are known to represent intraspecies variation among members of the suborder Serpentes [33,34]. Moreover, these genes are frequently used in genetic diversity and phylogenetic studies of the genus Hierophis, which is closely allied to O. spinalis [25,35,36]. For amplification, we produced a primer set for Cytb (forward primer: 5′-CTCAAAGCCACAACACTCACG-3′; reverse primer: 5’-TACTGGCTTTGGGCTAGA-3′) and ND4 (forward primer: 5′-TGCCATTACACGAACACATGG-3′; reverse primer: 5′-AAGAGTTAGCAGGTCTTG TGG-3′) using the Primer design tool as implemented in Geneious v.9.1.8 (Biomatters Ltd., Auckland, New Zealand) based on the reference mitochondrial genome of O. spinalis (GenBank accession number: NC049067). We performed PCR amplification using a SimpliAmp Thermal Cycler (Applied Biosystems, California, United State of America) in a volume of 40 µL, which consisted of 2 µL of template DNA (1 ng/1 µL), 1 µL/each (5 pmol) of forward/reverse primer, 20 µL of 2X TOPsimple™ PreMIX- nTaq (Enzynomics, Incheon, South Korea), and enough molecular biology grade water to reach the total volume (HyClone, Massachusetts, United State of America). The PCR conditions were as follows: heating to 95 °C for 2 min and 30 cycles of 95 °C for 30 s, 60 °C (ND4) or 65 °C (Cytb) for 45 s, and 72 °C for 1 min, followed by a final extension for 5 min. We confirmed the PCR products on a 1% agarose gel and sequenced them at Macrogen (Seoul, South Korea). We visually inspected and aligned all obtained sequences in Geneious v.9.1.8 (Biomatters Ltd., Auckland, New Zealand) using the MUSCLE algorithm [37]. We deposited all sequences of Cytb (1113 bp; OQ290815-24) and ND4 (1279 bp; OQ290825-38) obtained in this study in GenBank (Table 1).

2.3. Population Genetic Analysis

We aligned all 74 sequences using MUSCLE [37] and used 1113 bp for Cytb and 696 bp for ND4 in the analyses. Because Cytb and ND4 had only four and two polymorphic sites, respectively, among Korean specimens, we concatenated the Cytb and ND4 sequences (1809 bp) for the analyses [38] to increase the accuracy and resolution of the results. Using DnaSP v.6 [39], we identified the nucleotide mutations in the concatenated sequences, determined the haplotype, and produced a haplotype table for the comparison among populations. We analyzed the genetic diversity of four major Korean populations (Oeyeondo, Udo, Uido, and Woraksan) and the combined Korean population consisting of all 11 populations in South Korea using DnaSP v.6. The parameters included the number of haplotypes (NH), haplotype diversity (h), nucleotide diversity (π), and number of polymorphic sites (Ps). Due to the difference in sample size among the populations, we employed a rarefaction procedure using Contrib v.1.02 [40] to calculate haplotype richness (HR).
To infer the demographic history of the four major populations in South Korea and of the combined Korean population, neutrality tests based on four different statistical approaches (Tajima’s D, Fu’s Fs, Fu and Li’s D*, and Fu and Li’s F*) [41,42,43] were conducted using DnaSP v.6 [39]. Additionally, to infer changes in population size, mismatch distributions were generated for the combined Korean population. To investigate historical fluctuations in the effective population size of O. spinalis in South Korea [44], we conducted Bayesian skyline plot (BSP) analysis using BEAST2 v. 2.7.1 [45]. A strict clock model suitable for comparative analysis within the same species was applied [46]. In the analysis, 1.34% per million years, which is the mutation rate of Colubroidea, to which O. spinalis ebelongs, was applied as the mtDNA substitution rate [47,48]. The tree prior used a coalescent Bayesian skyline. We conducted model generation 2,000,000 times using Markov chain Monte Carlo (MCMC), sampled every 100th generation, and removed 10% of the initial iterations as burn-in. Proper sampling, where the effective sample size of each parameter was 200 or more [49], was confirmed with TRACER v.1.7.1 [50]. The rest of the variables were finalized in the BSP with default settings. In these analyses, we did not include the data from China and Mongolia because we collected few samples from the sites in these countries, which are very far apart from each other, and they did not share any haplotypes with the populations in South Korea (see results).
Using PopART v.1.7, a median-joining haplotype network was drawn to evaluate genetic relationships among the studied populations in South Korea, China, and Mongolia [51,52]. In addition, the degree of genetic differentiation among the four major populations in South Korea and the combined foreign population consisting of three Chinese and one Mongolian population was evaluated by uncorrected p-distances using MEGA v.11.0.13 [53].
We investigated the phylogenetic relationships among the studied populations by using MrBayes v.3.2.7 [54] to construct a Bayesian inference (BI) phylogenetic tree. We used the Cytb (AY486925 and AY376741) and ND4 (AY487057 and AY487044) sequences of Hierophis viridiflavus and H. gemonensis as outgroups for the BI tree. Finally, a sequence (1813 bp) combining Cytb (1113 bp) and ND4 (696 bp) was used for phylogenetic analysis. We used MODELTEST v. 3.7 [55] to select the nucleotide sequence evolution model for the phylogenetic analysis. We selected the TIMef model among the 59 evaluated models, which had the smallest Bayesian information criterion value [56]. We conducted model generation 2,000,000 times using Markov chain Monte Carlo (MCMC), sampled every 100th generation, and removed 10% of the initial iterations as burn-in. The derived BI tree was schematized using FigTree v.1.4.4 [50].

3. Results

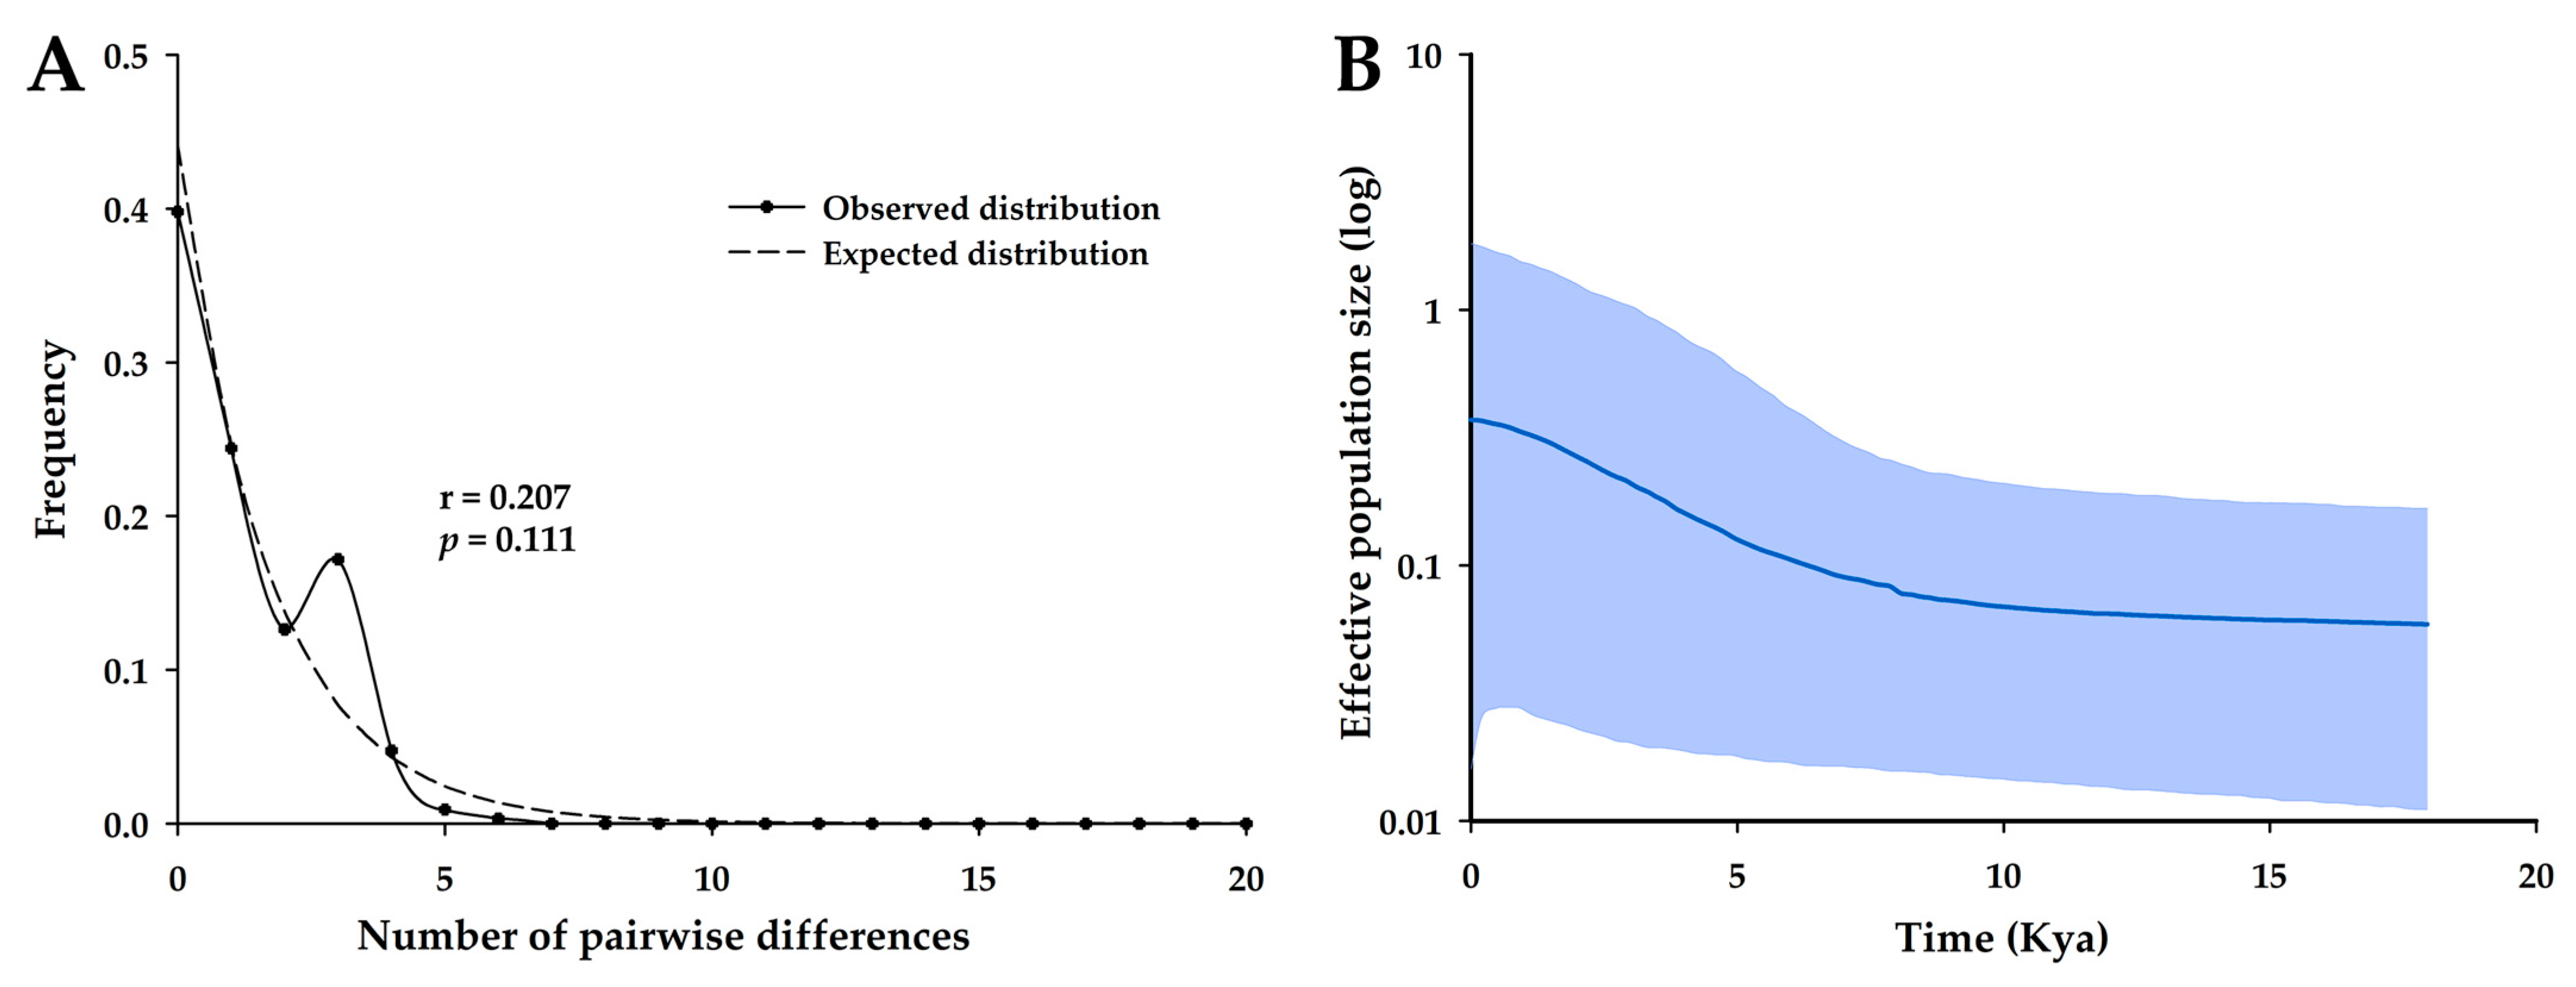
3.1. Genetic Diversity

The 74 O. spinalis had a total of 18 haplotypes (Table 2). In South Korea, each population had 1–3 haplotypes, and a total of 11 haplotypes were identified. None of the Korean populations shared haplotypes with the Chinese or Mongolian populations. Snakes in the Udo, Woraksan, Uido, and Jejudo populations had more than two haplotypes. Haplotype 1, the main haplotype, which was found across many populations, was shared by the Oeyeondo, Udo, and Gauido populations, and haplotype 2 was shared by the Uido, Buan, Shinan, and Danyang populations. Snakes in the Woraksan population had haplotypes 3 and 4. In foreign countries, a total of 7 haplotypes were identified, and each population had 1–3 haplotypes. The Chinese and Mongolian populations did not share haplotypes with each other.
The haplotype diversity of the combined Korean population (Oeyeondo, Udo, Woraksan, and Uido) was 0.602 ± 0.064 (Table 3). The haplotype diversity was the smallest in Oeyeondo (0.000 ± 0.000) and the highest in Woraksan (0.467 ± 0.132). The nucleotide diversity of the combined Korean population was 0.0007 ± 0.0001. The nucleotide diversity was the smallest in Oeyeondo (0.0000 ± 0.0000) and the highest in Woraksan (0.0003 ± 0.0001). Haplotype richness was 0.000 for Oeyeondo, 1.000 for Uido and Udo, and 0.992 for Woraksan.
The four major populations in South Korea did not show significant neutrality test results, but the combined Korean population showed significant results for Fu’s FS, Fu and Li’s D*, and Fu and Li’s F* (Table 3). Although this population did not show a significant raggedness index for the observed mismatch distribution (p = 0.111), the mismatch distributions showed the typical unimodal shape with a small raggedness index (r = 0.207, Figure 2A). According to the BSP, the effective population sizes of O. spinalis in South Korea have increased since approximately 10,000 years ago (Figure 2B).

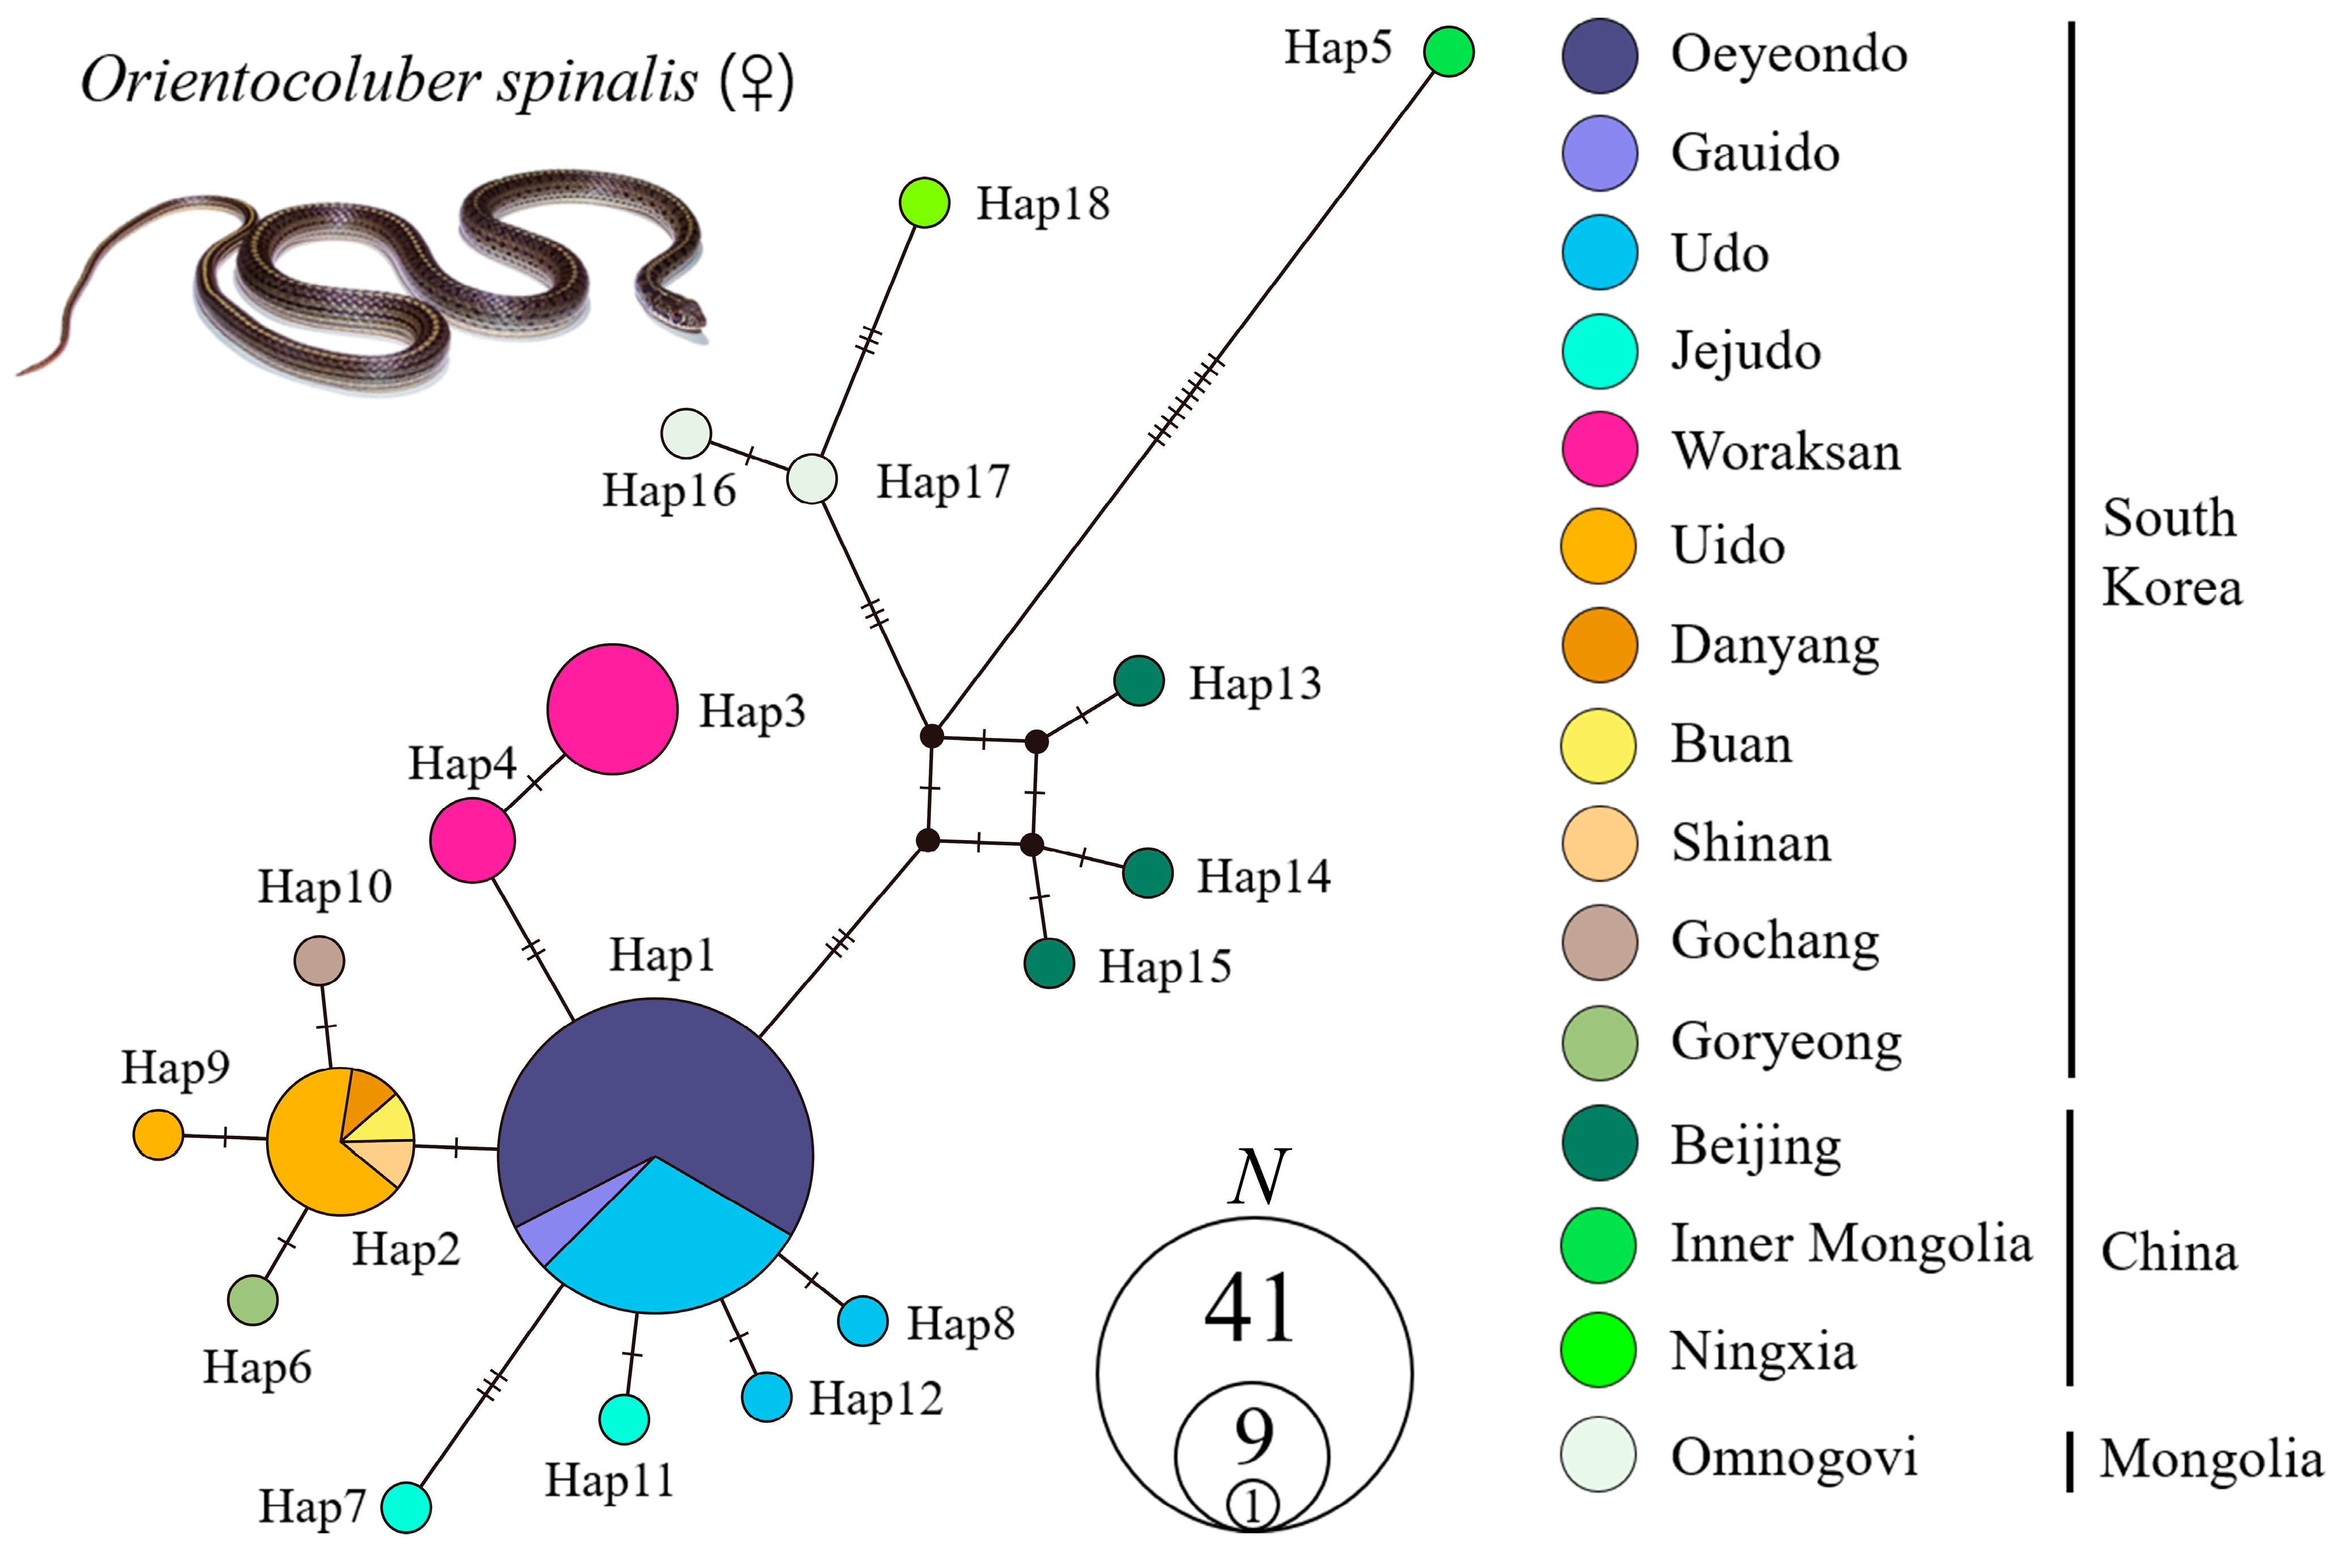
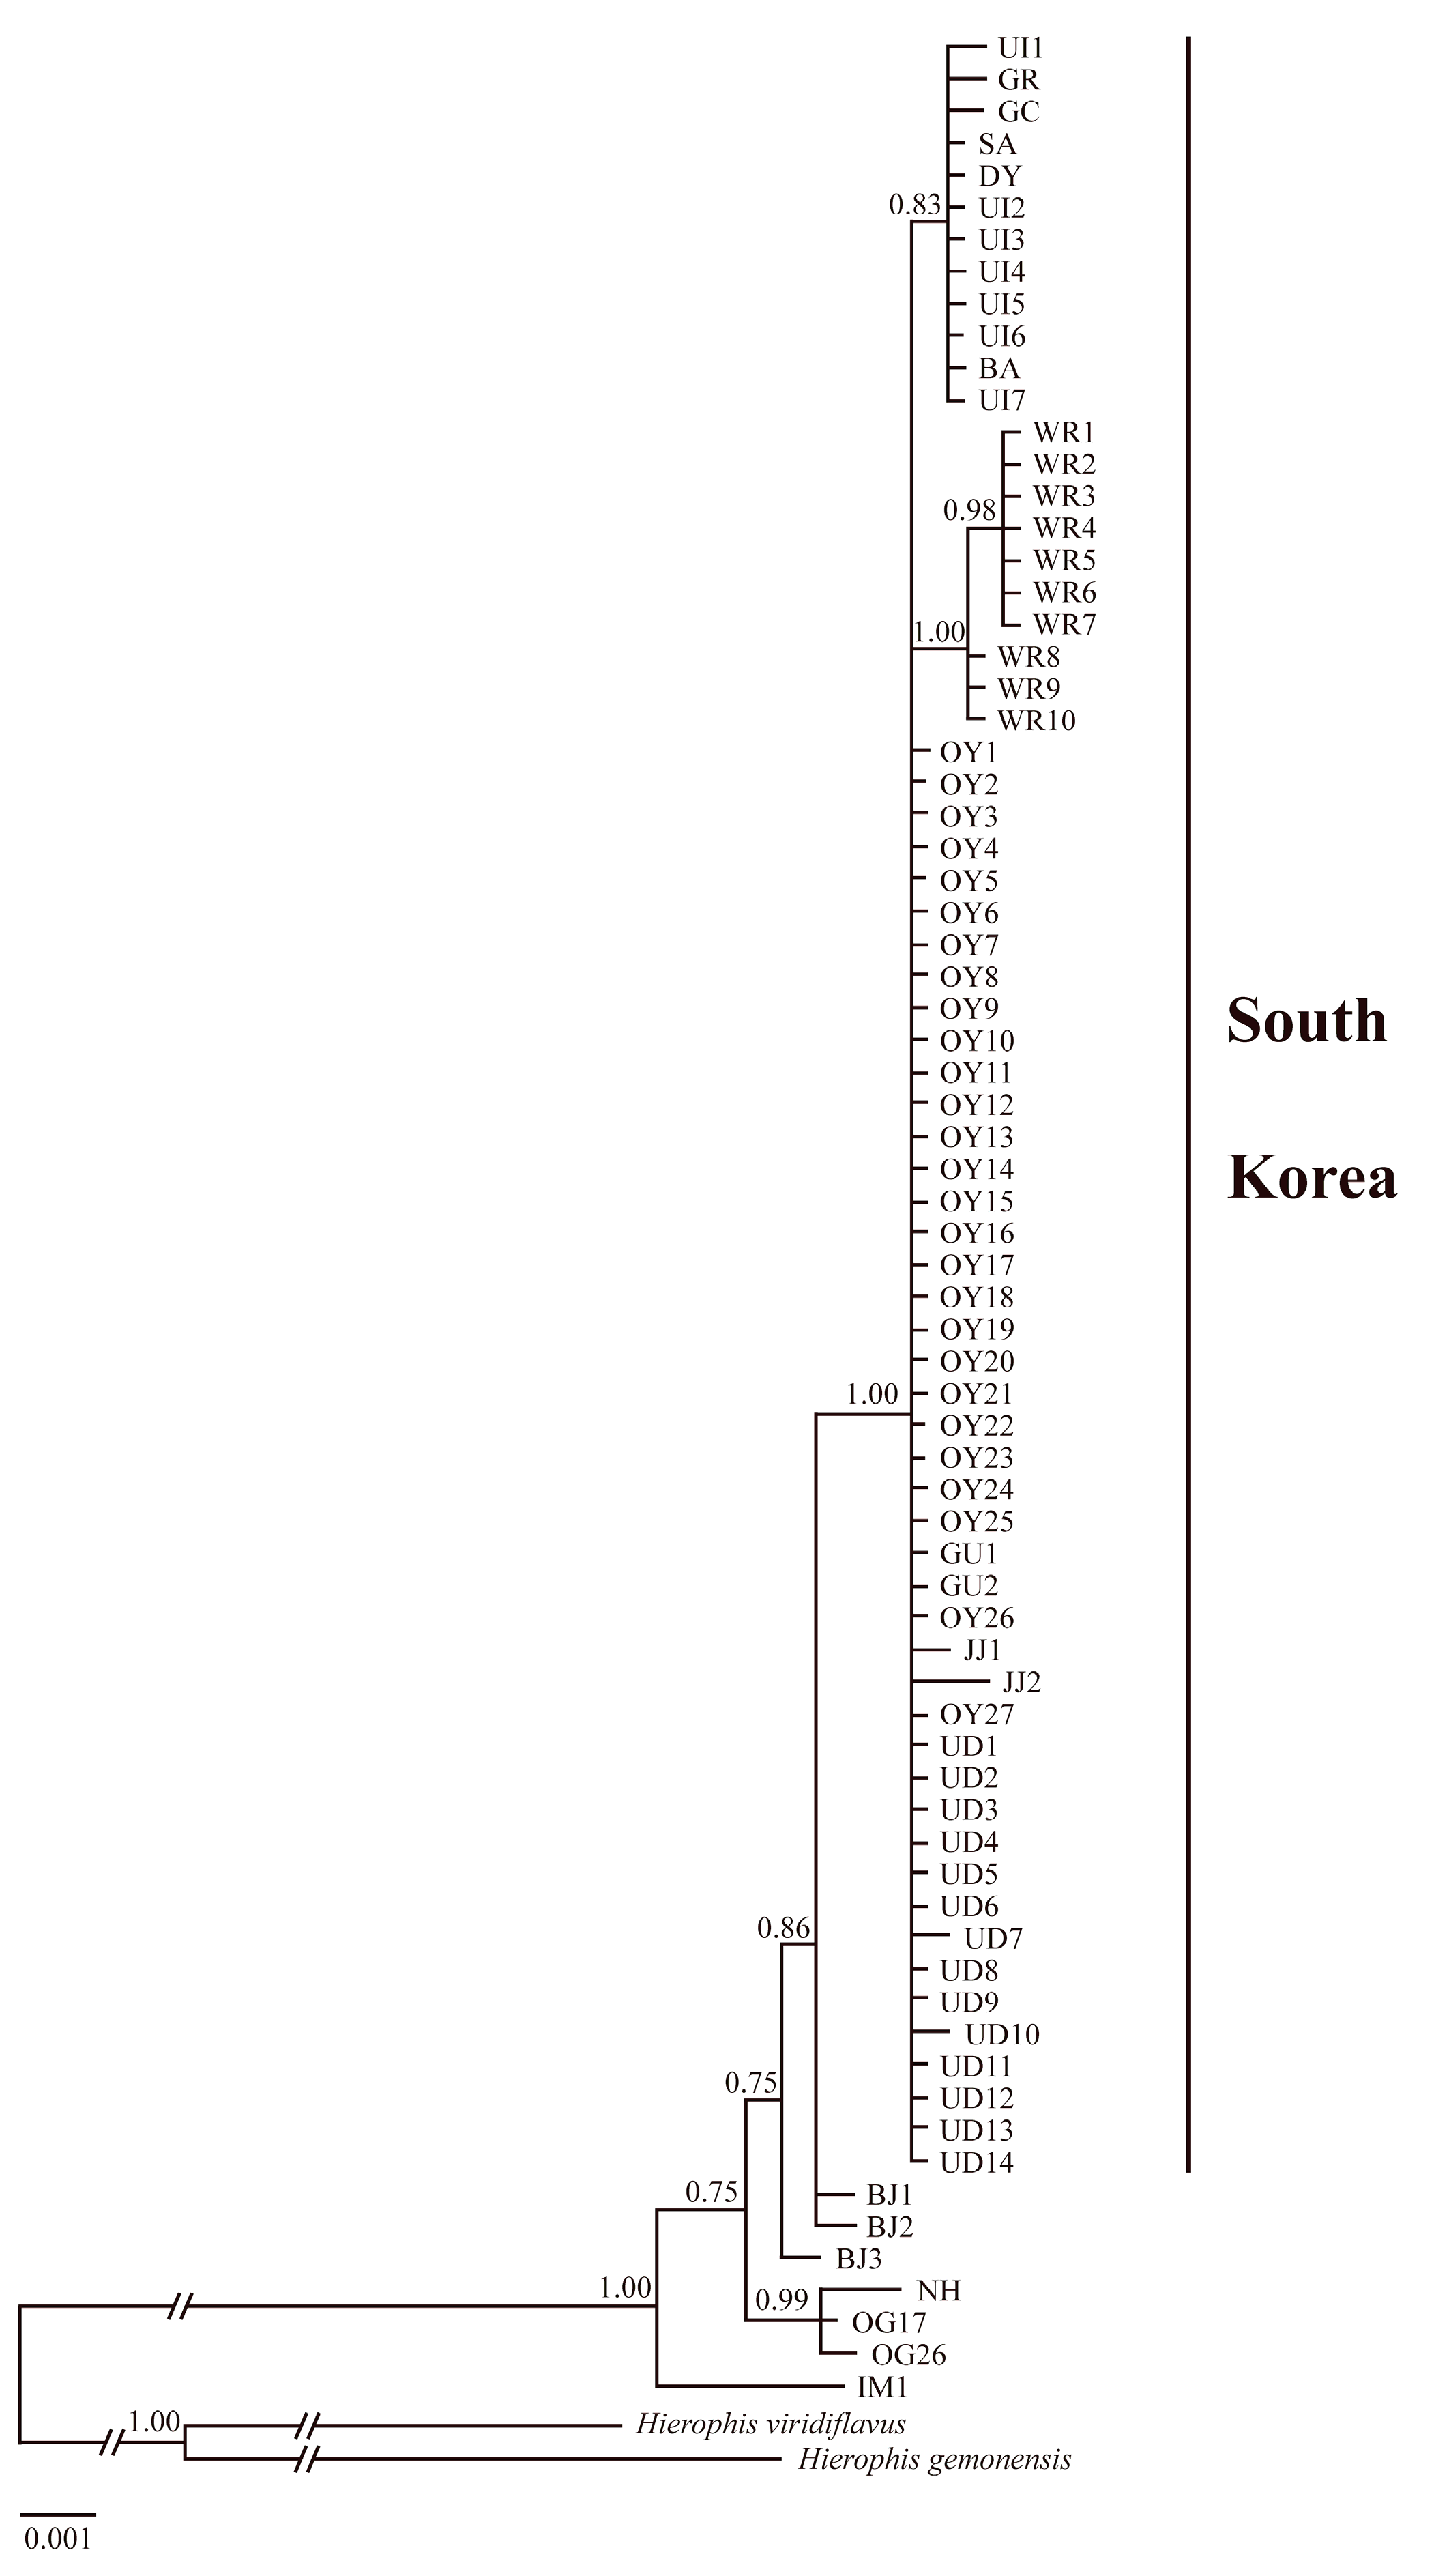
3.2. Genetic Structure

In the haplotype network (Figure 3), the Korean and foreign populations were divided into two groups. The Korean populations showed a typical star-like pattern overall. Specifically, Oeyeondo, Gauido, Udo, and Jejudo formed one group, and Uido, Shinan, Goryeong, Gochang, Danyang, and Buan formed a second group. Woraksan formed its own group. Regarding the populations in foreign countries, Omnogovi in Mongolia and Ningxia in China were closely related. Snakes from Inner Mongolia in China were the most genetically distant from other foreign and Korean populations. The foreign population most closely related to the Korean population was the Beijing population in China. The pairwise genetic p-distances between the major four Korean populations were small, at 0.01–0.20% (Table 4). They ranged from 0.42% to 0.57% between the Korean and combined foreign population. In the BI tree (Figure 4), snakes from Inner Mongolia in China were located at the most basal position. Next, Omnogovi, Ningxia, and Beijing were located at the base in that order. Korean O. spinalis was in the most derived position and formed a clade.

4. Discussion

In South Korea, the major populations of O. spinalis were found on islands, with low genetic diversity. The Woraksan population, located inland, also showed low genetic diversity. Thus, both island and inland populations in which a large number of O. spinalis were studied in South Korea commonly had low genetic diversity. In particular, the genetic diversity of the Oeyeondo population was very low. We identified only one haplotype, even though we analyzed the sequences of 27 snakes. In contrast to our results, allied species such as the horseshoe whip snake (Hemorrhois hippocrepis) and the green whip snake (Hierophis carbonarius) had high genetic diversity, with haplotype diversity values of 0.924 and 0.623 and nucleotide diversity values of 0.006 and 0.004, respectively [57,58]. Our results can be interpreted in two ways. First, the low genetic diversity of populations located on islands can be attributed to the nature of the islands. In general, reptile species on islands have low genetic diversity due to their small population sizes and limited gene flow due to oceanic barriers [59,60]. Our results are consistent with these explanations. Second, the low diversity of the inland Woraksan population can be explained by the habitat use characteristics of the species [22]. Orientocoluber spinalis in Woraksan was mainly found on the embankments of mountain valleys and in nearby grasslands. Even if there are other populations in the vicinity, gene flow with them will not be high. In reptiles, mountain barriers often restrict gene flow between populations [6,61]. Our results suggest that O. spinalis in South Korea is likely facing a high risk of extinction due to low genetic diversity, particularly if habitat changes occur.
Orientocoluber spinalis populations in South Korea are genetically closely related to each other, showing recent population divergence. In the haplotype network, Korean populations showed a typical star-like network, showing evidence of recent differentiation [38,62]. The low pairwise genetic p-distances of 0.01–0.20% among the four major Korean populations also support the recent differentiation [36]. Oeyeondo, Udo, and Uido, where major populations are located, separated from the Korean Peninsula approximately 8800 years ago as sea levels rose [63,64]. Therefore, the divergence of O. spinalis across the Korean Peninsula likely occurred before the island separation. In particular, the fact that Oeyeondo and Udo are genetically very similar even though they are latitudinally far apart (more than 350 km) supports the idea that O. spinalis occupied these islands at a similar time period before their separation from the peninsula. In the mismatch distribution analysis, a unimodal pattern and nonsignificant raggedness index indicated a recent, sudden expansion of a population [65]. Our results suggest recent sudden expansion of the populations in South Korea. Moreover, this interpretation is consistent with our results from three different neutrality tests, which suggested a recent population expansion in South Korea [42,43]. It is also supported by our BSP findings that populations in South Korea have expanded from 10,000 years ago. Overall, these multiple lines of evidence suggest that O. spinalis populations in South Korea recently expanded.
Orientocoluber spinalis in South Korea originated from China and/or Mongolia, but the dispersal route is not clear. In the BI tree, the Inner Mongolian population was located at the most basal position, and the Korean populations were located in the most derived clade. These findings support a Chinese or Mongolian origin of the Korean O. spinalis populations. Two possible introduction routes can be considered. The first is a route from northeastern China. Orientocoluber spinalis inhabits Democratic People’s Republic of Korea hereafter, North Korea [23,66], which is located in the middle of the dispersal route. Major suitable habitats of O. spinalis are found in the northern parts of China as well as the western coastal areas of North Korea [22]. These results support this northern dispersal route. In contrast, South Korean populations are not genetically related to northeastern populations in China, which were investigated in this study. Additionally, Woraksan, Gauido, and Oeyeondo, which are located at a higher latitude in South Korea, did not show greater differentiation than the southernmost populations, such as Uido and Jejudo. These results did not support this northern route. However, we still cannot rule out this route because we did not examine samples from North Korea. A route through the West (Yellow) Sea is another option. During the last glacial maximum period, grasslands and drylands, which are suitable habitats for O. spinalis, covered the entire West (Yellow) Sea area [22,67,68]. Major suitable habitats of O. spinalis were located on the Shandong Peninsula at the time, which is the closest to the western coastal areas of the Korean Peninsula [22]. In our haplotype network, populations in Gauido, Oeyeondo, Udo, and Jejudo, which are the circular outermost parts of the western and southern coasts of the Korean Peninsula, are genetically grouped together despite great latitudinal differences. These results support this western introduction route. Although the current data favor the western route, samples from mid-central China and North Korea should be analyzed to further confirm it.

5. Conclusions

The major populations of O. spinalis in South Korea were located on islands. Both island and inland populations had low genetic diversity. Korean O. spinalis populations likely originated from China and/or Mongolia, but the introduction route is not clear. Considering that O. spinalis is a monotypic species and has low population density and low genetic diversity, it should be designated an endangered species in South Korea, as it is in Russia, Mongolia, and Kazakhstan. In addition, further studies with additional samples and using microsatellites should be performed.

Author Contributions

H.J., I.-K.P. and S.-C.L. performed the field sampling. H.J., J.K. and J.P. performed the laboratory experiments and analyzed the data. H.J., I.-K.P., J.P. and D.P. prepared the manuscript. All authors have read and agreed to the published version of the manuscript.

Funding

This study was supported by the Basic Science Research Program through the National Research Foundation of Korea (NRF), funded by the Ministry of Education (No. 2020R1I1A3051885).

Institutional Review Board Statement

This research was conducted within the guidelines and with approval of the Institutional Animal Care and Use Committee of Kangwon National University (KW-2007). Snake sampling was conducted with permission from the Korea National Park Service and local governments (Chungcheongnam-do, Boryeong-si, and Jeju-si).

Data Availability Statement

Data are available in the main manuscript and from GenBank.

Acknowledgments

We thank Eun-Ji Choi for her help with the experiments and Taewon Lee, Nam-Yong Ra, Hoan-Jin Jang, Il-Hun Kim, Amaël Borzée, Min Seock Do, Seohyun Bae, Yucheol Shin, Shan Gui, and Purevee Erdenetushig for providing samples.

Conflicts of Interest

The authors declare no conflict of interest.

References

  1. Drury, W.H. Rare species. Biol. Conserv. 1974, 6, 162–169. [Google Scholar] [CrossRef]
  2. Cunningham, R.B.; Lindenmayer, D.B. Modeling count data of rare species: Some statistical issues. Ecology 2005, 5, 1135–1142. [Google Scholar] [CrossRef]
  3. Sodhi, N.S.; Brook, B.W.; Bradshaw, C.A.J. Causes and Consequences of Species Extinctions. In The Princeton Guide to Ecology, 1st ed.; Simon, A.L., Stephen, R., Carpenter, H., Charles, J.G., Ann, P.K., Michel, L., Jonathan, B.L., Brian, W., David, S.W., Eds.; Princeton University Press: Princeton, NJ, USA, 2009; pp. 520–541. ISBN 978-0691156040. [Google Scholar]
  4. Canales-Delgadillo, J.C.; Scott-Morales, L.; Korb, J. The influence of habitat fragmentation on genetic diversity of a rare bird species that commonly faces environmental fluctuations. J. Avian Biol. 2012, 43, 168–176. [Google Scholar] [CrossRef]
  5. Vermeij, G.J.; Grosberg, R.K. Rarity and persistence. Ecol. Lett. 2018, 21, 3–8. [Google Scholar] [CrossRef] [PubMed]
  6. Frankham, R.; Ballou, J.D.; Ralls, K.; Eldridge, M.D.E.; Dudash, M.R.; Fenster, C.B.; Lacy, R.C.; Sunnucks, P. Genetic Management of Fragmented Animal and Plant Populations, 1st ed.; Oxford University Press: New York, NY, USA, 2017; ISBN 978-0198783404. [Google Scholar]
  7. DeWoody, J.A.; Harder, A.M.; Mathur, S.; Willoughby, J.R. The long-standing significance of genetic diversity in conservation. Mol. Ecol. 2021, 30, 4147–4154. [Google Scholar] [CrossRef]
  8. Gómez-Sánchez, D.; Olalde, I.; Sastre, N.; Enseñat, C.; Carrasco, R.; Marques-Bonet, T.; Lalueza-Fox, C.; Leonard, J.A.; Vilà, C.; Ramírez, O. On the path to extinction: Inbreeding and admixture in a declining grey wolf population. Mol. Ecol. 2017, 27, 3599–3612. [Google Scholar] [CrossRef] [PubMed]
  9. Khosravi, R.; Malekian, M.; Hemami, M.R.; Silva, T.L.; Brito, J.C. Low genetic diversity in the vulnerable Goitred gazelle, Gazella subgutturosa (Cetartiodactyla: Bovidae), in Iran: Potential genetic consequence of recent population declines. Zool. Middle East 2019, 65, 104–115. [Google Scholar] [CrossRef]
  10. Wood, D.A.; Rose, J.P.; Halstead, B.J.; Stoelting, R.E.; Swaim, K.E.; Vandergast, A.G. Combining genetic and demographic monitoring better informs conservation of an endangered urban snake. PLoS ONE 2020, 15, e0231744. [Google Scholar] [CrossRef]
  11. Keyghobadi, N.; Crawford, L.A.; Desjardins, S. High genetic drift in endangered northern peripheral populations of the Behr’s hairstreak butterfly (Satyrium behrii). Insect. Syst. Divers. 2021, 14, 403–411. [Google Scholar] [CrossRef]
  12. Soltis, P.S.; Gitzendanner, M.A. Molecular systematics and the conservation of rare species. Conserv. Biol. 1999, 13, 471–483. [Google Scholar] [CrossRef]
  13. Steiner, C.C.; Putnam, A.S.; Hoeck, P.E.A.; Ryder, O.A. Conservation genomics of threatened animal species. Annu. Rev. Anim. Biosci. 2013, 1, 261–281. [Google Scholar] [CrossRef] [PubMed] [Green Version]
  14. Hohenlohe, P.A.; Funk, W.C.; Rajora, O.P. Population genomics for wildlife conservation and management. Mol. Ecol. 2021, 30, 62–82. [Google Scholar] [CrossRef] [PubMed]
  15. Ruane, S.; Austin, C.C. Phylogenomics using formalin-fixed and 100+ year-old intractable natural history specimens. Mol. Ecol. Resour. 2017, 17, 1003–1008. [Google Scholar] [CrossRef] [PubMed]
  16. Shin, Y.C.; Messenger, K.R.; Koo, K.S.; Lee, S.C.; Hou, M.; Borzée, A. How threatened is Scincella huanrenensis? An update on threats and trends. Conservation 2021, 1, 58–72. [Google Scholar] [CrossRef]
  17. Pilliod, D.S.; Hallock, L.A.; Miller, M.P.; Mullins, T.D.; Haig, S.M. Conservation genetics of the imperiled Striped whipsnake in Washington, USA. Herpetol. Conserv. Biol. 2020, 15, 597–610. [Google Scholar]
  18. Shaffer, H.B.; Gidiş, M.; McCartney-Melstad, E.; Neal, K.M.; Oyamaguchi, H.M.; Tellez, M.; Toffelmier, E.M. Conservation genetics and genomics of amphibians and reptiles. Annu. Rev. Anim. Biosci. 2015, 3, 113–138. [Google Scholar] [CrossRef] [PubMed] [Green Version]
  19. Song, J.Y. Current status and distribution of reptiles in the Republic of Korea. Korean J. Environ. Biol. 2007, 25, 124–138. [Google Scholar]
  20. Macias, D.; Shin, Y.C.; Borzée, A. An update on the conservation status and ecology of Korean terrestrial squamates. J. Nat. Conserv. 2021, 60, 125971. [Google Scholar] [CrossRef]
  21. Kharin, V.E.; Akulenko, M.V. Rare and little-known snakes in North-Eastern Eurasia. 1. On a new record of Slender racer–Hierophis spinalis (Colubridae) in the Russian Far East. Curr. Stud. Herpetol. 2008, 8, 160–169. [Google Scholar]
  22. Park, I.K.; Borzée, A.; Park, J.J.; Min, S.H.; Zhang, Y.P.; Li, S.R.; Park, D.S. Past, present, and future predictions on the suitable habitat of the Slender racer (Orientocoluber spinalis) using species distribution models. Ecol. Evol. 2022, 12, e9169. [Google Scholar] [CrossRef]
  23. Kim, L.T.; Han, G.H. Animal of Chosun: Amphibian and Reptiles; Science and Technology Publisher: Pyongyang, Republic of Korea, 2009; p. 138. ISBN 978-9946-1-0065-4. [Google Scholar]
  24. Park, I.K.; Park, J.J.; Min, S.H.; Grajal-Puche, A.; Park, D.S. Predation of the Japanese keelback (Hebius vibakari Boie, 1826) by the Slender racer (Orientocoluber spinalis Peters, 1866). J. Ecol. Environ. 2021, 45, 19. [Google Scholar] [CrossRef]
  25. Nagy, Z.T.; Lawson, R.; Joger, U.; Wink, M. Molecular systematics of racers, whipsnakes, and relatives (Reptilia: Colubridae) using mitochondrial and nuclear markers. J. Zool. Syst. Evol. Res. 2004, 42, 223–233. [Google Scholar] [CrossRef]
  26. Schätti, B.; Monsch, P. Systematics and phylogenetic relationships of whip snakes (Hierophis Fitzinger) and Zamenis andreana Werner, 1917 (Reptilia: Squamata: Colubrinae). Rev. Suisse Zool. 2004, 111, 239–256. [Google Scholar] [CrossRef]
  27. Kharin, V.E. Rare and little-known snakes of the north-eastern Eurasia. 3. On the taxonomic status of the Slender racer Hierophis spinalis (Serpentes: Colubridae). Curr. Stud. Herpetol. 2011, 11, 173–179. [Google Scholar]
  28. Maslova, I.V.; Akulenko, M.V.; Portnyagina, E.Y.; Pokhiyuk, N.E.; Rogashevskaya, D.A. Rare and endangered amphibians and reptiles of Primorsky Krai (Russian Far East). Biota. Environ. Nat. Areas. 2021, 41, 102–121. [Google Scholar] [CrossRef] [PubMed]
  29. Terbish, K.H.; Munkhbayar, K.H.; Clark, E.L.; Munkhbat, J.; Monks, E.M. Mongolian red list of reptiles and amphibians. In Regional Red List Series; Munkhbaatar, M., Baillie, J.E.M., Borkin, L., Batsaikhan, N., Samiya, R., Semenov, D.V., Eds.; Zoological Society of London: London, UK, 2011; Volume 5, p. 50. [Google Scholar]
  30. Kubykin, R.A.; Zima, Y.A. Animals. In Red Book of the Republic of Kazakhstan; Konzhyk: Almaty, Kazakhstan, 2010; Volume 1, pp. 74–75. [Google Scholar]
  31. National Institute of Biological Resources. Amphibians and Reptiles. In Red Data Book of Republic of Korea; National Institute of Biological Resources: Incheon, Republic of Korea, 2019; Volume 2. [Google Scholar]
  32. Park, J.J.; Park, I.K.; Ra, N.Y.; Min, S.H.; Park, D.S. Complete mitochondrial genome of the Slender racer (Orientocoluber spinalis Peters, 1866; Squamata, Colubridae). Mitochondrial DNA B Resour. 2020, 5, 2693–2694. [Google Scholar] [CrossRef]
  33. Burbrink, F.T.; Lawson, R.; Slowinski, J.B. Mitochondrial DNA phylogeography of the polytypic North American rat snake (Elaphe obsoleta): A critique of the subspecies concept. Evolution 2000, 54, 2107–2118. [Google Scholar] [CrossRef] [PubMed]
  34. Fontanella, F.M.; Feldman, C.R.; Siddall, M.E.; Burbrink, F.T. Phylogeography of Diadophis punctatus: Extensive lineage diversity and repeated patterns of historical demography in a trans-continental snake. Mol. Phylogenet. Evol. 2008, 46, 1049–1070. [Google Scholar] [CrossRef] [PubMed]
  35. Mezzasalma, M.; Dall’Asta, A.; Loy, A.; Cheylan, M.; Lymberakis, P.; Zuffi, M.A.; Tomović, L.; Odierna, G.; Guarino, F.M. A sisters’ story: Comparative phylogeography and taxonomy of Hierophis viridiflavus and H. gemonensis (Serpentes, Colubridae). Zool. Scr. 2015, 44, 495–508. [Google Scholar] [CrossRef]
  36. Meier, N.; Dubey, S.; Glaizot, O.; Schmitz, A.; Zambelli, N.; Ursenbacher, S. Where are you from? Origin determination of the introduced Green whipsnake, Hierophis viridiflavus (Squamata: Colubridae), in Switzerland. Herpetol. Notes 2022, 15, 335–344. [Google Scholar]
  37. Edgar, R.C. MUSCLE: Multiple sequence alignment with high accuracy and high throughput. Nucleic Acids Res. 2004, 32, 1792–1797. [Google Scholar] [CrossRef] [PubMed] [Green Version]
  38. Gadagkar, S.R.; Rosenberg, M.S.; Kumar, S. Inferring species phylogenies from multiple genes: Concatenated sequence tree versus consensus gene tree. J. Exp. Zool. B Mol. Dev. Evol. 2005, 304, 64–74. [Google Scholar] [CrossRef]
  39. Rozas, J.; Sánchez-DelBarrio, J.C.; Messeguer, X.; Rozas, R. DnaSP, DNA polymorphism analyses by the coalescent and other methods. Bioinformatics 2003, 19, 2496–2497. [Google Scholar] [CrossRef] [Green Version]
  40. Petit, R.J.; Mousadik, A.E.; Pons, O. Identifying populations for conservation on the basis of genetic markers. Conserv. Biol. 1998, 12, 844–855. [Google Scholar] [CrossRef]
  41. Tajima, F. Statistical method for testing the neutral mutation hypothesis by DNA polymorphism. Genetics 1989, 123, 585–595. [Google Scholar] [CrossRef]
  42. Fu, Y.X. Statistical tests of neutrality of mutations against population growth, hitchhiking and background selection. Genetics 1997, 147, 915–925. [Google Scholar] [CrossRef]
  43. Fu, Y.X.; Li, W.H. Statistical tests of neutrality of mutations. Genetics 1993, 133, 693–709. [Google Scholar] [CrossRef]
  44. Harpending, H.C.; Sherry, S.T.; Rogers, A.R.; Stoneking, M. The genetic structure of ancient human populations. Curr. Anthropol. 1993, 34, 483–496. [Google Scholar] [CrossRef]
  45. Bouckaert, R.; Vaughan, T.G.; Barido-Sottani, J.; Duchêne, S.; Fourment, M.; Gavryushkina, A.; Heled, J.; Jones, G.; Kühnert, D.; de Maio, N.; et al. BEAST 2.5: An advanced software platform for Bayesian evolutionary analysis. PLoS Comput. Biol. 2019, 15, e1006650. [Google Scholar] [CrossRef] [PubMed] [Green Version]
  46. Brown, R.P.; Yang, Z. Rate variation and estimation of divergence times using strict and relaxed clocks. BMC Evol. Biol. 2011, 11, 271. [Google Scholar] [CrossRef] [Green Version]
  47. Ho, S.Y.; Duchêne, S. Molecular-clock methods for estimating evolutionary rates and timescales. Mol. Ecol. 2014, 23, 5947–5965. [Google Scholar] [CrossRef]
  48. Daza, J.M.; Smith, E.N.; Páez, V.P.; Prkinson, C.L. Complex evolution in the neotropics: The origin and diversification of the widespread genus Leptodeira (Serpentes: Colubridae). Mol. Phylogenet. Evol. 2009, 53, 653–667. [Google Scholar] [CrossRef] [PubMed]
  49. Drummond, A.J.; Ho, S.Y.W.; Phillips, M.J.; Rambaut, A. Relaxed phylogenetics and dating with confidence. PLoS Biol. 2006, 4, e88. [Google Scholar] [CrossRef] [PubMed]
  50. Rambaut, A. FigTree 1.4.4. Available online: http://tree.bio.ed.ac.uk/software/figtree/ (accessed on 3 September 2022).
  51. Leigh, J.W.; Bryant, D. POPART: Full-feature software for haplotype network construction. Methods Ecol. Evol. 2015, 6, 1110–1116. [Google Scholar] [CrossRef]
  52. Bandelt, H.J.; Forster, P.; Röhl, A. Median-joining networks for inferring intraspecific phylogenies. Mol. Biol. Evol. 1999, 16, 37–48. [Google Scholar] [CrossRef] [PubMed]
  53. Kumar, S.; Stecher, G.; Li, M.; Knyaz, C.; Tamura, K. MEGA X: Molecular evolutionary genetics analysis across computing platforms. Mol. Biol. Evol. 2018, 35, 1547. [Google Scholar] [CrossRef]
  54. Ronquist, F.; Teslenko, M.; van der Mark, P.; Ayres, D.L.; Darling, A.; Höhna, S.; Larget, B.; Liu, L.; Suchard, M.A.; Huelsenbeck, J.P. MrBayes 3.2: Efficient Bayesian phylogenetic inference and model choice across a large model space. Syst. Biol. 2012, 61, 539–542. [Google Scholar] [CrossRef] [Green Version]
  55. Posada, D.; Crandall, K.A. MODELTEST: Testing the model of DNA substitution. Bioinformatics 1998, 14, 817–818. [Google Scholar] [CrossRef] [Green Version]
  56. Posada, D.; Buckley, T.R. Model selection and model averaging in phylogenetics: Advantages of Akaike information criterion and Bayesian approaches over likelihood ratio tests. Syst. Biol. 2004, 53, 793–808. [Google Scholar] [CrossRef] [PubMed]
  57. Avella, I.; Castiglia, R.; Senczuk, G. Who are you? The genetic identity of some insular populations of Hierophis viridiflavus s. l. from the Tyrrhenian Sea. Acta Herpetol. 2017, 12, 209–214. [Google Scholar] [CrossRef]
  58. Machado, L.; Harris, D.J.; Salvi, D. Biogeographic and demographic history of the Mediterranean snakes Malpolon monspessulanus and Hemorrhois hippocrepis across the strait of Gibraltar. BMC Ecol. Evol. 2021, 21, 210. [Google Scholar] [CrossRef]
  59. Case, T.J.; Bolger, D.T.; Richman, A.D. Reptilian extinctions: The last ten thousand years. In Conservation Biology; Fiedler, P.L., Jain, S.K., Eds.; Springer: Boston, MA, USA, 1992; pp. 91–125. ISBN 978-0412019517. [Google Scholar]
  60. Frankham, R. Do island populations have less genetic variation than mainland populations? Heredity 1997, 78, 311–327. [Google Scholar] [CrossRef] [Green Version]
  61. Hoorn, C.; Mosbrugger, V.; Mulch, A.; Antonelli, A. Biodiversity from mountain building. Nat. Geosci. 2013, 6, 154. [Google Scholar] [CrossRef] [Green Version]
  62. Jablonski, D.; Nagy, Z.T.; Avcı, A.; Olgun, K.; Kukushkin, O.V.; Safaei-Mahroo, B.; Jandzik, D. Cryptic diversity in the smooth snake (Coronella austriaca). Amphibia-Reptilia 2019, 40, 179–192. [Google Scholar] [CrossRef]
  63. Koo, H.J.; Cho, H.G. Changes in detrital sediment supply to the central Yellow Sea since the last deglaciation. Ocean Sci. 2020, 16, 1247–1259. [Google Scholar] [CrossRef]
  64. Lee, B.R.; Yoo, D.G.; Lee, G.S. High-resolution sequence stratigraphy and evolution of the Jeju strait shelf, Korea, since the last glacial maximum. Mar. Pet. Geol. 2022, 135, 105389. [Google Scholar] [CrossRef]
  65. Rogers, A.R.; Harpending, H. Population growth makes waves in the distribution of pairwise genetic differences. Mol. Biol. Evol. 1992, 9, 552–569. [Google Scholar] [CrossRef]
  66. Shannon, F.A. The reptiles and amphibian of Korea. Herpetologica 1956, 12, 22–49. [Google Scholar]
  67. Ray, N.; Adams, J. A GIS-based vegetation map of the world at the last glacial maximum (25,000-15,000 BP). Internet Archaeol. 2001, 11. [Google Scholar] [CrossRef] [Green Version]
  68. d’Alpoim Guedes, J.; Austerman, J.; Mitrovica, J.X. Lost foraging opportunities for east Asian hunter-gatherers due to rising sea level since the last glacial maximum. Geoarchaeology 2016, 31, 255–266. [Google Scholar] [CrossRef]
Figure 1. Sampling locations of Orientocoluber spinalis across South Korea, China, and Mongolia.
Diversity 15 00543 g001
Figure 2. Mismatch distribution (A) and Bayesian skyline plot (B) of 67 Orientocoluber spinalis samples based on concatenated mtDNA (Cytb + ND4; 1809 bp) across populations in South Korea. In panel (A), the solid line represents the observed distribution of pairwise differences and the dotted line represents the expected distribution, assuming population expansion in the mismatch distribution. A raggedness index value (r) is included. In panel (B), the solid dark blue line represents the mean value of the log10 effective population size, while the gray-blue area shows the 95% highest posterior density interval in the Bayesian skyline plot. Kya, thousand years ago.
Diversity 15 00543 g002
Figure 3. Median-joining haplotype network of 18 concatenated mitochondrial DNA (Cytb + ND4; 1809 bp) haplotypes of 15 Orientocoluber spinalis populations from South Korea, China, and Mongolia. The sizes of nodes (circles) are proportional to the number of individuals. Black dots represent median vectors inferred and unsampled haplotypes. Mutation steps between two haplotypes were indicated by diagonals.
Diversity 15 00543 g003
Figure 4. Bayesian inference (BI) tree of 74 Orientocoluber spinalis based on the concatenated mitochondrial DNA (Cytb + ND4; 1813 bp). Bayesian posterior probabilities (%) are reported above tree branches. Population abbreviations: OY, Oeyeondo; UD, Udo; WR, Woraksan; UI, Uido; JJ, Jejudo; GU, Gauido; BA, Buan; DY, Danyang; GC, Gochang; GR, Goryeong; SA, Shinan in South Korea; BJ, Beijing; IM, Inner Mongolia; NH, Ningxia in China; OG, Omnogovi in Mongolia.
Diversity 15 00543 g004
Table 1. Sampling information of Orientocoluber spinalis collected from South Korea, China, and Mongolia. Haplotypes are based on the concatenated sequence of mitochondrial Cytb (1113 bp) and ND4 (696 bp).
Locality IDCountryLocalityNo. of SamplesHaplotypeGenBank Accession Number
CytbND4
KR1South KoreaOeyeondo, Chungnam27Hap1OQ290820OQ290083
KR2Udo, Jeju14Hap1 Hap8 Hap12OQ290820 OQ290824OQ290837, OQ290838
KR3Woraksan, Chungbuk10Hap3 Hap4OQ290816 NC049067OQ290825, OQ290083, NC049067
KR4Uido, Jeonnam7Hap2 Hap9OQ290823OQ290836, OQ290825, OQ290083
KR5Jejudo, Jeju2Hap7 Hap11OQ290820 OQ290822OQ290083, OQ290831, OQ290835
KR6Gauido, Chungnam2Hap1OQ290820OQ290083
KR7Buan, Jeonbuk1Hap2OQ290823OQ290083
KR8Danyang, Chungbuk1Hap2OQ290823OQ290083
KR9Gochang, Jeonbuk1Hap10OQ290817OQ290083
KR10Goryeong, Gyeongbuk1Hap6OQ290815OQ290083
KR11Shinan, Jeonnam1Hap2OQ290823OQ290083
CN1ChinaBeijing3Hap13OQ290818OQ290826, OQ290827, OQ290828
CN2Inner Mongolia Autonomous Region1Hap14OQ290819OQ290829, OQ290834
CN3Ningxia Hui Autonomous Region1Hap18AY486924AY487056
MN1MongoliaOmnogovi2Hap16 Hap17OQ290821OQ290832, OQ290833
Total 74
Table 2. Distribution of the concatenated mitochondrial DNA (Cytb + ND4; 1809 bp) haplotypes of Orientocoluber spinalis across 11 South Korean populations, 3 Chinese populations, and 1 Mongolian population. OY, Oeyeondo; UD, Udo; WR, Woraksan; UI, Uido; JJ, Jejudo; GU, Gauido; BA, Buan; DY, Danyang; GC, Gochang; GR, Goryeong; SA, Shinan in South Korea, BJ, Beijing; IM, Inner Mongolia; NH, Ningxia in China; OG, Omnogovi in Mongolia.
CountrySouth KoreaChinaMongolia
HaplotypeOYUDWRUIJJGUBADYGCGRSABJIMNHOG
Hap12712 2
Hap2 6 11 1
Hap3 7
Hap4 3
Hap5 1
Hap6 1
Hap7 1
Hap8 1
Hap9 1
Hap10 1
Hap11 1
Hap12 1
Hap13 1
Hap14 1
Hap15 1
Hap16 1
Hap17 1
Hap18 1
Total132221111113112
Table 3. Genetic diversity and neutrality tests of the four major Orientocoluber spinalis populations in South Korea and the combined Korean population consisting of all 11 populations in South Korea based on concatenated mitochondrial DNA (Cytb + ND4; 1809 bp). N: the number of individuals, NH: the number of haplotypes, Ps: the number of polymorphic sites, h: haplotype diversity, π: nucleotide diversity, HR: haplotype richness, D: Tajima’s D, FS: Fu’s FS, FD: Fu and Li’s D*, and FF: Fu and Li’s F*. † p < 0.05.
PopulationNNHPsh ± SDπ ± SDHRDFSFD*FF*
Oeyeondo27100.000 ± 0.0000.0000 ± 0.00000.000NA0.0000.0000.000
Udo14320.275 ± 0.1480.0002 ± 0.00011.000−1.481−1.475−1.827−1.827
Woraksan10210.467 ± 0.1320.0003 ± 0.00010.9920.8200.8180.8040.898
Uido7210.286 ± 0.1960.0002 ± 0.00011.000−1.006−0.095−1.049−1.101
Combined Korean population6711120.602 ± 0.0640.0007 ± 0.0001 −1.398−4.557 −3.153 −2.874
Table 4. Uncorrected pairwise genetic p-distances (%) between the four major Orientocoluber spinalis populations in South Korea and the combined foreign population consisting of three populations in China and one population in Mongolia based on concatenated mitochondrial DNA (Cytb + ND4; 1809 bp).
Country South Korea
PopulationOyen (n = 27)Udo (n = 14)Woraksan (n = 10)Uido (n = 7)
South KoreaOeyeondo
Udo0.01
Woraksan0.150.16
Uido0.060.070.20
China and MongoliaCombined foreign population0.420.430.570.48
Disclaimer/Publisher’s Note: The statements, opinions and data contained in all publications are solely those of the individual author(s) and contributor(s) and not of MDPI and/or the editor(s). MDPI and/or the editor(s) disclaim responsibility for any injury to people or property resulting from any ideas, methods, instructions or products referred to in the content.

