
Seasonal and Site-Specific Patterns of Airborne Fungal Diversity Revealed Using Passive Spore Traps and High-Throughput DNA Sequencing

 ,
,
Abstract
1. Introduction
2. Materials and Methods
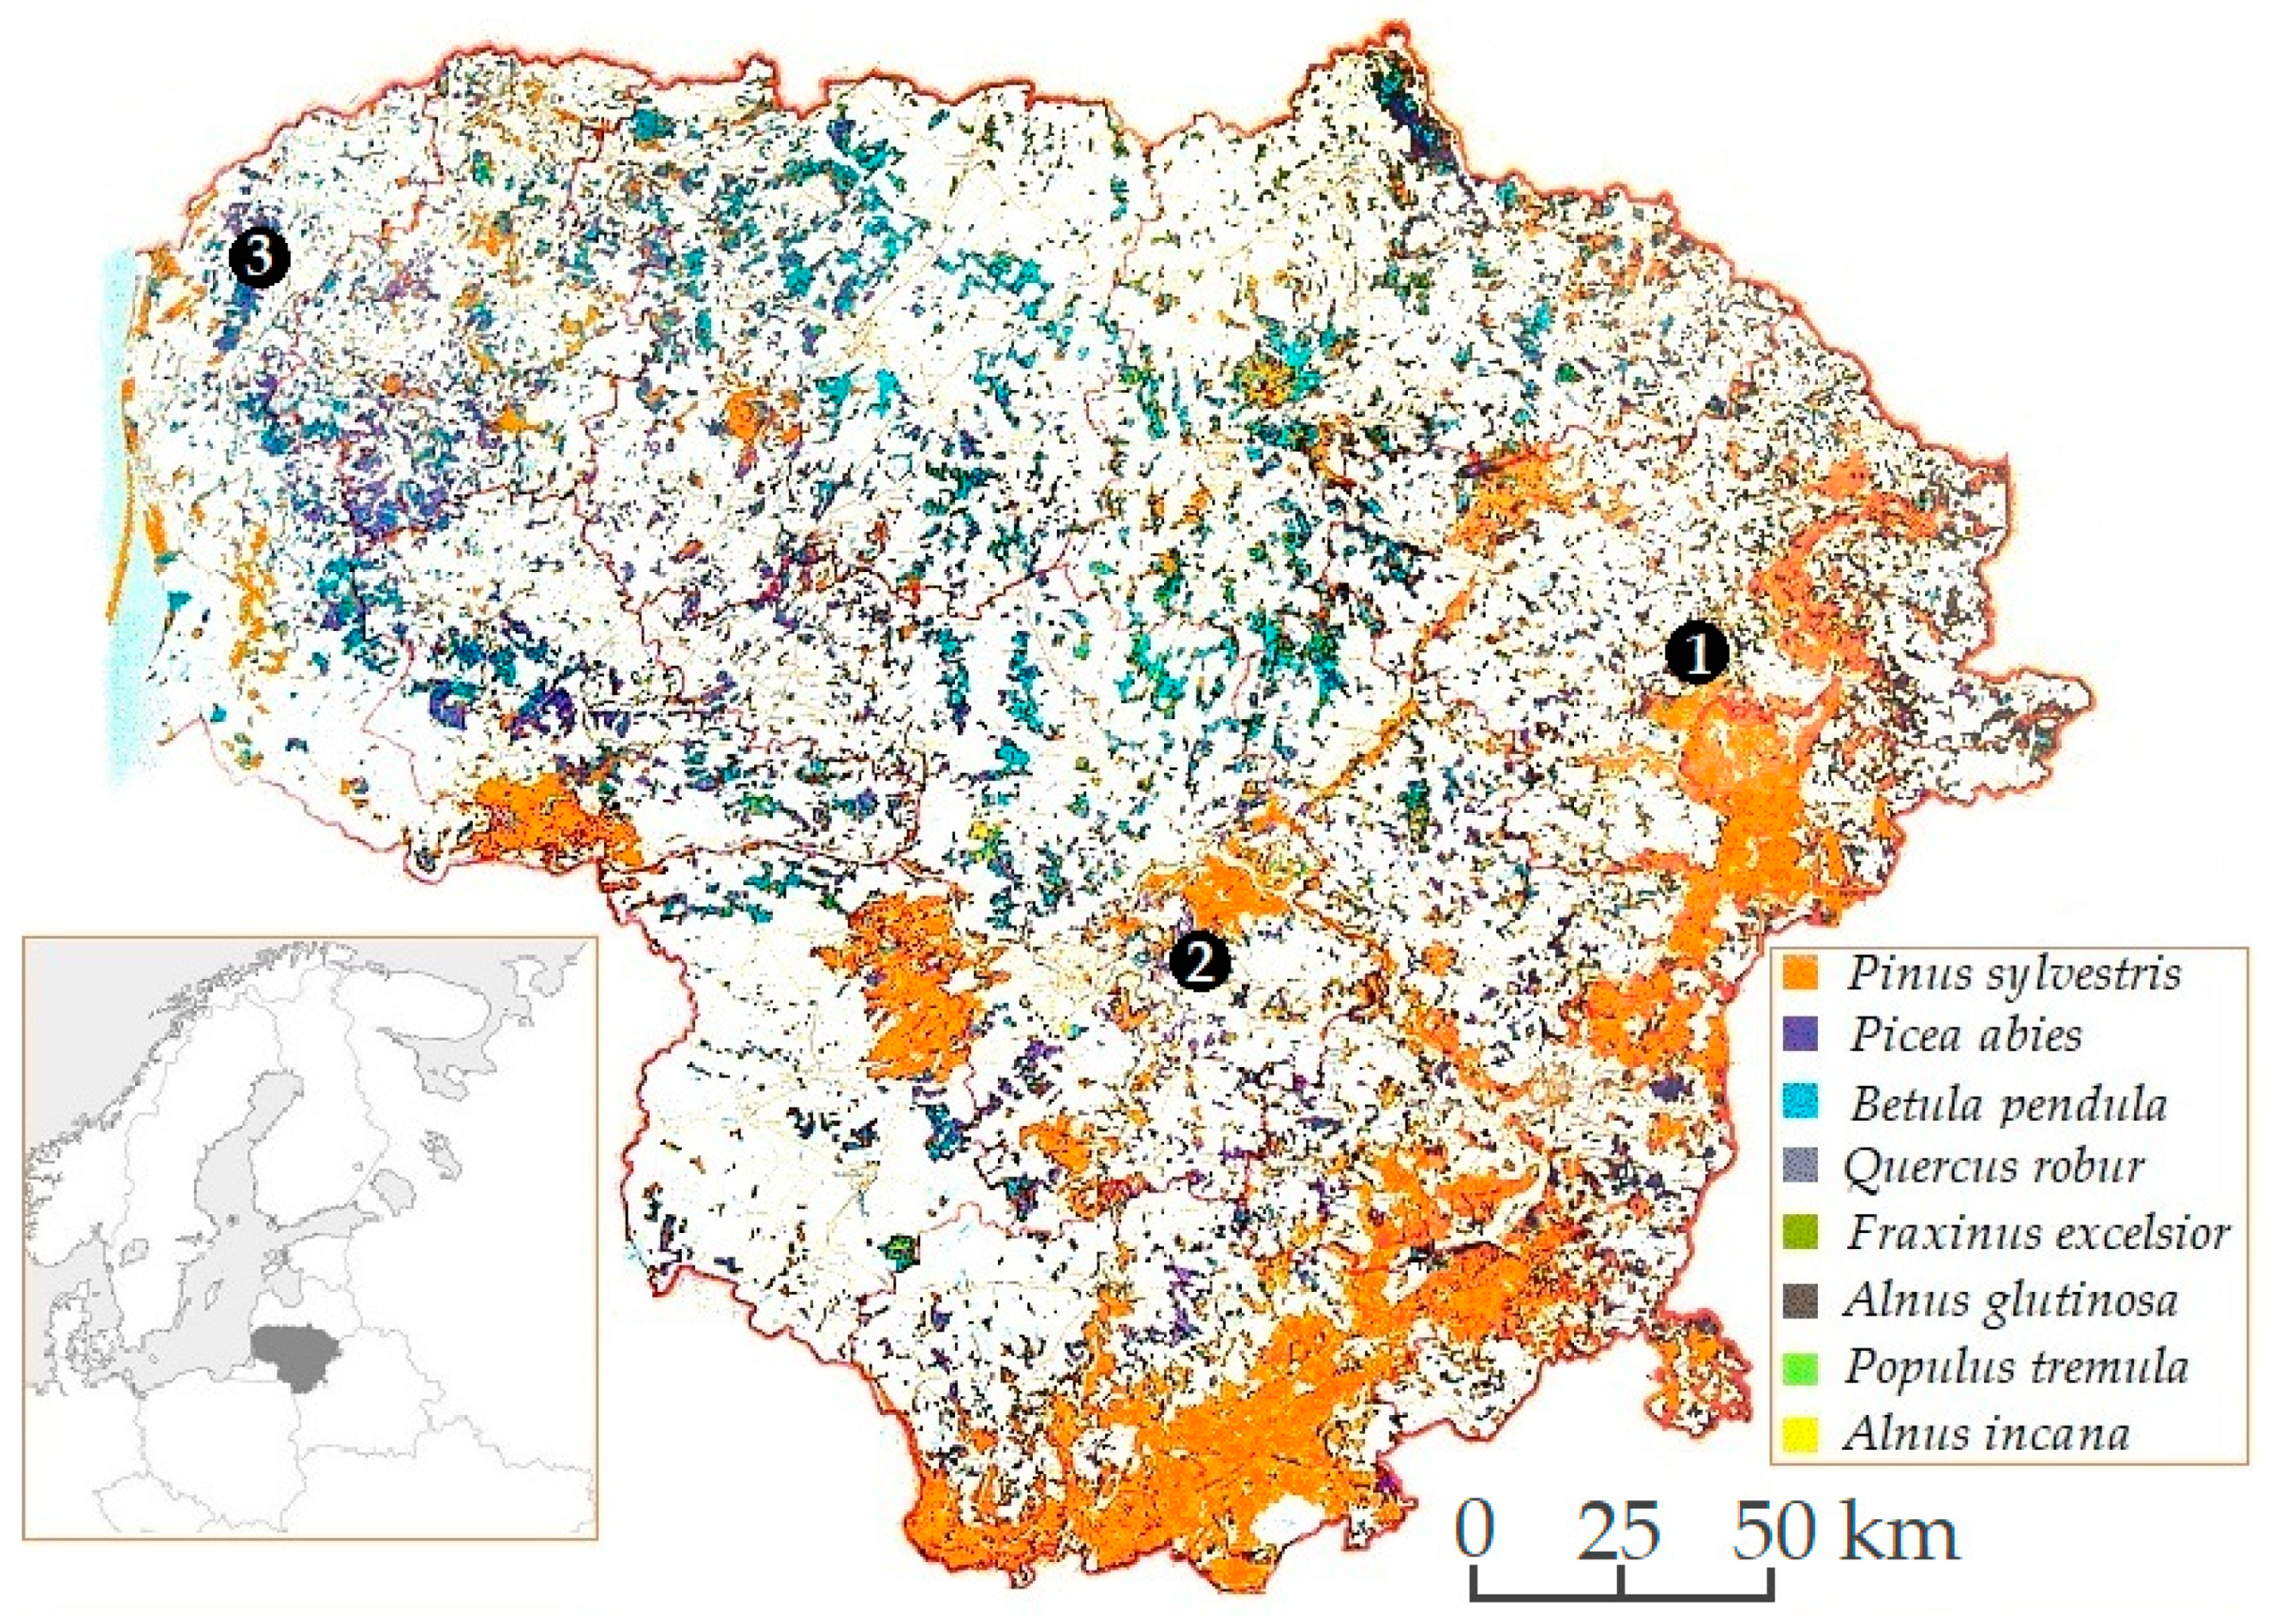
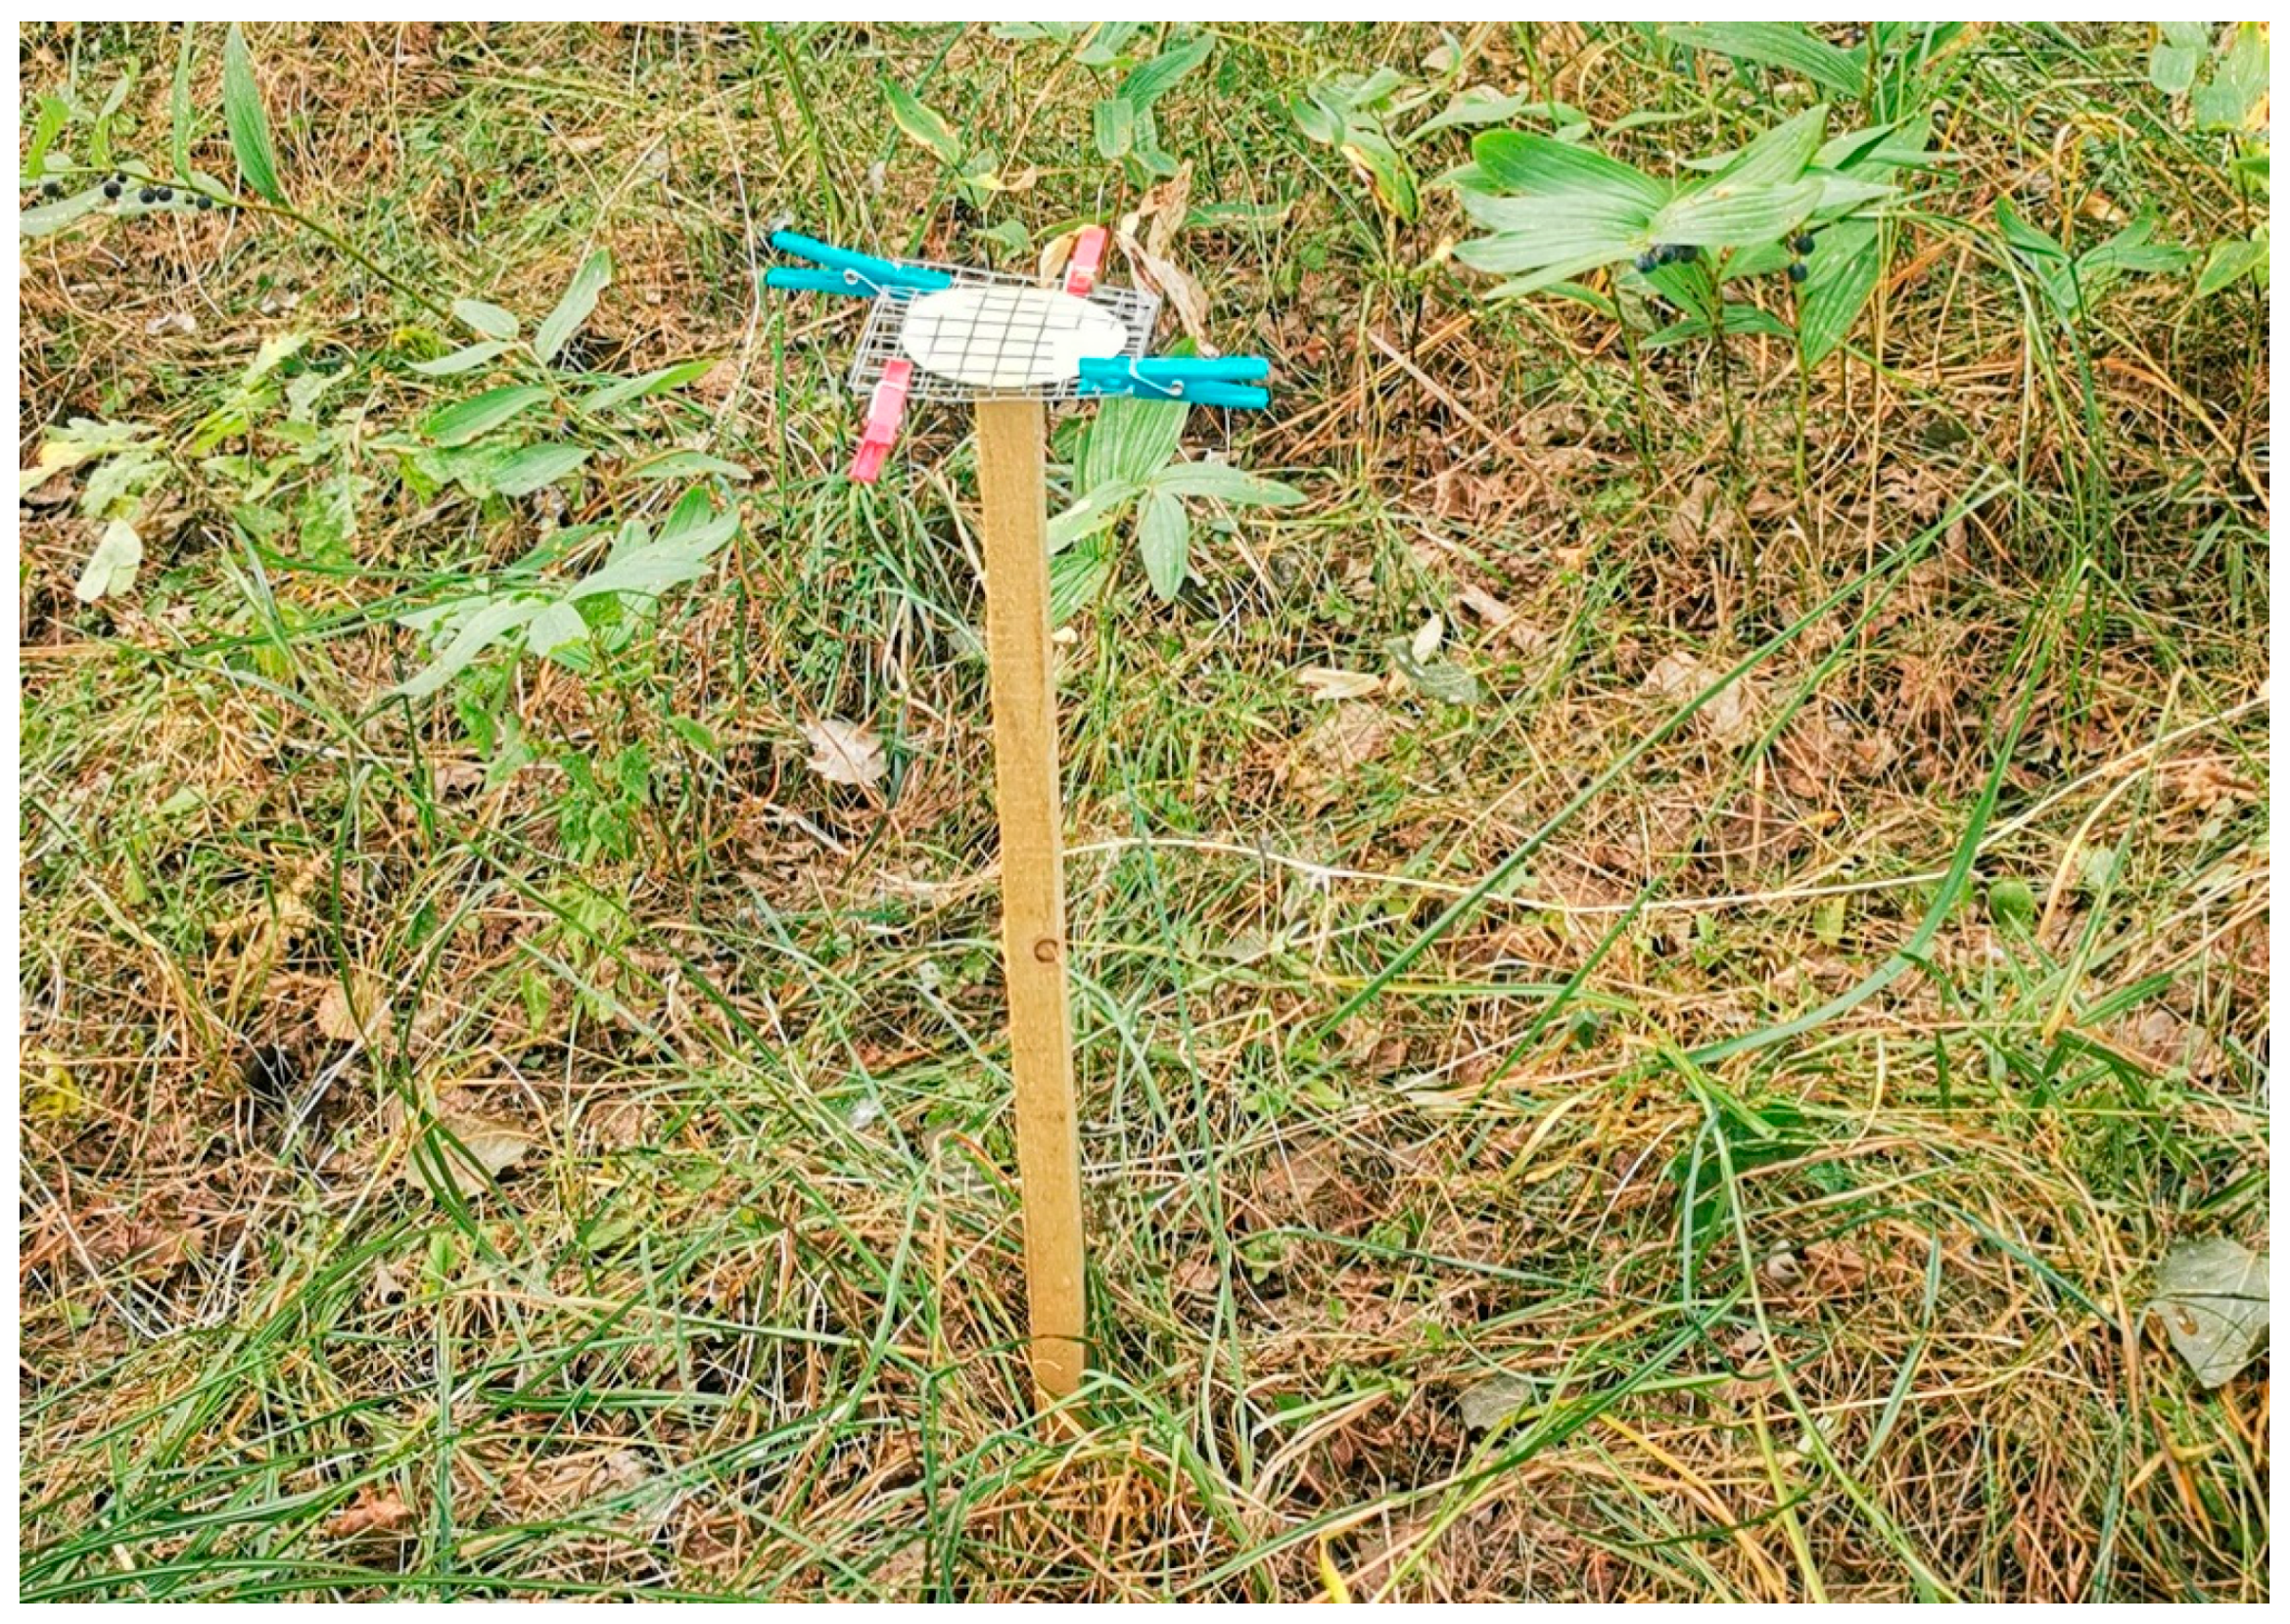
2.1. Study Sites and Sampling
2.2. DNA Extraction, PCR Amplification and Sequencing
2.3. Bioinformatics
2.4. Statistical Analyses
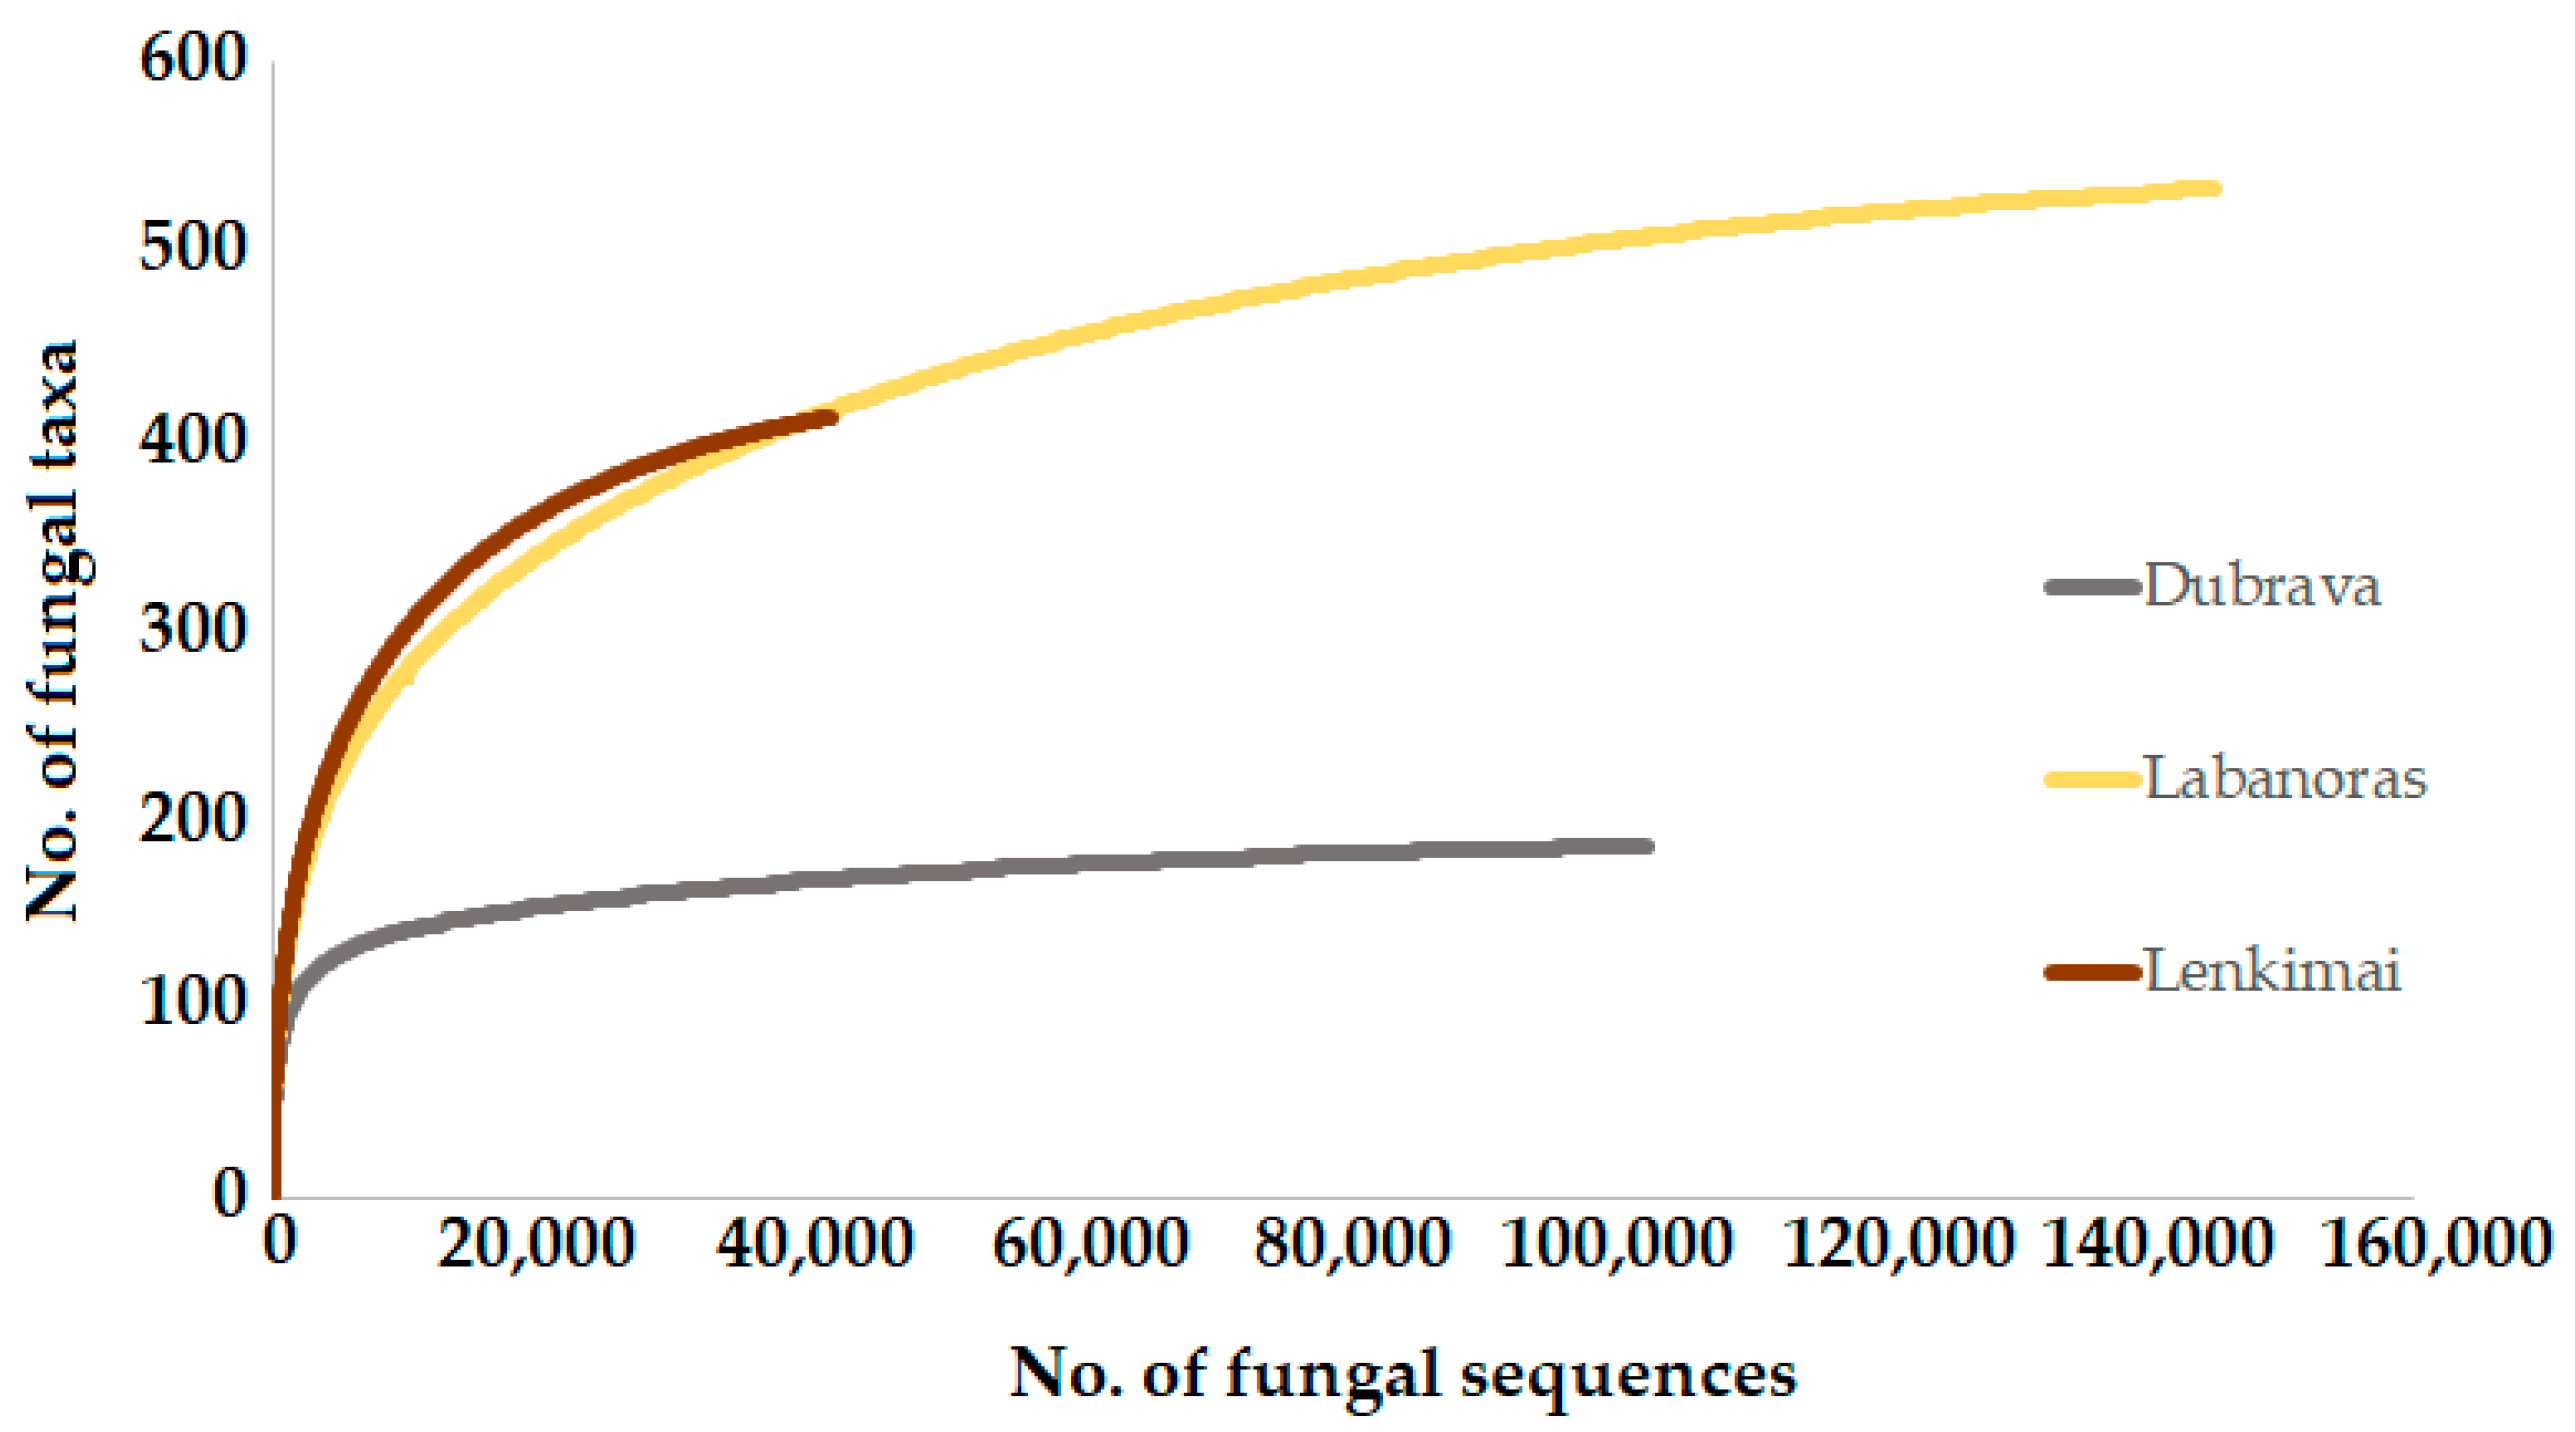
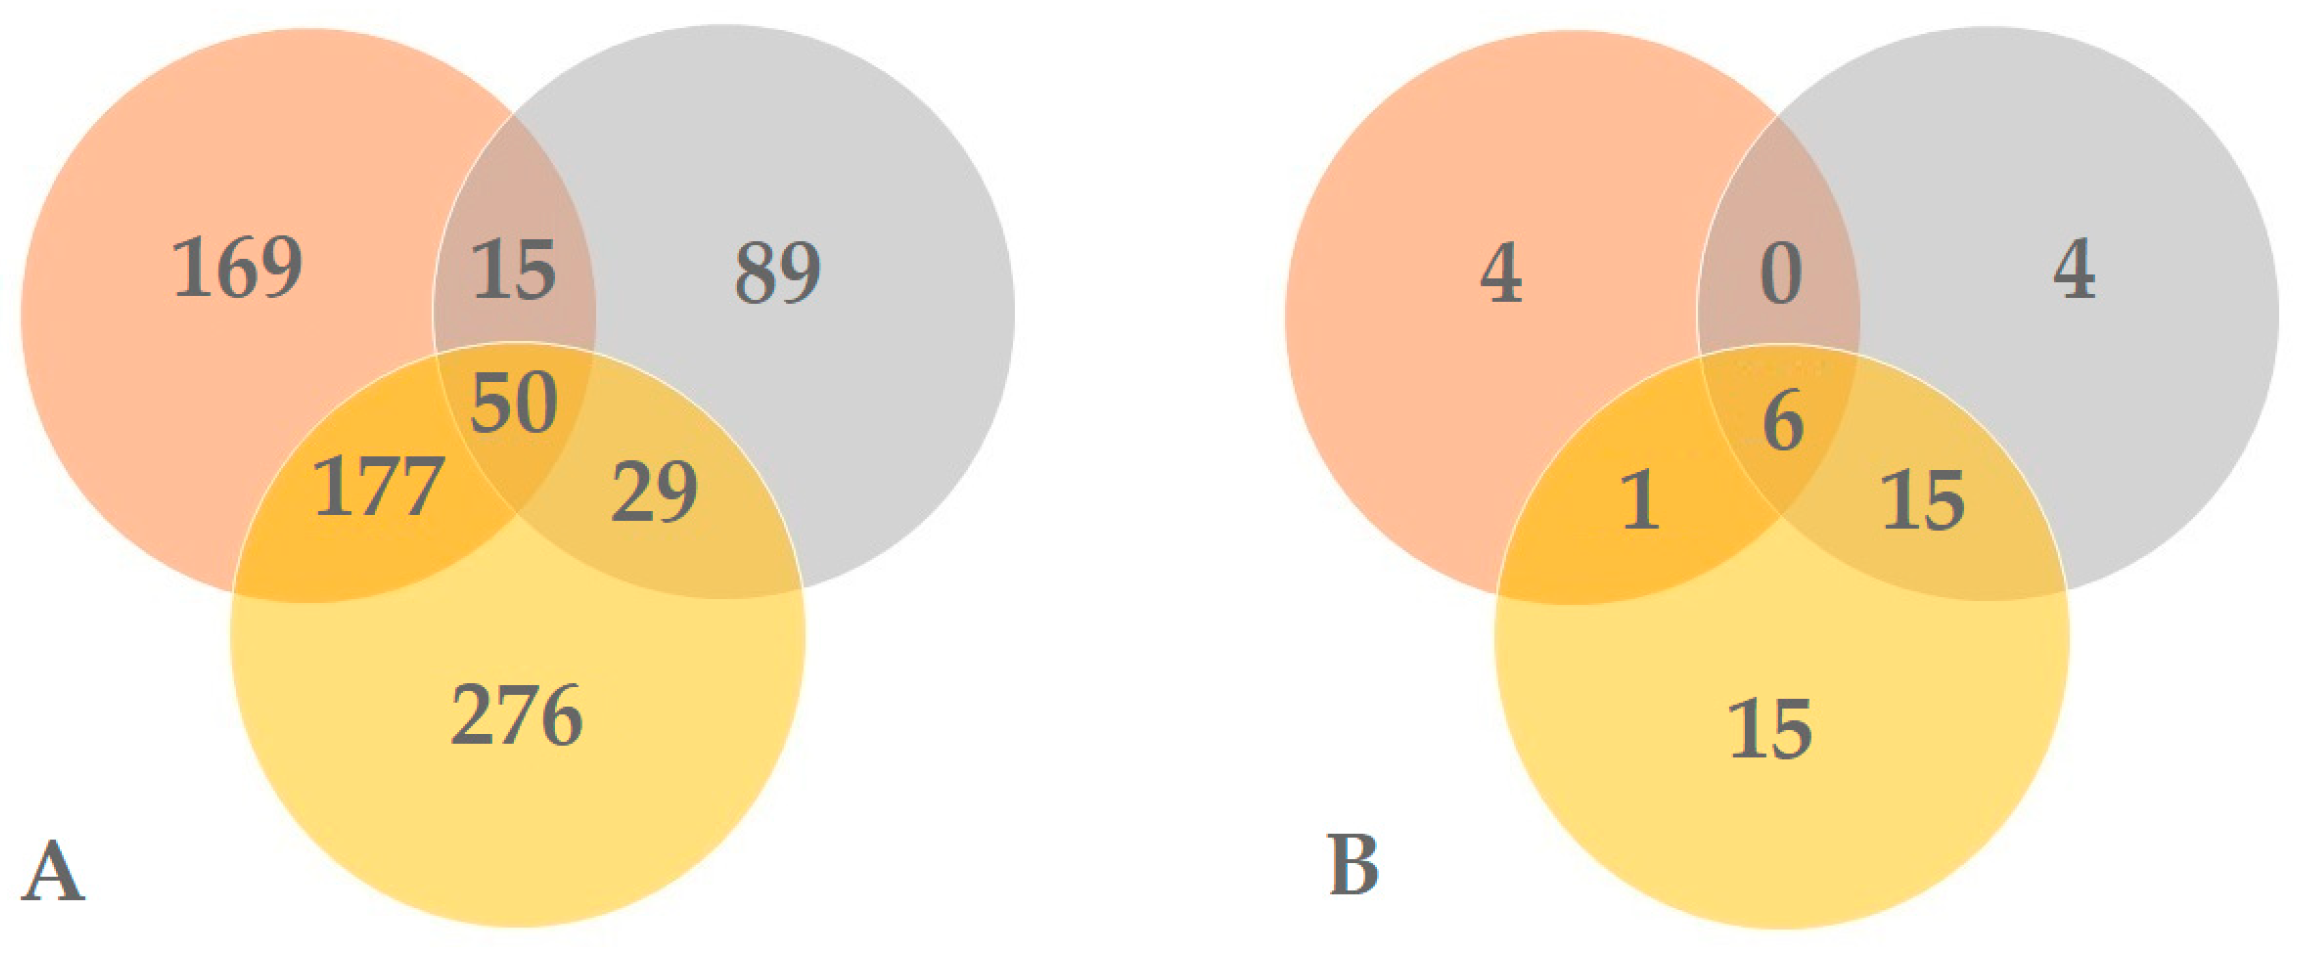
3. Results
4. Discussion
5. Conclusions
Supplementary Materials
Author Contributions
Funding
Institutional Review Board Statement
Data Availability Statement
Conflicts of Interest
References
- Mack, R.N.; Simberloff, D.; Lonsdale, W.M.; Evans, H.C.; Clout, M.N.; Bazzaz, F.A. Biotic invasions: Causes, epidemiology, global consequences and control. Ecol. Appl. 2000, 10, 689–710. [Google Scholar] [CrossRef]
- Levine, J.M.; Vilà, M.; Antonio, C.M.D.; Dukes, J.S.; Grigulis, K. Lavorel SMechanisms underlying the impacts of exotic plant invasions. Proc. R. Soc. B 2003, 270, 775–781. [Google Scholar] [CrossRef] [PubMed]
- Enderle, R.; Peters, F.; Nakou, K.; Metzler, B. Temporal development of ash dieback symptoms and spatial distribution of collar rots in a provenance trial of Fraxinus excelsior. Eur. J. For. Res. 2013, 132, 865–876. [Google Scholar] [CrossRef]
- Matisone, I.; Matisons, R.; Laiviņš, M.; Gaitnieks, T. Statistics of ash dieback in Latvia. Silva Fenn. 2018, 52, 9901. [Google Scholar] [CrossRef]
- Santini, A.; Ghelardini, L.; De Pace, C.; Desprez-Loustau, M.L.; Capretti, P.; Chandelier, A.; Cech, T.; Chira, D.; Diamandis, S.; Gaitniekis, T.; et al. Biogeographical patterns and determinants of invasion by forest pathogens in Europe. New Phytol. 2013, 197, 238–250. [Google Scholar] [CrossRef]
- Battisti, A.; Roques, A.; Colombari, F.; Frigimelica, G.; Guido, M. Efficient transmission of an introduced pathogen via an ancient insect-fungus association. Sci. Nat. 1999, 86, 479–483. [Google Scholar] [CrossRef]
- Pady, S.M.; Kapica, L. Fungi in air over the Atlantic Ocean. Mycologia 1955, 47, 34–50. [Google Scholar] [CrossRef]
- Gregory, D.W.; Pirie, B.J.S. Wetting agents for biological electron microscopy. J. Microsc. 1973, 99, 267–278. [Google Scholar] [CrossRef]
- Brown, J.K.M.; Hovmøller, M.S. Aerial Dispersal of Pathogens on the Global and Continental Scales and Its Impact on Plant Disease. Science 2002, 297, 537–541. [Google Scholar] [CrossRef]
- Leyronas, C.; Bardin, M.; Berthier, K. Assessing the phenotypic and genotypic diversity of Sclerotinia sclerotiorum in France. Eur. J. Plant Pathol. 2018, 152, 933–944. [Google Scholar] [CrossRef]
- Grinn-Gofroń, A.; Çeter, T.; Pinar, N.M.; Bosiacka, B.; Çeter, S.; Keçeli, T. Air-borne fungal spore load and season timing in the Central and Eastern Black Sea region of Turkey explained by climate conditions and land use. Agric. For. Meteorol. 2020, 295, 108191. [Google Scholar] [CrossRef]
- Gregory, P.; Hirst, J. Possible role of basidiospores as air-borne allergens. Nature 1952, 170, 414. [Google Scholar] [CrossRef]
- Woo, C.; An, C.; Xu, S. Taxonomic diversity of fungi deposited from the atmosphere. ISME J. 2018, 12, 2051–2060. [Google Scholar] [CrossRef]
- Lacey, J.; Crook, B. Fungal and actinomycete spores as pollutants of the workplace and occupational allergens. Ann. Occup. Hyg. 1988, 32, 515–533. [Google Scholar] [CrossRef] [PubMed]
- Sesartic, A.; Dallafior, T.N. Global fungal spore emissions. review and synthesis of literature data. Biogeosciences 2011, 8, 1181–1192. [Google Scholar] [CrossRef]
- Troutt, C.; Levetin, E. Correlation of spring spore concentrations and meteorological conditions in Tulsa. Oklahoma. Int. J. Biometeorol. 2011, 45, 64–74. [Google Scholar] [CrossRef]
- Oliveira, M.; Ribeiro, H.; Delgado, J.L. Seasonal and intradiurnal variation of allergenic fungal spores in urban and rural areas of the North of Portugal. Aerobiologia 2009, 25, 85–98. [Google Scholar] [CrossRef]
- Grinn-Gofron, A.; Bosiacka, B. Effects of meteorological factors on the composition of selected fungal spores in the air. Aerobiologia 2015, 31, 63–72. [Google Scholar] [CrossRef]
- Glikson, M.; Rutherford, S.; Simpson, R.W.; Mitchell, C.A.; Yago, A. Microscopic and submicron components of atmospheric particulate matter during high asthma periods in Brisbane. Queensland. Australia. Atmos. Environ. 1995, 29, 549–562. [Google Scholar] [CrossRef]
- Burch, M.; Levetin, E. Effects of meteorological conditions on spore plumes. Int. J. Biometeorol. 2002, 46, 107–117. [Google Scholar] [CrossRef]
- Banchi, E.; Ametrano, C.G.; Stanković, D.; Verardo, P.; Moretti, O.; Gabrielli, F.; Lazzarin, S.; Borney, M.F.; Tassan, F.; Tretiach, M.; et al. DNA metabarcoding uncovers fungal diversity of mixed airborne samples in Italy. PLoS ONE 2018, 13, e0194489. [Google Scholar] [CrossRef] [PubMed]
- Anees-Hill, S.; Douglas, P.; Pashley, C.H.; Hansell, A.; Marczylo, E.L. A systematic review of outdoor airborne fungal spore seasonality across Europe and the implications for health. Sci. Total Environ. 2021, 818, 151716. [Google Scholar] [CrossRef]
- Kauserud, H.; Lie, M.; Stensrud, Ø.; Ohlson, M. Molecular characterization of airborne fungal spores in boreal forests of contrasting human disturbance. Mycologia 2005, 97, 1215–1224. [Google Scholar] [CrossRef] [PubMed]
- Chen, J.; Leng, L.; Ye, C.; Lu, Q.; Addy, M.; Wang, J.; Liu, J.; Chen, P.; Ruan, R.; Zhou, W. A comparative study between fungal pellet and spore-assisted microalgae harvesting methods for algae bioflocculation. Bioresour. Technol. 2018, 259, 181–190. [Google Scholar] [CrossRef] [PubMed]
- Rather, R.A.; Srinivasan, V.; Anwar, M. Seasonal deviation effects foliar endophyte assemblage and diversity in Asparagus racemosus and Hemidesmus indicus. BMC Ecol. 2018, 18, 52. [Google Scholar] [CrossRef]
- Fröhlich-Nowoisky, J.; Pickersgill, D.A.; Despres, V.R.; Pöschl, U. High diversity of fungi in air particulate matter. Proc. Natl. Acad. Sci. USA 2009, 106, 12814–12819. [Google Scholar] [CrossRef]
- Ianovici, N.; Dumbravă-dodoacă, M.; Filimon, M.N.; Sini-Tean, A. A comparative aeromycological study of the incidence of allergenic spores in outdoor environment. An. Univ. Din Oradea Fasc. Biol. 2011, XVIII, 88–98. Available online: https://bioresearch.ro/2011-1/088-098-AUOFB.18.1.2011%20-%20IANOVICI%20N.%20-%20Dep.Biol.W.U.Tm.Ro.%20-%20A%20comparative%20aeromycological.pdf (accessed on 1 February 2023).
- Pusz, W.; Ogórek, R.; Knapik, R.; Kozak, B.; Bujak, H. The Occurrence of Fungi in the Recently Discovered Jarkowicka Cave in the Karkonosze Mts. (Poland). Geomicrobiol. J. 2015, 32, 59–67. [Google Scholar] [CrossRef]
- Pickersgill, D.A.; Wehking, J.; Paulsen, H.; Thines, E.; Pöschl, U.; Fröhlich-Nowoisky, J.; Després, V.R. Lifestyle dependent occurrence of airborne fungi. Biogeosci. Discuss. 2017. preprint. [Google Scholar] [CrossRef]
- Meredith, D.S. Significance of spore release and dispersal mechanism in plant disease epidemiology. Annu. Rev. Phytopathol. 1973, 11, 313–342. [Google Scholar] [CrossRef]
- Dowd, S.E.; Maier, R.M. Aeromicrobiology. In Environmental Microbiology; Maier, R.M., Pepper, I.L., Gerba, C.P., Eds.; Academic Press: San Diego, CA, USA, 2000; pp. 91–122. [Google Scholar]
- Jędryczka, M. Aeromycology: Studies of fungi in aeroplankton. Folia Biol. 2014, 10, 18–26. [Google Scholar] [CrossRef]
- Calderon, C.; Ward, E.; Freeman, J.; McCartney, A. Detection of airborne fungal spores sampled by rotating-arm and Hirst-type spore traps using polymerase chain reaction assays. J. Aerosol. Sci. 2002, 33, 283–296. [Google Scholar] [CrossRef]
- Strange, R.N.; Scott, P.R. Plant disease: A threat to global food security. Annu. Rev. Phytopathol. 2005, 43, 83–116. [Google Scholar] [CrossRef]
- Ingold, C.T. Spore Liberation; Oxford University Press: London, UK, 1965; 210p. [Google Scholar]
- Alexopoulos, C.J.; Mims, C.W.; Blackwell, M. Introductory Mycology, 4th ed.; John Wiley & Sons Inc.: New York, NY, USA, 1996; 880p. [Google Scholar]
- Schweigkofler, W.; O’Donnell, K.; Garbelotto, M. Detection and quantification of airborne conidia of Fusarium circinatum, the causal agent of pine pitch canker, from two California sites by using a real-time PCR approach combined with a simple spore trapping method. Appl. Environ. Microbiol. 2004, 70, 3512–3520. [Google Scholar] [CrossRef] [PubMed]
- Garbelotto, M.; Smith, T.; Schweigkofler, W. Variation in rates of spore deposition of Fusarium circinatum, the causal agent of pine pitch canker, over a 12-month-period at two locations in Northern California. Phytopathology 2008, 98, 137–143. [Google Scholar] [CrossRef] [PubMed]
- Castaño Soler, C.; Bonet Lledos, J.A.; Oliva Palau, J.; Farré Martinez, G.; Martínez de Aragón, J.; Parladé Izquierdo, X.; Alday, J.G. Rainfall homogenizes while fruiting increases diversity of spore deposition in Mediterranean conditions. Fungal Ecol. 2019, 41, 279–288. [Google Scholar] [CrossRef]
- Ihrmark, K.; Bodeker, I.T.M.; Cruz-Martinez, K.; Friberg, H.; Kubartova, A.; Schenck, J.; Strid, Y.; Stenlid, J.; Brandstrom-Durling, M.; Clemmensen, K.E.; et al. New primers to amplify the fungal ITS2 region–evaluation by 454-sequencing of artificial and natural communities. FEMS Microbiol. Ecol. 2012, 82, 666–677. [Google Scholar] [CrossRef]
- White, T.J.; Bruns, T.; Lee, S.; Taylor, J. Amplification and direct sequencing of fungal ribosomal RNA genes for phylogenetics. In PCR Protocols: A Guide to Methods and Applications; Innis, M.A., Gelfand, D.H., Sninsky, J.J., White, T.J., Eds.; Academic Press: San Diego, CA, USA, 1990; pp. 315–322. [Google Scholar]
- Nguyen, N.H.; Song, Z.; Bates, S.T.; Branco, S.; Tedersoo, L.; Menke, J.; Schilling, J.S.; Kennedy, P.G. FUNGuild: An open annotation tool for parsing fungal community datasets by ecological guild. Fungal Ecol. 2016, 20, 241–248. [Google Scholar] [CrossRef]
- Magurran, A.E. Ecological Diversity and Its Measurement; Princeton University Press: Princeton, NJ, USA, 1988; 192p. [Google Scholar]
- Shannon, C.E. A mathematical theory of communication. Bell Syst. Tech. J. 1948, 27, 379–423. [Google Scholar] [CrossRef]
- Oksanen, J.F.; Blanchet, G.; Friendly, M.; Kindt, R.; Legendre, P.; McGlinn, D.; Wagner, H. Vegan: Community Ecology Package. R Packag. Version 2.5-3, 2018. Available online: https://cran.r-project.org (accessed on 4 February 2023).
- R Core Team. R: A Language and Environment for Statistical Computing. 2020. Available online: https://cran.microsoft.com/snapshot/2014-09-08/web/packages/dplR/vignettes/xdate-dplR.pdf (accessed on 4 February 2023).
- Redondo, M.A.; Berlin, A.; Boberg, J.; Oliva, J. Vegetation type determines spore deposition within a forest–agricultural mosaic landscape. FEMS Microbiol. Ecol. 2020, 96, fiaa082. [Google Scholar] [CrossRef]
- Abdel Hameed, A.A.; Khoder, M.I.; Yuosra, S.; Osman, A.M.; Ghanem, S. Diurnal distribution of airborne bacteria and fungi in the atmosphere of Helwan area. Egypt. Sci. Total Environ. 2009, 407, 6217–6222. [Google Scholar] [CrossRef] [PubMed]
- Nicolaisen, M.; West, J.S.; Sapkota, R.; Canning, G.G.M.; Schoen, C.; Justesen, A.F. Fungal Communities Including Plant Pathogens in Near Surface Air Are Similar across Northwestern Europe. Front. Microbiol. 2017, 8, 1729. [Google Scholar] [CrossRef] [PubMed]
- Abrego, N.; Norros, V.; Halme, P.; Somervuo, P.; Ali-Kovero, H.; Ovaskainen, O. Give me a sample of air and I will tell which species are found from your region: Molecular identification of fungi from airborne spore samples. Mol. Ecol. Resour. 2018, 18, 511–524. [Google Scholar] [CrossRef] [PubMed]
- Talley, S.M.; Coley, P.D.; Kursar, T.A. The effects of weather on fungal abundance and richness among 25 communities in the Intermountain West. BMC Ecol. 2002, 13, 2–7. [Google Scholar] [CrossRef]
- Manstretta, V.; Rossi, V. Effects of Weather Variables on Ascospore Discharge from Fusarium graminearum Perithecia. PLoS ONE 2015, 10, e0138860. [Google Scholar] [CrossRef] [PubMed]
- Inch, S.; Fernando, W.G.D.; Gilbert, J. Seasonal and daily variation in the airborne concentration of Gibberella zeae (Schw.) Petch spores in Manitoba. Can. J. Plant Pathol. 2005, 27, 357–363. [Google Scholar] [CrossRef]
- Küffer, N.; Gillet, F.; Senn-Irlet, B.; Job, D.; Aragno, M. Ecological determinants of fungal diversity on dead wood in European forests. Fungal Divers. 2008, 30, 83–95. Available online: https://hal.archives-ouvertes.fr/hal-00357745 (accessed on 5 February 2023).
- Baber, K.; Otto, P.; Kahl, T.; Gossner, M.M.; Wirth, C.; Gminder, A.; Bässler, C. Disentangling the effects of forest-stand type and dead-wood origin of the early successional stage on the diversity of wood-inhabiting fungi. For. Ecol. Manag. 2016, 377, 161–169. [Google Scholar] [CrossRef]
- Kurtzman, C.P. Discussion of teleomorphic and anamorphic Ascomycetous yeasts and yeast-like taxa. In The Yeasts: A Taxonomic Study, 5th ed.; Kurtzman, C.P., Fell, J.W., Boekhout, T., Eds.; Elsevier: Amsterdam, The Netherlands, 2011; pp. 293–307. [Google Scholar]
- Sugiyama, A.; Shitan, N.; Sato, S.; Nakamura, Y.; Tabata, S.; Yazaki, K. Genome-wide analysis of ATP-binding cassette (ABC) proteins in a model legume plant. Lotus japonicus: Comparison with Arabidopsis ABC protein family. DNA Res. 2006, 13, 205–228. [Google Scholar] [CrossRef]
- Tubaki, K. Studies on the Japanese hyphomycetes. (III) Aquatic group. Bull. Nat. Sci. Mus. 1957, 3, 249–268. [Google Scholar]
- Millberg, H.; Boberg, J.; Stenlid, J. Changes in fungal community of Scots pine (Pinus sylvestris) needles along a latitudinal gradient in Sweden. Fungal Ecol. 2015, 17, 126–139. [Google Scholar] [CrossRef]
- Ridout, M.; Newcombe, G. Sydowia polyspora is both a Foliar Endophyte and a Preemergent Seed Pathogen in Pinus ponderosa. Plant Dis. 2018, 102, 640–644. [Google Scholar] [CrossRef] [PubMed]
- Lazarević, J.; Menkis, A. Cytospora friesii and Sydowia polyspora are associated with the sudden dieback of Abies concolor in Southern Europe. Plant Prot. Sci. 2022, 58, 258–263. [Google Scholar] [CrossRef]
- Talgø, V.; Chastagner, G.; Thomsen, I.M.; Cech, T.; Riley, K.; Lange, K.; Klemsdal, S.S.; Stensvand, A. Sydowia polyspora associated with current season needle necrosis (CSNN) on true fir (Abies spp.). Fungal Biol. 2010, 114, 545–554. [Google Scholar] [CrossRef] [PubMed]
- Terhonen, E.; Marco, T.; Sun, H.; Jalkanen, R.; Kasanen, R.; Vuorinen, M.; Asiegbu, F. The effect of latitude. season and needle-age on the mycota of Scots pine (Pinus sylvestris) in Finland. Silva Fenn. 2011, 45, 104. [Google Scholar] [CrossRef]
- Lygis, V.; Vasiliauskaite, I.; Matelis, A.; Pliūra, A.; Vasaitis, R. Fungi in living and dead stems and stumps of Pinus mugo on coastal dunes of the Baltic Sea. Plant Prot. Sci. 2014, 50, 221–226. [Google Scholar] [CrossRef]
- Muñoz-Adalia, E.J.; Sanz-Ros, A.V.; Flores-Pacheco, J.A.; Hantula, J.; Diez, J.J.; Vainio, E.J.; Fernández, M. Sydowia polyspora Dominates Fungal Communities Carried by Two Tomicus Species in Pine Plantations Threatened by Fusarium circinatum. Forests 2017, 8, 127. [Google Scholar] [CrossRef]
- Nelson, P.E.; Toussoun, T.A.; Cook, R.J. Fusarium: Diseases, Biology, and Taxonomy; Pennsylvania State University Press: University Park, PA, USA, 1981; 560p. [Google Scholar]
- Santori, A.; Vitale, S.; Luongo, L.; Belisario, A. First Report of Fusarium lateritium as the Agent of Nut Gray Necrosis on Hazelnut in Italy. Plant Dis. 2010, 94, 484. [Google Scholar] [CrossRef]
- Vitale, A.; Castello, I.; Cascone, G.; D’Emilio, A.; Mazzarella, R.; Polizzi, G. Reduction of Corky Root Infections on Greenhouse Tomato Crops by Soil Solarization in South Italy. Plant Dis. 2011, 95, 195–201. [Google Scholar] [CrossRef]
- Zhao, Z.Y.; Liu, Y.Y.; Yang, J.H.; Yang, X.L.; Wang, J.H. First report of Fusarium lateritium causing fruit rot of yellow peach (Amygdalus persica) in China. New Dis. Rep. 2019, 39, 6. [Google Scholar] [CrossRef]
- Cambaza, E. Comprehensive Description of Fusarium graminearum Pigments and Related Compounds. Foods 2018, 7, 165. [Google Scholar] [CrossRef]
- Duan, Y.; Tao, X.; Zhao, H.; Xiao, X.; Li, M.; Wang, J.; Zhou, M. Activity of Demethylation Inhibitor Fungicide Metconazole on Chinese Fusarium graminearum Species Complex and Its Application in Carbendazim-Resistance Management of Fusarium Head Blight in Wheat. Plant Dis. 2019, 103, 929–937. [Google Scholar] [CrossRef]
- Braun, U. A Monograph of the Erysiphales (Powdery Mildews); Beiheft zur Nova Hedwigia: Köthen, German Democratic Republic, 1987; 700p. [Google Scholar]
- Bélanger, R.R.; Bushnell, W.R.; Dik, A.J.; Carver, T.L.W. The Powdery Mildews: A Comprehensive Treatise; American Phytopatholgical Society Press: St. Paul, MN, USA, 2002; 292p. [Google Scholar]
- Brewer, M.T.; Turner, A.N.; Brannen, P.M.; Cline, W.O.; Richardson, E.A. Exobasidium maculosum. a new species causing leaf and fruit spots on blueberry in the southeastern USA and its relationship with other Exobasidium spp. parasitic to blueberry and cranberry. Mycologia 2014, 106, 415–423. [Google Scholar] [CrossRef] [PubMed]
- Nevalainen, S. Spatial and temporal variation in the occurrence of Gremmeniella abietina in Scots pine in Finland. Acta Silv. Et Lignaria Hung Spec Edition. 2007, 127–136. [Google Scholar]
- Botella, L.; Tuomivirta, T.T.; Hantula, J.; Diez, J.J.; Jankovsky, L. The European race of Gremmeniella abietina hosts a single species of Gammapartitivirus showing a global distribution and possible recombinant events in its history. Fungal Biol. 2015, 119, 125–135. [Google Scholar] [CrossRef] [PubMed]
- Botella, L.; Hantula, J. Description, Distribution, and Relevance of Viruses of the Forest Pathogen Gremmeniella abietina. Viruses 2018, 10, 654. [Google Scholar] [CrossRef]
- Laflamme, G.; Archambault, L. Evaluation of microclimatic factors affecting ascospore release of Gremmeniella abietina var balsamea. Can. J. Plant Pathol. 1990, 12, 190–194. [Google Scholar] [CrossRef]
- Petäistö, R.L.; Heinonen, J. Conidial dispersal of Gremmeniella abietina: Climatic and microclimatic factors. For. Pathol. 2003, 33, 363–373. [Google Scholar] [CrossRef]
- Gáper, J.; Pristaš, P.; Gáperová, S.; Maliničová, L. Molecular identification of Fomes fomentarius in hosts from urban and suburban areas in Slovakia. Folia Oecologica 2013, 40, 22–27. Available online: https://ife.sk/wp-content/uploads/2016/10/Gaper.pdf (accessed on 7 February 2023).
- Łakomy, P.; Werner, A. Distribution of Heterobasidion annosum intersterility groups in Poland. For. Pathol. 2003, 33, 105–112. [Google Scholar] [CrossRef]
- Madsen, C.L.; Kosawang, C.; Thomsen, I.M.; Hansen, L.N.; Nielsen, L.R.; Kjaer, E.D. Combined progress in symptoms caused by Hymenoscyphus fraxineus and Armillaria species. and corresponding mortality in young and old ash trees. For. Ecol. Manag. 2021, 491, 119177. [Google Scholar] [CrossRef]
- Barnes, I.; Van der Nest, A.; Mullett, M.S.; Crous, P.W.; Drenkhan, R.; Musolin, D.L.; Wingfield, M.J. Neotypification of Dothistroma septosporum and epitypification of D. pini causal agents of Dothistroma needle blight of pine. For. Pathol. 2016, 46, 388–407. [Google Scholar] [CrossRef]
- Chandelier, A.; Hulin, J.; San Martin, G.; Debode, F.; Massart, S. Comparison of qPCR and Metabarcoding Methods as Tools for the Detection of Airborne Inoculum of Forest Fungal Pathogens. Phytopathology 2021, 111, 570–581. [Google Scholar] [CrossRef] [PubMed]
- Sarda-Estève, R.; Baisnée, D.; Guinot, B.; Sodeau, J.; O’Connor, D.; Belmonte, J.; Besancenot, J.-P.; Petit, J.-E.; Thibaudon, M.; Oliver, G.; et al. Variability and Geographical Origin of Five Years Airborne Fungal Spore Concentrations Measured at Saclay, France from 2014 to 2018. Remote Sens. 2019, 11, 1671. [Google Scholar] [CrossRef]


| 2017 | 2018 | |||||||||||||
|---|---|---|---|---|---|---|---|---|---|---|---|---|---|---|
| IX | X | XI | XII | I | II | III | IV | V | VI | VII | VIII | Avg./Total | ||
| Labanoras | Temperature. °C | 13.2 | 6.9 | 3.5 | 0.9 | −1.9 | −6.9 | −2.4 | 5.2 | 15.7 | 16.7 | 19.7 | 18.6 | 6.8 |
| Precipitation, mm | 76 | 87 | 54 | 55 | 60 | 19 | 24 | 32 | 38 | 29 | 76 | 60 | 610 | |
| No. of sequences | 13,016 | 21,939 | 11,160 | 10,897 | 11,757 | 7123 | 11,504 | 13,890 | 13,219 | 12,427 | 4020 | 12,805 | 143,757 | |
| No. of fungal taxa | 55 | 106 | 68 | 75 | 143 | 60 | 132 | 69 | 123 | 107 | 96 | 149 | 532 | |
| H-diversity | 2.39 | 2.90 | 2.57 | 2.49 | 2.89 | 2.30 | 2.63 | 2.50 | 2.69 | 3.23 | 3.04 | 3.40 | 3.64 | |
| Dubrava | Temperature. °C | 13.4 | 7.6 | 3.9 | 1.1 | −1.6 | −5.8 | −1.8 | 5.6 | 17.3 | 17.5 | 20.2 | 19.1 | 7.4 |
| Precipitation, mm | 87 | 111 | 45 | 74 | 58 | 24 | 23 | 36 | 18 | 58 | 138 | 66 | 737 | |
| No. of sequences | 11,139 | 8976 | 15,279 | 7127 | 7574 | 6575 | 3103 | 8805 | 8785 | 7864 | 8499 | 4257 | 97,983 | |
| No. of fungal taxa | 38 | 19 | 27 | 28 | 53 | 32 | 16 | 43 | 32 | 34 | 29 | 25 | 183 | |
| H-diversity | 2.82 | 2.21 | 2.57 | 2.39 | 2.85 | 2.50 | 1.79 | 2.73 | 2.33 | 2.44 | 2.32 | 2.41 | 3.49 | |
| Lenkimai | Temperature. °C | 12.7 | 7.1 | 4.0 | 1.6 | −1.0 | −6.2 | −2.1 | 5.4 | 16.2 | 16.3 | 20.3 | 18.5 | 7.1 |
| Precipitation, mm | 145 | 97 | 87 | 71 | 47 | 15 | 16 | 48 | 22 | 24 | 78 | 60 | 710 | |
| No. of sequences | 4108 | 5854 | 5572 | 1772 | 5189 | 2216 | 487 | 3822 | 2218 | - | 3339 | 6689 | 41,266 | |
| No. of fungal taxa | 132 | 187 | 49 | 81 | 33 | 5 | 2 | 81 | 32 | - | 35 | 116 | 411 | |
| H-diversity | 3.28 | 3.51 | 2.47 | 2.33 | 2.75 | 1.16 | 0.01 | 2.66 | 2.20 | - | 1.22 | 2.83 | 3.65 | |
| 2017 | 2018 | ||||||||||||||||
|---|---|---|---|---|---|---|---|---|---|---|---|---|---|---|---|---|---|
| Phylum | Fungal Taxa | Genbank Reference | Compared, bp/Similarity, % | IX | X | XI | XII | I | II | III | IV | V | VI | VII | VIII | All | |
| Labanoras | Basidiomycota | Hannaella coprosmae | KY460840 | 217/218 (99) | 21.98 | 17.44 | 23.19 | 22.16 | 35.03 | 38.76 | 16.57 | 24.15 | 32.35 | 15.12 | 11.19 | 23.09 | 23.23 |
| Basidiomycota | Leucosporidium drummii | MK679580 | 234/234 (100) | 3.09 | 10.86 | 0.58 | 0.73 | 6.61 | 15.09 | 22.51 | 11.32 | 7.94 | 0.47 | 25.52 | 8.62 | 8.47 | |
| Ascomycota | Epicoccum nigrum | MH102081 | 249/249 (100) | 0.65 | 0.33 | 0.72 | 20.26 | 1.54 | 5.88 | 6.48 | 10.32 | 7.88 | 6.22 | 14.25 | 2.61 | 5.53 | |
| Ascomycota | Protomyces inouyei | KX067824 | 261/261 (100) | 0.63 | 0.16 | 8.06 | 2.01 | 0.70 | - | 1.39 | 20.03 | 11.93 | 9.25 | - | 1.38 | 4.98 | |
| Ascomycota | Cladosporium macrocarpum | MK690548 | 243/243 (100) | 2.64 | 5.28 | 7.10 | 0.01 | 3.73 | 3.24 | 4.59 | 3.70 | 10.38 | 1.76 | 5.70 | 4.80 | 4.48 | |
| Basidiomycota | Vishniacozyma dimennae | KY105820 | 247/247 (100) | - | 3.88 | 5.55 | 13.35 | 3.21 | - | 0.02 | 4.59 | 4.06 | 2.23 | 0.17 | 0.09 | 3.32 | |
| Ascomycota | Candida parapsilosis | MK638869 | 218/218 (100) | 29.47 | - | - | - | - | - | - | - | - | - | - | - | 2.67 | |
| Ascomycota | Aureobasidium pullulans | MK686043 | 249/249 (100) | 0.17 | - | 0.46 | 0.37 | 0.07 | 1.63 | 18.28 | 1.81 | 0.53 | 0.13 | 0.80 | 6.18 | 2.44 | |
| Ascomycota | Unidentified sp. 4258_20 | MG827923 | 243/243 (100) | - | 11.71 | 7.61 | - | - | - | - | - | - | - | - | - | 2.38 | |
| Basidiomycota | Unidentified sp. 4258_1 | MH451188 | 369/369 (100) | 5.85 | 1.40 | 0.91 | 1.70 | 3.11 | 3.44 | 0.79 | 0.75 | 0.39 | 3.54 | 0.97 | 5.22 | 2.34 | |
| Total Labanoras | 64.47 | 51.05 | 54.18 | 60.59 | 53.99 | 68.05 | 70.63 | 76.69 | 75.46 | 38.73 | 58.61 | 52.00 | 59.83 | ||||
| Dubrava | Ascomycota | Cladosporium macrocarpum | MK690548 | 243/243 (100) | 10.63 | 8.69 | 11.58 | 21.24 | 6.89 | 28.17 | - | 11.22 | 30.86 | 8.95 | 30.80 | 24.83 | 16.02 |
| Ascomycota | Penicillium chrysogenum | MK696383 | 258/258 (100) | 1.18 | 31.47 | 9.50 | 7.90 | 17.53 | 5.63 | 2.06 | 4.52 | 17.19 | 15.41 | 7.09 | 4.77 | 10.88 | |
| Basidiomycota | Unidentified sp. 4258_1 | MH451188 | 369/369 (100) | 12.90 | 11.82 | 9.78 | 13.23 | 13.97 | 13.72 | 22.24 | 3.98 | 2.98 | 9.30 | 9.70 | 17.62 | 10.72 | |
| Basidiomycota | Unidentified sp. 4258_7 | KX222221 | 302/302 (100) | 0.66 | 11.33 | 5.88 | 4.42 | 4.96 | 2.56 | 45.38 | 14.21 | 3.63 | 2.81 | 8.31 | 4.72 | 7.10 | |
| Ascomycota | Debaryomyces hansenii | MH595408 | 288/288 (100) | 3.01 | 15.14 | 16.47 | - | - | 2.27 | - | 0.86 | 0.18 | 0.78 | 2.06 | - | 4.78 | |
| Basidiomycota | Leucosporidium drummii | MK679580 | 234/234 (100) | - | - | 14.71 | 7.82 | 10.42 | - | - | 6.73 | 1.79 | - | - | - | 4.43 | |
| Basidiomycota | Hannaella coprosmae | KY460840 | 217/218 (99) | - | - | 3.73 | 1.25 | - | 4.78 | - | 1.83 | - | 16.15 | 20.65 | 0.23 | 4.25 | |
| Basidiomycota | Malassezia sympodialis | LT671825 | 327/327 (100) | 1.21 | 3.35 | 0.19 | 3.23 | 4.61 | 1.02 | 13.57 | 2.40 | 0.57 | 1.59 | 4.28 | 4.70 | 2.53 | |
| Ascomycota | Alternaria alternata | MH892844 | 253/253 (100) | 15.17 | - | 3.12 | - | - | - | - | 1.42 | 0.17 | - | 0.14 | - | 2.37 | |
| Ascomycota | Epicoccum nigrum | MH102081 | 249/249 (100) | 2.78 | - | 2.05 | 1.70 | 3.54 | 5.25 | - | - | 0.24 | 4.92 | - | 12.99 | 2.37 | |
| Total Dubrava | 47.54 | 81.81 | 77.02 | 60.78 | 61.92 | 63.38 | 83.24 | 47.17 | 57.61 | 59.91 | 83.03 | 69.86 | 65.45 | ||||
| Lenkimai | Basidiomycota | Hannaella coprosmae | KY460840 | 217/218 (99) | 4.58 | 25.67 | 40.08 | 37.02 | 6.92 | 15.12 | - | 32.08 | 20.83 | 48.55 | 21.51 | 24.29 | |
| Ascomycota | Unidentified sp. 4258_8 | MG827641 | 244/244 (100) | - | 0.12 | 3.54 | 9.88 | 4.41 | 33.75 | - | 1.65 | 1.13 | 38.78 | 15.94 | 9.22 | ||
| Ascomycota | Epicoccum nigrum | MH102081 | 249/249 (100) | 2.22 | 3.91 | 1.04 | 1.19 | 14.72 | 46.44 | - | - | 1.40 | 0.27 | 1.91 | 5.72 | ||
| Ascomycota | Protomyces inouyei | KX067824 | 261/261 (100) | - | 1.83 | 9.92 | 22.74 | 11.51 | - | - | 0.86 | 0.14 | 0.24 | 1.49 | 4.37 | ||
| Basidiomycota | Leucosporidium drummii | MK679580 | 234/234 (100) | 7.08 | 8.76 | - | 1.02 | - | - | - | 15.67 | - | 1.26 | 4.05 | 4.20 | ||
| Ascomycota | Candida palmioleophila | KC111442 | 288/288 (100) | 0.07 | - | 3.30 | - | 16.34 | - | - | 6.10 | 1.22 | - | - | 3.14 | ||
| Ascomycota | Cladosporium macrocarpum | MK690548 | 243/243 (100) | 2.68 | 1.35 | 1.17 | 3.50 | 1.08 | - | 0.21 | 0.13 | 0.99 | 2.40 | 11.94 | 3.10 | ||
| Basidiomycota | Unidentified sp. 4258_29 | MG827488 | 289/295 (98) | 0.29 | 0.26 | 1.44 | 0.34 | - | 0.14 | - | - | - | 6.23 | 10.72 | 2.52 | ||
| Ascomycota | Penicillium chrysogenum | MK696383 | 258/258 (100) | - | - | 0.09 | - | 7.65 | - | - | 7.51 | 2.84 | - | 2.08 | 2.16 | ||
| Basidiomycota | Unidentified sp. 4258_1 | MH451188 | 369/369 (100) | 0.56 | 5.40 | 3.50 | 1.19 | 4.10 | - | - | 0.03 | 0.14 | - | 0.22 | 1.91 | ||
| Total Lenkimai | 17.48 | 47.30 | 64.07 | 76.86 | 66.74 | 95.44 | 0.21 | 64.02 | 28.67 | - | 97.72 | 69.88 | 60.63 | ||||
| 2017 | 2018 | ||||||||||||||||
|---|---|---|---|---|---|---|---|---|---|---|---|---|---|---|---|---|---|
| Phylum | Fungal Taxa | Genbank Reference | Compared, bp/Similarity, % | IX | X | XI | XII | I | II | III | IV | V | VI | VII | VIII | All | |
| Labanoras | Ascomycota | Protomyces inouyei | KX067824 | 261/261 (100) | 0.63 | 0.16 | 8.06 | 2.01 | 0.70 | - | 1.39 | 20.03 | 11.93 | 9.25 | - | 1.38 | 4.98 |
| Ascomycota | Sydowia polyspora | MG888613 | 256/256 (100) | 4.74 | 0.01 | 0.24 | 0.24 | 0.04 | 12.72 | 7.86 | 1.32 | 2.94 | - | 0.97 | 1.36 | 2.28 | |
| Ascomycota | Ramularia coleosporii | MH974744 | 237/237 (100) | 1.10 | 1.22 | 20.56 | 0.34 | 1.91 | 0.11 | 0.12 | 0.71 | 0.10 | 0.39 | - | 0.41 | 2.23 | |
| Ascomycota | Oculimacula acuformis | MH861289 | 241/242 (99) | - | 13.70 | - | - | 0.01 | - | 0.01 | - | - | 0.01 | - | - | 2.09 | |
| Ascomycota | Fusarium lateritium | MK633904 | 258/258 (100) | 1.82 | 0.62 | 2.15 | 1.62 | 0.10 | - | 2.67 | 1.01 | 0.04 | 5.65 | 0.70 | 0.57 | 1.43 | |
| Ascomycota | Fusarium graminearum | MK212898 | 245/245 (100) | - | - | 0.12 | 0.67 | - | - | - | 0.60 | - | 3.15 | 1.17 | 0.15 | 0.44 | |
| Basidiomycota | Fomes fomentarius | MF563980 | 286/286 (100) | - | 1.73 | - | - | - | - | - | - | - | - | - | - | 0.26 | |
| Ascomycota | Gremmeniella abietina | MH857809 | 237/237 (100) | - | - | - | - | - | - | 0.36 | 2.15 | 0.14 | - | 0.02 | - | 0.25 | |
| Basidiomycota | Resinicium bicolor | MF511087 | 291/291 (100) | 0.05 | 0.57 | - | - | 1.90 | - | - | - | - | - | - | - | 0.25 | |
| Basidiomycota | Piptoporus betulinus | MH856908 | 296/296 (100) | 2.35 | - | - | - | - | - | - | - | - | - | - | - | 0.21 | |
| Ascomycota | Lophodermium pinastri | MH856647 | 239/239 (100) | - | 0.77 | 0.01 | 0.15 | 0.03 | 0.29 | 0.01 | - | 0.24 | - | 0.07 | 0.21 | 0.19 | |
| Total Labanoras | 10.69 | 18.78 | 31.14 | 5.03 | 4.68 | 13.13 | 12.41 | 25.82 | 15.39 | 18.45 | 2.94 | 4.08 | 14.61 | ||||
| Dubrava | Ascomycota | Erysiphe heraclei | MK571420 | 274/274 (100) | - | - | 2.26 | - | - | - | - | - | - | - | - | 4.30 | 0.54 |
| Ascomycota | Fusarium sacchari | MK713417 | 246/246 (100) | - | - | - | 5.81 | - | - | - | - | - | - | - | - | 0.42 | |
| Basidiomycota | Stereum sanguinolentum | MH071730 | 294/294 (100) | - | - | - | - | - | 5.02 | - | - | - | - | - | - | 0.34 | |
| Ascomycota | Protomyces inouyei | KX067824 | 261/261 (100) | - | - | - | - | - | - | - | 1.53 | - | - | - | - | 0.14 | |
| Ascomycota | Fusarium lateritium | MK633904 | 258/258 (100) | - | - | - | - | 0.83 | - | - | - | - | - | - | - | 0.06 | |
| Basidiomycota | Chondrostereum purpureum | MK788300 | 308/308 (100) | - | - | - | - | - | - | - | - | 0.67 | - | - | - | 0.06 | |
| Ascomycota | Ramularia coleosporii | MH974744 | 237/237 (100) | 0.01 | - | - | - | 0.11 | - | - | - | - | - | - | - | 0.01 | |
| Ascomycota | Plectosphaerella cucumerina | MK079567 | 263/263 (100) | - | - | - | - | 0.09 | - | - | - | - | - | - | - | 0.01 | |
| Ascomycota | Botrytis cinerea | MH346332 | 240/240 (100) | - | - | - | - | - | - | - | - | 0.05 | - | - | - | 0.004 | |
| Basidiomycota | Ganoderma adspersum | MN945139 | 293/293 (100) | - | - | - | - | - | - | - | 0.05 | - | - | - | - | 0.004 | |
| Total Dubrava | 0.01 | - | 2.26 | 5.81 | 1.03 | 5.02 | - | 1.58 | 0.72 | - | - | 4.30 | 1.58 | ||||
| Lenkimai | Ascomycota | Protomyces inouyei | KX067824 | 261/261 (100) | - | 1.83 | 9.92 | 22.74 | 11.51 | - | - | 0.86 | 0.14 | - | 0.24 | 1.49 | 4.37 |
| Ascomycota | Sydowia polyspora | MG888613 | 256/256 (100) | 4.92 | 0.43 | - | - | 1.77 | - | - | 0.16 | 6.18 | - | 0.06 | 1.05 | 1.29 | |
| Ascomycota | Fusarium lateritium | MK633904 | 258/258 (100) | 0.44 | 2.60 | - | 0.11 | - | - | - | - | - | - | 0.09 | 4.16 | 1.10 | |
| Ascomycota | Ramularia coleosporii | MH974744 | 237/237 (100) | 4.80 | 3.14 | - | 0.06 | - | - | - | - | - | - | 0.24 | 0.09 | 0.96 | |
| Ascomycota | Lophodermium pinastri | MH856647 | 239/239 (100) | 0.19 | 0.03 | 3.46 | 1.81 | 0.17 | - | - | 0.03 | - | - | - | - | 0.59 | |
| Ascomycota | Pyrenophora tritici-repentis | AM887511 | 253/254 (99) | - | - | - | - | - | - | - | 1.94 | - | - | - | - | 0.18 | |
| Ascomycota | Botrytis cinerea | MH346332 | 240/240 (100) | - | 0.29 | - | - | - | - | - | 1.28 | - | - | - | - | 0.16 | |
| Ascomycota | Taphrina nana | MH857501 | 293/293 (100) | - | 0.84 | - | - | - | - | - | - | - | - | - | - | 0.12 | |
| Ascomycota | Heterotruncatella spartii | MK012418 | 245/245 (100) | 0.66 | 0.26 | - | 0.11 | - | - | - | - | - | - | - | - | 0.11 | |
| Basidiomycota | Exobasidium maculosum | KR262418 | 288/288 (100) | - | 0.68 | - | 0.06 | - | - | - | - | - | - | - | - | 0.10 | |
| Total Lenkimai | 11.00 | 10.10 | 13.39 | 24.89 | 13.45 | - | - | 4.26 | 6.31 | - | 0.63 | 6.79 | 8.98 | ||||
Disclaimer/Publisher’s Note: The statements, opinions and data contained in all publications are solely those of the individual author(s) and contributor(s) and not of MDPI and/or the editor(s). MDPI and/or the editor(s) disclaim responsibility for any injury to people or property resulting from any ideas, methods, instructions or products referred to in the content. |
© 2023 by the authors. Licensee MDPI, Basel, Switzerland. This article is an open access article distributed under the terms and conditions of the Creative Commons Attribution (CC BY) license (https://creativecommons.org/licenses/by/4.0/).
Share and Cite
Marčiulynas, A.; Lynikienė, J.; Marčiulynienė, D.; Gedminas, A.; Menkis, A. Seasonal and Site-Specific Patterns of Airborne Fungal Diversity Revealed Using Passive Spore Traps and High-Throughput DNA Sequencing. Diversity 2023, 15, 539. https://doi.org/10.3390/d15040539
Marčiulynas A, Lynikienė J, Marčiulynienė D, Gedminas A, Menkis A. Seasonal and Site-Specific Patterns of Airborne Fungal Diversity Revealed Using Passive Spore Traps and High-Throughput DNA Sequencing. Diversity. 2023; 15(4):539. https://doi.org/10.3390/d15040539
Chicago/Turabian StyleMarčiulynas, Adas, Jūratė Lynikienė, Diana Marčiulynienė, Artūras Gedminas, and Audrius Menkis. 2023. "Seasonal and Site-Specific Patterns of Airborne Fungal Diversity Revealed Using Passive Spore Traps and High-Throughput DNA Sequencing" Diversity 15, no. 4: 539. https://doi.org/10.3390/d15040539
APA StyleMarčiulynas, A., Lynikienė, J., Marčiulynienė, D., Gedminas, A., & Menkis, A. (2023). Seasonal and Site-Specific Patterns of Airborne Fungal Diversity Revealed Using Passive Spore Traps and High-Throughput DNA Sequencing. Diversity, 15(4), 539. https://doi.org/10.3390/d15040539