Article

Insights into the Gut Microbiota of the Freshwater Crab Sinopotamon planum across Three Seasons and Its Associations with the Surrounding Aquatic Microbiota

Jiangsu Key Laboratory for Biodiversity and Biotechnology, College of Life Sciences, Nanjing Normal University, Nanjing 210023, China
*
Author to whom correspondence should be addressed.
Diversity 2023, 15(4), 519; https://doi.org/10.3390/d15040519
Submission received: 7 March 2023 / Revised: 28 March 2023 / Accepted: 1 April 2023 / Published: 3 April 2023
(This article belongs to the Special Issue Freshwater Zoobenthos Biodiversity, Evolution and Ecology)

Abstract

:
Gut microbiota is closely related to the health of the host and its adaptation to environmental changes. Sinopotamon planum is a species of freshwater crab that lives in the water for three seasons and plays a key role in freshwater ecosystems as a benthic macroinvertebrate, an important indicator of aquatic ecological health. In this study, we sequenced 60 gut microbial samples of S. planum and nine microbial samples from the surrounding water in spring, summer, and autumn based on the 16S rRNA gene. The results showed that gut microbiota had the highest alpha diversity in summer, which may be related to increased adaptability in summer. Firmicutes, Proteobacteria, and Bacteroidota were the most dominant phyla of gut microbiota across three seasons, with Candidatus Hepatoplasma and Candidatus Bacilloplasma being the main genera. These main phyla and genera may be key to maintaining a stable function of the intestinal environment. Firmicutes was the phylum with the highest relative abundance, which is probably related to the carnivorous behaviour of S. planum. The abundant C. Hepatoplasma may be related to the starvation of S. planum in the wild. In both gut and water microbiota, beta diversity analyses showed significant differences across seasons. Comparative analysis of gut microbes and surrounding water microbes showed significant differences in microbial diversity and composition between gut and surrounding water. In conclusion, the structure of the gut microbial community of S. planum differed significantly between the studied seasons, but the water microbial community around S. planum was less variable and significantly different from the gut microbes. The seasonal differences in gut microbes are more likely the result of self-internal adaptation to changes in water temperature and food resources between seasons.

1. Introduction

The gut microbiota is the complex community of microorganisms that live in the digestive tract of metazoan, from invertebrates to vertebrates [1,2], playing important roles throughout the life cycle [3]. The gut microbiota in animals is interdependent and mutually constrained with their hosts [4]. Through long-term co-evolution, they constitute a specific intestinal micro-ecosystem with their hosts and participate in important physiological processes such as substance synthesis, metabolism, development, immunity, etc., [5,6,7].
Gut microbial communities are formed by a combination of the physiological characteristics of the host and external environmental factors [8]. The diversity of the gut microbiota is determined by the phylogenetic status and the host’s dietary preferences due to the long period of co-evolution with the host [9,10]. Several external factors can also cause changes in the microbial composition of the animal’s gut, including environmental temperature, food resources, salinity, etc., [11,12,13]. Seasonal changes can also cause gut microbiota variations due to fluctuations in external factors, as evidenced in studies on various species [14,15,16].
The research work on animal gut microbiota has gone through the initial in vitro culture and gradually developed into non-culture DNA molecular techniques [17,18], which have accelerated the progress of gut microbiota research. With the wide application of high-throughput sequencing technology, 16S rRNA gene sequencing has been developed as a reliable tool for gut microbial identification as well as diversity analysis [19,20]. Nowadays, with the development of metagenomic technology, the understanding of gut microbiota is not only limited to community structure but also linked to its function [21,22].
In Decapod, studies on gut microbes have focused on several commercially valuable marine crabs and shrimps [23,24], while other species, such as freshwater crabs, have been neglected. The China endemic freshwater crab Sinopotamon planum [25] has a wide distribution range in eastern China, inhabiting a variety of aquatic ecosystems, such as lakes, rivers, and hill streams. Typically, like most freshwater crabs in China, S. planum lives in the water during spring, summer, and autumn. In spring, as the water warms up, S. planum awakens from its dormancy and enters the water to feed; in summer, when the water is warmer, S. planum reaches its peak growing season and reproduces; and in autumn, S. planum remains active and feeds around to accumulate nutrients. When winter arrives, as the water temperature decreases, S. planum leaves the water and goes into dormancy by digging burrows on the shore, away from the water [26]. The water environment as the main living space for S. planum is more dynamic and spatially heterogeneous than terrestrial ecosystems [27]. In response to variable environments and food sources, aquatic organisms generally have more diverse and complex gut microbiota [28]. In addition, S. planum is a freshwater benthic macroinvertebrate that plays an important role in maintaining the functional integrity of freshwater ecosystems and indicating the health status of water quality, which is of great ecological value [29,30,31]. The study of gut microbes in S. planum will help us to understand the diversity and composition of the microbial community, and thus delve deeper into the relationship between S. planum and the aquatic ecosystem, and the potential for pathogen carriage. In this study, microbial diversity and community structure in the gut of S. planum and water were explored by high-throughput sequencing to understand the seasonal changes in the gut microbial community and the association with the external environmental microbes when S. planum lives in the water.

2. Materials and Methods

2.1. Samples Collection

All samples of Sinopotamon planum were wild and collected from Longdu Lake (30.4239° N, 120.3409° E) in Jiaxing City, Zhejiang Province, China (Figure 1). Spring samples were collected in May 2021 (average water temperature: 24 °C), summer samples in August 2022 (average water temperature: 33 °C), and autumn samples in November 2021 (average water temperature: 14 °C). The water temperature was measured by a handheld water quality tester (Model: AZ86031). All crab samples for each season were collected from the same area on a sunny day. All samples of crabs used to extract gut microbes were healthy and active adults (carapace width: 27.20–34.12 mm; carapace length: 23.71–28.75 mm) and the sex ratio was male: female = 3:1. Samplings of gut microorganisms from crabs were carried out on the day of collection and the crabs were not fed before sampling. The abdomen of the crab was first cleaned using 75% alcohol and then the intestinal contents were collected from the hindgut of the crab in a sterile environment using clean scissors and forceps. The intestinal contents from three individuals were mixed into a pooled gut sample (referred to as “gut sample” in the following).
Environmental water samples were collected from the same place as the crab samples simultaneously, and water samples were collected using sterile water collection bags when the water was stable. Microbiological samples of the water (water samples) were obtained by filtering 500 mL of environmental water through a 0.22 μm pore size filter membrane. A total of 20 gut samples and three water samples were taken per season, and stored at −80 °C until DNA extraction. The dissected crab samples were preserved in 95% ethanol and deposited in the Jiangsu Key Laboratory for Biodiversity and Biotechnology, College of Life Sciences, Nanjing Normal University, China.

2.2. DNA Extraction and Sequencing

The E.Z.N.A. Soil DNA Kit (Omega Bio-Tek, Norcross, GA, USA) was used to extract total microbial DNA from the gut and water samples, following the manufacturer’s instructions. PCR amplification of high variant region V3–V4 of bacterial 16S rRNA gene was performed using paired primers 338F (5′-ACTCCTACGGGAGGCAGCAG-3′) and 806R (5′-GGACTACHVGGGTWTCTAAT-3′) according to the following steps: first initial denaturation at 95 °C for 3 min, followed by 30 cycles in three steps, denaturation at 95 °C for 30 s, annealing at 55 °C for 30 s, extension at 72 °C for 45 s, and final extension at 72 °C for 10 min, ending at 4 °C and storage. The purified PCR products were sent to Majorbio Bio-Pharm Technology Co., Ltd. (Shanghai, China) for paired-end high-throughput sequencing on the Illumina MiSeq PE300 platform (San Diego, CA, USA). The raw reads were deposited in the National Center for Biotechnology Information (NCBI) Sequence Read Archive database (accession number: SRR22389362–22389430).

2.3. Statistical Analysis

The raw data were quality-controlled using fastp v0.19.6 [32] and merged using Flash v1.2.11 [33]. The sequences were clustered into operational taxonomic units (OTUs) using UPARSE v11 at a 97% similarity [34], excluding chimeras and annotated mitochondrial sequences. To minimize the effects of sequencing depth on alpha and beta diversity measurements, the number of 16S rRNA gene sequences from each sample was rarefied to 20,000. The OTU species taxonomy was annotated using the RDP Classifier v11.5 against the Silva 16S rRNA gene database [35,36], with a confidence threshold of 70%, and the community composition of each sample was counted at different taxonomic levels.
All samples were divided into two main groups: Gut-group (including all gut samples) and Env-group (including all water samples), and on this basis, the Gut-group was further divided into three sub-groups: SprGut-group (20 gut samples from spring), SumGut-group (20 gut samples from summer), and AutGut-group (20 gut samples from autumn). The Env-group was also further divided into three sub-groups: SprEnv-group (three water samples from spring), SumEnv-group (three water samples from summer), and AutEnv-group (three water samples from autumn). The statistical analysis of the data was performed based on the MajorbioCloud platform (https://cloud.majorbio.com, accessed on 3 March 2023). Alpha diversity indexes (Richness indexes: Ace and Chao1; Diversity indexes: Simpson and Shannon) were calculated using Mothur v1.30.2 [37], and the Wilcoxon rank sum test was used for intergroup variance analysis. Beta diversity distance calculation and analysis of similarity (ANOSIM) based on 999 permutations were performed using Qiime v1.9.1 [38], followed by principal coordinates analysis (PCoA) and non-metric multidimensional scaling analysis (NMDS) based on Bray–Curtis and unweighted–UniFrac distances and graphical visualization using the vegan and ggplot2 packages in R v4.0.5 [39,40,41]. Kruskal–Wallis H tests were performed using the stats package in R v4.0.5 to obtain significantly different species between groups. Linear discriminant analysis Effect Size (LEfSe) performed linear discriminant analysis (LDA) on samples according to different grouping conditions based on taxonomic composition to identify groups or species that produced significantly different effects [42]. Functional abundances were counted and plotted against the evolutionary genealogy of genes, the Non-supervised Orthologous Groups (EggNOG) database, and the Kyoto Encyclopedia of Genes and Genomes (KEGG) database, using PICRUSTt [43]. Venn diagrams, histograms, and heat maps were plotted in R v4.0.5.

3. Results

3.1. Sequencing Data and Alpha Diversity Indexes

After quality filtering and merging, a total of 3,931,718 clean sequences of 16S rRNA gene (mean length = 425 bp) were obtained from 60 gut and nine water samples. The number of clean sequences for each sample was between 30,447 and 103,268 (mean = 56,981) (Table S1). The Good’s coverage estimates of 69 samples ranged from 97.67% to 99.71% (Table S2). Sinopotamon planum yielded 4557 valid OTUs at a 97% identity. OTUs were assigned to 51 phyla, 136 classes, 326 orders, 577 families, 1262 genera, and 2371 species. The rarefaction curves of the Chao1 and Shannon indexes were flat for all samples, indicating that the amount of sequencing data was large enough to reflect the majority of microbial diversity information in the samples for subsequent analysis (Figure S1).
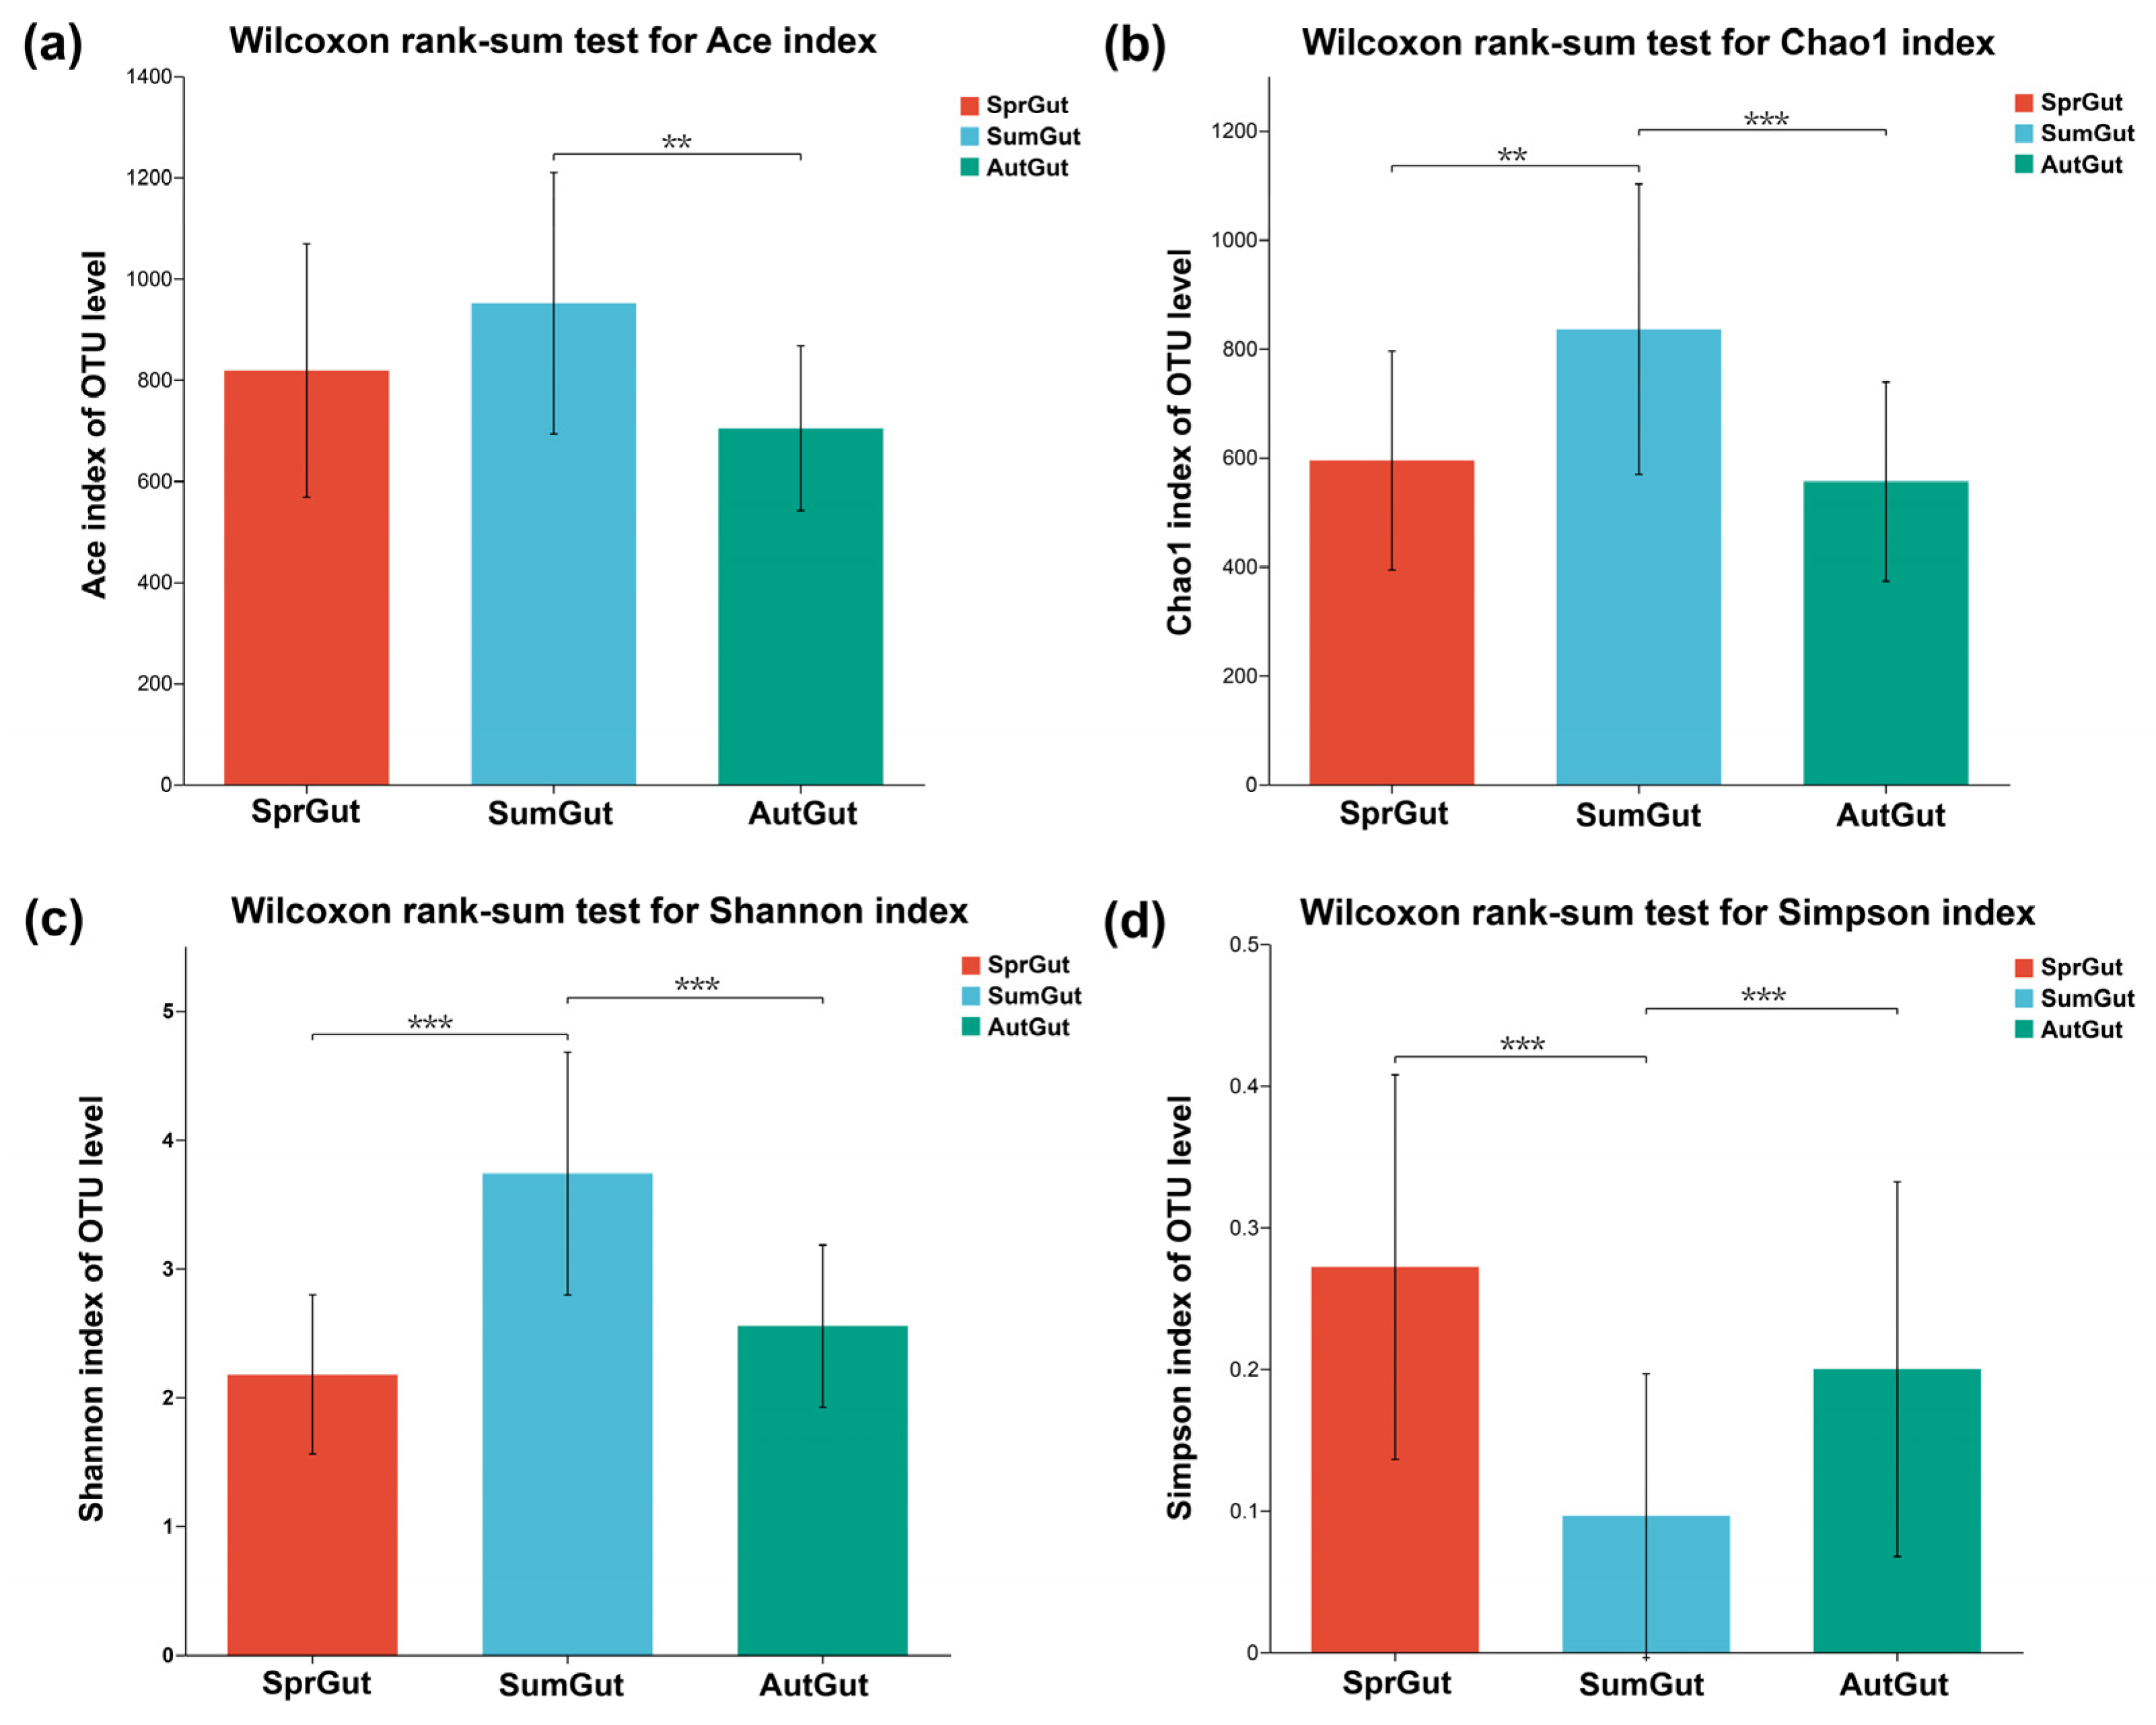
We analyzed Ace, Chao1, Shannon, and Simpson as the four common alpha diversity indexes of the gut microbiota (Figure 2, Tables S2 and S3). The Chao1, Shannon, and Simpson indexes indicated significant differences in gut microbiota diversity between SprGut-group and SumGut-group and between AutGut-group and SumGut-group (p < 0.05). However, the Ace index showed significant differences only between AutGut-group and SumGut-group (p < 0.05), and no significant differences between SprGut-group and SumGut-group. All four diversity indexes showed no significant difference between spring and autumn (Figure 2, Table S3).

3.2. Composition and Beta Diversity Analysis of Gut Microbiota

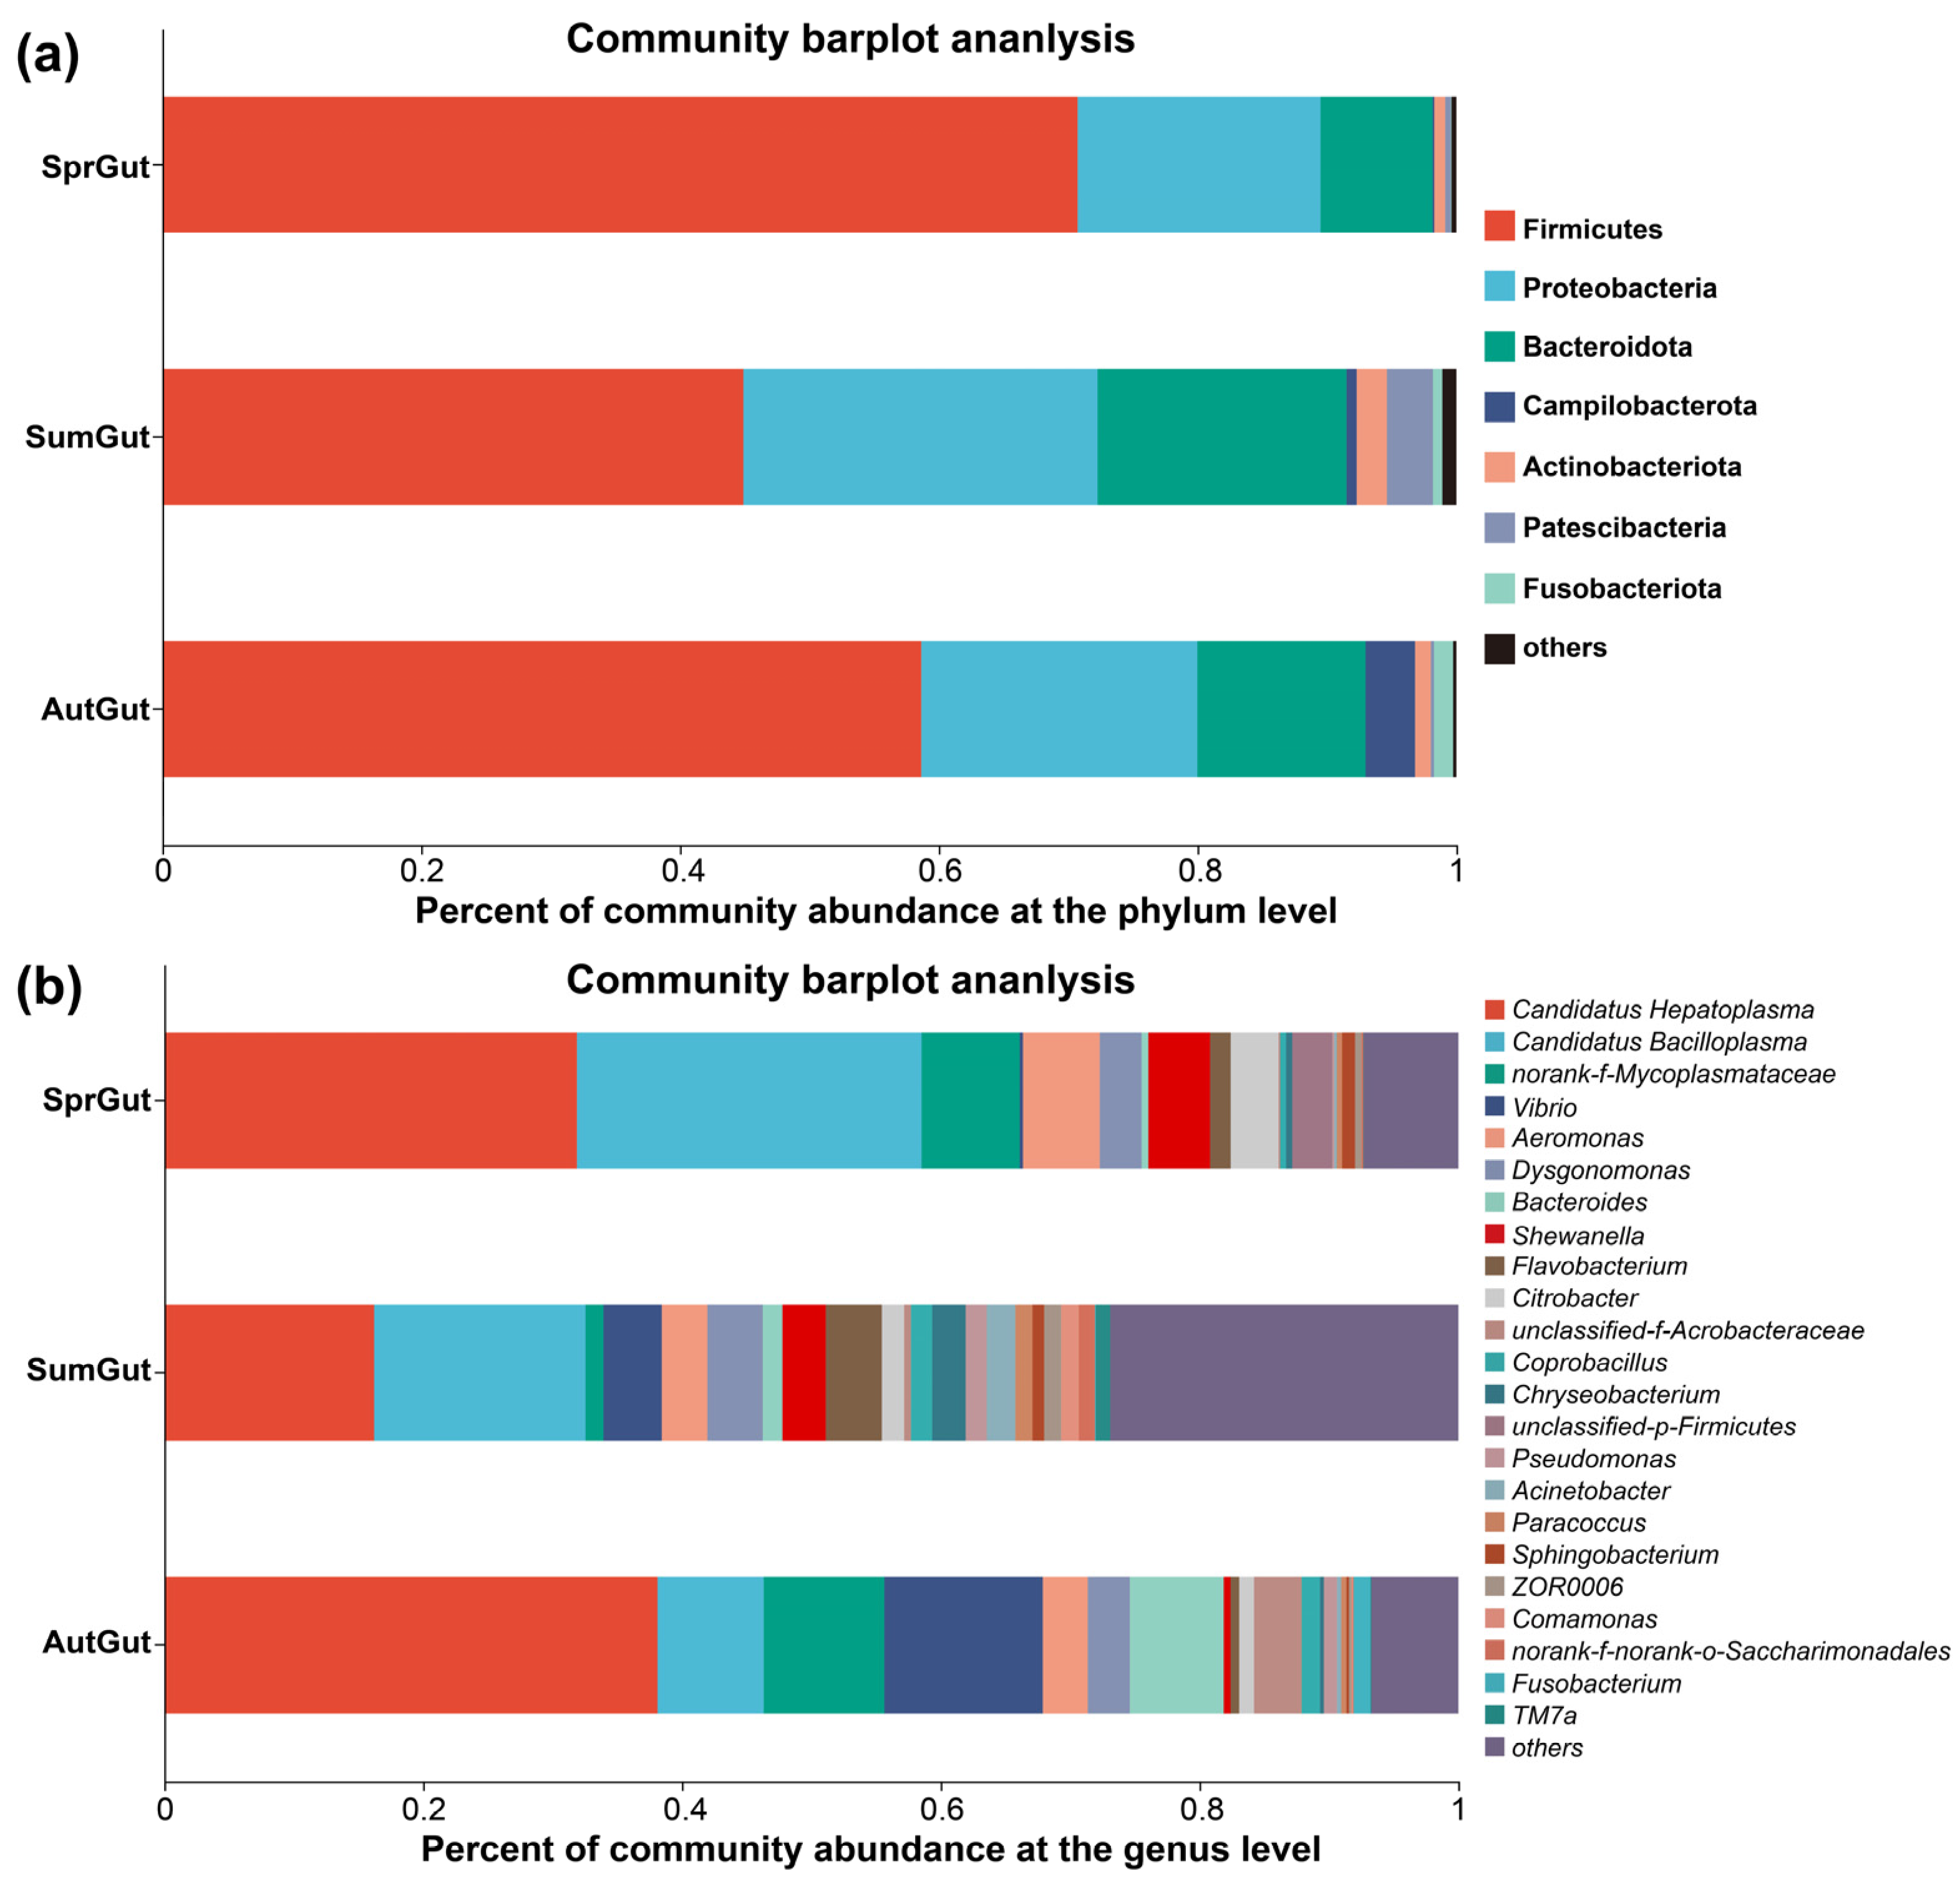
From the phylum-level classification of the gut microbiota composition, the three seasons were very similar in components but differed in proportions (Figure 3). The major phyla (relative abundance of more than 1%) in the SprGut-group were Firmicutes (70.73%), Proteobacteria (18.77%), and Bacteroidota (8.66%). The major phyla (relative abundance of more than 1%) in the SumGut-group were Firmicutes (44.90%), Proteobacteria (27.37%), Bacteroidota (19.23%), Actinobacteriota (2.34%), and Patescibacteria (3.56%). The major phyla (relative abundance of more than 1%) in the AutGut-group were Firmicutes (58.65%), Proteobacteria (21.34%), Bacteroidota (13.00%), Campilobacterota (3.82%), Actinobacteriota (1.22%), and Fusobacteriota (1.48%). Firmicutes were the most abundant phylum in the three gut groups (Figure 3a).
The gut microbiota of S. planum in three different seasons also varied greatly in proportions at the genus level (Figure 3b). Candidatus Hepatoplasma and Candidatus Bacilloplasma were the main components of the gut microbiota in all three seasons, accounting for 31.89% and 26.63%, 16.21% and 16.34%, 38.11% and 8.21%, in spring, summer, and autumn, respectively. In the SprGut-group, the other dominant genera with relative abundances above 5% were norank-f-Mycoplasmataceae (7.59%), and Aeromonas (5.94%). None of the other genera had more than 5% relative abundance in the SumGut-group. In the AutGut-group, the other dominant genera (relative abundance of more than 5%) were Vibrio (12.24%), norank-f-Mycoplasmataceae (9.31%), and Bacteroides (7.26%) (Figure 3b).
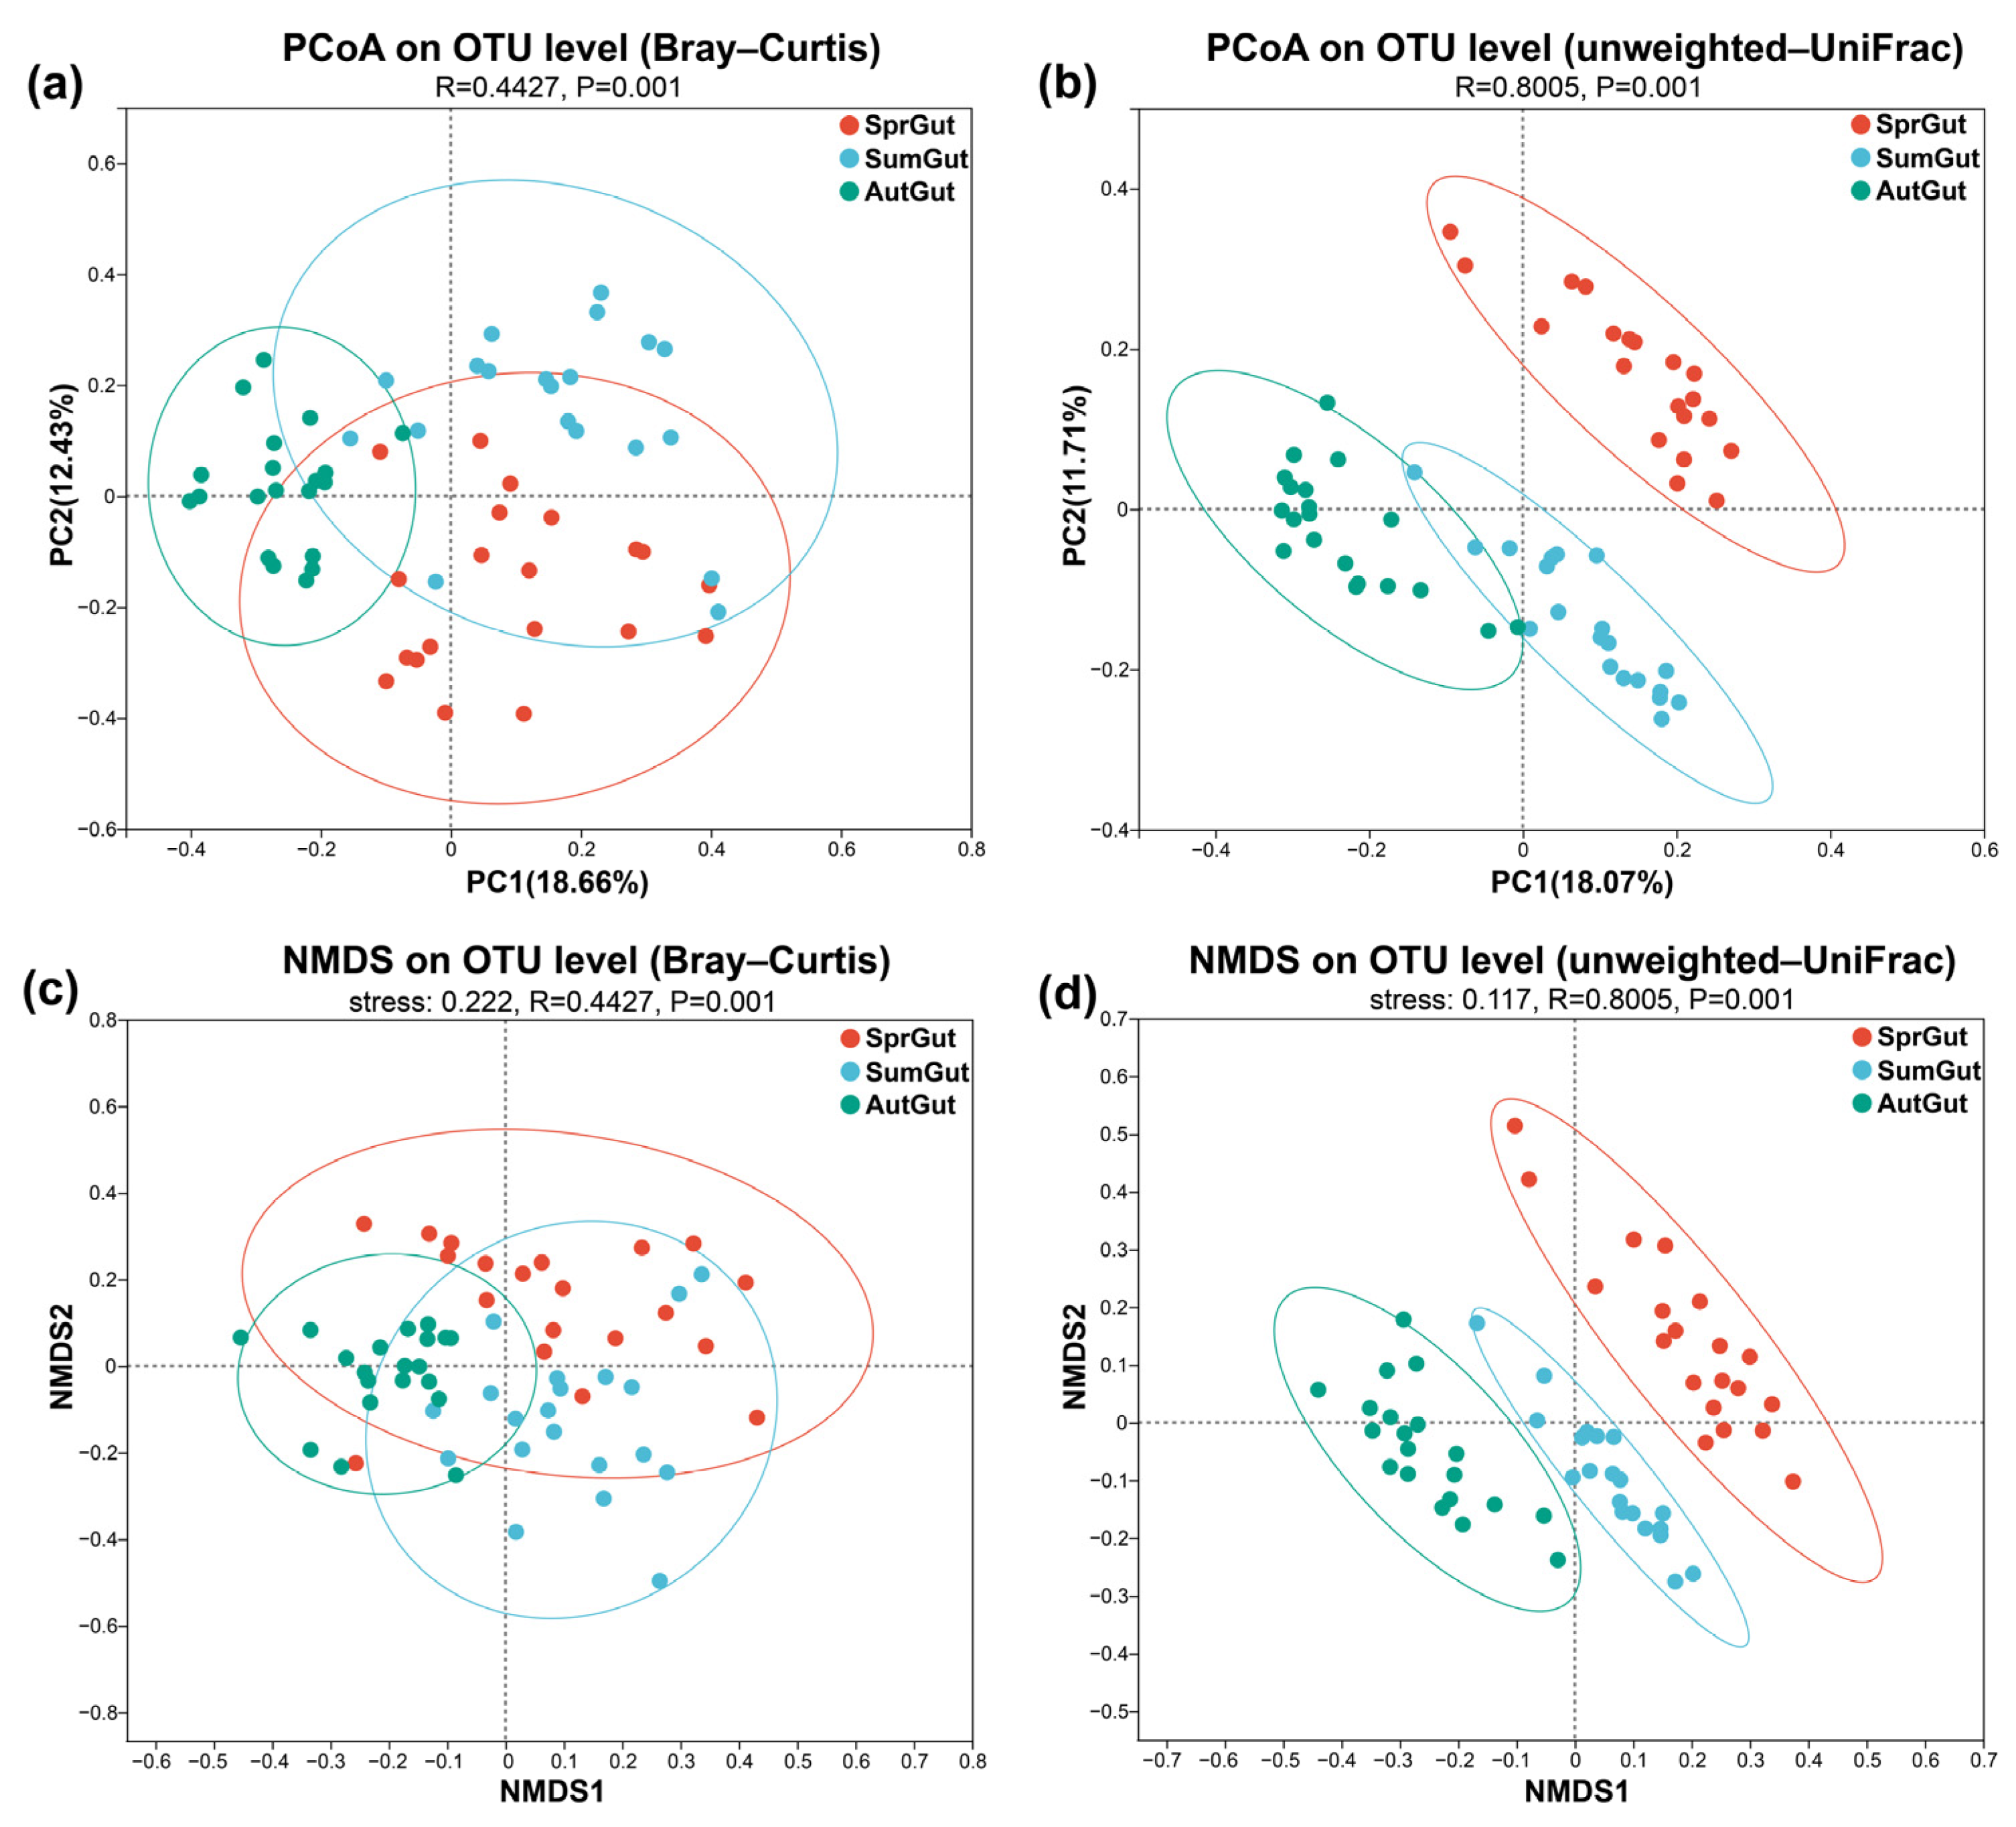
In terms of beta diversity, PCoA and NMDS analyses based on Bray–Curtis and unweighted–UniFrac distances were performed to determine the difference in the composition structure between the three Gut-groups (Figure 4). The ANOSIM results showed that the intra-group distances are smaller than the inter-group distances (R > 0), justifying the grouping. The PCoA plots of Bray–Curtis and unweighted–UniFrac distances all showed that the composition of the gut microbiota community was significantly different among the three Gut-groups (p = 0.001) (Figure 4a,b). This result was also verified in the NMDS results based on unweighted–UniFrac distance (stress = 0.117, p = 0.001) (Figure 4d). Although the NMDS analysis based on the Bray–Curtis distance indicated similar results, the stress value was greater than 0.2 which is not credible (Figure 4c).

3.3. Differences in Gut Microbes in the Three Studied Seasons

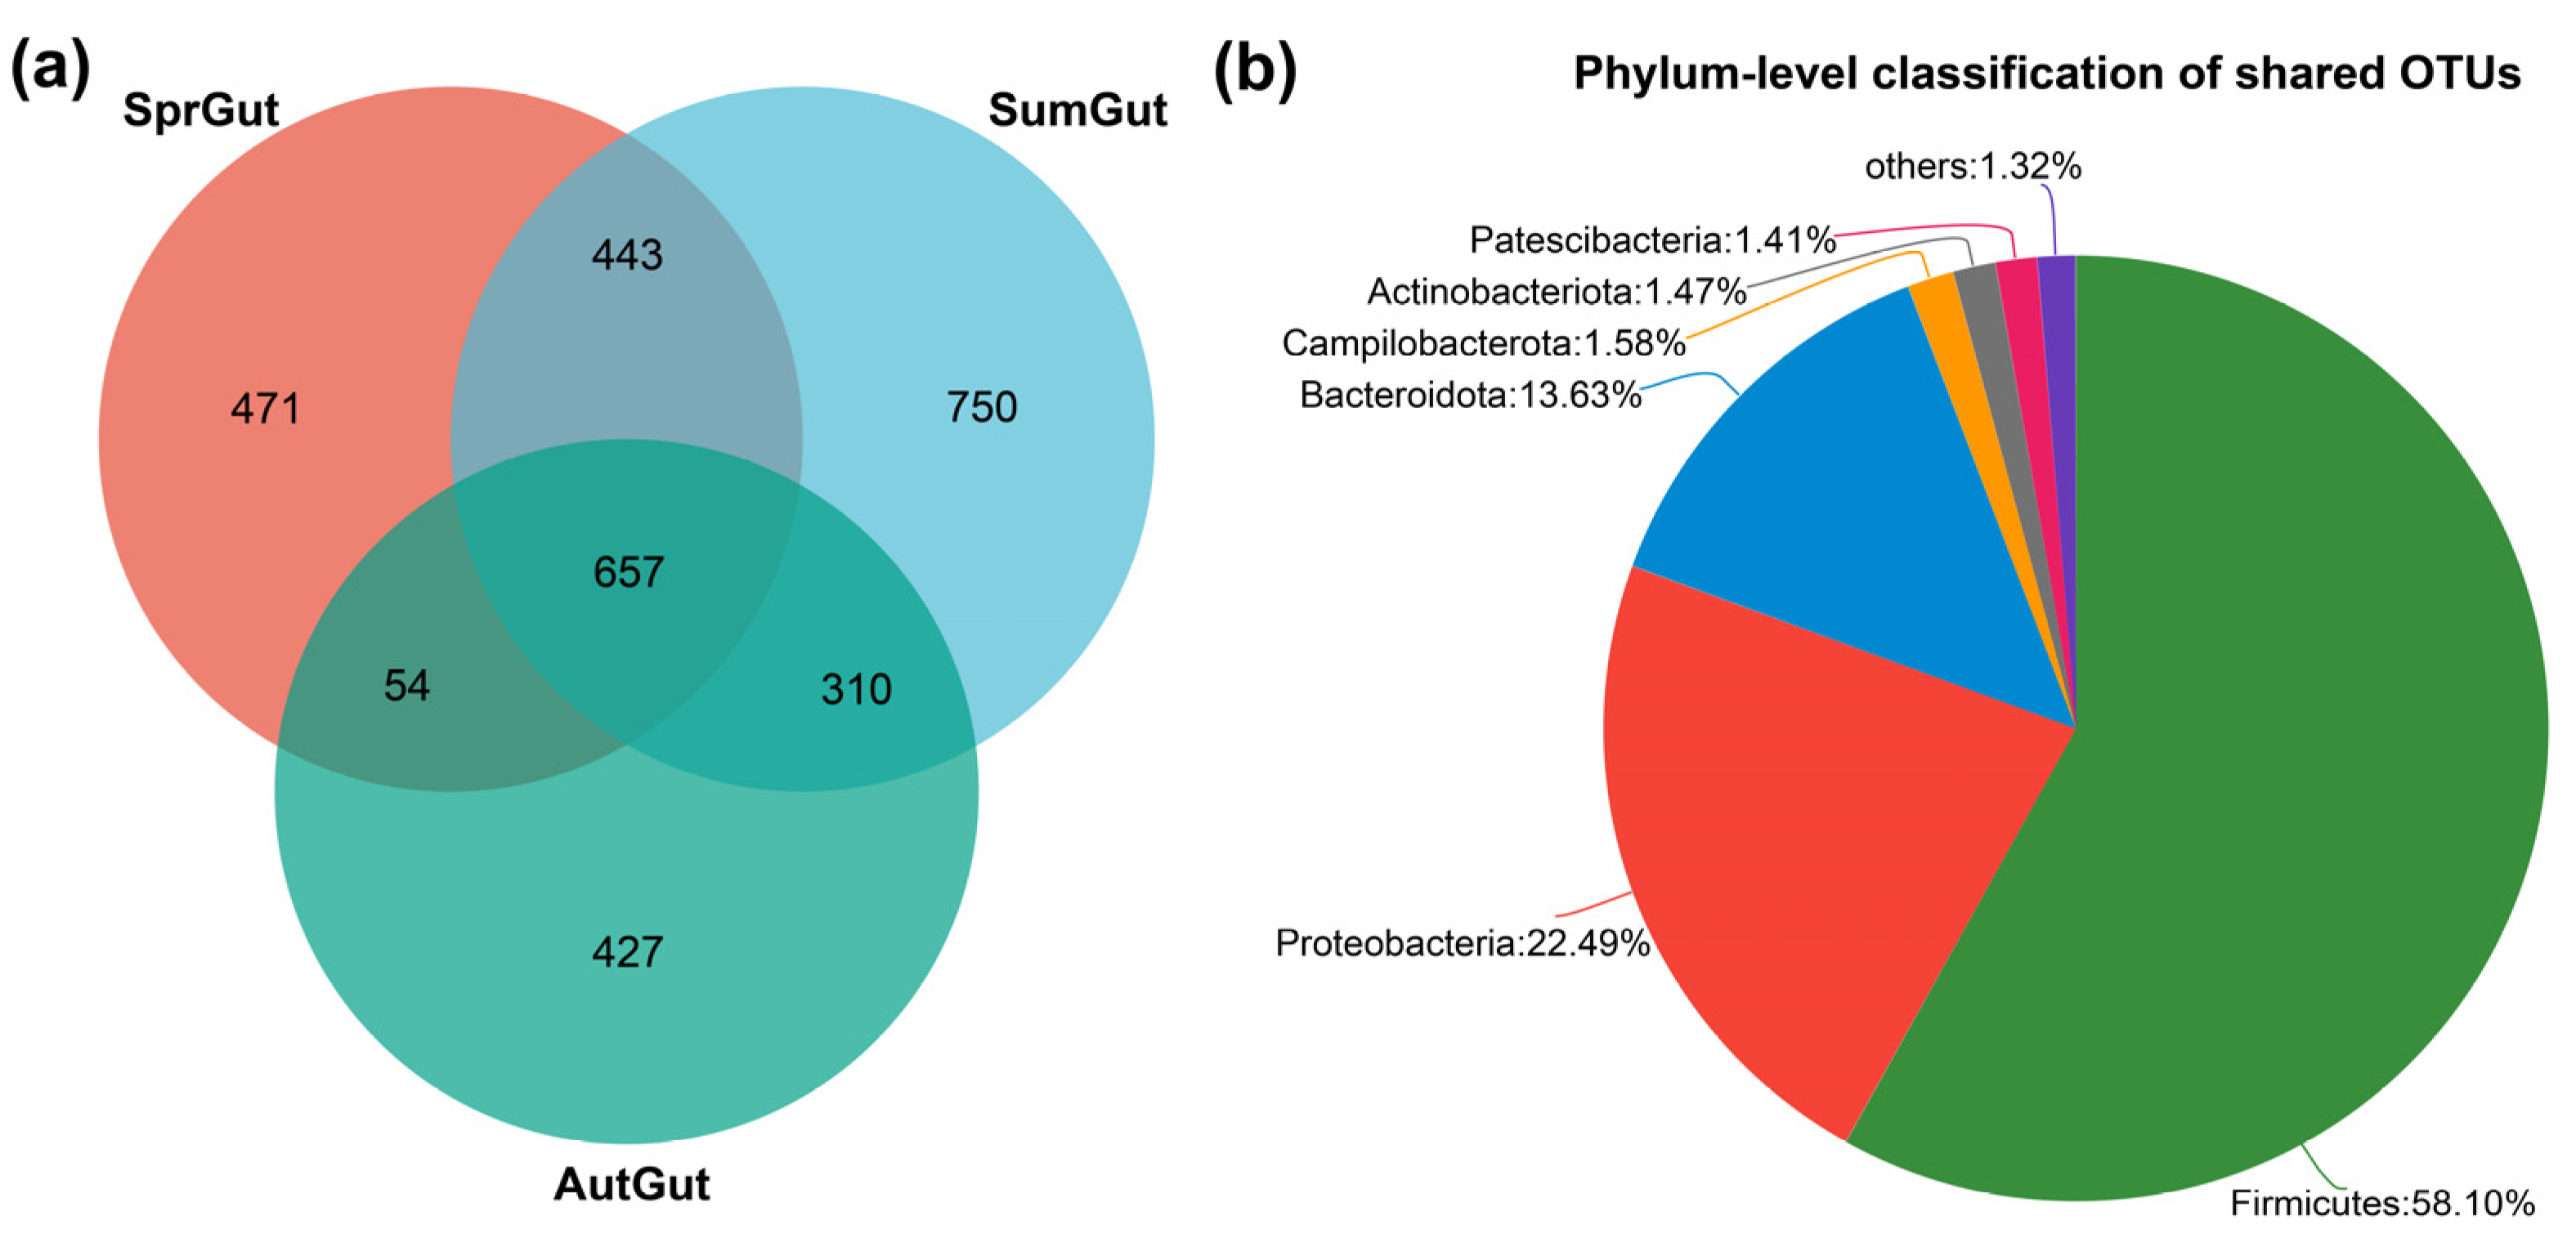
The Venn diagram showed the number of shared and unique OTUs (Figure 5a). A total of 657 OTUs were shared in three groups, accounting for 40.43%, 30.42%, and 45.37% of the total number of the SprGut-group, SumGut-group, and AutGut-group, respectively. Among these shared OTUs, 58.10% were from Firmicutes, 22.49% from Proteobacteria, 13.63% from Bacteroidota, 1.58% from Campilobacterota, 1.47% from Actinobacteriota, and 1.41% from Patescibacteria (Figure 5b). There were 471 unique OTUs in the SprGut-group, 750 unique OTUs in the SumGut-group, and 427 unique OTUs in the AutGut-group (Figure 5a).
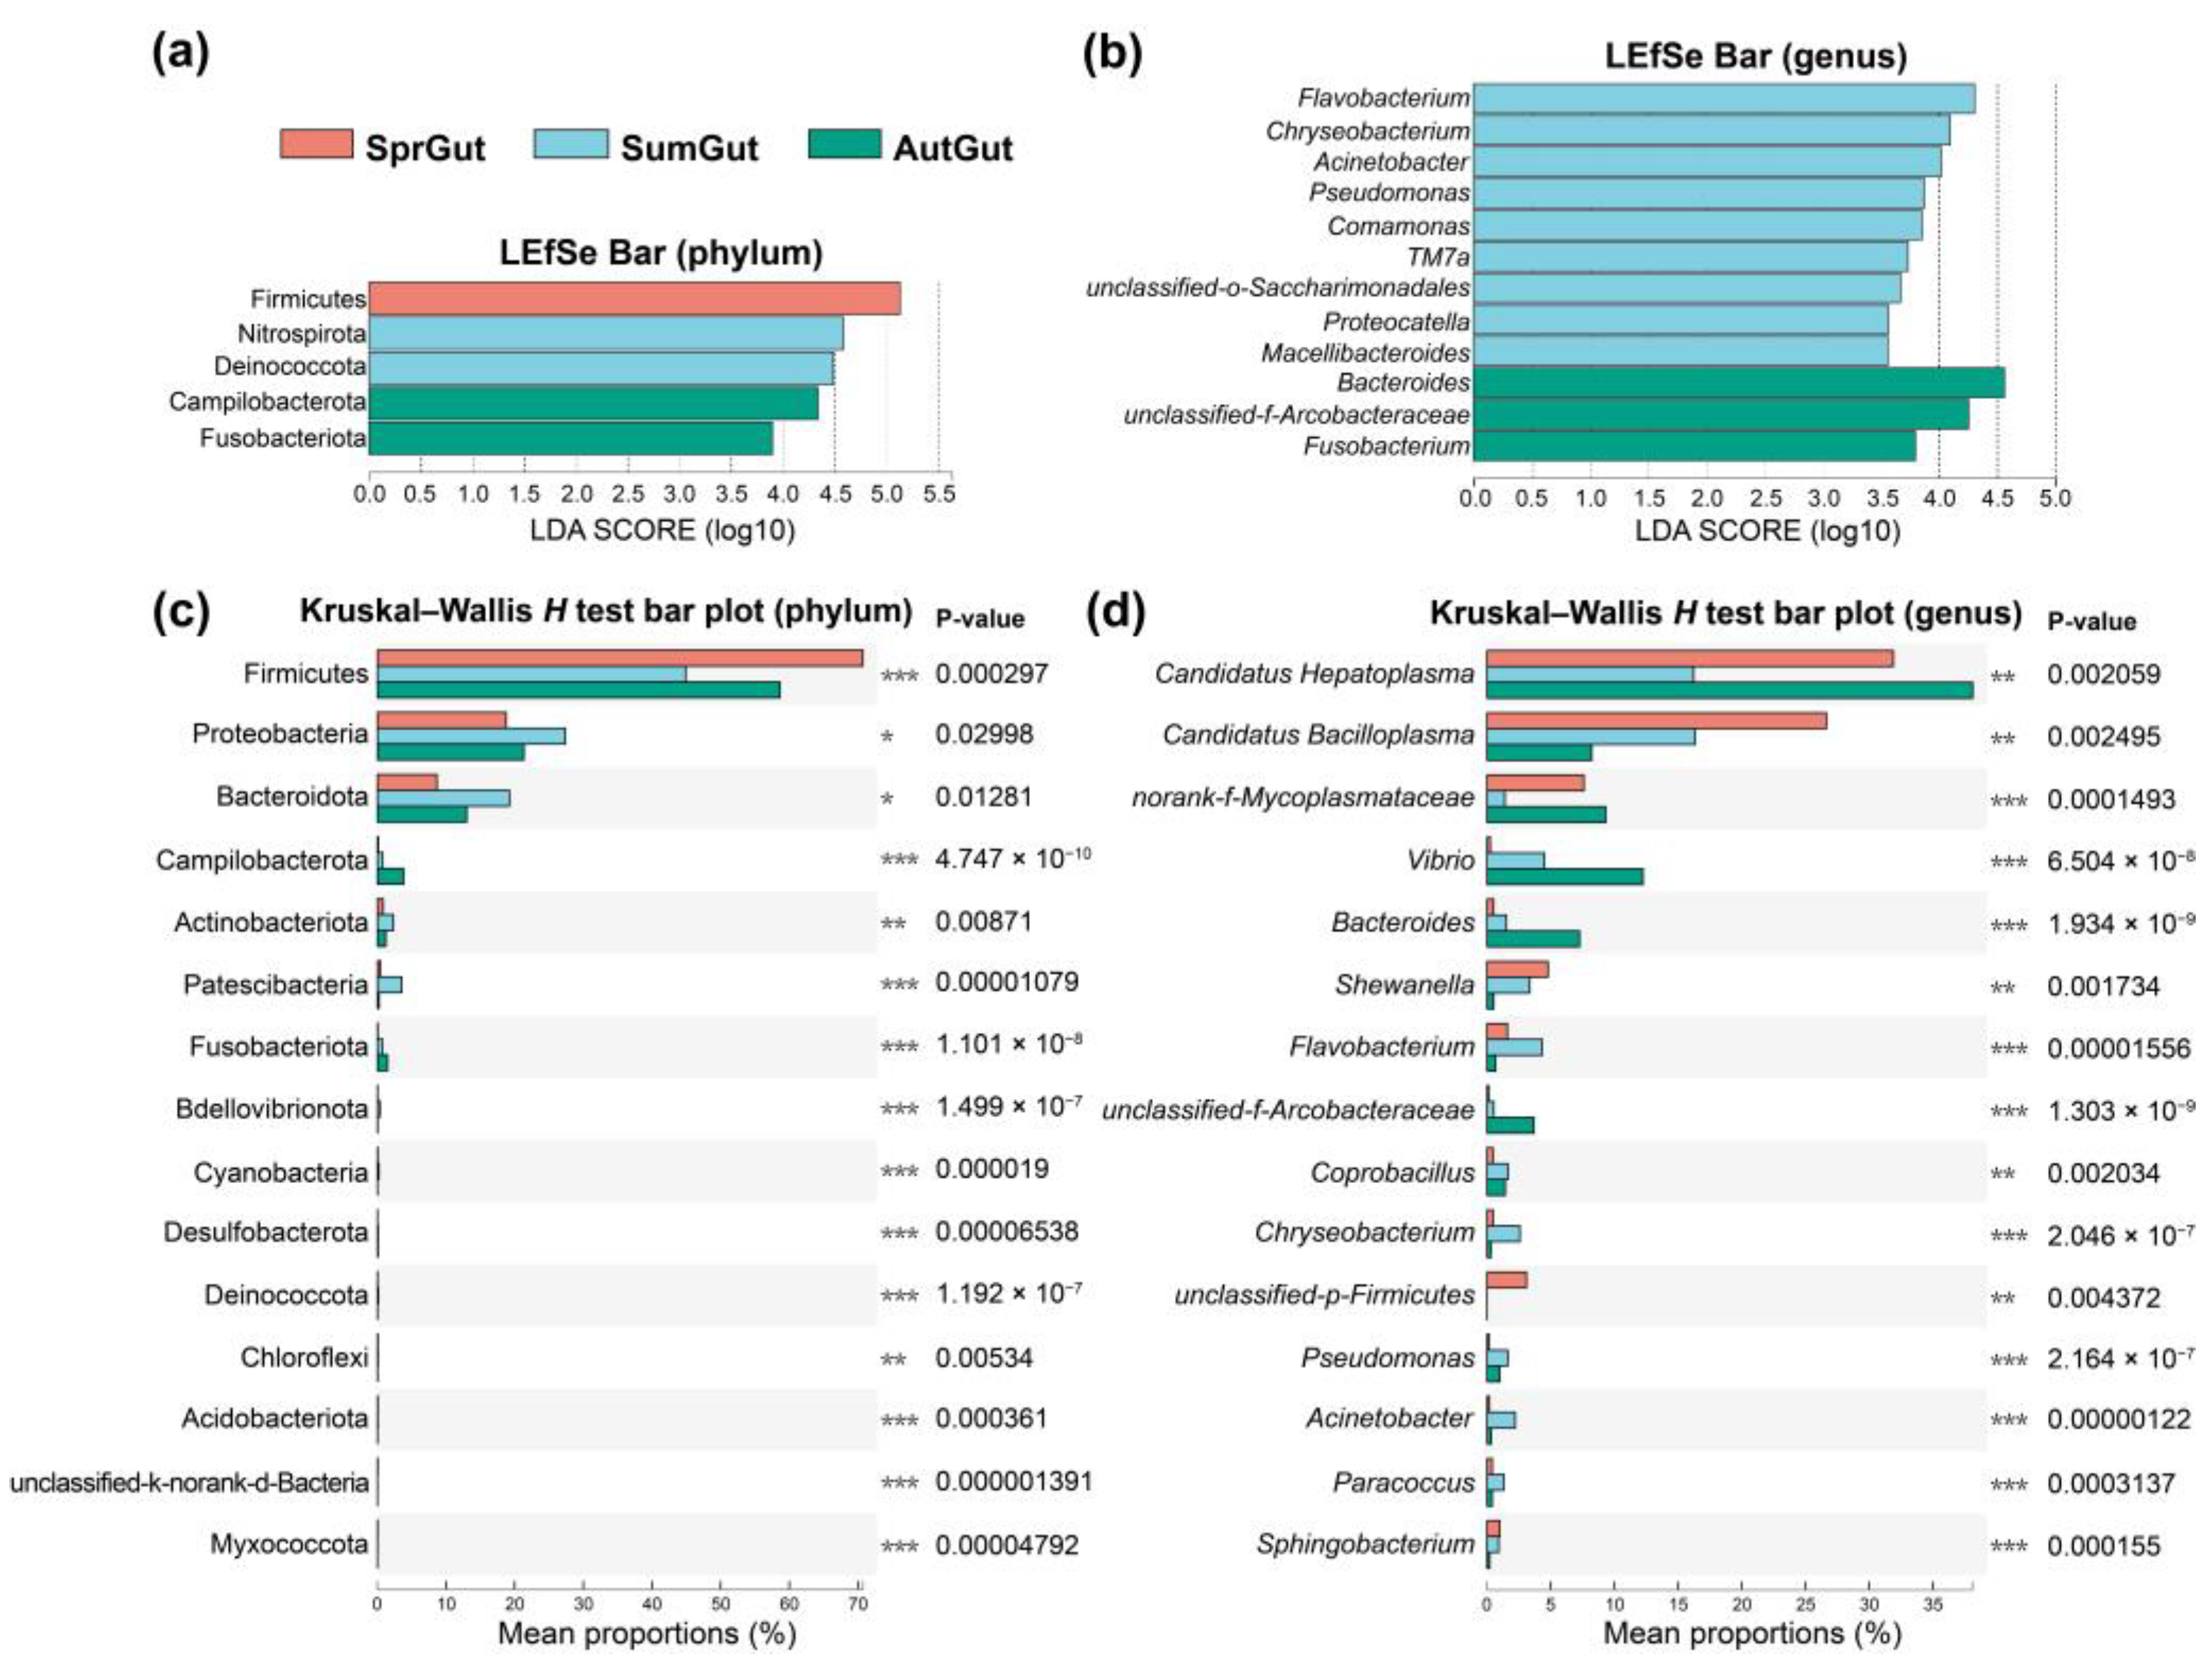
To explore the microbial community composition variation between the three gut groups, we performed a LEfSe analysis with an all-against-all strategy to detect differences in the relative abundance of the bacterial taxa (including phylum and genus) (Figure 6a,b, Table S4). At the phylum level, our LEfSe analysis results revealed that the Firmicutes were significantly enriched in the SprGut-group, the Nitrospirota, and Deinococcota significantly enriched in the SumGut-group, and the Campilobacterota and Fusobacteriota significantly enriched in the AutGut-group (LDA > 3.5, p < 0.05) (Figure 6a). At the genus level, nine genera (Flavobacterium, Chryseobacterium, Acinetobacter, Pseudomonas, Comamonas, TM7a, unclassified-o-Saccharimonadales, Macellibacteroides, and Proteocatella) were significantly enriched in the SumGut-group and three genera (Bacteroides, unclassified-f-Arcobacteraceae, and Fusobacterium) were significantly enriched in the AutGut-group (LDA > 3.5, p < 0.05) (Figure 6b).
Kruskal–Wallis H test at the phylum level indicated that the three main phyla, Firmicutes, Proteobacteria, and Bacteroidota, differed significantly in abundance between seasons (Figure 6c). The abundance of Proteobacteria, Bacteroidota, Actinobacteriota, and Patescibacteria in the SumGut-group was significantly higher than that in the SprGut-group and AutGut-group (p < 0.05). In contrast, the Firmicutes had a markedly lower abundance in the SumGut-group compared to SprGut-group and AutGut-group (p < 0.001). In the AutGut-group, the relative abundances of Campilobacterota and Fusobacteriota were significantly higher than that in the other two groups (p < 0.001) (Figure 6c). At the genus level, the relative abundances of Candidatus Hepatoplasma and norank-f-Mycoplasmataceae were the lowest in the SumGut-group (p < 0.01), and the relative abundance of Flavobacterium, Chryseobacterium, Pseudomonas, Acinetobacter, and Paracoccus were the highest in SumGut-group (p < 0.001) (Figure 6d).
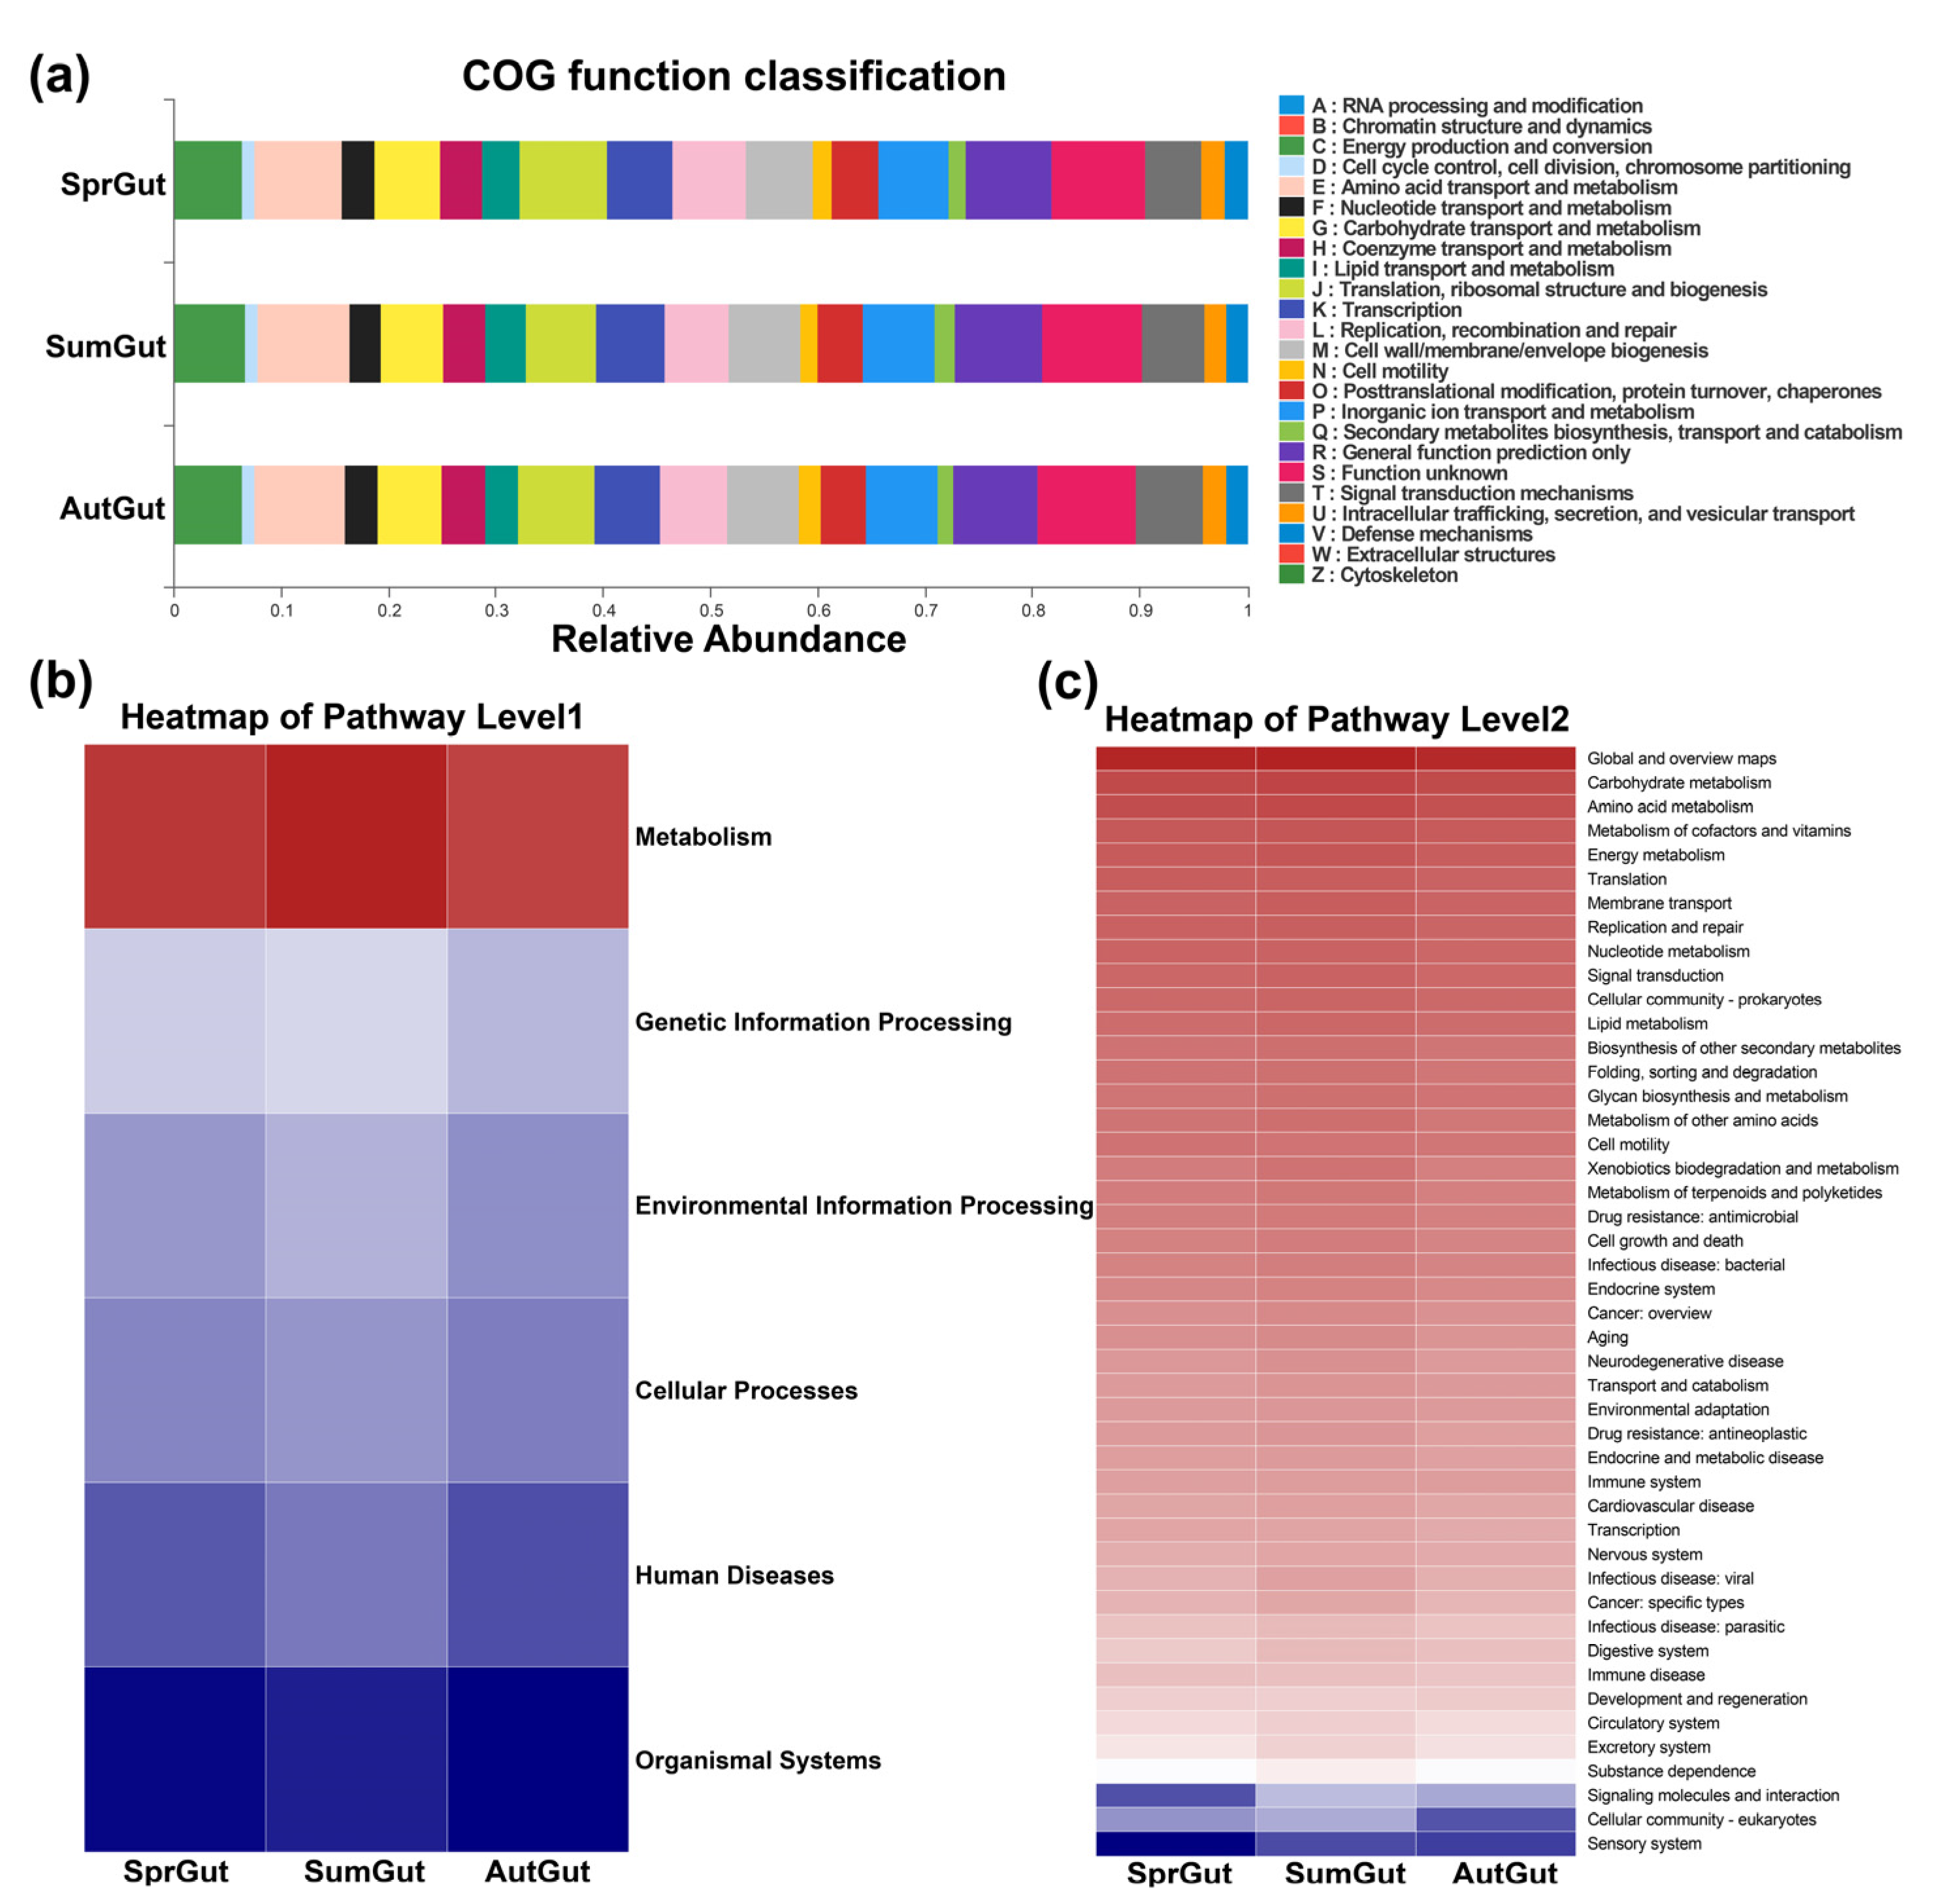
A total of 24 metabolic functions were predicted in all gut samples from the EggNOG database (Figure 7a). The main functions included amino acid transport and metabolism (0.081–0.087), translation, ribosomal structure and biogenesis (0.065–0.082), energy production and conversion (0.064–0.066), carbohydrate transport and metabolism (0.058–0.061), transcription (0.061–0.065), replication, recombination and repair (0.059–0.069), cell wall/membrane/envelope biogenesis (0.062–0.067), inorganic ion transport and metabolism (0.065–0.067), and signal transduction mechanisms (0.059–0.063), etc., (Figure 7a, Table S5).
PICRUSt was used to predict the function of the gut microbiota. A total of 7237 KEGG Orthology groups (KOs) were mapped to six level1 KEGG pathways, 46 level2 pathways, and 395 level3 pathways. According to the heatmap, predicted functional pathways metabolism accounted for the highest proportion at level 1, followed by genetic information processing, environmental information processing, cellular processes, human diseases, and organismal systems (Figure 7b). Kruskal–Wallis H test was conducted in the three gut groups and the result showed that significant differences in organismal systems, human diseases, and genetic information processing were detected among these three groups (Figure S2). At level 2, predicted functional pathways global and overview maps accounted for the highest proportion, while the sensory system accounted for the lowest proportion (Figure 7c).

3.4. Microbial Diversity of Surrounding Water

This study also analysed the alpha diversity (Figure S3) and beta diversity (Figure S4) of water microbial communities from the studied three seasons. The results of the alpha diversity analysis showed that the Ace, Chao1, and Shannon indices were all lowest in spring and highest in autumn, while the Simpson index was lowest in autumn and highest in summer (Figure S3). The four alpha diversity indices all showed that although the diversity of the water microbial communities differed between the three seasons, they did not show significant differences. In contrast, the PCoA analysis based on both weighted-UniFrac and unweighted–UniFrac distances showed that the water microbial samples were separated in the coordinate systems and showed significant differences (p < 0.01) across spring, summer, and autumn (Figure S4). These results indicate that the diversity of the water microbial communities was relatively similar across the three seasons, but differed in terms of the relative abundance of species composition. Overall the water microbial community fluctuated less than the gut microbial community in S. planum.

3.5. Analysis of the Microbiota Variance between S. planum and Surrounding Water

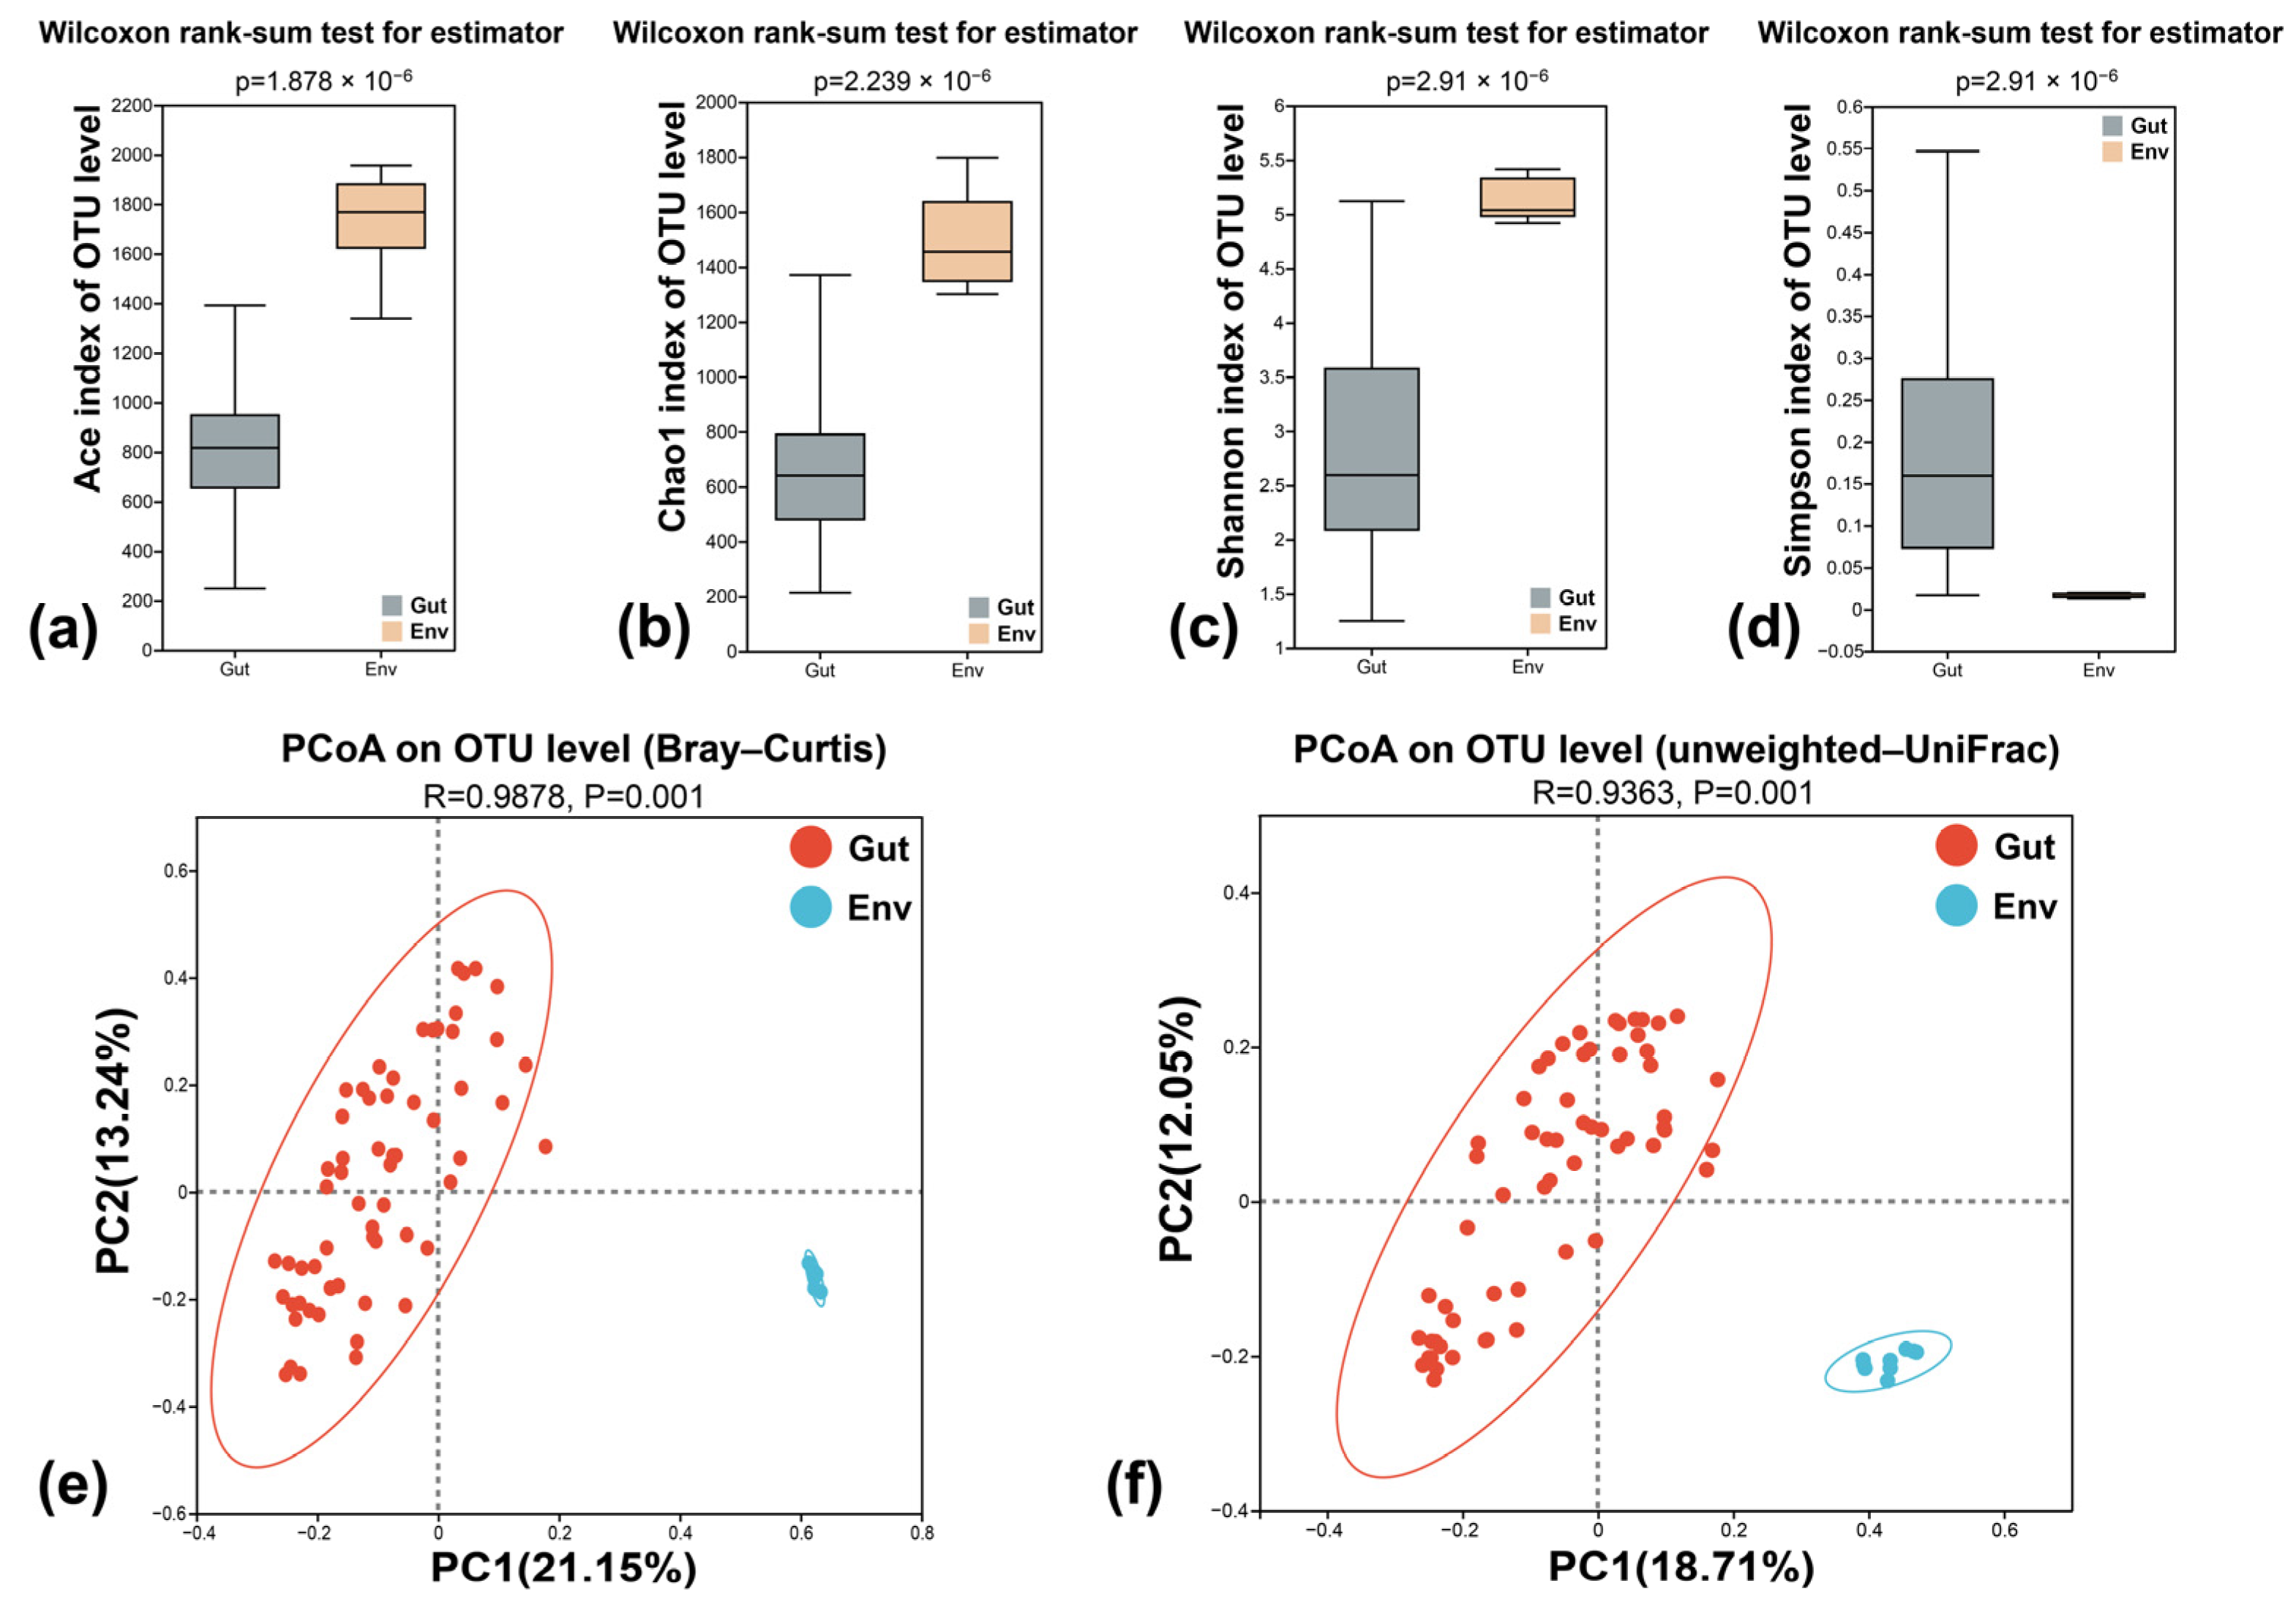
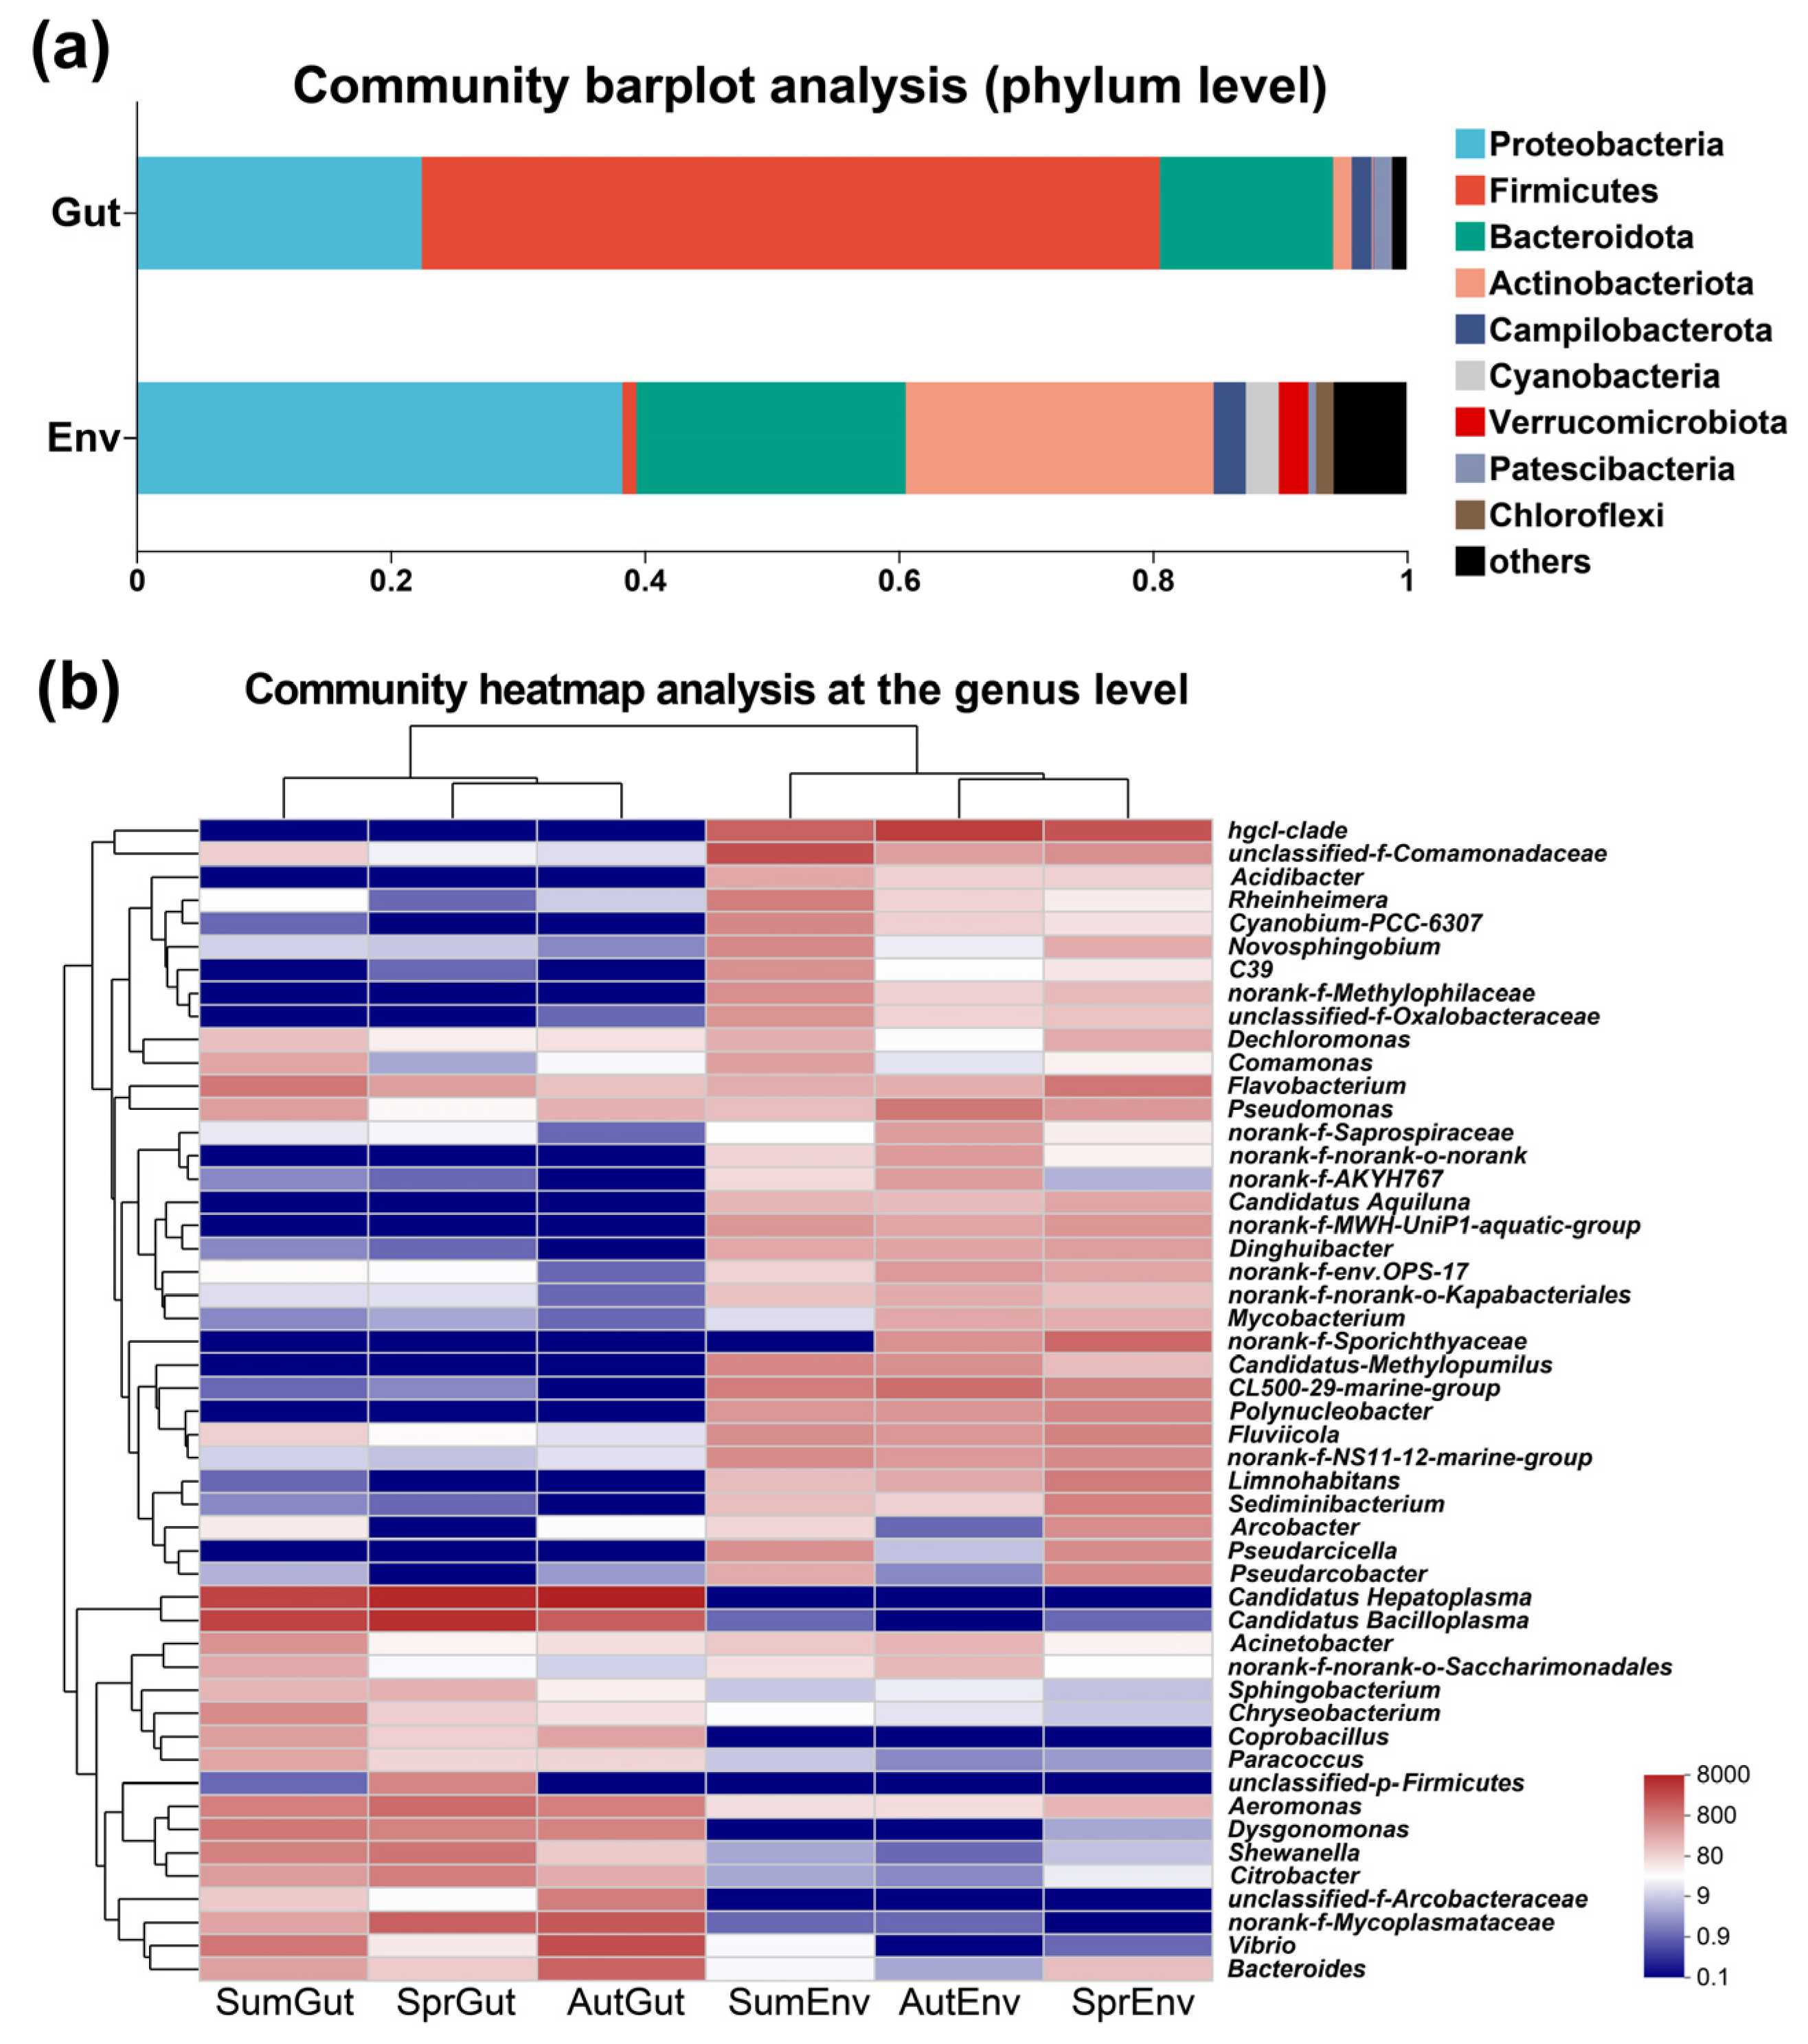
The relationship between the gut microbes of S. planum (Gut-group) and surrounding water microbes (Env-group) was analyzed (Figure 8 and Figure 9). The four alpha diversity indexes (Ace, Chao1, Shannon, and Simpson) showed a significant difference in the diversity of microorganisms between the water and the crab’s gut (p < 0.001), with the surrounding water showing more diverse microorganisms (Figure 8a–d). The results of PCoA analysis based on Bray–Curtis and unweighted–Unifrac distances showed clear separations between the two groups, representing the difference in the relative abundance of microbial communities (p < 0.01). In addition, although both Gut-groups and Env-groups clustered separately, the aggregation in Gut-groups appeared to be looser, suggesting that the relative abundance of microbial communities was more similar in the samples within Env-groups. This is also supported by the fact that the relative abundance of microbial communities within Env-groups fluctuated less than that of Gut-groups (Figure 8e,f). In terms of microbial community composition, Proteobacteria, Firmicutes, and Bacteroidota are the main constituent phyla in Gut-groups, while Proteobacteria, Bacteroidota, and Actinobacteriota are the main constituent phyla in Env-groups (Figure 9). Firmicutes is the phylum with the highest relative abundance in Gut-groups, but its relative abundance in Env-groups is extremely low. The phylum with the highest relative abundance in Env-groups is Proteobacteria, which also shows a high relative abundance in Gut-groups. Bacteroidota shows high relative abundance in both Gut-groups and Env-groups, while Actinobacteriota, the second most abundant phylum in Env-groups, has very low relative abundance in Gut-groups (Figure 9). At the genus level, the results of the heatmap analysis indicate that for most genera, Gut-groups and Env-groups show large differences in relative abundance (Figure 9). These results indicated that there were considerable differences in the microbial community diversity and composition between Gut-groups and Env-groups.

4. Discussion

4.1. Structure and Function of Gut Microbes of S. planum in Three Seasons

In the present study, the alpha diversity results of gut microbiota in three seasons (spring, summer, and autumn) showed that the gut microbiota of S. planum in summer had the highest diversity (Figure 2). Previous studies on freshwater molluscs (Pomacea canaliculata) and amphibians (Rana dybowskii) have shown similar results [15,44]. The higher alpha diversity indicates that the gut microbiota is more diverse and stable, enhancing their adaptability to external disturbances and benefiting the health of the host [45]. Beta diversity analysis based on PCoA and NMDS showed that seasonal variation had a very significant effect on the structure of the gut microbiota community of S. planum (Figure 4). External factors such as temperature, precipitation, and food resources change significantly from season to season, and these fluctuations are likely to cause changes in the gut microbial community structure [46,47]. Studies on the gut microbiota of tench (Tinca tinca) have also shown that habitat and seasonal factors play an important role in shaping the host gut microbiota [48]. The feeding trial for the swimming crab (Portunus trituberculatus) demonstrated that higher dietary lipid levels affect the composition of the intestinal microbial community and increase the potential risk of disease [49]. Although the diversity and structure of the gut microbial community differed between the three seasons, the Venn diagram results showed that 657 OTUs were still shared among all three seasons (Figure 5a). These shared OTUs were mainly from five phyla, Firmicutes, Proteobacteria, Bacteroidota, Campilobacterota, and Actinobacteriota (Figure 5b). These shared phyla are often referred to as key phyla and may play important roles in maintaining the normal functions of the host intestinal environment [50].
The analysis of the gut microbiota indicated that the main bacteria in all three seasons for the freshwater crab S. planum belonged to the phyla Firmicutes, Proteobacteria, and Bacteroidota (Figure 3a), which are also the dominant microbiota species of the gut from the other crustacean such as red swamp crayfish [51]. These results are also consistent with studies on the gut microbiome of other crabs, including the Chinese mitten crab Eriocheir sinensis [52,53], the mud crab Scylla paramamosain [54], and the swimming crab Portunus trituberculatus [55]. However, Mycoplasmatota (Tenericutes), the dominant phylum composition in the above three marine crabs [52,54,55], had a relatively low abundance, less than 1%, in S. planum. We speculate that the different relative abundance of Mycoplasmatota in the gut of freshwater and marine crabs may be related to differences in water environments. Firmicutes can degrade polysaccharides and have positive effects on nutrient and energy absorption from food [56]. In addition, Firmicutes is considered the most abundant phylum of carnivore gut microbes, despite its close association with plant polysaccharide metabolism [57,58]. This could explain why the relative abundance of Firmicutes was highest in all three seasons in this study (Figure 3a), as S. planum is an omnivore but prefer a carnivore diet. Bacteroidota not only degrades polysaccharides, carbohydrates, and proteins but also assemble polysaccharides to help the host absorb nutrients from the diet. In addition, it improves the intestinal environment, which is more beneficial for the host itself and other microorganisms [59]. The relative abundance of Bacteroidota was highest in summer (Figure 3), which may be related to the high abundance of food resources in summer. Moreover, there is an interaction between Firmicutes and Bacteroidota. The high abundance of Firmicutes and Bacteroides has the potential to help the host to absorb or store energy [60]. Proteobacteria dominate the gut microbiota of aquatic invertebrate crustaceans and are highly diverse in terms of physiology, morphology, and genetics [61]. It has been shown that the abundance of Patescibacteria and ambient temperature are positively correlated [62]. In our study, the relative abundance of Patescibacteria in the gut microbial community was highest in summer which is also the season with the highest water temperature. Fusobacteriota showed different levels of enrichment in the three seasons, with the highest relative abundance in the autumn (Figure 3a). Members of this phylum are thought to be involved in amino acid fermentation and are therefore more prevalent in the gut of strictly carnivorous species [63]. S. planum is omnivorous, and our results suggest that it may be more carnivorous in the autumn, which would coincide with the habit of S. planum, which is active in the autumn and accumulates a lot of nutrients to survive the winter dormancy period, pending subsequent analysis of its diet to verify this.
At the genus level, the main components were Candidatus Hepatoplasma and Candidatus Bacilloplasma (Figure 3b). Previous studies have shown that Candidatus Hepatoplasma presents a high abundance in the gut of crabs [64,65]. It has also been shown that isopods with more Candidatus Hepatoplasma in the intestine are more likely to survive in the presence of food scarcity [66]. This finding is also supported by the present study, as S. planum, an opportunistic predator, spends most of its time in a state of foodless starvation, and the high abundance of Candidatus Hepatoplasma is likely to be associated with this. Moreover, the Candidatus Hepatoplasma in the gut microbes of S. planum was somewhat higher in spring and autumn, with less availability of food resources, which was more favourable for the survival of the host. Candidatus Bacilloplasma is the native population of the crustacean gut microbiota [53,67]. It has been shown that a significant increase in the content of Candidatus Bacilloplasma in the gut of shrimp carrying pathogenic bacteria [68]. In the present study, the relative abundance of Candidatus Bacilloplasma in the gut microbes of S. planum decreased from spring to autumn (Figure 3b), which may be related to changes in the health status of S. planum. We infer that S. planum may be more susceptible to some disease in spring when it is just recovering from dormancy, hence the highest relative abundance of Candidatus Bacilloplasma. The practical role of Candidatus Bacilloplasma for host S. planum is unclear and needs to be further explored.
Although the diversity and composition of the gut microbial community differed significantly between the three seasons, the results of the functional prediction analyses did not differ significantly in the studied seasons. The COG functional classification showed that 24 metabolic functions were predicted in all three seasons and that there were no significant differences in relative abundance (Figure 7a). Heatmap analysis also showed no significant differences in gut microbial community functions between the three seasons at both level 1 and level 2 of KEGG pathways (Figure 7b,c). This result suggests that the gut microbes of S. planum remained functionally stable across the three seasons, which may be related to the fact that the main phyla of the gut microbial composition were the same across the three seasons.

4.2. Relationships between Crab Gut Microbes and Surrounding Water Microbes

Studies on gut microbes of S. planum have shown significant differences in gut microbial diversity and composition between three seasons. Could this difference be linked to surrounding environmental microbes? Numerous studies have been carried out to understand the correlation between microorganisms in the gut of animals and those in the surrounding environment. For example, the gut microorganisms of marine crabs from different estuarine regions have their specific components, which is a reflection of the characteristics of the regional environment [69]. However, it has also been shown that the diversity and composition of bacterial communities in the gut of the half-smooth tongue sole differ from those in the surrounding environment [70]. In our study, the alpha diversity of the gut microbial community of S. planum showed significant differences across the three seasons (Figure 2), whereas the alpha diversity of the water microbes in the surrounding environment did not differ significantly between the three seasons (Figure S3). Beta diversity analysis showed significant differences in both gut (Figure 4) and water microbes (Figure S4) in the three seasons. A follow-up analysis on the correlation between gut microbes (Gut-group) and surrounding water microbes (Env-group) was done to address whether there are differences between gut microbes and water microbes (Figure 8 and Figure 9). The results of alpha diversity and beta diversity analysis all showed that the gut microbiota of S. planum was significantly different from the surrounding water microbiota (Figure 8). The diversity of microbial communities was much lower in the gut of S. planum than in the surrounding environmental water, a finding similar to previous studies in half-smooth tongue soles [70] and mud crabs [71]. It is also clear from the PCoA result that the internal variation in gut microbes is greater than that of water microbes. Combined with the above analyses, it can be surmised that the slight fluctuations in ambient water microbes are not the main cause of the three seasonal differences in the gut microbes of S. planum.
In terms of microbial community composition, we found differences in the core composition of gut microbes in S. planum and ambient water microbes (Figure 9). At the phylum level, Firmicutes is the main microbial phylum that colonizes mainly the gut and plays a crucial role in host health [72]. Thus, Firmicutes is the most dominant component of the gut microbiota but is extremely underrepresented in the surrounding environment (Figure 9a). Actinobacteriota is a group of bacteria that are widely distributed in soil and water [73] and therefore has a high relative abundance in the microbial community of the surrounding environment but not in the gut (Figure 9a). At the genus level, many genera showed significant differences in abundance in the gut and the surrounding environment compared to seasonal variations, such as Candidatus Hepatoplasma, Candidatus Bacilloplasma, norank-f-Mycoplasmataceae, Vibrio, etc., (Figure 9b). These genera were barely detected in water, and this finding suggests that the crab gut is colonized by its own particular gut bacterial community [74]. The study of red swamp crayfish by Xavier et al. 2021 also showed that variations in environmental conditions did not explain differences in gut microbial communities, which were often the result of host-internal factors such as developmental stage and feed supply [75]. We suggest that the gut microbes of S. planum are somewhat independent and that the gut microbial composition and seasonal variation of S. planum are less related to surrounding water microbes, but more likely a self-internal adaptation to changes in water temperature, food resources, and other factors in different seasons. Future studies on the temperature adaptation mechanisms and dietary analysis of S. planum are expected.

5. Conclusions

In the present study, we investigated the diversity, composition, and function of the gut microbial community of S. planum in three different seasons (spring, summer, and autumn) and found significant differences between seasons. The diversity of the gut microbial community was highest in the summer. Moreover, the comparative analysis based on gut microbes and surrounding water microbes showed that significant differences were found between the gut microbes and water microbes. The seasonal changes in gut microbes of S. planum were probably due to changes in water temperature and food resources brought about by the turn of seasons. This study provides insight into the gut microbes of freshwater crabs and explores the association between gut microbes and surrounding water microbes. Further studies focusing on the functional exploration of gut microbes and the interaction between gut microbiota, freshwater crabs, and the environment are expected.

Supplementary Materials

The following supporting information can be downloaded at: https://www.mdpi.com/article/10.3390/d15040519/s1, Figure S1: The rarefaction curves of Chao1 and Shannon indexes; Figure S2: Kruskal–Wallis H test bar plot at level1 KEGG pathways. “*” indicates a significant difference; Figure S3: The alpha diversity index of the microbiome in the three seasons of the surrounding water. (a): Ace index; (b): Chao1 index; (c): Shannon index; (d): Simpson index; Figure S4: PCoA analysis of microorganisms in the surrounding water in the three studied seasons; Table S1: The clean sequence number, base number, and sequence mean length for each sample. SprGut1–SprGut20, SprEnv1–SprEnv3 represent the gut and water samples collected in spring, SumGut1–SumGut20, SumEnv1–SumEnv3 represent the gut and water samples collected in summer, AutGut1–AutGut20, AutEnv1–AutEnv3 represent the gut and water samples collected at autumn; Table S2: OTUs number, richness indexes(ACE and Chao1), diversity indexes (Shannon and Simpson), and estimated sample Coverage for the different samples. SprGut1–SprGut20, SprEnv1–SprEnv3 represent the gut and water samples collected in spring, SumGut1–SumGut20, SumEnv1–SumEnv3 represent the gut and water samples collected in summer, AutGut1–AutGut20, AutEnv1–AutEnv3 represent the gut and water samples collected at autumn; Table S3: Alpha diversity indexes of Sinopotamon planum of three gut groups; Table S4: The LEfSe analysis of gut microbiota composition of Sinopotamon planum in each group (LDA score > 3.5, p < 0.05); Table S5: The relative abundance of 24 predicted metabolic functions of three gut groups.

Author Contributions

Conceptualization, C.L., B.S. and D.P.; Data curation, C.L., M.L. and Y.W.; Formal analysis, C.L., M.L. and Y.W.; Funding acquisition, D.P.; Methodology, C.L., B.S. and D.P.; Visualization, C.L., M.L. and Y.W.; Writing—original draft, C.L.; Writing—review & editing, B.S. and D.P. All authors have read and agreed to the published version of the manuscript.

Funding

Financial support from the National Natural Science Foundation of China (No. 32200356 to PD and No. 31772427 to SHY) and the Natural Science Foundation of the Jiangsu Higher Education Institutions (No. 22KJB180018 to PD) are acknowledged.

Institutional Review Board Statement

Not applicable.

Data Availability Statement

Raw sequence data were deposited in the Sequence Read Archive database of NCBI under accession number (SRR22389362–22389430), BioProject number (PRJNA904680), and Biosample number (SAMN31850051–31850119).

Acknowledgments

The authors thank Yangqi Lv and Hui Chen for their help during the sample collection. We also thank the editors and anonymous reviewers for helping to improve the manuscript.

Conflicts of Interest

The authors declare no conflict of interest.

References

  1. Lee, W.-J.; Hase, K. Gut microbiota–generated metabolites in animal health and disease. Nat. Chem. Biol. 2014, 10, 416–424. [Google Scholar] [CrossRef] [PubMed]
  2. Moszak, M.; Szulińska, M.; Bogdański, P. You are what you eat—The relationship between diet, microbiota, and metabolic disorders—A review. Nutrients 2020, 12, 1096. [Google Scholar] [CrossRef] [Green Version]
  3. Quigley, E.M.M. Prebiotics and probiotics; modifying and mining the microbiota. Pharmacol. Res. 2010, 61, 213–218. [Google Scholar] [CrossRef] [PubMed]
  4. Nicholson, J.K.; Holmes, E.; Kinross, J.; Burcelin, R.; Gibson, G.; Jia, W.; Pettersson, S. Host-gut microbiota metabolic interactions. Science 2012, 336, 1262–1267. [Google Scholar] [CrossRef] [PubMed] [Green Version]
  5. Maslowski, K.M.; Mackay, C.R. Diet, gut microbiota and immune responses. Nat. Immunol. 2011, 12, 5–9. [Google Scholar] [CrossRef]
  6. Sommer, F.; Bäckhed, F. The gut microbiota—Masters of host development and physiology. Nat. Rev. Microbiol. 2013, 11, 227–238. [Google Scholar] [CrossRef]
  7. Tremaroli, V.; Bäckhed, F. Functional interactions between the gut microbiota and host metabolism. Nature 2012, 489, 242–249. [Google Scholar] [CrossRef]
  8. Amato, K.R.; Leigh, S.R.; Kent, A.; Mackie, R.I.; Yeoman, C.J.; Stumpf, R.M.; Wilson, B.A.; Nelson, K.E.; White, B.A.; Garber, P.A. The role of gut microbes in satisfying the nutritional demands of adult and juvenile wild, black howler monkeys (Alouatta pigra). Am. J. Phys. Anthropol. 2014, 155, 652–664. [Google Scholar] [CrossRef] [PubMed]
  9. Ley, R.E.; Hamady, M.; Lozupone, C.; Turnbaugh, P.J.; Ramey, R.R.; Bircher, J.S.; Schlegel, M.L.; Tucker, T.A.; Schrenzel, M.D.; Knight, R.; et al. Evolution of mammals and their gut microbes. Science 2008, 320, 1647–1651. [Google Scholar] [CrossRef] [PubMed] [Green Version]
  10. David, L.A.; Maurice, C.F.; Carmody, R.N.; Gootenberg, D.B.; Button, J.E.; Wolfe, B.E.; Ling, A.V.; Devlin, A.S.; Varma, Y.; Fischbach, M.A.; et al. Diet rapidly and reproducibly alters the human gut microbiome. Nature 2014, 505, 559–563. [Google Scholar] [CrossRef] [PubMed] [Green Version]
  11. Sepulveda, J.; Moeller, A.H. The effects of temperature on animal gut microbiomes. Front. Microbiol. 2020, 11, 384. [Google Scholar] [CrossRef] [Green Version]
  12. Sullam, K.E.; Essinger, S.D.; Lozupone, C.A.; O’Connor, M.P.; Rosen, G.L.; Knight, R.; Kilham, S.S.; Russell, J.A. Environmental and ecological factors that shape the gut bacterial communities of fish: A meta-analysis. Mol. Ecol. 2012, 21, 3363–3378. [Google Scholar] [CrossRef] [Green Version]
  13. Shang, S.; Li, L.-Y.; Liu, X.-X.; Wang, J.; Tang, X.-X. Bacterial Community in the Gut of Neanthes japonica and Its Association with Surrounding Environment. Diversity 2022, 14, 514. [Google Scholar] [CrossRef]
  14. Koliada, A.; Moseiko, V.; Romanenko, M.; Piven, L.; Lushchak, O.; Kryzhanovska, N.; Guryanov, V.; Vaiserman, A. Seasonal variation in gut microbiota composition: Cross-sectional evidence from Ukrainian population. BMC Microbiol. 2020, 20, 100. [Google Scholar] [CrossRef] [PubMed] [Green Version]
  15. Li, S.-X.; Qian, Z.-J.; Yang, J.-N.; Lin, Y.-F.; Li, H.; Chen, L. Seasonal variation in structure and function of gut microbiota in Pomacea canaliculata. Ecol. Evol. 2022, 12, e9162. [Google Scholar] [CrossRef] [PubMed]
  16. Hu, X.-L.; Liu, G.; Li, Y.-M.; Wei, Y.-T.; Lin, S.-B.; Liu, S.-Q.; Zheng, Y.-L.; Hu, D.-F. High-throughput analysis reveals the seasonal variation of the gut microbiota composition within forest musk deer (Moschus berezovskii). Front. Microbiol. 2018, 9, 1674. [Google Scholar] [CrossRef]
  17. Day, A.S.; Keenan, J.I.; Tannock, G.W. The intestinal microbiota in health and disease. J. R. Soc. N. Z. 2020, 50, 367–370. [Google Scholar] [CrossRef]
  18. O’Sullivan, D.J. Methods for analysis of the intestinal microflora. Curr. Issues Intest. Microbiol. 2000, 1, 39–50. [Google Scholar]
  19. Eckburg, P.B.; Bik, E.M.; Bernstein, C.N.; Purdom, E.; Dethlefsen, L.; Sargent, M.; Gill, S.T.; Nelson, K.E.; Relman, D.A. Diversity of the human intestinal microbial flora. Science 2005, 308, 1635–1638. [Google Scholar] [CrossRef] [Green Version]
  20. Dethlefsen, L.; Huse, S.; Sogin, M.L.; Relman, D.A. The pervasive effects of an antibiotic on the human gut microbiota, as revealed by deep 16S rRNA sequencing. PLoS Biol. 2008, 6, e280. [Google Scholar] [CrossRef]
  21. Zhernakova, A.; Kurilshikov, A.; Bonder, M.J.; Tigchelaar, E.F.; Schirmer, M.; Vatanen, T.; Mujagic, Z.; Vila, A.V.; Falony, G.; Vieira-Sliva, S.; et al. Population-based metagenomics analysis reveals markers for gut microbiome composition and diversity. Science 2016, 352, 565–569. [Google Scholar] [CrossRef] [Green Version]
  22. Qin, J.-J.; Li, R.-Q.; Raes, J.; Arumugam, M.; Burgdorf, K.S.; Manichanh, C.; Nielsen, T.; Pons, N.; Levenez, F.; Yamada, T.; et al. A human gut microbial gene catalogue established by metagenomic sequencing. Nature 2010, 464, 59–65. [Google Scholar] [CrossRef] [Green Version]
  23. Liu, Z.-Q.; Yu, P.; Cai, M.-Q.; Wu, D.-L.; Zhang, M.; Chen, M.-H.; Zhao, Y.-L. Effects of microplastics on the innate immunity and intestinal microflora of juvenile Eriocheir sinensis. Sci. Total Environ. 2019, 685, 836–846. [Google Scholar] [CrossRef] [PubMed]
  24. Li, E.-C.; Xu, C.; Wang, X.-D.; Wang, S.-F.; Zhao, Q.; Zhang, M.-L.; Qin, J.G.; Chen, L.-Q. Gut microbiota and its modulation for healthy farming of Pacific white shrimp Litopenaeus vannamei. Rev. Fish. Sci. Aquac. 2018, 26, 381–399. [Google Scholar] [CrossRef]
  25. Dai, A.-Y. A new species of genus Sinopotamon (Decapoda, Brachyura). Acta Zootaxonomica Sin. 1992, 17, 283–285. (In Chinese) [Google Scholar]
  26. Dai, A.-Y. Fauna Sinica (Arthropoda: Crustacea: Malacostraca: Decapoda: Parathelphusidae, Potamidae); Science Press: Beijing, China, 1999; pp. 37–38. (In Chinese) [Google Scholar]
  27. Xie, R.-L.; Zhao, G.-F.; Yang, J.-H.; Wang, Z.-H.; Xu, Y.-P.; Zhang, X.-W.; Wang, Z.-J. eDNA metabarcoding revealed differential structures of aquatic communities in a dynamic freshwater ecosystem shaped by habitat heterogeneity. Environ. Res. 2021, 201, 111602. [Google Scholar] [CrossRef] [PubMed]
  28. Wong, S.; Rawls, J.F. Intestinal microbiota composition in fishes is influenced by host ecology and environment. Mol. Ecol. 2012, 21, 3100–3102. [Google Scholar] [CrossRef] [Green Version]
  29. Ji, Y.-K.; Sun, Y.-F.; Gao, W.; Chu, K.-L.; Wang, R.-C.; Zhao, Q.; Sun, H.-Y. Out of the Sichuan Basin: Rapid species diversification of the freshwater crabs in Sinopotamon (Decapoda: Brachyura: Potamidae) endemic to China. Mol. Phylogenet. Evol. 2016, 100, 80–94. [Google Scholar] [CrossRef]
  30. Covich, A.P.; Palmer, M.A.; Crowl, T.A. The role of benthic invertebrate species in freshwater ecosystems: Zoobenthic species influence energy flows and nutrient cycling. BioScience 1999, 49, 119–127. [Google Scholar] [CrossRef] [Green Version]
  31. Pinto, I.; Rodrigues, S.; Antunes, S.C. Assessment of the benthic macroinvertebrate communities in the evaluation of the water quality of Portuguese reservoirs: An experimental approach. Water 2021, 13, 3391. [Google Scholar] [CrossRef]
  32. Chen, S.-F.; Zhou, Y.Q.; Chen, Y.R.; Gu, J. fastp: An ultra-fast all-in-one FASTQ preprocessor. Bioinformatics 2018, 34, i884–i890. [Google Scholar] [CrossRef] [PubMed]
  33. Magoč, T.; Salzberg, S.L. FLASH: Fast length adjustment of short reads to improve genome assemblies. Bioinformatics 2011, 27, 2957–2963. [Google Scholar] [CrossRef] [PubMed] [Green Version]
  34. Edgar, R.C. UPARSE: Highly accurate OTU sequences from microbial amplicon reads. Nat. Methods 2013, 10, 996–998. [Google Scholar] [CrossRef] [PubMed]
  35. Wang, Q.; Garrity, G.M.; Tiedje, J.M.; Cole, J.R. Naive Bayesian classifier for rapid assignment of rRNA sequences into the new bacterial taxonomy. Appl. Environ. Microbiol. 2007, 73, 5261–5267. [Google Scholar] [CrossRef] [Green Version]
  36. Quast, C.; Pruesse, E.; Yilmaz, P.; Gerken, J.; Schweer, T.; Yarza, P.; Peplies, J.; Glöckner, F.O. The SILVA ribosomal RNA gene database project: Improved data processing and web-based tools. Nucleic Acids Res. 2012, 41, D590–D596. [Google Scholar] [CrossRef]
  37. Schloss, P.D.; Westcott, S.L.; Ryabin, T.; Hall, J.R.; Hartmann, M.; Hollister, E.B.; Lesniewski, R.A.; Oakley, B.B.; Parks, D.H.; Robinson, C.J.; et al. Introducing mothur: Open-source, platform-independent, community-supported software for describing and comparing microbial communities. Appl. Environ. Microbiol. 2009, 75, 7537–7541. [Google Scholar] [CrossRef] [Green Version]
  38. Caporaso, J.G.; Kuczynski, J.; Stombaugh, J.; Bittinger, K.; Bushman, F.D.; Costello, E.K.; Fierer, N.; Peña, A.G.; Goodrich, J.K.; Gordon, J.I.; et al. QIIME allows analysis of high-throughput community sequencing data. Nat. Methods 2010, 7, 335–336. [Google Scholar] [CrossRef] [Green Version]
  39. Oksanen, J.; Blanchet, F.G.; Friendly, M.; Kindt, R.; Legendre, P.; McGlinn, D.; Minchin, P.R.; O’Hara, R.B.; Simpson, G.L.; Solymos, P.; et al. Package ‘Vegan’. Community Ecology Package. Version 2.5-6. 2019. Available online: https://CRAN.R-project.org/package=vegan (accessed on 23 June 2020).
  40. Wickham, H. ggplot2: Elegant Graphics for Data Analysis, 2nd ed.; Springer Nature: Berlin/Heidelberg, Germany, 2016; pp. 189–201. [Google Scholar]
  41. R Core Team. R: A Language and Environment for Statistical Computing; R Foundation for Statistical Computing: Vienna, Austria, 2013. [Google Scholar]
  42. Segata, N.; Izard, J.; Waldron, L.; Gevers, D.; Miropolsky, L.; Garrett, W.S.; Huttenhower, C. Metagenomic biomarker discovery and explanation. Genome Biol. 2011, 12, R60. [Google Scholar] [CrossRef] [Green Version]
  43. Langille, M.G.I.; Zaneveld, J.; Caporaso, J.G.; McDonald, D.; Knights, D.; Reyes, J.A.; Clemente, J.C.; Burkepile, D.E.; Thurber, R.L.V.; Knight, R.; et al. Predictive functional profiling of microbial communities using 16S rRNA marker gene sequences. Nat. Biotechnol. 2013, 31, 814–821. [Google Scholar] [CrossRef]
  44. Tong, Q.; Hu, Z.-F.; Du, X.-P.; Bie, J.; Wang, H.-B. Effects of seasonal hibernation on the similarities between the skin microbiota and gut microbiota of an Amphibian (Rana dybowskii). Microb. Ecol. 2020, 79, 898–909. [Google Scholar] [CrossRef]
  45. Stoffel, M.A.; Acevedo-Whitehouse, K.; Morales-Durán, N.; Grosser, S.; Chakarov, N.; Krüger, O.; Nichols, H.J.; Elorriaga-Verplancken, F.R.; Hoffman, J.I. Early sexual dimorphism in the developing gut microbiome of northern elephant seals. Mol. Ecol. 2020, 29, 2109–2122. [Google Scholar] [CrossRef] [Green Version]
  46. Pierce, M.L.; Ward, J.E.; Holohan, B.A.; Zhao, X.-W.; Hicks, R.E. The influence of site and season on the gut and pallial fluid microbial communities of the eastern oyster, Crassostrea virginica (Bivalvia, Ostreidae): Community-level physiological profiling and genetic structure. Hydrobiologia 2016, 765, 97–113. [Google Scholar] [CrossRef]
  47. Fan, C.; Zhang, L.-Z.; Jia, S.-G.; Tang, X.-J.; Fu, H.-B.; Li, W.-J.; Liu, W.-J.; Liu, C.-F.; Zhang, H.; Cheng, Q.; et al. Seasonal variations in the composition and functional profiles of gut microbiota reflect dietary changes in plateau pikas. Integr. Zool. 2022, 17, 379–395. [Google Scholar] [CrossRef] [PubMed]
  48. Dulski, T.; Kozłowski, K.; Ciesielski, S. Habitat and seasonality shape the structure of tench (Tinca tinca L.) gut microbiome. Sci. Rep. 2020, 10, 4460. [Google Scholar] [CrossRef] [PubMed] [Green Version]
  49. Sun, P.; Jin, M.; Ding, L.-Y.; Lu, Y.; Ma, H.-N.; Yuan, Y.; Zhou, Q.-C. Dietary lipid levels could improve growth and intestinal microbiota of juvenile swimming crab, Portunus trituberculatus. Aquaculture 2018, 490, 208–216. [Google Scholar] [CrossRef]
  50. Hao, Y.-W.; Guan, W.; Wu, H.-N.; Li, L.-H.; Abe, E.M.; Xue, J.-B.; Qin, Z.-Q.; Wang, Q.; Lv, S.; Xu, J.; et al. Intestinal microbiome profiles in Oncomelania hupensis in mainland China. Acta Trop. 2020, 201, 105202. [Google Scholar] [CrossRef] [PubMed]
  51. Zhang, Z.-T.; Liu, J.-L.; Jin, X.-X.; Liu, C.; Fan, C.-W.; Guo, L.; Liang, Y.-X.; Zheng, J.-S.; Peng, N. Developmental, dietary, and geographical impacts on gut microbiota of red swamp crayfish (Procambarus clarkii). Microorganisms 2020, 8, 1376. [Google Scholar] [CrossRef]
  52. Chen, X.-W.; Lu, D.-Y.; Li, Z.-H.; Yue, W.-C.; Wang, J.; Jiang, X.-Y.; Han, H.; Wang, C.-H. Plant and animal-type feedstuff shape the gut microbiota and metabolic processes of the Chinese mitten crab Eriocheir sinensis. Front. Vet. Sci. 2021, 8, 589624. [Google Scholar] [CrossRef]
  53. Yang, J.-C.; Zhang, Q.-Q.; Zhang, T.-L.; Wang, S.-Y.; Hao, J.-W.; Wu, Z.-B.; Li, A.-H. Comparative analusis of the symbiotic microbiota in the Chinese mitten crab (Eriocheir sinensis): Microbial structure, co-occurrence patterns, and predictive functions. Microorganisms 2023, 11, 544. [Google Scholar] [CrossRef]
  54. Wei, H.-L.; Wang, H.; Tang, L.; Mu, C.-K.; Ye, C.-Y.; Chen, L.-Z.; Wang, C.-L. High-throughput sequencing reveals the core gut microbiota of the mud crab (Scylla paramamosain) in different coastal regions of southern China. BMC Genom. 2019, 20, 829. [Google Scholar] [CrossRef]
  55. Wei, H.-L.; Li, X.; Tang, L.; Yao, H.-Z.; Ren, Z.-M.; Wang, C.-L.; Mu, C.-K.; Shi, C.; Wang, H. 16S rRNA gene sequencing reveals the relationship between gut microbiota and ovarian development in the swimming crab Portunus trituberculatus. Chemosphere 2020, 254, 126891. [Google Scholar] [CrossRef] [PubMed]
  56. Turnbaugh, P.J.; Bäckhed, F.; Fulton, L.; Gordon, J.I. Diet-induced obesity is linked to marked but reversible alterations in the mouse distal gut microbiome. Cell Host Microbe 2008, 3, 213–223. [Google Scholar] [CrossRef] [PubMed] [Green Version]
  57. Becker, A.A.; Hesta, M.; Hollants, J.; Janssens, G.P.; Huys, G. Phylogenetic analysis of faecal microbiota from captive cheetahs reveals underrepresentation of Bacteroidetes and Bifidobacteriaceae. BMC Microbiol. 2014, 14, 43. [Google Scholar] [CrossRef] [Green Version]
  58. Wu, X.-Y.; Zhang, H.-H.; Chen, J.; Shang, S.; Wei, Q.-G.; Yan, J.-K.; Tu, X.-Y. Comparison of the fecal microbiota of dholes high-throughput Illumina sequencing of the V3–V4 region of the 16S rRNA gene. Appl. Microbiol. Biotechnol. 2016, 100, 3577–3586. [Google Scholar] [CrossRef] [PubMed]
  59. Wexler, A.G.; Goodman, A.L. An insider’s perspective: Bacteroides as a window into the microbiome. Nat. Microbiol. 2017, 2, 17026. [Google Scholar] [CrossRef] [Green Version]
  60. Murphy, E.F.; Cotter, P.D.; Healy, S.; Marques, T.M.; O’Sullivan, O.; Fouhy, F.; Clarke, S.F.; O’Toole, P.W.; Quigley, E.M.; Stanton, C.; et al. Composition and energy harvesting capacity of the gut microbiota: Relationship to diet, obesity and time in mouse models. Gut 2010, 59, 1635–1642. [Google Scholar] [CrossRef]
  61. Holt, C.C.; Bass, D.; Stentiford, G.D.; van der Giezen, M. Understanding the role of the shrimp gut microbiome in health and disease. J. Invertebr. Pathol. 2021, 186, 107387. [Google Scholar] [CrossRef]
  62. You, Z.-Q.; Deng, J.; Liu, J.-L.; Fu, J.-H.; Xiong, H.; Luo, W.; Xiong, J.-L. Seasonal variations in the composition and diversity of gut microbiota in white-lipped deer (Cervus albirostris). PeerJ 2022, 10, e13753. [Google Scholar] [CrossRef] [PubMed]
  63. Huang, G.-P.; Qu, Q.-Y.; Wang, M.; Huang, M.-P.; Zhou, W.-L.; Wei, F.-W. Global landscape of gut microbiome diversity and antibiotic resistomes across vertebrates. Sci. Total Environ. 2022, 838, 156178. [Google Scholar] [CrossRef]
  64. Sun, F.-L.; Xu, Z.-T. Significant differences in intestinal microbial communities in aquatic animals from an aquaculture area. J. Mar. Sci. Eng. 2021, 9, 104. [Google Scholar] [CrossRef]
  65. Sun, Y.-F.; Han, W.-F.; Liu, J.; Liu, F.; Cheng, Y.-X. Microbiota comparison in the intestine of juvenile Chinese mitten crab Eriocheir sinensis fed different diets. Aquaculture 2020, 515, 734518. [Google Scholar] [CrossRef]
  66. Fraune, S.; Zimmer, M. Host-specificity of environmentally transmitted Mycoplasma-like isopod symbionts. Environ. Microbiol. 2008, 10, 2497–2504. [Google Scholar] [CrossRef] [PubMed]
  67. Kostanjšek, R.; Štrus, J.; Avguštin, G. “Candidatus Bacilloplasma”, a novel lineage of Mollicutes associated with the hindgut wall of the terrestrial isopod Porcellio scaber (Crustacea: Isopoda). Appl. Environ. Microbiol. 2007, 73, 5566–5573. [Google Scholar] [CrossRef] [PubMed] [Green Version]
  68. Wang, C.-H.; Zhou, Y.-F.; Lv, D.-W.; Ge, Y.; Li, H.; You, Y. Change in the intestinal bacterial community structure associated with environmental microorganisms during the growth of Eriocheir sinensis. MicrobiologyOpen 2019, 8, e00727. [Google Scholar] [CrossRef] [Green Version]
  69. Rameshkumar, G.; Ravichandran, S.; Chandrasekar; Ajithkumar, T. Gut microbiota of crabs from the Vellar estuary, southeast coast of India. Microb. Ecol. Health Dis. 2009, 21, 178–182. [Google Scholar]
  70. Zhang, Z.; Li, B.; Wang, Y.-G.; Liao, M.-J.; Wang, L.; Rong, X.-J. The microflora structure in digestive tract of half-smooth tongue sole (Cynoglossus semilaevis Günther) cultured in outdoor pond basing on high-through sequencing technique. Acta Hydrobiol. Sin. 2015, 39, 38–45. [Google Scholar]
  71. Wang, X.-F.; Zhao, Y.-F.; Song, Z.-F.; Zhong, S.-P.; Huang, G.-Q.; Tong, T.; Nie, Z.-P.; Su, Q.; Yang, J.-L. Application of high-throughput sequencing techniques for analyzing bacterial communities in pond-raised mud crab (Scylla paramamosain) intestine and its aquaculture environment. J. Fish. Sci. China 2017, 24, 1245–1253. [Google Scholar] [CrossRef]
  72. Sun, Y.-G.; Zhang, S.-S.; Nie, Q.-X.; He, H.-J.; Tan, H.-Z.; Geng, F.; Ji, H.-H.; Hu, J.-L.; Nie, S.P. Gut firmicutes: Relationship with dietary fiber and role in host homeostasis. Crit. Rev. Food Sci. Nutr. 2022, 1–16. [Google Scholar] [CrossRef]
  73. Ghai, R.; Rodŕíguez-Valera, F.; McMahon, K.D.; Toyama, D.; Rinke, R.; Cristina Souza de Oliveira, T.; Garcia, J.T.; de Miranda, F.P.; Henrique-Silva, F. Metagenomics of the water column in the pristine upper course of the Amazon river. PLoS ONE 2011, 6, e23785. [Google Scholar] [CrossRef]
  74. Zhang, M.-L.; Sun, Y.-H.; Chen, L.-Q.; Cai, C.-F.; Qiao, F.; Du, Z.-Y.; Li, E.-C. Symbiotic bacteria in gills and guts of Chinese mitten crab (Eriocheir sinensis) differ from the free-living bacteria in water. PLoS ONE 2016, 11, e0148135. [Google Scholar] [CrossRef]
  75. Xavier, R.; Soares, M.C.; Silva, S.M.; Banha, F.; Gama, M.; Ribeiro, L.; Anastácio, P.; Cardoso, S.C. Environment and host-related factors modulate gut and carapace bacterial diversity of the invasive red swamp crayfish (Procambarus clarkii). Hydrobiologia 2021, 848, 4045–4057. [Google Scholar] [CrossRef]
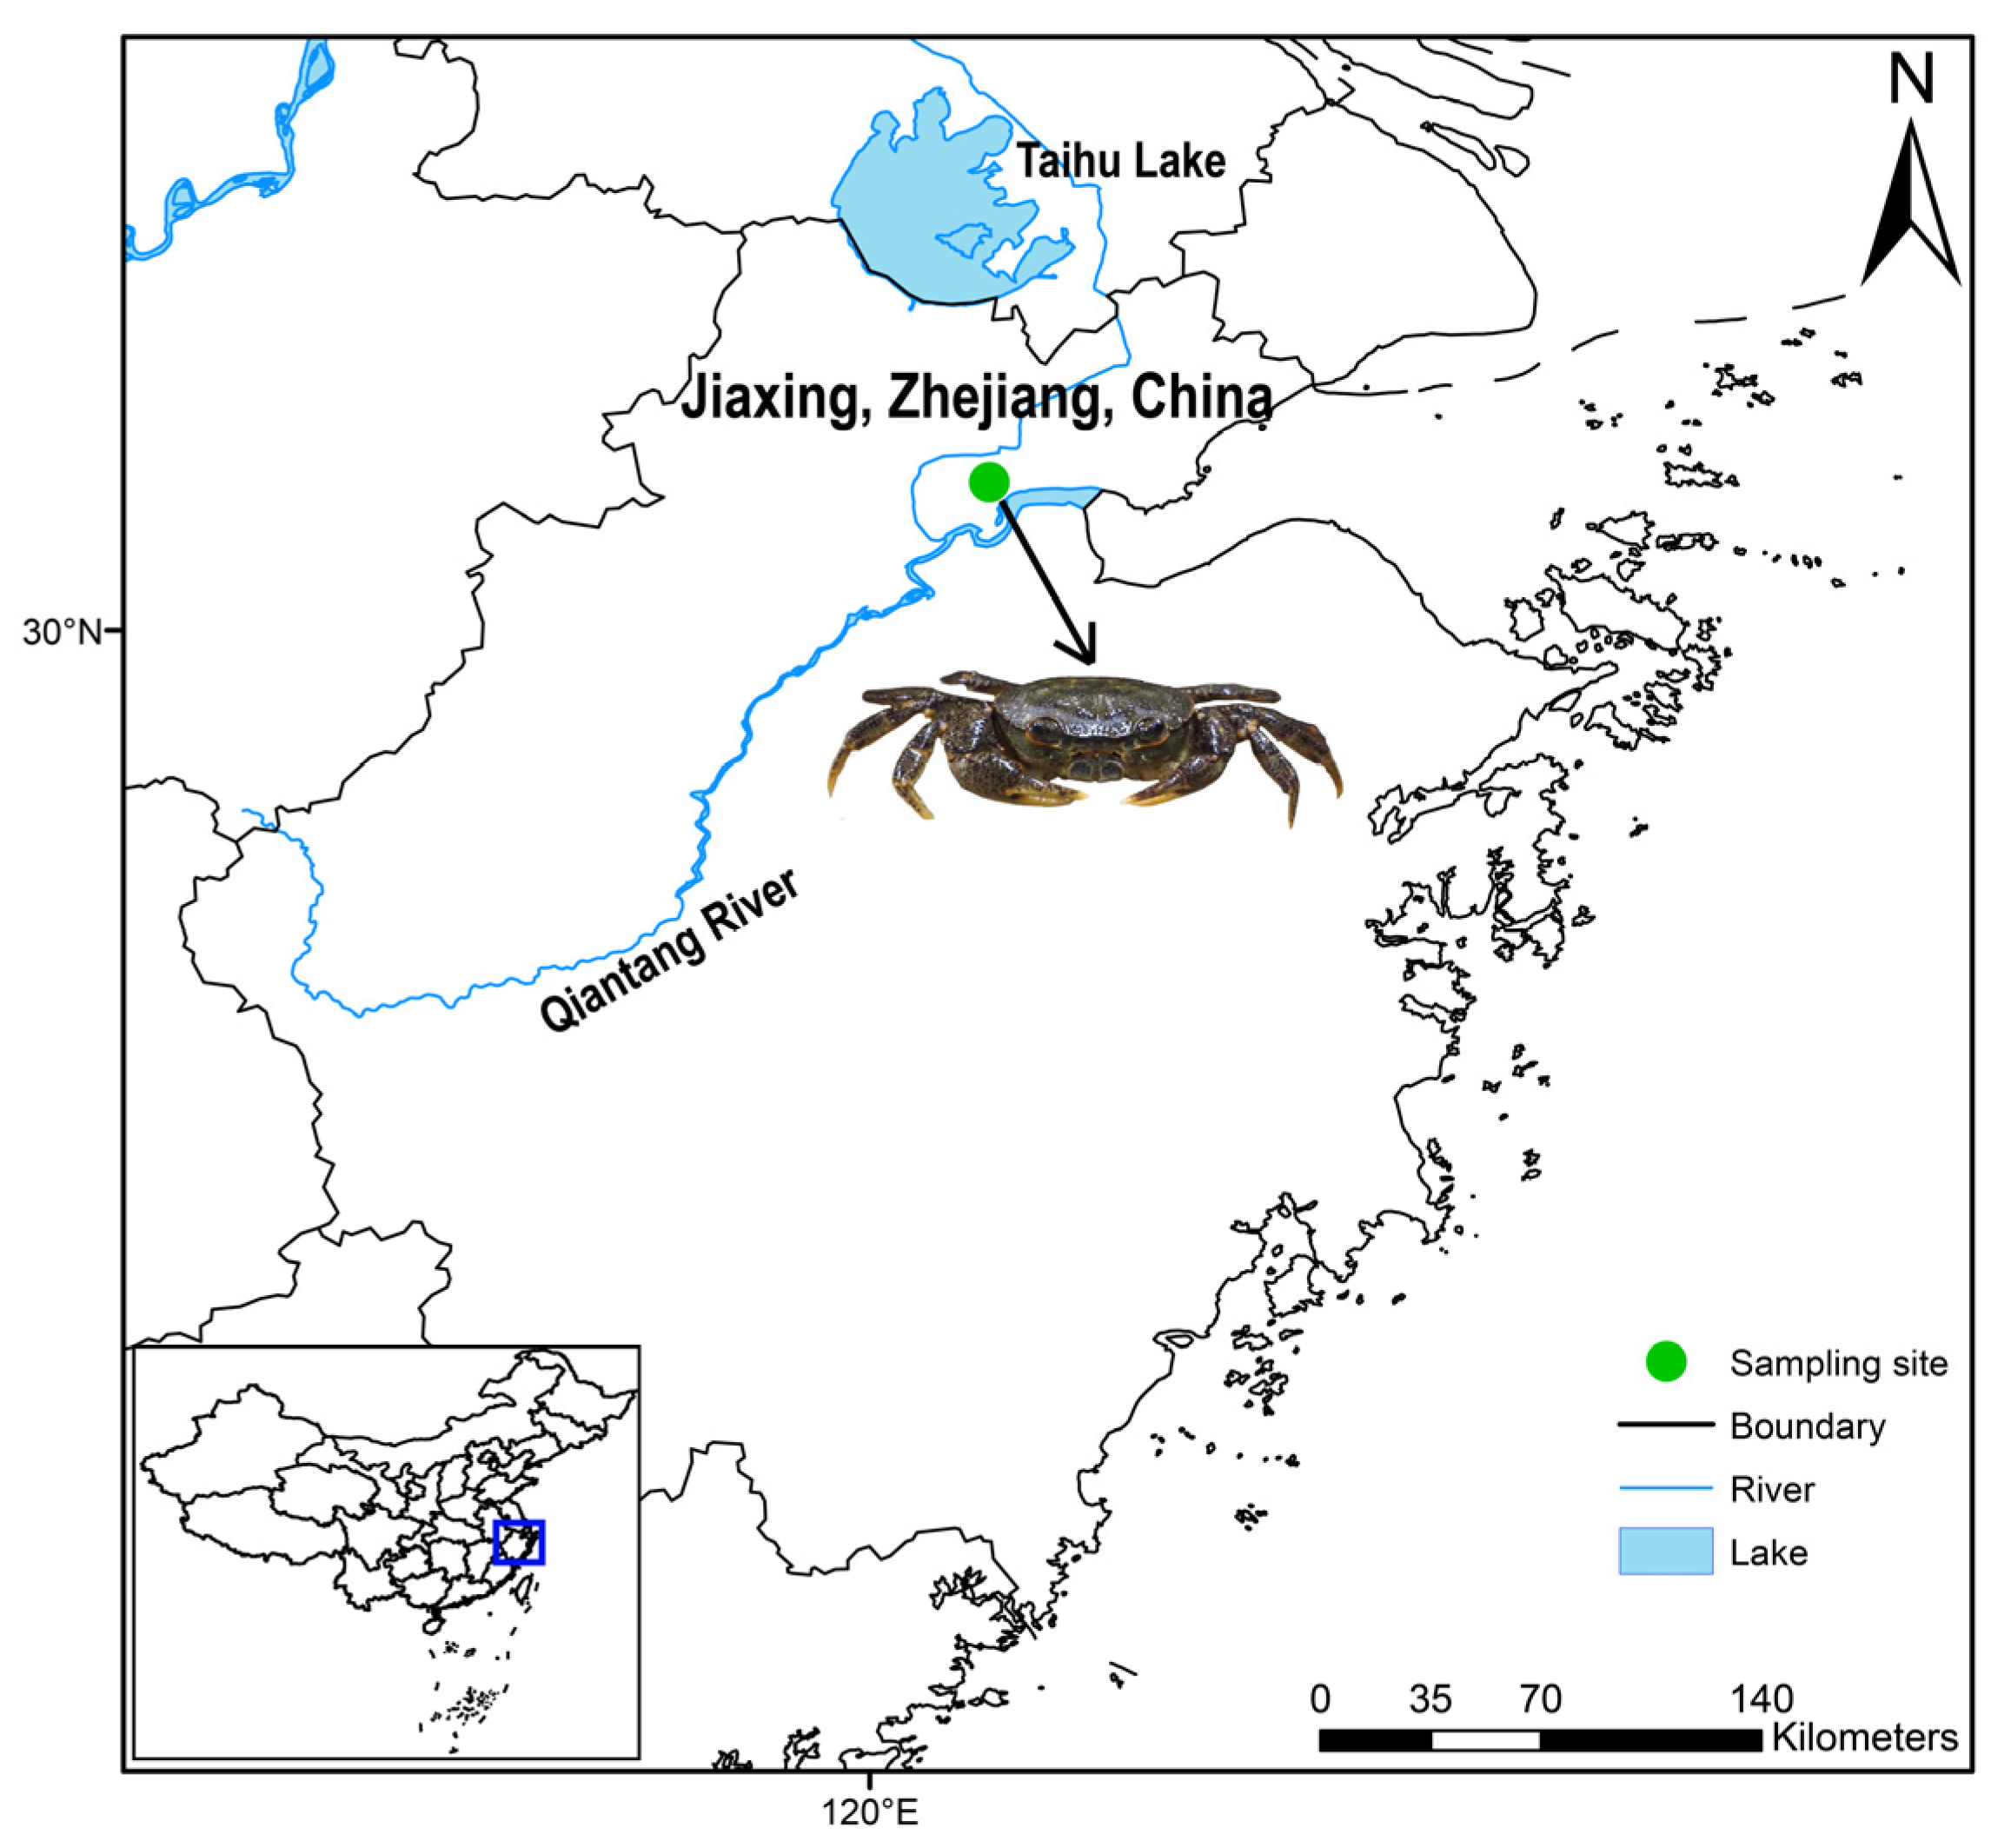
Figure 1. The sampling site and photo of Sinopotamon planum (Authors’ own).
Diversity 15 00519 g001
Figure 2. Comparison of gut microbiome alpha diversity index in the studied seasons of Sinopotamon planum. (a) Ace index; (b) Chao1 index; (c) Shannon index; (d) Simpson index. Significant differences were marked as “**” (p <  0.01) and “***” (p <  0.001).
Diversity 15 00519 g002
Figure 3. Composition of the bacterial community of Sinopotamon planum in the studied seasons (mean relative abundance > 1%). (a) At the phylum level; (b) at t the genus level.
Diversity 15 00519 g003
Figure 4. PCoA analysis based on (a) Bray–Curtis and (b) unweighted–UniFrac distances, and NMDS analysis based on (c) Bray–Curtis and (d) unweighted–UniFrac distances of the gut microbiome from the studied seasons.
Diversity 15 00519 g004
Figure 5. Venn diagram based on OTU level in the studied seasons (a) and classification of shared OTUs at the phylum level (b).
Diversity 15 00519 g005
Figure 6. LEfSe analysis of Sinopotamon planum gut microbiota at the phylum (a) and genus (b) level, and comparison of gut microbiota composition abundances of S. planum at the phylum (c) and genus (d) level in the studied seasons. Significant differences were marked as “*” (p <  0.05), “**” (p <  0.01), and “***” (p <  0.001).
Diversity 15 00519 g006
Figure 7. (a) Gut microbiota predicts metabolic functions from the EggNOG database. Relative abundance column diagram of microbiota functions based on the KEGG database. (b) Microbiota functions are shown on the first level; (c) microbiota functions are shown on the second level.
Diversity 15 00519 g007
Figure 8. Differences in alpha diversity indexes between gut microbes and surrounding water microorganisms ((a) Ace, (b) Chao1, (c) Shannon, (d) Simpson). PCoA analysis with (e) Bray–Curtis and (f) unweighted–UniFrac distances of community composition between gut microbes and surrounding water microorganisms.
Diversity 15 00519 g008
Figure 9. (a) Bacterial community composition at the phylum level of gut and water groups; (b) Heatmap of the relative abundance at the genus level among two groups.
Diversity 15 00519 g009
Disclaimer/Publisher’s Note: The statements, opinions and data contained in all publications are solely those of the individual author(s) and contributor(s) and not of MDPI and/or the editor(s). MDPI and/or the editor(s) disclaim responsibility for any injury to people or property resulting from any ideas, methods, instructions or products referred to in the content.