Article

Assessment of the Genetic Diversity and Population Structure of the Peruvian Andean Legume, Tarwi (Lupinus mutabilis), with High Quality SNPs

by
Amelia Huaringa-Joaquin
1,
Carla L. Saldaña
2,
David Saravia
1,2,
Sady García-Bendezú
3,
Pedro Rodriguez-Grados
4,
Wilian Salazar
2,
Felix Camarena
1,
Pedro Injante
2 and
Carlos I. Arbizu
2,*
1
Departamento de Fitotecnia, Facultad de Agronomía, Universidad Nacional Agraria La Molina, Av. La Molina s/n, Lima 15024, Peru
2
Dirección de Desarrollo Tecnológico Agrario, Instituto Nacional de Innovación Agraria (INIA), Av. La Molina 1981, Lima 15024, Peru
3
Departamento de Suelos, Facultad de Agronomía, Universidad Nacional Agraria La Molina, Av. La Molina s/n, Lima 15024, Peru
4
Facultad de Ciencias, Universidad Nacional José Faustino Sánchez Carrión, Av. Mercedes Indacochea Nro. 609, Huacho 15136, Peru
*
Author to whom correspondence should be addressed.
Diversity 2023, 15(3), 437; https://doi.org/10.3390/d15030437
Submission received: 19 January 2023 / Revised: 3 March 2023 / Accepted: 11 March 2023 / Published: 16 March 2023

Abstract

:
Lupinus mutabilis Sweet (Fabaceae), “tarwi” or “chocho”, is an important grain legume in the Andean region. In Peru, studies on tarwi have mainly focused on morphological features; however, they have not been molecularly characterized. Currently, it is possible to explore the genetic parameters of plants with reliable and modern methods such as genotyping by sequencing (GBS). Here, for the first time, we used single nucleotide polymorphism (SNP) markers to infer the genetic diversity and population structure of 89 accessions of tarwi from nine Andean regions of Peru. A total of 5922 SNPs distributed along all chromosomes of tarwi were identified. STRUCTURE analysis revealed that this crop is grouped into two clusters. A dendrogram was generated using the UPGMA clustering algorithm and, like the principal coordinate analysis (PCoA), it showed two groups that correspond to the geographic origin of the tarwi samples. AMOVA showed a reduced variation between clusters (7.59%) and indicated that variability within populations is 92.41%. Population divergence (Fst) between clusters 1 and 2 revealed low genetic difference (0.019). We also detected a negative Fis for both populations, demonstrating that, like other Lupinus species, tarwi also depends on cross-pollination. SNP markers were powerful and effective for the genotyping process in this germplasm. We hope that this information is the beginning of the path towards a modern genetic improvement and conservation strategies of this important Andean legume.

1. Introduction

Lupinus mutabilis Sweet (Fabaceae), also known as “tarwi”, “tarhui” or “chocho” is a legume cultivated in the Andean region in South America [1]. Tarwi has had an important part in the diet since pre-Hispanic times [2]. It contains important nutritionally compounds, mainly due to its protein values, which vary from 32% to 51.6% (rich in globulins, 43–45% and albumins, 8–9%) [3], high oil content (13–24%), crude fiber (6.2–11%), minerals, such as iron, magnesium and phosphorus, and bioactive compounds with proven antioxidant capacity, such as isoflavones and phenols [4]. These nutrient levels present in tarwi are even better than those in soybeans [5]. Owing these qualities, tarwi constitutes an alternative crop that could help to reduce malnutrition, and is considered as the emerging protein crop for Europe and temperate climate zones [6]. Likewise, its adaptation to altitudes of 3100 to 3850 m.a.s.l., temperate climate, and influence of the length of the day, makes it tolerant to low temperatures (−2 °C) in the initial stages. It requires around 350 to 800 mm of rain, and can grow for 240 to 300 days [7]. Furthermore, since this crop can be cultivated on marginal lands, under drought stress, mostly without tilling the land and with limited agronomic practices, it is considered a species that is resilient to the impact of climate change. Likewise, it possesses the ability to fix atmospheric nitrogen and mobilize phosphorus, which promotes agroecological production [8]. On the other hand, tarwi presents key domestication characteristics, including indehiscent pods and permeable seeds with tegument, which means it is a locally important crop in several Andean areas [9]. Tarwi ecotypes from northern Peru are bushy, decumbent in growth and generally have a prominent stem; whereas the ecotypes of the central and southern zone have herbaceous and bushy, with semi-erect growth and a non-prominent stem. In addition, the vegetative period varies from 180 to 270 days [8].
L. piurensis is indicated as the probable wild progenitor of L. mutabilis. Atchison et al. [2] generated nextRAD sequence data for 212 accessions of Andean Lupinus, representing 63 species, and resolved relationships between species that diverged over time, shedding light on the origins of domestication. Camillo et al. [10] evaluated accessions from 22 populations of 16 Lupinus species, and showed that L. mutabilis and L. semperflorens, among 13 other species, presented 2n = 48 chromosomes; whereas L. bandelierae presented 2n = 36 chromosomes. They also suggested that, cytologically, Andean lupines are more closely related to North American species than those of South America [10]. Guilengue et al. [6] also evaluated the associations between genome size and morphological characters using Spearman’s correlation analysis for 23 accessions, finding that no individual morphological trait presented a strong correlation with genome size [6]. The L. mutabilis introduced to the Mediterranean area shows a wide intraspecific genetic variability in collections, which allows the establishment of conservation and improvement programs [6].
Currently, L. mutabilis remains a poorly studied crop in the field of genetics. Chirinos-Arias et al. [11] indicated that the inter-accession genetic modification in L. mutabilis, according to the accessions and ISSR markers evaluated, is considerable. They reported that L. mutabilis is an autogamous plant with a considerable degree of allogamy. Ruiz-Gil et al. [12] carried out a morphometric analysis using the flower characteristics of lupin and, based on canonical analysis, they identified three different groups: (1) L. mutabilis, (2) L. piurensis and (3) individuals with intermediate characteristics. Allo and autopolyploidization events, along with other chromosomal rearrangements, during the evolution of this species could have led to duplication and/or triplication of genome regions, as reported in the Old World species, L. angustifolius [13].
Molecular data has increased the understanding of plant systematics at various taxonomic levels [14]. The genetic similarity between genotypes can be assessed with DNA markers [15], it can also help to select accessions for establishing a core collection. Genotyping by sequencing (GBS) is one such method of variant sequence identification that uses next generation sequencing technology, producing a powerful and cost-effective genotyping process [16]. Its application has been reported in different crops such as dry bean [17], potato [18], reed canary grass [19], lentils [20], maize [21], barley [22], rice [23], soybean [24], switchgrass [25], and wheat [26]. Thus, the objective of this study was to characterize a collection of tarwi germplasm, currently maintained by the Grain Legumes and Oilseeds Research Program of the National Agrarian University—La Molina (UNALM for its acronym in Spanish), to gain a better understanding of the genetic diversity and population structure of this legume by employing an NGS technique.

2. Materials and Methods

2.1. Plant Material and DNA Extraction

The experimental material of tarwi was obtained from the Germplasm Bank of the Grain Legumes and Oilseeds Research Program of UNALM. Young leaves from 89 accessions were collected in labeled paper envelopes and stored in plastic containers with silica gel for the preservation of samples during transport to the National Institute of Agricultural Innovation (INIA for its acronym in Spanish) for genomic DNA extraction. Further details of the samples examined in this work are in Table S1. Genomic DNA was extracted using the CTAB method [27] adapted for this species. Leaves were grounded with liquid nitrogen and 100 mg of this tissue was used. DNA quantity and quality were evaluated by detecting fluorescent dyes using the Qubit4 Fluorometer (Invitrogen, Waltham, MA, USA), according to the Qubit 4 Quick Reference Guide, and agarose gel (1%), respectively.

2.2. Genotyping by Sequencing Data

DNA samples were sent to the Biotechnology Center at the University of Wisconsin-Madison for DNA sequencing. A GBS library was prepared following Elshire et al. [16] protocol. Briefly, genomic DNA was digested using a methylation-sensitive restriction enzyme, ApeKI (New England Biolabs, Ipswich, MA, USA) with recognition site GCWGC, where W is A or T, after which barcoded adapters amenable to Illumina sequencing were added by ligation with T4 ligase (New England Biolabs, Ipswich, MA, USA). Adapter-ligated samples were pooled and amplified to provide library quantities amenable to sequencing, and adapter dimers were removed by SPRI bead purification (AxyPrepTM Mag PCR Clean-Up Kit, Corning Life Sciences, Corning, NY, USA). Quality and quantity of the finished libraries were assessed by using an Agilent Bioanalyzer High Sensitivity Chip (Agilent Technologies, Inc., Santa Clara, CA, USA) and a Qubit dsDNA HS Assay Kit (Life Technologies, Grand Island, NY, USA), respectively. Libraries were then standardized to 2 nM. Clusters were generated with HiSeq SR Cluster Kit v3 cBot kits (Illumina Inc., San Diego, CA, USA). The GBS library was subjected to a single run using an Illumina HiSeq 2500 platform, with 2 × 150 bp pair-end sequencing. Images were analyzed with a standard Illumina Pipeline, version 1.8.2. Quality control of the raw data was performed with FastQC software (https://www.bioinformatics.babraham.ac.uk/projects/fastqc/, accessed on 10 December 2022). Data were then analyzed using the TASSEL-5 GBS v2 pipeline [28,29]. A reference genome of L. mutabilis is currently not available, therefore, we used the available reference genome of the closest species (L. angustifolius) (NC_032009) [30]. GBS sequence tags were identified in the FASTQ files, indicating that the restriction enzyme used was ApeKI and the barcode for each sample was used for the preparation of libraries. We then used the GBSSeqToTagDBPlugin to convert GBS to a unique tag database with the default parameter, minimum base quality score of 20. Only reads that had a complete barcode sequence were considered. Then, the TagExportToFastqPlugin was used and unique tags of each sequence were indexed to produce a tag count file for each sample in FASTQ text format (the –t argument was used), which was then used as input to the Burrows–Wheeler Aligner (BWA) v.0.7.17 program [31] to align all the tags with the reference genome (NC_032009). The output file in SAM format was transformed into a binary file using the SAMToGBSdbPlugin pipeline. DiscoverySNPCallerPluginV2 was used to identify SNPs from the aligned tags and position and allele data. Finally, the quality score for SNP positions was identified. Data curation was conducted using VCFtools v.0.1.15 [32] with the following parameters: (i) minimum minor allele frequency of 0.1, (ii) maximum minor allele frequency of 1, (iii) number of alleles two, and (iv) maximum missing data of 0.9. The VCF file was used as input to the SNPRelate package v.1.20.1 [33] for another filtering process that included: (i) remotion of multi-allelic, monomorphic SNP positions, and (ii) removal of SNPs with a linkage disequilibrium (R-square value) of more than 0.2.

2.3. Phylogenetic Analysis

We constructed a phylogenetic tree from a distance matrix using R software v.4.2.1 [34]. To calculate genetic distances, Provesti’s coefficient [35] was considered, then a dendrogram was obtained with the unweighted pair-group method with arithmetic mean (UPGMA) clustering algorithm with 1000 bootstrap replicates from poppr package v.2.9.2 [36]. Argument dudi.pco of ade4 v.1.7–16 package [37] was employed in R to conduct a principal coordinate analysis (PCoA). The tree was viewed in FigTree v.1.4.4 (http://tree.bio.ed.ac.uk/software/figtree/, accessed on 4 January 2023).

2.4. Population Structure and Genetic Diversity

We determined the population structure in 89 accessions of tarwi using our SNP data set. To convert VCF data sets to STRUCTURE format, we used PLINK PED [38] with --plink option in VCFtools software and PGSpider v.2.1.1.5 software [39]. Finally, we employed STRUCTURE software v.2.3.4 [40] with populations (K value) ranging from 1 to 15, replicated 10 times, with a burn−in length of 20,000 and 50,000 Monte Carlo iterations. The results produced by STRUCTURE were processed in STRUCTURE HARVESTER software [41], and we detected the most probable number of clusters in our data using Delta K values [42]. Finally, to discriminate populations across all ten iterations of the selected K values, we used the pophelper package v.2.3.1 [43] in R software.

3. Results

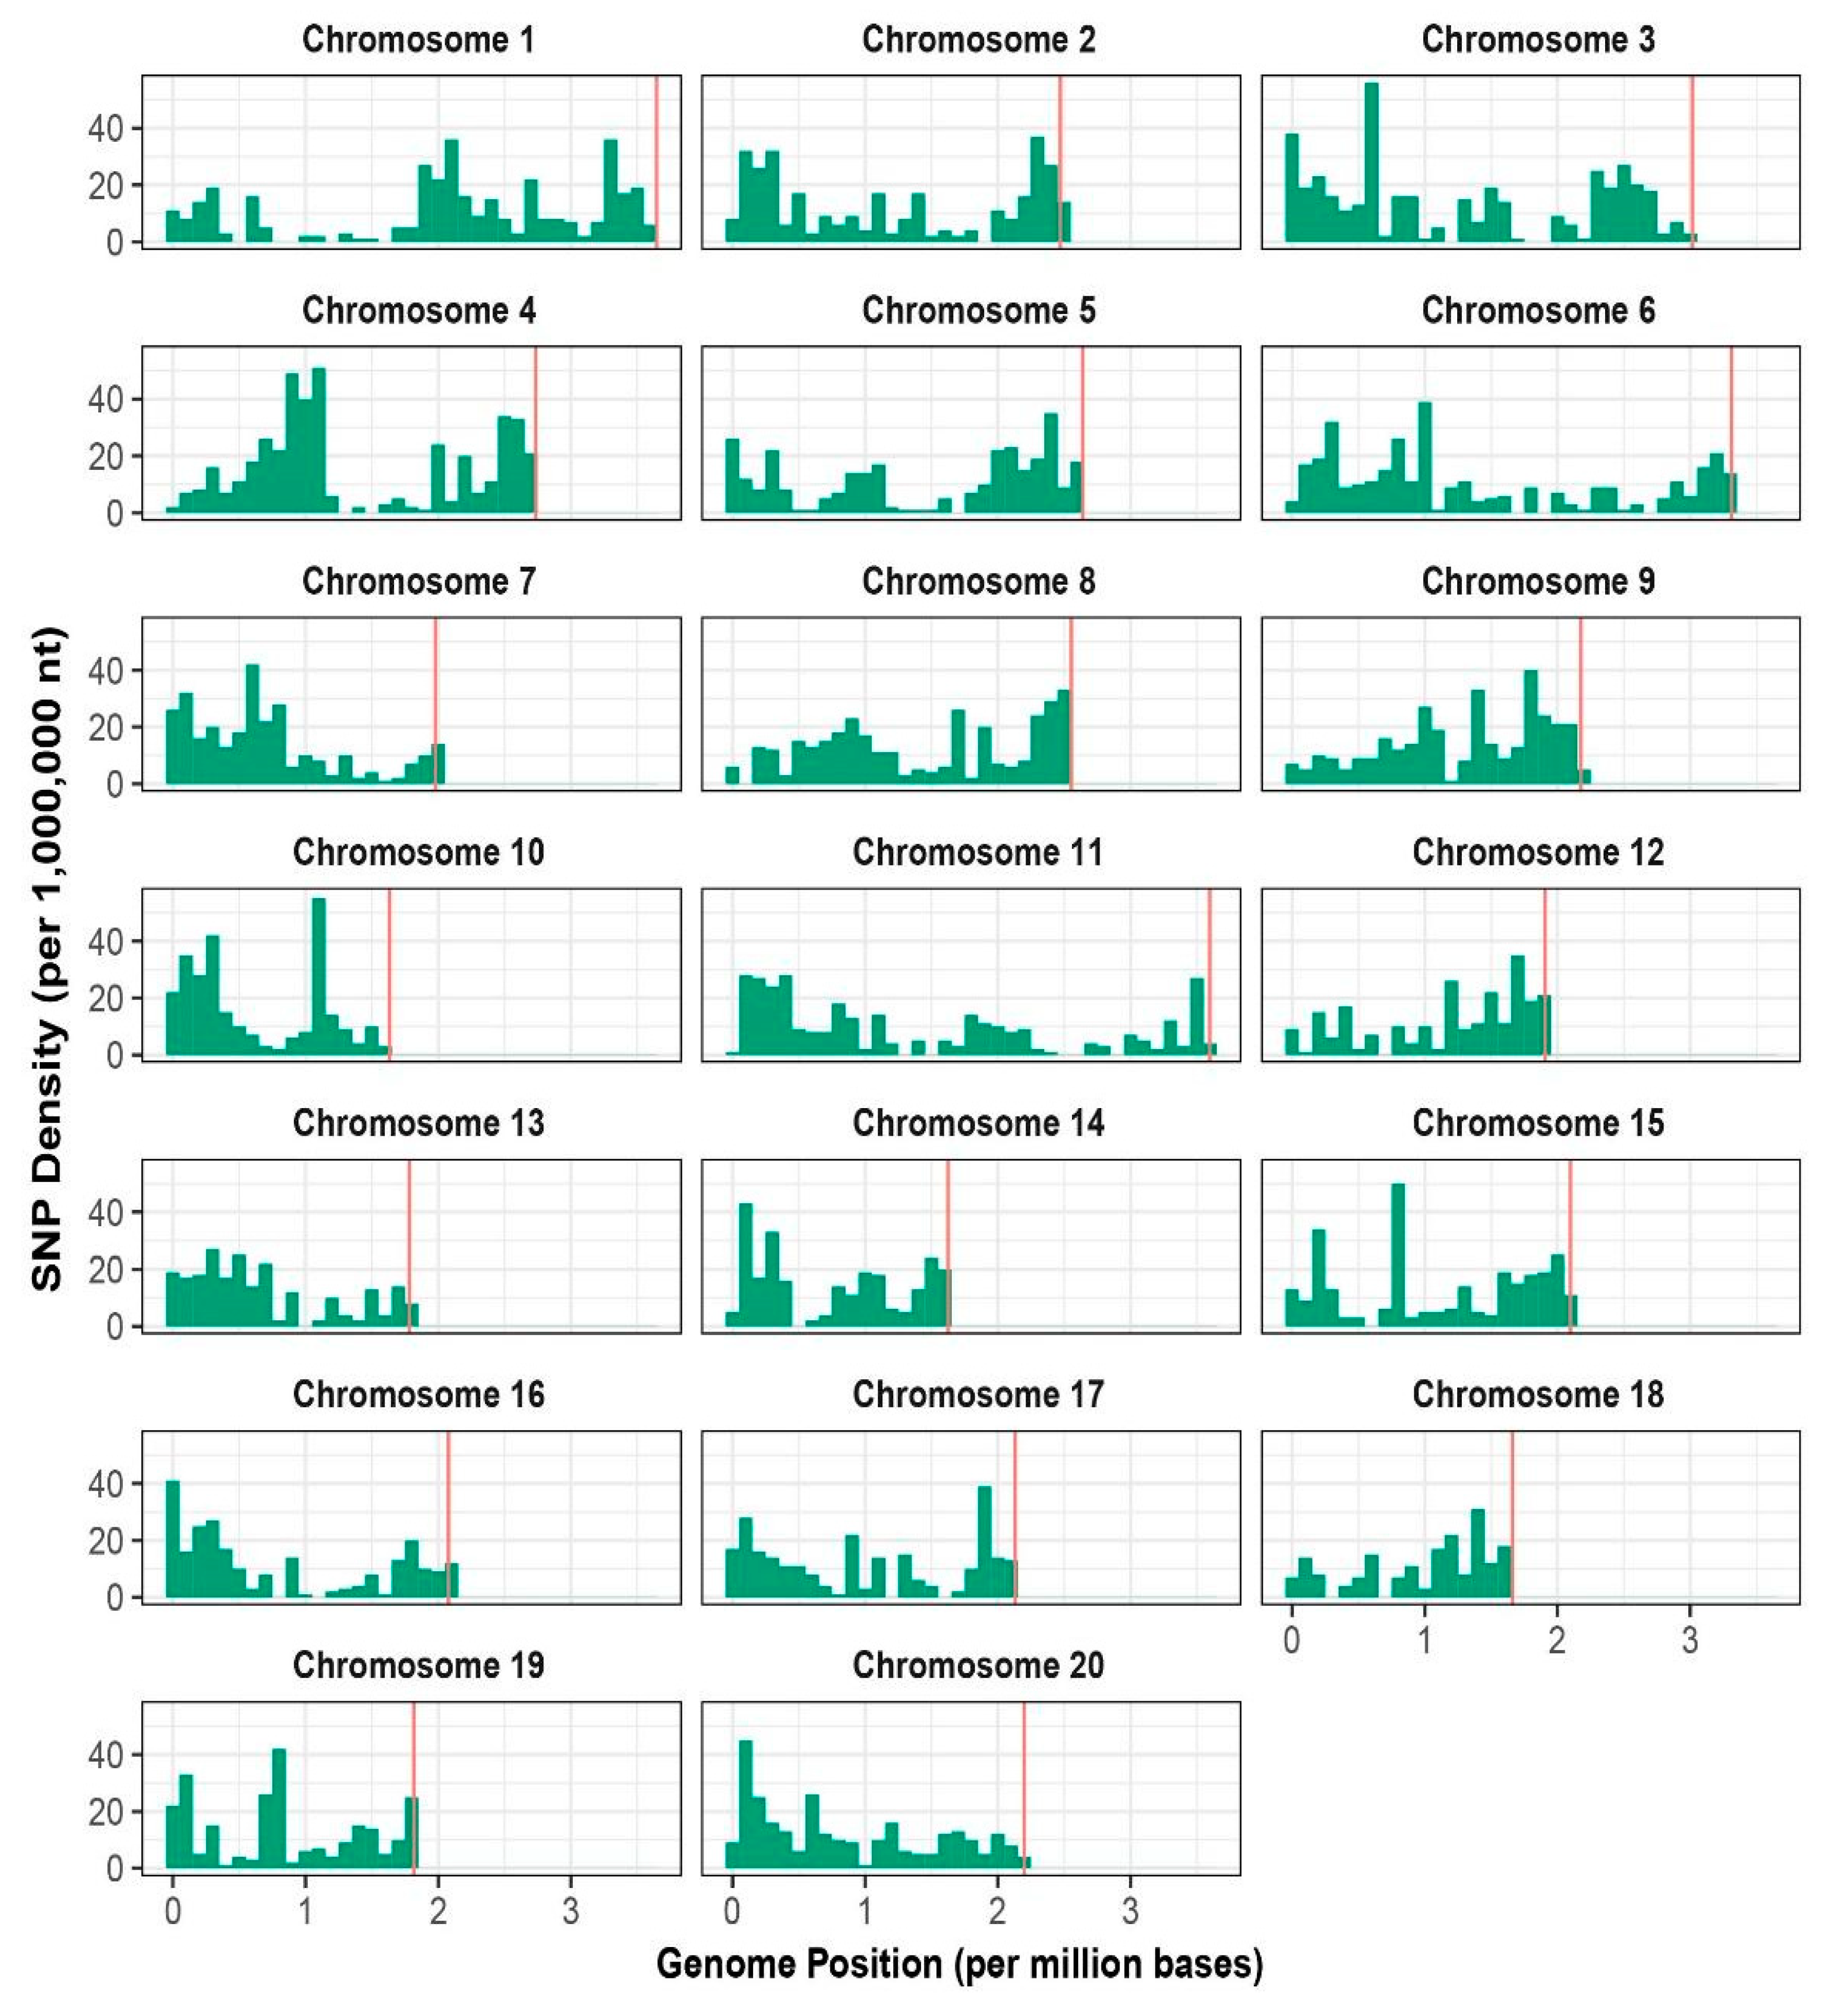
3.1. Sequencing and Distribution of SNPs

After filtering out the raw reads, the total of demultiplexed reads for all 89 genotypes was 579.02 M, with the average reads per accession being 6.51 M. We followed the approach of Arbizu et al. [44] and Martínez-Flores et al. [45] and obtained 338,638 read tags, 36.06% of them uniquely aligned to the L. angustifolius reference genome [30]. A total of 35,760 raw SNPs were obtained, and the filtering approach yielded 5922 high-quality SNPs across the 20 chromosomes of Lupinus with an average marker density of 79.52 kb (Table 1, Figure 1). The highest number of SNPs were physically mapped to chromosome four (7.26%, 430 SNPs). Chromosomes 11 (112.74 kb) and 14 (65.01 kb) presented the highest and lowest marker densities, respectively (Table 1).

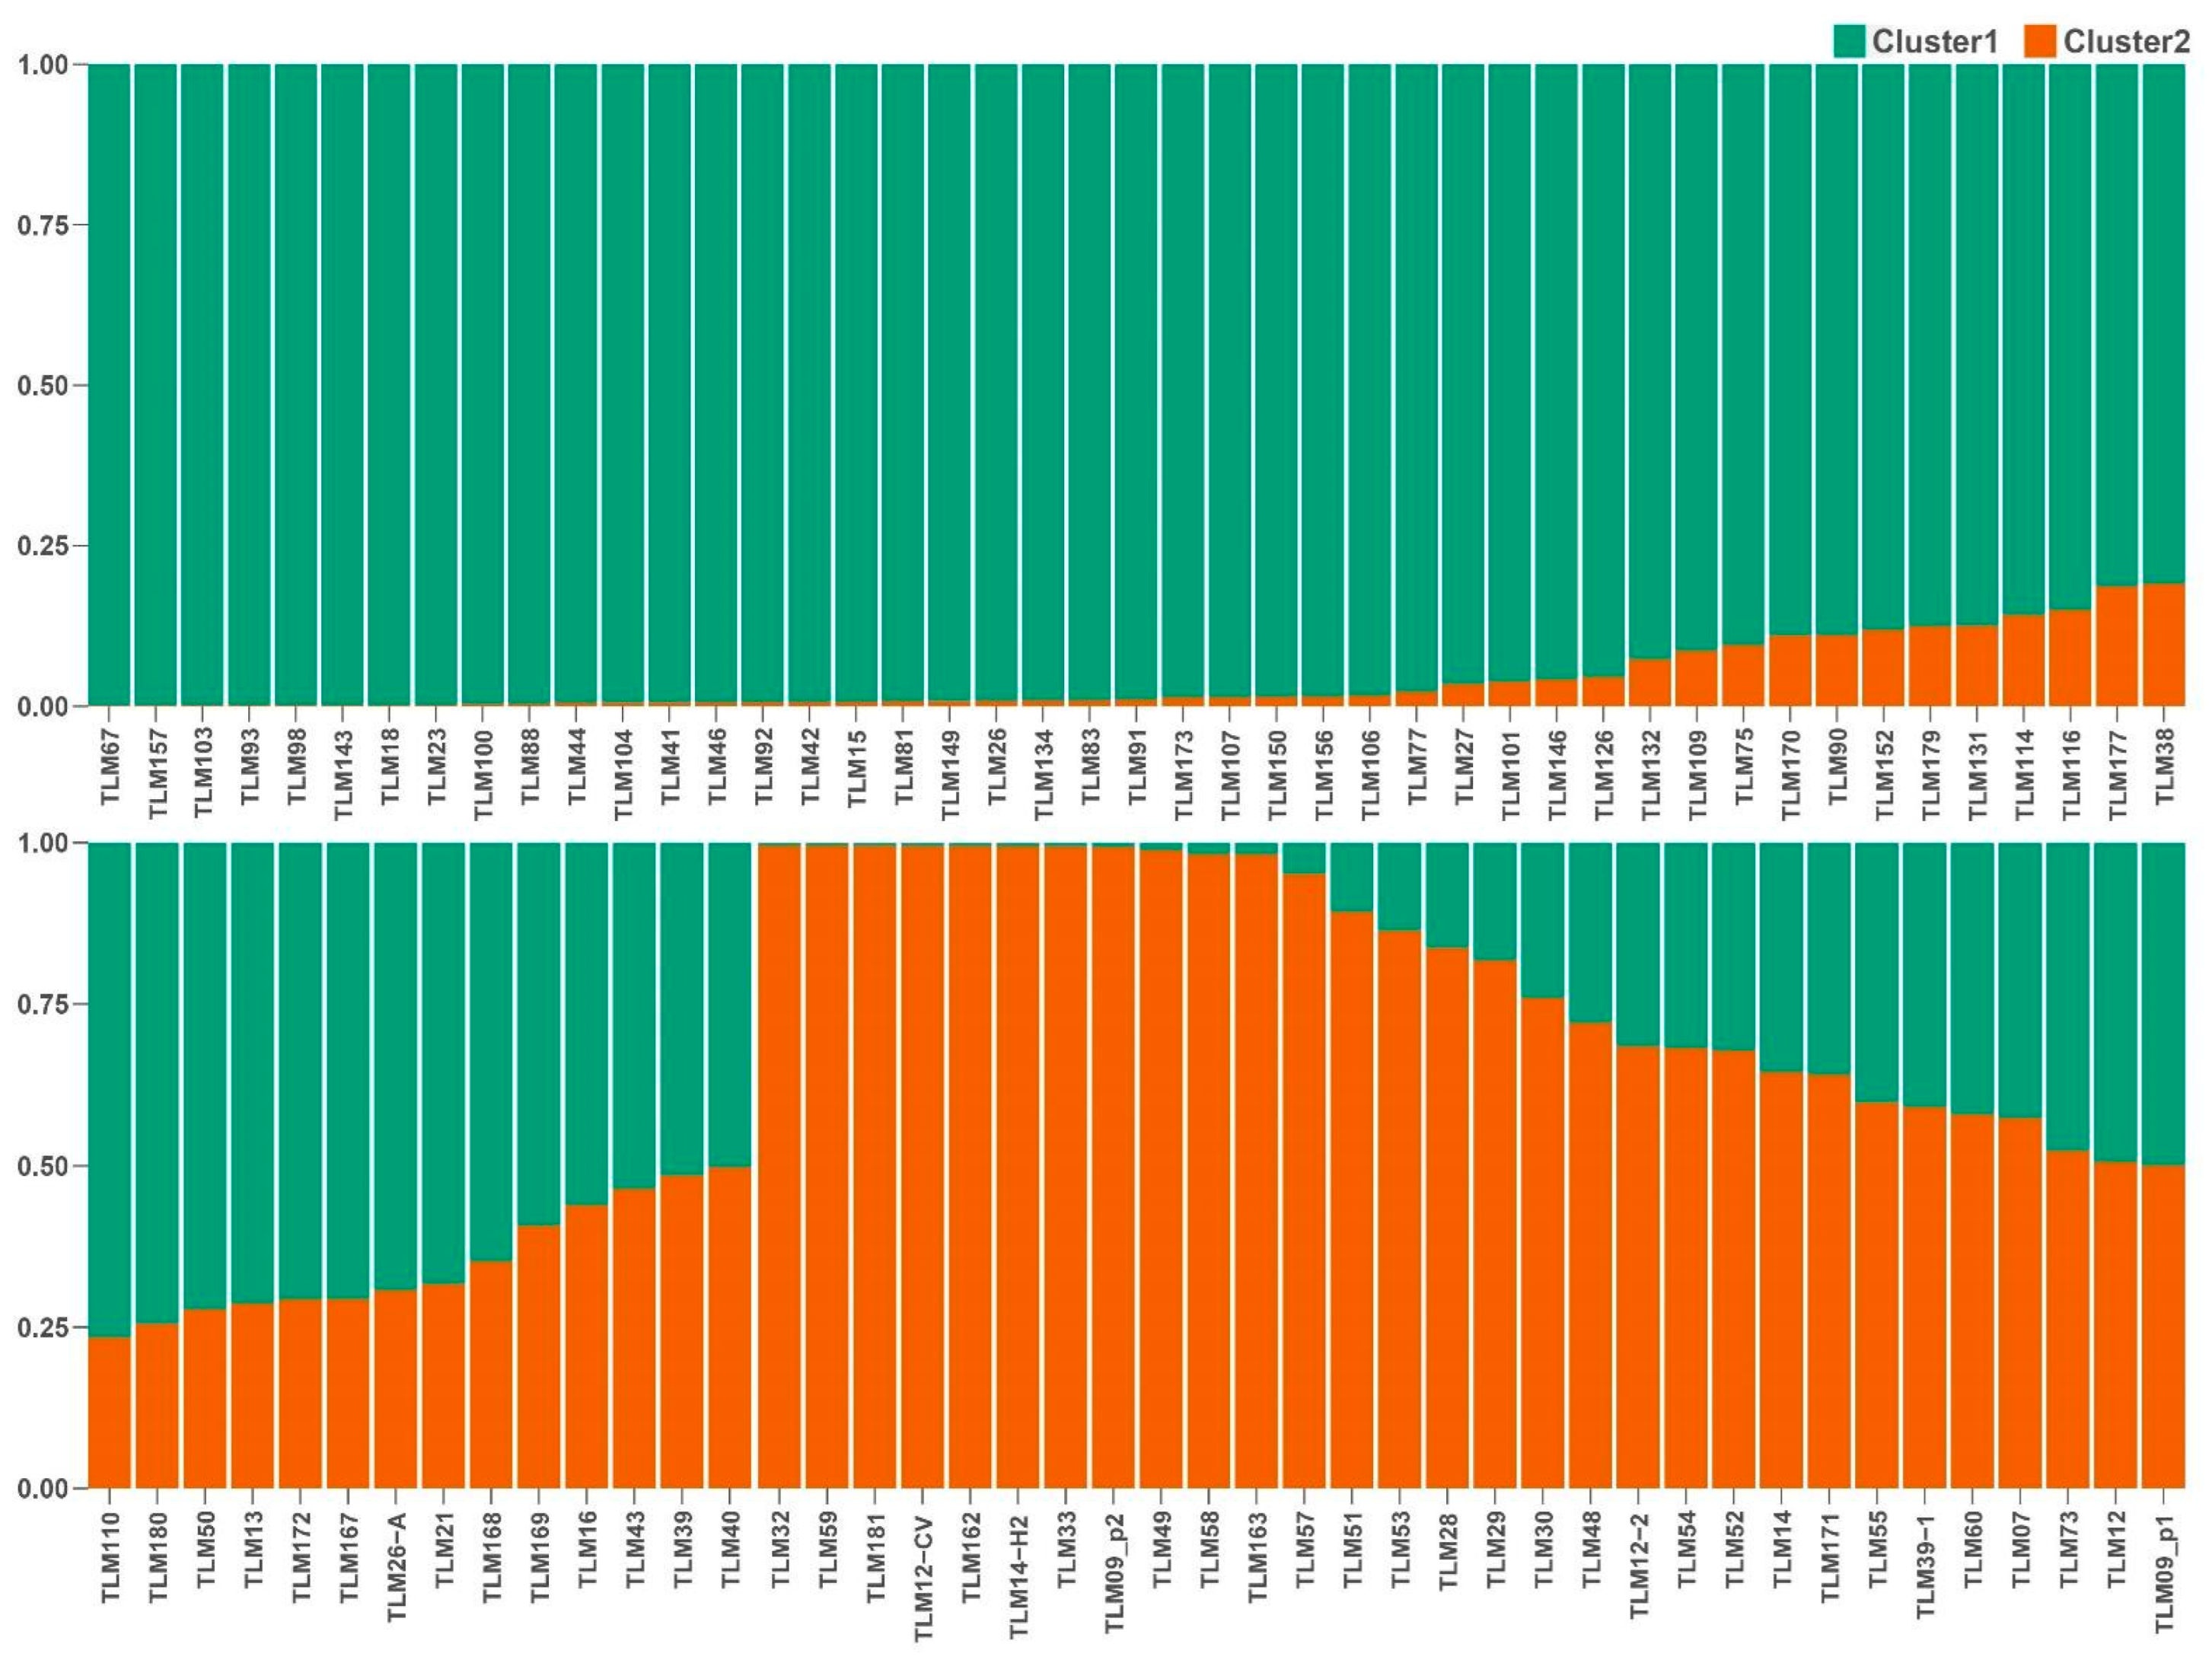
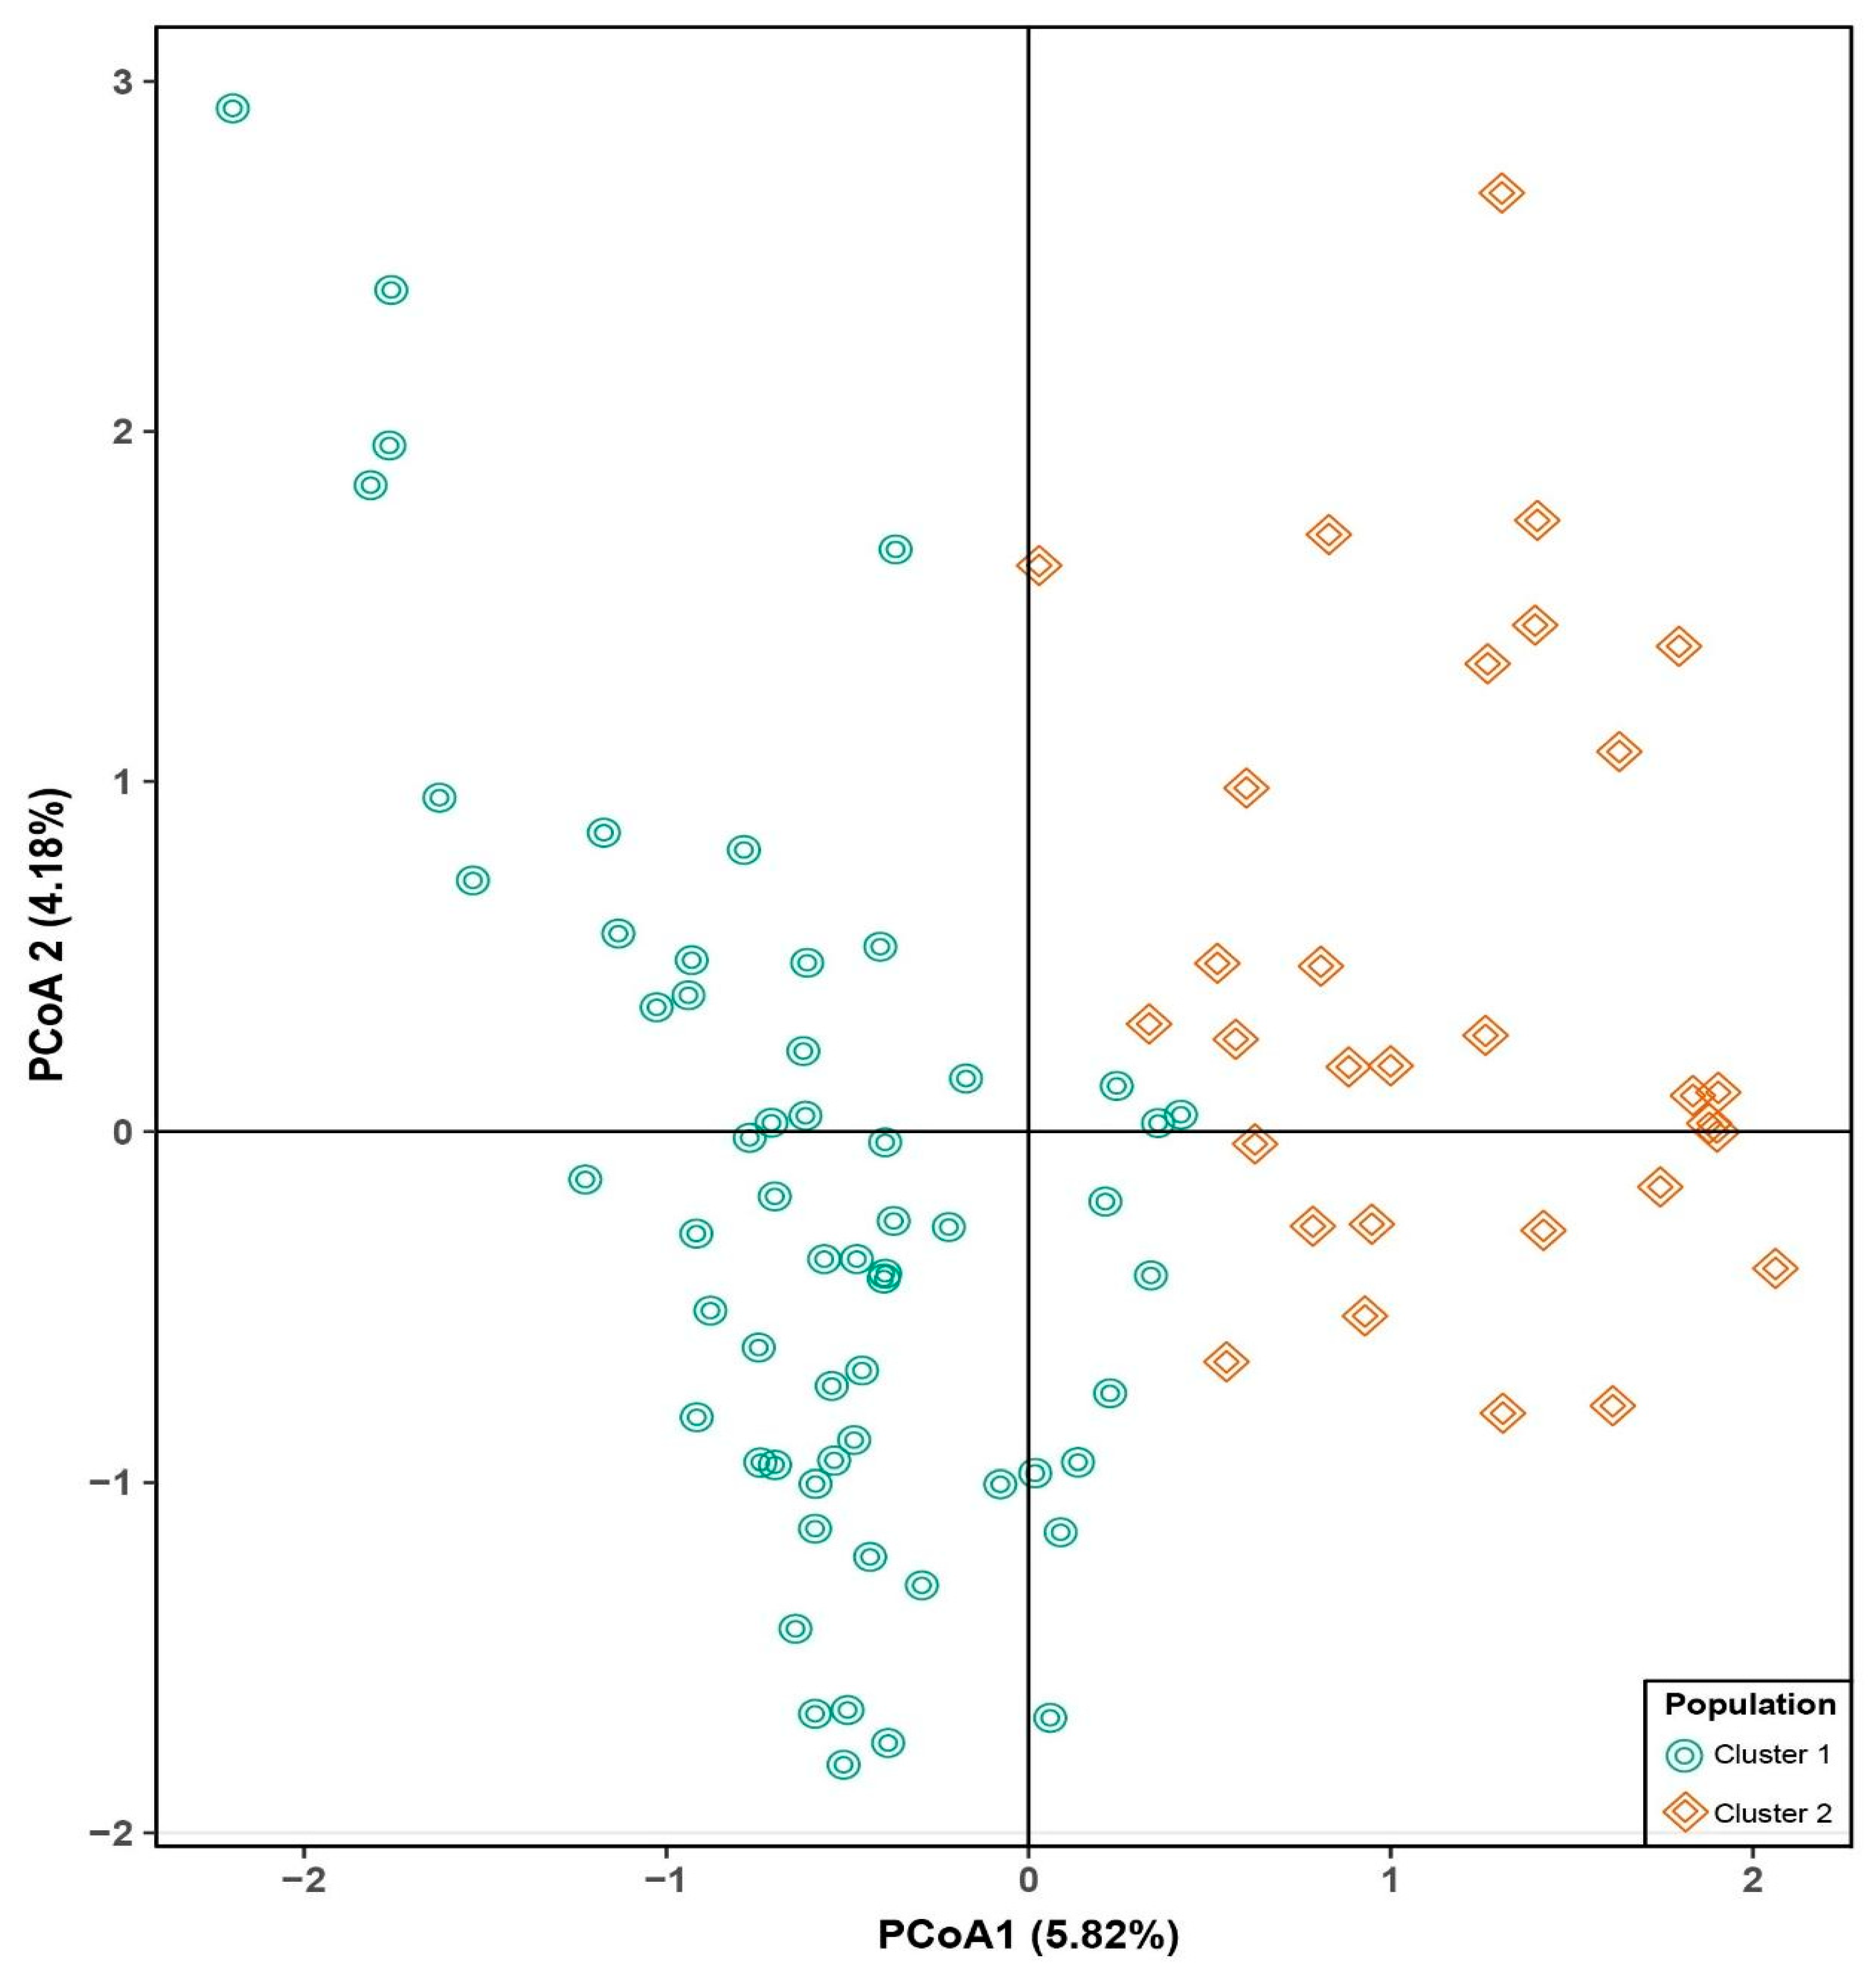
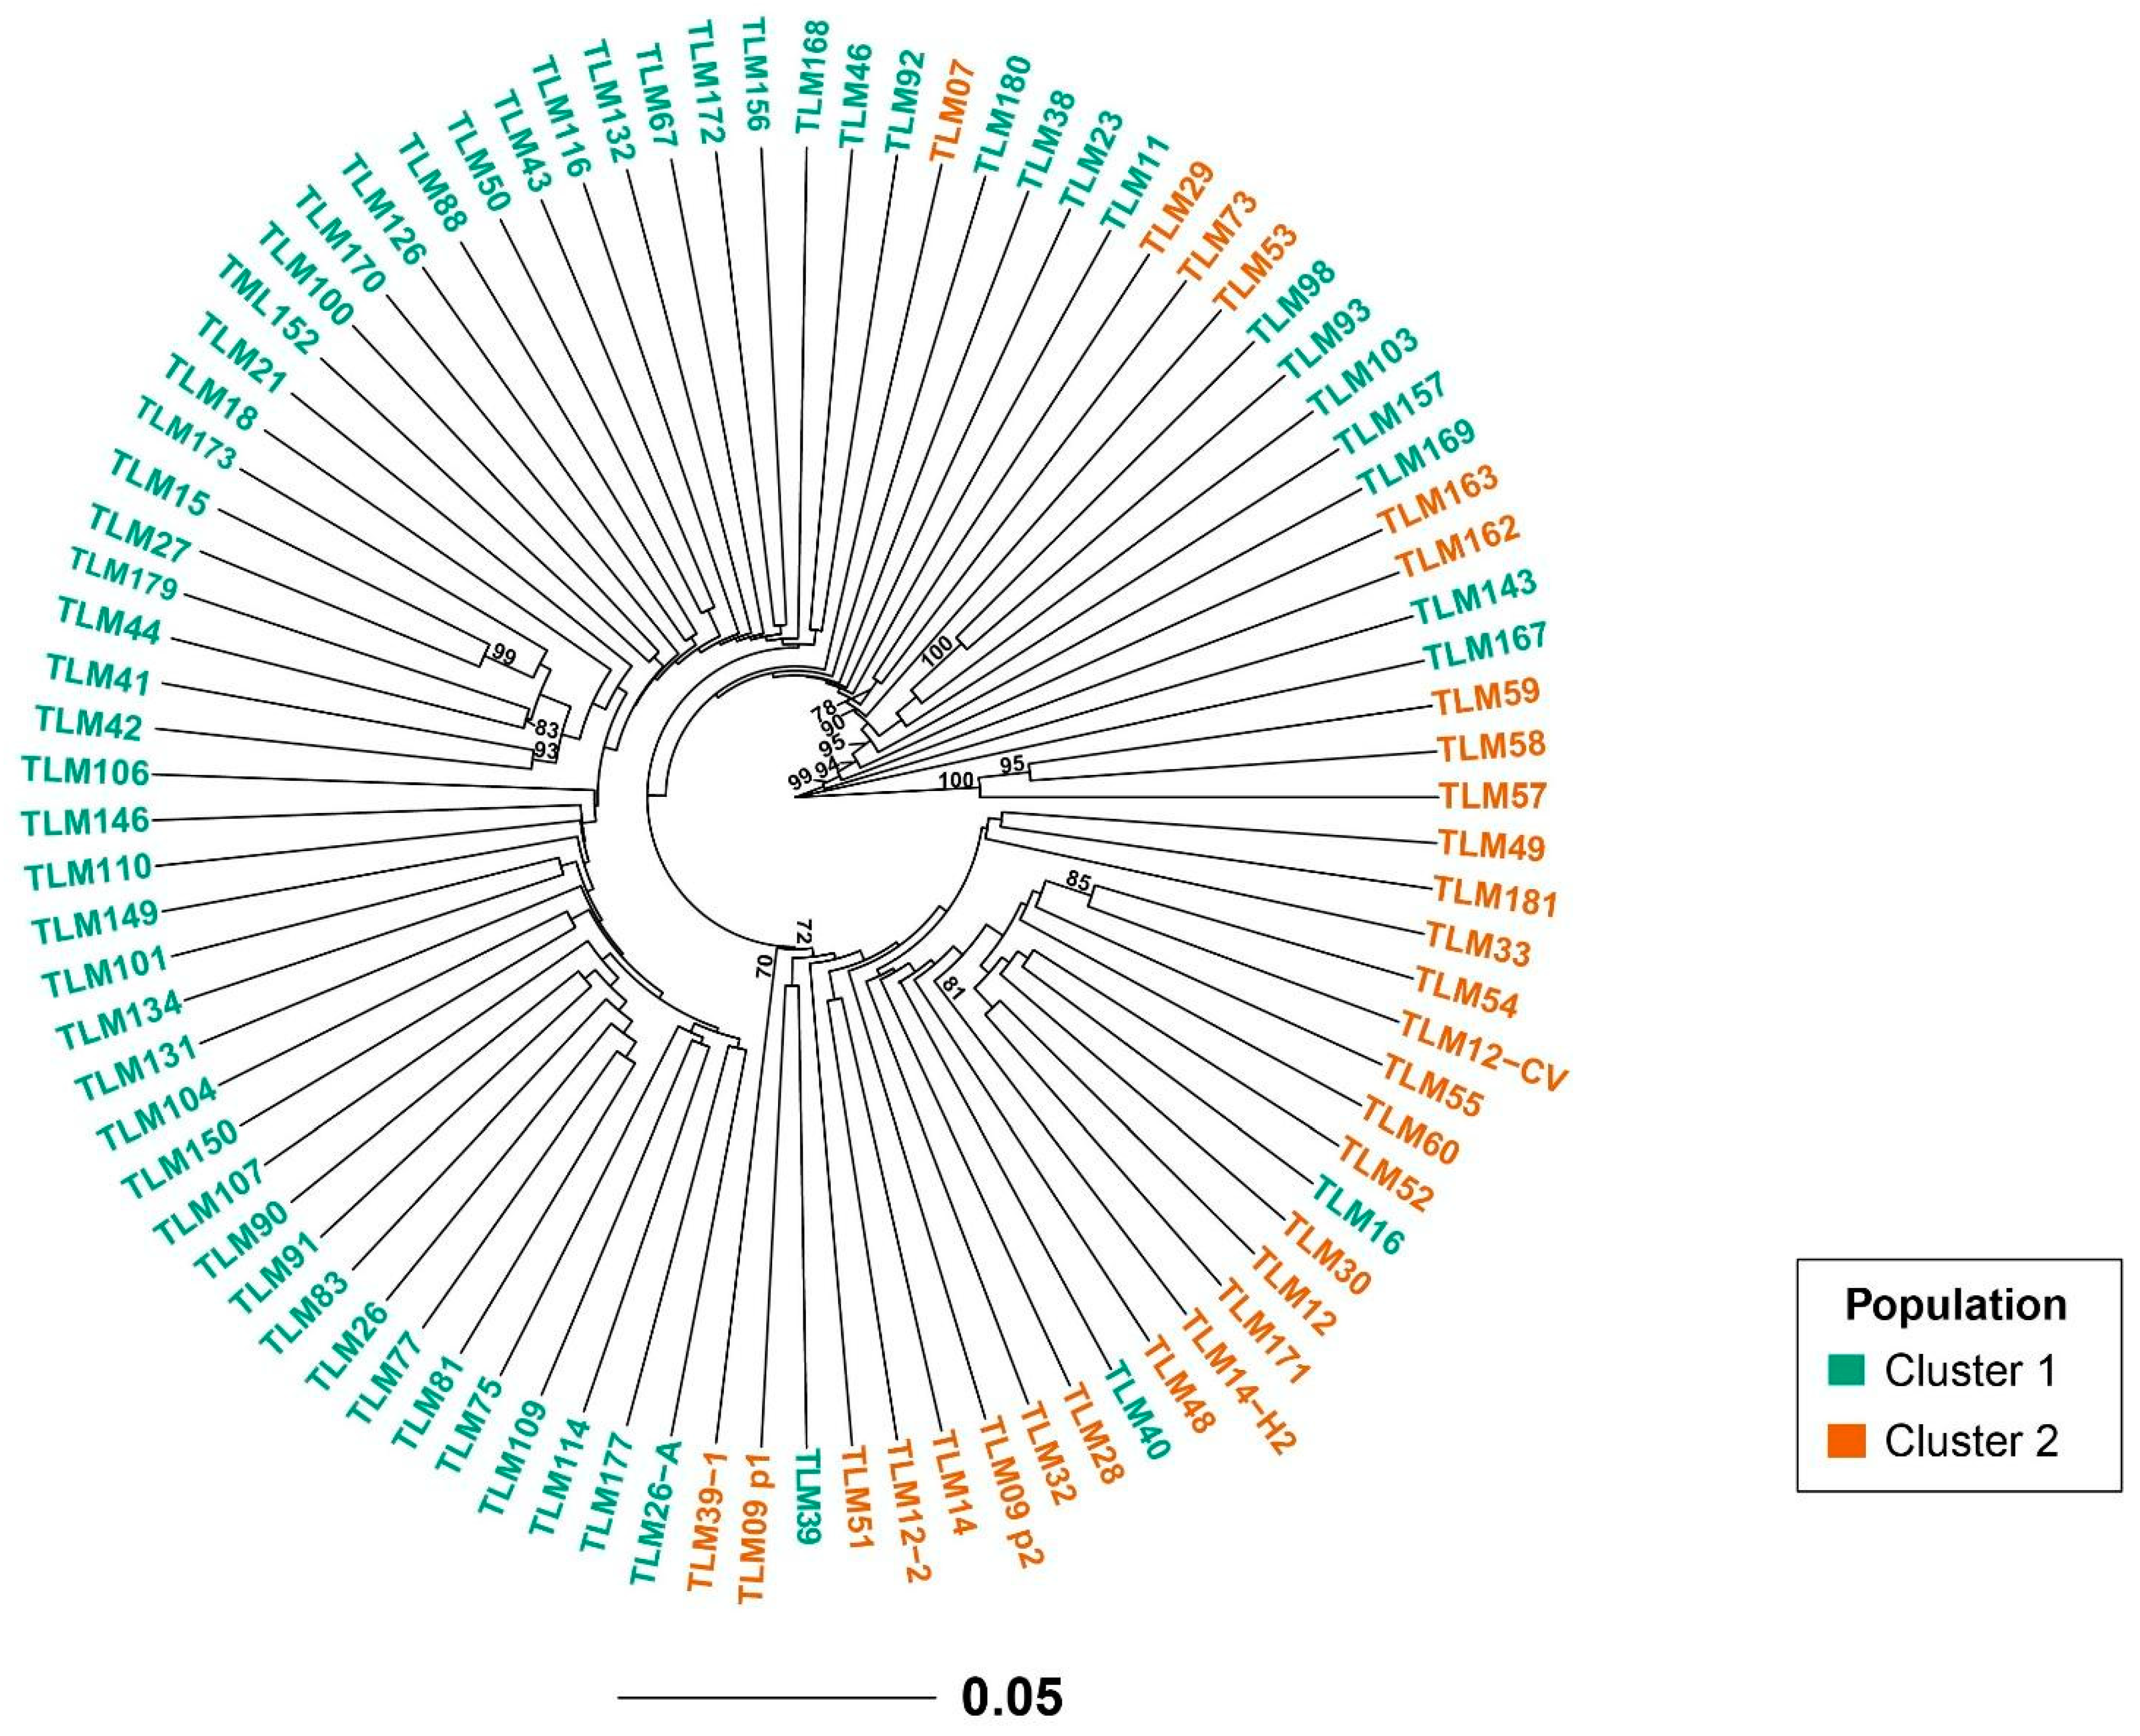
3.2. Population Structure and Genetic Relationships

We performed a population structure analysis using 5922 high-quality SNPs among the 89 accessions of tarwi. The Evanno method [42] indicated that the best K value (number of populations) is two for our data set (Figure S1). STRUCTURE analysis showed admixture, except for some accessions (Figure 2). Tarwi accessions did not cluster according to the regions they belonged to (Figure S2) but were separated into the following clusters: (i) cluster 1 included 59 accessions, and (ii) cluster 2 included 30 accessions (Figure 2, Table 2). There is some degree of grouping when tarwi accessions are labelled according to the region they belong as two clusters are formed (cluster 1: center + south and cluster 2: north). However, few accessions are intermixed (Figure S3).
Like the STRUCTURE analysis, the principal coordinate analysis (PCoA) based on the pairwise genetic distance matrix among all the 89 tarwi accessions also depicted two clusters (Figure 3). The first and second axis explained 5.82% and 4.18% of the variance, respectively. A UPGMA phylogenetic tree was constructed and two major clades were identified. Clade (cluster) 1 mainly contains accessions from the north and center regions of Peru while accessions from the north are mostly within clade (cluster) 2. The UPGMA was manually edited to show STRUCTURE grouping. Overall, there was a good agreement between these analyses (Figure 4).

3.3. Genetic Diversity of the Tarwi Collection

Diversity indices did not show significant differences among the two clusters identified by STRUCTURE (Table 3). The analysis of allelic patterns across all clusters revealed that the number of different alleles were similar. Allelic richness and observed heterozygosity among the two clusters did not vary greatly either. Genetic diversity (i.e., expected heterozygosity) was 0.421 and 0.433 for cluster 1 and 2, respectively. Cluster 1 presented a Shannon–Wiener index of 4.08 whereas cluster 2 had a value of 3.4, showing high diversity. Inbreeding coefficients for both clusters are negative, demonstrating that there is an excess of observed heterozygotes. In addition, the average coefficient of genetic differentiation among the two clusters was 0.019 (Table 3).
We conducted an analysis of molecular variance (AMOVA) in order to define the patterns of genetic variation, considering the two clusters identified by STRUCTURE. AMOVA revealed that the genetic variability between clusters was 7.59% while the rest (91.41%) was within clusters (Table 4). This confirms that there is great variation among the tarwi accessions.

4. Discussion

Molecular markers represent an important component in the field of plant breeding and are widely used today for multiple purposes. These markers are employed to deepen knowledge of diversity and population structure in plant genetic resources that help plant breeders to develop new and improved cultivars with favorable characteristics for farmers [46,47]. Knowledge of the genetic structure and diversity of germplasm collections is an important foundation for crop improvement [48]. Single nucleotide polymorphisms have gained popularity due to their abundance in genomes and their amenability for high-throughput detection formats and platforms [49]. To date, limited studies have been conducted with molecular markers to determine the genetic diversity of tarwi and other crops in Peru. Here, for the first time, we employed genome-wide SNPs to infer the genetic diversity and population structure of germplasm of Peruvian tarwi.
The genetic diversity indices of lupin, based on SNPs, is high among the nine populations sampled across the Peruvian Andes, which is concordant for individuals that are landraces, as reported for other landraces of rye [50], pea [51], maize [52], rice [53,54], squash [55], bean [56], and wheat [57]. The wealth and abundance of tarwi landraces can be explained by their adaptation to local environments and diversity of grower´s choice [48]. Unfortunately, genetic diversity indices and population structure for L. mutabilis have not been reported in detail. In contrast, these have been inferred for other Lupinus species. Raman et al. [58] used simple sequence repeat (SSR) and DArT molecular markers and 94 Ethiopian accessions of white lupin (L. albus). They reported that those accessions represent a unique genepool with a high level of genetic diversity. Similarly, with 11 SRAP primer pair combinations, El-Harty et al. [59] reported high genetic diversity in Egyptian white lupin genotypes. In addition, Atnaf et al. [60] used 15 SSR and 212 Ethiopian white lupin landraces, indicating that this germplasm possessed high genetic diversity. Their gene diversity (i.e., expected heterozygosity) (0.31) is close to the average value obtained in this study (0.427). A very similar gene diversity index was reported by Ji et al. [61] (0.476) for narrow-leafed lupin (L. angustifolius) using 76 SSR markers. In contrast, Skorupski et al. [62] indicated that the average heterozygosity of L. nootkatensis is 0.03. This reduced value may be explained by the isolation of this species in Iceland. Genetic studies on tarwi are scarce. Chirinos-Arias et al. [11] analyzed the genetic variability of 30 accessions of tarwi from the Andean Peruvian region with inter-simple sequence repeat (ISSR) markers, indicating a broad genetic diversity among them. In a more recent study [6], a total of 23 tarwi accessions with six ISSR markers were employed and revealed important levels of diversity; however, this is not related to phenotypic diversity, but reflects the recent domestication of tarwi.
Assessing population structure provides insights into the genetic diversity of the species under study and facilitates association mapping studies [63]. STRUCTURE analysis revealed that 89 samples of tarwi from the Peruvian Andes clustered in two well-defined groups associated with their geographic zones (center + south and north). Similar results were provided by PCoA. This clustering pattern meets our expectations, as individuals from these two geographic zones differ on their morphology. Tarwi landraces from the center and south of Peru tend to be more compact with reduced branching and present early plant maturity. On the other hand, in northern Peru, tarwi landraces are more vigorous and possess more branching with late maturity. However, farmers cultivate tarwi under three methods of conditioning the land: (i) there is zero tillage on fallow land in most localities in the northern regions, where they make a hole to deposit the seeds; (ii) in the north-center (Ancash, Huánuco and Huancavelica), farmers use the “yunta” for soil preparation in fallow land [64]; and (iii) in southern Peru, farmers have started preparing the soil by conventional tillage. Furthermore, soil conditioning and the use of local varieties in each region influence the period of the crop cycle, which is late when soil movement is involved [65,66]. Moreover, these differences may be explained by the latitude where these tarwi landraces are cultivated. Latitude significantly affects plant growth [67]. The higher the latitude, the shorter the growing season of these landraces and the smaller the size, as revealed in Arabidopsis thaliana [67] and Ambrosia artemisiifolia [68]. In addition, this clustering pattern may be due to the common process of exchanging tarwi seeds between growers living in close geographic areas, such as the center and south of Peru, but not with growers in more distant places (northern area). Other lupin species, such as L. albus [60] and L. angustifolius [61], were also grouped into two populations. Our research group also conducted morphological characterization of the tarwi accessions employed in this study. We conducted a principal component analysis (unpublished results) with quantitative variables only and, like our molecular characterization (this study), two groups were identified (Figure S4). A factor analysis of mixed data employing quantitative and qualitative variables showed that growth habit and stem formation clearly discriminated between the two groups (Figures S5 and S6) identified by SNP markers (this study). Cluster 1 groups accessions that have herbaceous growth with erect habit and possess fewer branches per plant; whereas cluster 2 groups semi-erect to decumbent-type individuals with a greater number of branches per plant. Vegetative periods of 7–7.5 months were observed for both groups.
A low degree of differentiation was exhibited between the two populations of tarwi, demonstrating that they share genetic material through high levels of breeding. Lupins are generally considered self-pollinating species [69], therefore, they tend to homozygosity. However, the negative Fis for both populations indicated an excess of heterozygotes for L. mutabilis, demonstrating that tarwi depends also on cross-pollination. These results are in agreement with Caliari et al. [1] who indicated that outcrossing rates of L. mutabilis varied between 16.6% and 58.8%. Consequently, this crop should be treated as a cross-pollinated plant in breeding programs. Similarly, L. albus [70], L. nootkatnsis [62] and L. angustifolius [61] also depend on cross-pollination. In the Andean Peruvian zone it is very common to observe populations of cultivated tarwi coexisting with its wild relative, L. piurensis [12], which could favor interbreeding. According to AMOVA, the greatest variation exists within accessions of tarwi (92.41%), which is explained by the sexual propagation of this species. In addition, low genetic variation between tarwi populations may be due to gene flow caused by the exchange of seeds, as depicted for L. angustifolius [61]. Similarly, Atnaf et al. [60] indicated that 92% of allelic variability was attributed to individuals within populations of L. albus.
The growing demand for novel, sustainable protein sources (legumes, insects, and others) [71] can be supplied by lupins, which are a protein-rich legume crop, but they are still limited for human consumption due to the presence of alkaloids [72]. Currently, lupin breeders only deal with a reduced part of the gene pool of this species, employing mainly low-alkaloid individuals to develop new cultivars [73]. In Peru, this study represents an initial step in the breeding and conservation of this important legume also known as “lost crop of the Incas”. However, further research is needed. For instance, NGS techniques should be employed to develop molecular tools for this crop, considering that its introduction to other continents will provide a new source of proteins and biomass, while contributing to the improvement of poor soils [74].

5. Conclusions

Here, for the first time, we employed SNP markers distributed along all chromosomes of a neglected legume from the Andean region, tarwi, and demonstrated that the genetic diversity and population structure of this crop could be successfully inferred from these markers. As expected for a landrace, different indices showed that tarwi possess high levels of genetic diversity. In addition, tarwi accessions were clustered into two populations according to their geographic zones. An excess of heterozygotes was detected, providing evidence that tarwi undergoes cross-pollination. Additional work should be conducted aiming to develop new tarwi cultivars by employing NGS techniques.

Supplementary Materials

The following supporting information can be downloaded at: https://www.mdpi.com/article/10.3390/d15030437/s1, Figure S1: Plot of K ranging from 1 to 15. All K values were obtained from STRUCTURE analysis. Two populations were considered in a data set of 5922 SNPs markers and 89 samples of tarwi. Figure S2: Principal coordinate analysis (PCoA) of 89 samples of a tarwi based on geographic origin. Figure S3: Principal coordinate analysis (PCoA) of 89 samples of a tarwi based on geographic region. Figure S4: Principal component analysis (PCA) using five quantitative morphological variables of tarwi (unpublished results). Figure S5: Factor analysis of mixed data using 12 morphological variables of tarwi germplasm (unpublished results). Clustering of accessions is based on growth habit. Figure S6: Factor analysis of mixed data using 12 morphological variables of tarwi germplasm (unpublished results). Clustering of accessions is based on stem formation. Table S1: Origin of the 89 tarwi accessions and the clusters inferred by STRUCTURE analysis.

Author Contributions

Conceptualization, A.H.-J., C.I.A., C.L.S. and S.G.-B.; methodology, A.H.-J., C.I.A., C.L.S. and P.R.-G.; software C.I.A. and C.L.S.; validation, A.H.-J., C.I.A. and C.L.S.; formal analysis, A.H.-J., C.I.A. and C.L.S.; investigation, A.H.-J., C.I.A., F.C., C.L.S., D.S. and P.I.; resources, A.H.-J., W.S., P.I. and C.I.A.; data curation, A.H.-J., C.L.S. and C.I.A.; writing—original draft preparation, A.H.-J., C.I.A., F.C., C.L.S. and D.S.; writing—review and editing, A.H.-J., C.I.A., C.L.S. and W.S.; visualization, A.H.-J., C.I.A. and C.L.S.; supervision A.H.-J. and C.I.A.; project administration, A.H.-J.; funding acquisition, A.H.-J. All authors have read and agreed to the published version of the manuscript.

Funding

This research was funded by the project “Fondo para Regeneración de Germoplasma de Leguminosas” of the Ministry of Education (MINEDU) of the Peruvian Government that was conducted in UNALM. C.L.S, D.S. and W.S. were funded by project “Creación del servicio de agricultura de precisión en los Departamentos de Lambayeque, Huancavelica, Ucayali y San Martín 4 Departamentos” of the Ministry of Agrarian Development and Irrigation (MIDAGRI) of the Peruvian Government with grant number CUI 2449640. C.I.A. was supported by PP0068 “Reducción de la vulnerabilidad y atención de emergencias por desastres”.

Institutional Review Board Statement

Not applicable.

Informed Consent Statement

Not applicable.

Data Availability Statement

The data that support the findings of this study are openly available in Zenodo at http://doi.org/10.5281/zenodo.7735004 (accessed on 19 January 2023).

Acknowledgments

We thank (i) the Legumes and Oilseeds Research Program of UNALM, (ii) Universidad Nacional San Antonio Abad del Cusco and (iii) INIA, for providing the samples of tarwi. We also thank Robert Quiñones for his support with fieldwork. The authors thank the Bioinformatics High-performance Computing server of Universidad Nacional Agraria la Molina (BioHPC-UNALM) for providing resources to perform the analyses. Finally, we thank the University of Wisconsin Biotechnology Center DNA Sequencing Facility for providing GBS facilities and services.

Conflicts of Interest

The authors declare no conflict of interest.

References

  1. Caligari, P.D.S.; Römer, P.; Rahim, M.A.; Huyghe, C.; Neves-Martins, J.; Sawicka-Sienkiewicz, E.J. The Potential of Lupinus mutabilis as a crop. In Linking Research and Marketing Opportunities for Pulses in the 21st Century, Proceedings of the Third International Food Legumes Research Conference, Adelaide, Australia, 22–26 September 1997; Springer: Dordrecht, The Netherlands, 2000; pp. 569–573. [Google Scholar] [CrossRef]
  2. Atchison, G.W.; Nevado, B.; Eastwood, R.J.; Contreras-Ortiz, N.; Reynel, C.; Madriñán, S.; Filatov, D.A.; Hughes, C.E. Lost crops of the incas: Origins of domestication of the Andean pulse crop Tarwi, Lupinus mutabilis. Am. J. Bot. 2016, 103, 1592–1606. [Google Scholar] [CrossRef] [PubMed]
  3. Neves Martins, J.M.; Talhinhas, P.; Bruno de Sousa, R. Yield and seed chemical composition of Lupinus mutabilis in Portugal. Rev. Ciências Agrárias 2016, 39, 518–525. [Google Scholar] [CrossRef] [Green Version]
  4. Carvajal-Larenas, F.E.; Linnemann, A.R.; Nout, M.J.R.; Koziol, M.; van Boekel, M.A.J.S. Lupinus mutabilis: Composition, Uses, Toxicology, and Debittering. Crit. Rev. Food Sci. Nutr. 2016, 56, 1454–1487. [Google Scholar] [CrossRef] [PubMed] [Green Version]
  5. Borek, S.; Ratajczak, W.; Ratajczak, L. Regulation of storage lipid metabolism in developing and germinating lupin (Lupinus spp.) seeds. Acta Physiol. Plant. 2015, 37, 119. [Google Scholar] [CrossRef] [Green Version]
  6. Guilengue, N.; Alves, S.; Talhinhas, P.; Neves-Martins, J. Genetic and genomic diversity in a tarwi (Lupinus mutabilis sweet) germplasm collection and adaptability to mediterranean climate conditions. Agronomy 2020, 10, 21. [Google Scholar] [CrossRef] [Green Version]
  7. Adomas, B.; Galek, R.; Gas-Smereka, M.; Helios, W.; Hurej, M.; Kotecki, A.; Kozak, M.; Malarz, W.; Okorski, A.; Agnieszka, P.; et al. Adaptation of the Andean lupin (Lupinus mutabilis Sweet) to natural conditions of south-western Poland; Wydawnictwo Uniwersytetu Przyrodniczego we Wrocławiu: Wroclaw, Poland, 2015; ISBN 9788377172353. [Google Scholar]
  8. Jacobsen, E.; Mujica, A. El tarwi (Lupinus mutabilis Sweet) y sus parientes silvestres. In Botánica Económica de los Andes Centrales; Universidad Mayor de San Andrés: La Paz, Bolivia, 2006; pp. 458–482. [Google Scholar] [CrossRef] [Green Version]
  9. Martínez Flores, L.A.; Ruivenkamp, G.; Jongerden, J. Fitomejoramiento y racionalidad social: Los efectos no intencionales de la liberación de una semilla de lupino (Lupinus mutabilis Sweet) en Ecuador. Antípoda. Rev. Antropol. Arqueol. 2016, 26, 71–91. [Google Scholar] [CrossRef]
  10. Camillo, M.F.; Pozzobon, M.T.; Schifino-Wittm, M.T. Chromosome numbers in South American andean spcecies of Lupinus (Leguminosae). Bonplandia 2006, 15, 113–119. [Google Scholar]
  11. Chirinos-Arias, M.C.; Jiménez, J.E.; Vilca-Machaca, L.S. Analysis of Genetic Variability among thirty accessions of Andean Lupin (Lupinus mutabilis Sweet) using ISSR molecular markers. Sci. Agropecu. 2015, 6, 17–30. [Google Scholar] [CrossRef] [Green Version]
  12. Ruiz-Gil, P.J.; Paramo-Ortíz, E.E.; De La Luna-Bonilla, Ó.Á. ¿Entrecruces entre Lupinus domesticados y silvestres? El tarwi del Perú P. Desde el Herb. CICY 2019, 11, 195–200. [Google Scholar]
  13. Kroc, M.; Koczyk, G.; Święcicki, W.; Kilian, A.; Nelson, M.N. New evidence of ancestral polyploidy in the Genistoid legume Lupinus angustifolius L. (narrow-leafed lupin). Theor. Appl. Genet. 2014, 127, 1237–1249. [Google Scholar] [CrossRef]
  14. Soltis, P.S.; Soltis, D.E. Plant Molecular Systematics: Macromolecular Approaches: Inferences of Phylogeny and Evolutionary Processes. Evol. Biol. 1995, 28, 139–194. [Google Scholar] [CrossRef]
  15. Melchinger, A.E.; Gumber, R.K. Overview of heterosis and heterotic groups in agronomic crops. Concepts Breed. Heterosis Crop. Plants 2015, 25, 29–44. [Google Scholar] [CrossRef]
  16. Elshire, R.J.; Glaubitz, J.C.; Sun, Q.; Poland, J.A.; Kawamoto, K.; Buckler, E.S.; Mitchell, S.E. A robust, simple genotyping-by-sequencing (GBS) approach for high diversity species. PLoS ONE 2011, 6, e19379. [Google Scholar] [CrossRef] [Green Version]
  17. Beebe, S.; Rengifo, E.; Gaitan, E.; Duque, M.C.; Tohme, J. Diversity and origin of Andean landraces of common bean. Crop. Sci. 2001, 41, 854–862. [Google Scholar] [CrossRef]
  18. Uitdewilligen, J.G.A.M.L.; Wolters, A.M.A.; D’hoop, B.B.; Borm, T.J.A.; Visser, R.G.F.; van Eck, H.J. A Next-Generation Sequencing Method for Genotyping-by-Sequencing of Highly Heterozygous Autotetraploid Potato. PLoS ONE 2013, 8, e62355. [Google Scholar] [CrossRef] [Green Version]
  19. Ramstein, G.P.; Lipka, A.E.; Lu, F.; Costich, D.E.; Cherney, J.H.; Buckler, E.S.; Casler, M.D. Genome-wide association study based on multiple imputation with low-depth sequencing data: Application to biofuel traits in reed canarygrass. G3 Genes Genomes Genet. 2015, 5, 891–909. [Google Scholar] [CrossRef] [Green Version]
  20. Wong, M.M.L.; Gujaria-Verma, N.; Ramsay, L.; Yuan, H.Y.; Caron, C.; Diapari, M.; Vandenberg, A.; Bett, K.E. Classification and characterization of species within the genus lens using genotyping-by-sequencing (GBS). PLoS ONE 2015, 10, e0122025. [Google Scholar] [CrossRef] [Green Version]
  21. Lu, F.; Romay, M.C.; Glaubitz, J.C.; Bradbury, P.J.; Elshire, R.J.; Wang, T.; Li, Y.; Li, Y.; Semagn, K.; Zhang, X.; et al. High-resolution genetic mapping of maize pan-genome sequence anchors. Nat. Commun. 2015, 6, 6914. [Google Scholar] [CrossRef] [Green Version]
  22. Liu, H.; Bayer, M.; Druka, A.; Russell, J.R.; Hackett, C.A.; Poland, J.; Ramsay, L.; Hedley, P.E.; Waugh, R. An evaluation of genotyping by sequencing (GBS) to map the Breviaristatum-e (ari-e) locus in cultivated barley. BMC Genom. 2014, 15, 104. [Google Scholar] [CrossRef] [Green Version]
  23. Spindel, J.; Wright, M.; Chen, C.; Cobb, J.; Gage, J.; Harrington, S.; Lorieux, M.; Ahmadi, N.; McCouch, S. Bridging the genotyping gap: Using genotyping by sequencing (GBS) to add high-density SNP markers and new value to traditional bi-parental mapping and breeding populations. Theor. Appl. Genet. 2013, 126, 2699–2716. [Google Scholar] [CrossRef] [Green Version]
  24. Jarquín, D.; Kocak, K.; Posadas, L.; Hyma, K.; Jedlicka, J.; Graef, G.; Lorenz, A. Genotyping by sequencing for genomic prediction in a soybean breeding population. BMC Genom. 2014, 15, 740. [Google Scholar] [CrossRef] [PubMed] [Green Version]
  25. Lipka, A.E.; Lu, F.; Cherney, J.H.; Buckler, E.S.; Casler, M.D.; Costich, D.E. Accelerating the switchgrass (Panicum virgatum L.) breeding cycle using genomic selection approaches. PLoS ONE 2014, 9, e112227. [Google Scholar] [CrossRef] [Green Version]
  26. Poland, J.; Endelman, J.; Dawson, J.; Rutkoski, J.; Wu, S.; Manes, Y.; Dreisigacker, S.; Crossa, J.; Sánchez-Villeda, H.; Sorrells, M.; et al. Genomic Selection in Wheat Breeding using Genotyping-by-Sequencing. Plant Genome 2012, 5, 103–113. [Google Scholar] [CrossRef] [Green Version]
  27. Doyle, J.J.; Doyle, J.L. A rapid DNA isolation procedure for small quantities of fresh leaf tissue. Phytochem. Bull. 1987, 19, 11–15. [Google Scholar]
  28. Bradbury, P.J.; Zhang, Z.; Kroon, D.E.; Casstevens, T.M.; Ramdoss, Y.; Buckler, E.S. TASSEL: Software for association mapping of complex traits in diverse samples. Bioinformatics 2007, 23, 2633–2635. [Google Scholar] [CrossRef] [PubMed]
  29. Glaubitz, J.C.; Casstevens, T.M.; Lu, F.; Harriman, J.; Elshire, R.J.; Sun, Q.; Buckler, E.S. TASSEL-GBS: A high capacity genotyping by sequencing analysis pipeline. PLoS ONE 2014, 9, e90346. [Google Scholar] [CrossRef] [Green Version]
  30. Hane, J.K.; Ming, Y.; Kamphuis, L.G.; Nelson, M.N.; Garg, G.; Atkins, C.A.; Bayer, P.E.; Bravo, A.; Bringans, S.; Cannon, S.; et al. A comprehensive draft genome sequence for lupin (Lupinus angustifolius), an emerging health food: Insights into plant–microbe interactions and legume evolution. Plant Biotechnol. J. 2017, 15, 318–330. [Google Scholar] [CrossRef]
  31. Li, H.; Durbin, R. Fast and accurate short read alignment with Burrows-Wheeler transform. Bioinformatics 2009, 25, 1754–1760. [Google Scholar] [CrossRef] [Green Version]
  32. Danecek, P.; Auton, A.; Abecasis, G.; Albers, C.A.; Banks, E.; DePristo, M.A.; Handsaker, R.E.; Lunter, G.; Marth, G.T.; Sherry, S.T.; et al. The variant call format and VCFtools. Bioinformatics 2011, 27, 2156–2158. [Google Scholar] [CrossRef]
  33. Zheng, X.; Levine, D.; Shen, J.; Gogarten, S.M.; Laurie, C.; Weir, B.S. A high-performance computing toolset for relatedness and principal component analysis of SNP data. Bioinformatics 2012, 28, 3326–3328. [Google Scholar] [CrossRef] [Green Version]
  34. Team, R.C. R: A Language and Environment for Statistical Computing; R Foundation for Statistical Computing: Vienna, Austria, 2020; p. 326864. [Google Scholar]
  35. Prevosti, A.; Ocaña, J.; Alonso, G. Distances between populations of Drosophila subobscura, based on chromosome arrangement frequencies. Theor. Appl. Genet. 1975, 45, 231–241. [Google Scholar] [CrossRef]
  36. Kamvar, Z.N.; Tabima, J.F.; Grünwald, N.J. Poppr: An R package for genetic analysis of populations with clonal, partially clonal, and/or sexual reproduction. PeerJ 2014, 2014, e281. [Google Scholar] [CrossRef] [Green Version]
  37. Dray, S.; Dufour, A.B. The ade4 package: Implementing the duality diagram for ecologists. J. Stat. Softw. 2007, 22, 1–20. [Google Scholar] [CrossRef] [Green Version]
  38. Purcell, S.; Neale, B.; Todd-Brown, K.; Thomas, L.; Ferreira, M.A.R.; Bender, D.; Maller, J.; Sklar, P.; De Bakker, P.I.W.; Daly, M.J.; et al. PLINK: A tool set for whole-genome association and population-based linkage analyses. Am. J. Hum. Genet. 2007, 81, 559–575. [Google Scholar] [CrossRef] [PubMed] [Green Version]
  39. Lischer, H.E.L.; Excoffier, L. PGDSpider: An automated data conversion tool for connecting population genetics and genomics programs. Bioinformatics 2012, 28, 298–299. [Google Scholar] [CrossRef] [PubMed] [Green Version]
  40. Pritchard, J.K.; Stephens, M.; Donnelly, P. Inference of population structure using multilocus genotype data. Genetics 2000, 155, 945–959. [Google Scholar] [CrossRef]
  41. Earl, D.A.; vonHoldt, B.M. STRUCTURE HARVESTER: A website and program for visualizing STRUCTURE output and implementing the Evanno method. Conserv. Genet. Resour. 2012, 4, 359–361. [Google Scholar] [CrossRef]
  42. Evanno, G.; Regnaut, S.; Goudet, J. Detecting the number of clusters of individuals using the software STRUCTURE: A simulation study. Mol. Ecol. 2005, 14, 2611–2620. [Google Scholar] [CrossRef] [Green Version]
  43. Francis, R.M. pophelper: An R package and web app to analyse and visualize population structure. Mol. Ecol. Resour. 2017, 17, 27–32. [Google Scholar] [CrossRef] [PubMed] [Green Version]
  44. Arbizu, C.I.; Ellison, S.L.; Senalik, D.; Simon, P.W.; Spooner, D.M. Genotyping-by-sequencing provides the discriminating power to investigate the subspecies of Daucus carota (Apiaceae). BMC Evol. Biol. 2016, 16, 234. [Google Scholar] [CrossRef] [PubMed] [Green Version]
  45. Martínez-Flores, F.; Crespo, M.B.; Simon, P.W.; Ruess, H.; Reitsma, K.; Geoffriau, E.; Allender, C.; Mezghani, N.; Spooner, D.M. Subspecies Variation of Daucus carota Coastal (“Gummifer”) Morphotypes (Apiaceae) Using Genotyping-by-Sequencing. Syst. Bot. 2020, 45, 688–702. [Google Scholar] [CrossRef]
  46. Govindaraj, M.; Vetriventhan, M.; Srinivasan, M. Importance of genetic diversity assessment in crop plants and its recent advances: An overview of its analytical perspectives. Genet. Res. Int. 2015, 2015, 688–702. [Google Scholar] [CrossRef] [PubMed] [Green Version]
  47. Xu, Y.; Zhang, X.; Li, H.; Zheng, H.; Zhang, J.; Olsen, M.S.; Varshney, R.K.; Prasanna, B.M.; Qian, Q. Smart breeding driven by big data, artificial intelligence, and integrated genomic-enviromic prediction. Mol. Plant 2022, 15, 1664–1695. [Google Scholar] [CrossRef]
  48. Thomson, M.J.; Septiningsih, E.M.; Suwardjo, F.; Santoso, T.J.; Silitonga, T.S.; McCouch, S.R. Genetic diversity analysis of traditional and improved Indonesian rice (Oryza sativa L.) germplasm using microsatellite markers. Theor. Appl. Genet. 2007, 114, 559–568. [Google Scholar] [CrossRef]
  49. Mammadov, J.; Aggarwal, R.; Buyyarapu, R.; Kumpatla, S. SNP markers and their impact on plant breeding. Int. J. Plant Genomics 2012, 2012, 728398. [Google Scholar] [CrossRef]
  50. Persson, K.; Von Bothmer, R. Genetic diversity amongst landraces of rye (Secale cereale L.) from northern Europe. Hereditas 2002, 136, 29–38. [Google Scholar] [CrossRef]
  51. Martin-Sanz, A.; Caminero, C.; Jing, R.; Flavell, A.J.; Perez de la Vega, M. Genetic diversity among Spanish pea (Pisum sativum L.) landraces, pea cultivars and the World Pisum sp. core collection assessed by retrotransposon-based insertion polymorphisms (RBIPs). Spanish J. Agric. Res. 2011, 9, 166. [Google Scholar] [CrossRef] [Green Version]
  52. Bracco, M.; Lia, V.V.; Hernández, J.C.; Poggio, L.; Gottlieb, A.M. Genetic diversity of maize landraces from lowland and highland agro-ecosystems of Southern South America: Implications for the conservation of native resources. Ann. Appl. Biol. 2012, 160, 308–321. [Google Scholar] [CrossRef]
  53. Hour, A.L.; Hsieh, W.H.; Chang, S.H.; Wu, Y.P.; Chin, H.S.; Lin, Y.R. Genetic Diversity of Landraces and Improved Varieties of Rice (Oryza sativa L.) in Taiwan. Rice 2020, 13, 82. [Google Scholar] [CrossRef]
  54. Aesomnuk, W.; Ruengphayak, S.; Ruanjaichon, V.; Sreewongchai, T.; Malumpong, C.; Vanavichit, A.; Toojinda, T.; Wanchana, S.; Arikit, S. Estimation of the genetic diversity and population structure of thailand’s rice landraces using snp markers. Agronomy 2021, 11, 995. [Google Scholar] [CrossRef]
  55. Lorello, I.M.; Lampasona, S.C.G.; Peralta, I.E. Genetic diversity of squash landraces (Cucurbita maxima) collected in Andean valleys of Argentina. Rev. Fac. Ciencias Agrar. 2020, 52, 293–313. [Google Scholar]
  56. Özkan, G.; Haliloglu, K.; Türkoglu, A.; Özturk, H.I.; Elkoca, E.; Poczai, P. Determining Genetic Diversity and Population Structure of Common Bean (Phaseolus vulgaris L.) Landraces from Türkiye Using SSR Markers. Genes 2022, 13, 1410. [Google Scholar] [CrossRef] [PubMed]
  57. Tehseen, M.M.; Tonk, F.A.; Tosun, M.; Istipliler, D.; Amri, A.; Sansaloni, C.P.; Kurtulus, E.; Mubarik, M.S.; Nazari, K. Exploring the Genetic Diversity and Population Structure of Wheat Landrace Population Conserved at ICARDA Genebank. Front. Genet. 2022, 13, 900572. [Google Scholar] [CrossRef] [PubMed]
  58. Raman, R.; Cowley, R.B.; Raman, H.; Luckett, D.J. Analyses Using SSR and DArT Molecular Markers Reveal that Ethiopian Accessions of White Lupin (Lupinus albus L.) Represent a Unique Genepool. Open J. Genet. 2014, 04, 87–98. [Google Scholar] [CrossRef] [Green Version]
  59. El-Harty, E.; Ashrie, A.; Ammar, M.; Alghamdi, S. Genetic variation among egyptian white lupin (Lupinus albus L.) genotypes. Turk. J. Field Crops 2016, 21, 148–155. [Google Scholar] [CrossRef] [Green Version]
  60. Atnaf, M.; Yao, N.; Martina, K.; Dagne, K.; Wegary, D.; Tesfaye, K. Molecular genetic diversity and population structure of Ethiopian white lupin landraces: Implications for breeding and conservation. PLoS ONE 2017, 12, e0188696. [Google Scholar] [CrossRef] [Green Version]
  61. Ji, Y.; Liu, R.; Hu, J.; Huang, Y.; Wang, D.; Li, G.; Rahman, M.M.; Zhang, H.; Wang, C.; Li, M.; et al. Genetic diversity analysis for narrow-leafed lupin (Lupinus angustifolius L.) by SSR markers. Mol. Biol. Rep. 2020, 47, 5215–5224. [Google Scholar] [CrossRef]
  62. Skorupski, J.; Szenejko, M.; Gruba-Tabaka, M.; Śmietana, P.; Panicz, R. Inferring population structure and genetic diversity of the invasive alien nootka lupin in Iceland. Polar Res. 2021, 40, 1–13. [Google Scholar] [CrossRef]
  63. Eltaher, S.; Sallam, A.; Belamkar, V.; Emara, H.A.; Nower, A.A.; Salem, K.F.M.; Poland, J.; Baenziger, P.S. Genetic diversity and population structure of F3:6 Nebraska Winter wheat genotypes using genotyping-by-sequencing. Front. Genet. 2018, 9, 76. [Google Scholar] [CrossRef] [Green Version]
  64. Huaringa, A.; De la Cruz, N.; Camarena, F.; Caycho, P.; Mostacero, E.; Miguel, P. Phenotypic evaluation and preliminary yield of lupin ecotype (Lupinus mutabilis sweet) grown in Carhuaz, Ancash. Ancash. In Abstract Book XV ILC 2019: Developing Lupin Crop into a Modern and Sustainable Food and Feed Source; Fundación PROINPA: Quillacollo, Bolivia, 2019. [Google Scholar]
  65. Mujica, A.; Moscoso, G. La planta del tarwi. In Lupinus mutabilis (Tarwi): Leguminosa Andina con Gran Potencial Industrial; Zavaleta, A.I., Ed.; Universidad Nacional Mayor de San Marcos, Universidad del Perú, Decana de América Fondo Editorial: Lima, Peru, 2018; ISBN 9789972466205. [Google Scholar]
  66. MINAGRI. Manejo Agronómico. Prácticas de Conservación de Suelo, Producción, Comercialización y Perspectivas de Granos Andinos; MINAGRI: Lima, Peru, 2018; p. 86. [Google Scholar]
  67. Li, B.; Suzuki, J.I.; Hara, T. Latitudinal variation in plant size and relative growth rate in Arabidopsis thaliana. Oecologia 1998, 115, 293–301. [Google Scholar] [CrossRef]
  68. Zhou, L.; Yu, H.; Yang, K.; Chen, L.; Yin, W.; Ding, J. Latitudinal and Longitudinal Trends of Seed Traits Indicate Adaptive Strategies of an Invasive Plant. Front. Plant Sci. 2021, 12, 657813. [Google Scholar] [CrossRef] [PubMed]
  69. Fijen, T.P.M.; Morra, E.; Kleijn, D. Pollination increases white and narrow-leaved lupin protein yields but not all crop visitors contribute to pollination. Agric. Ecosyst. Environ. 2021, 313, 107386. [Google Scholar] [CrossRef]
  70. Kelemu, S.; Shiferaw, E.; Hailu, F. Genetic diversity and population structure of Lupinus albus (l.) from the Amhara region of ethiopia using seed storage protein markers. J. Agric. Sci. 2022, 67, 1–11. [Google Scholar] [CrossRef]
  71. Nadathur, S.R.; Wanasundara, J.P.D.; Scanlin, L. Proteins in the Diet: Challenges in Feeding the Global Population; Elsevier Inc.: Amsterdam, The Netherlands, 2017; ISBN 9780128027769. [Google Scholar]
  72. Shrestha, S.; van’t Hag, L.; Haritos, V.S.; Dhital, S. Lupin proteins: Structure, isolation and application. Trends Food Sci. Technol. 2021, 116, 928–939. [Google Scholar] [CrossRef]
  73. Vishnyakova, M.A.; Kushnareva, A.V.; Shelenga, T.V.; Egorova, G.P. Alkaloids of narrow-leaved lupine as a factor determining alternative ways of the crop’s utilization and breeding. Vavilovskii Zhurnal Genet. Sel. 2020, 24, 625–635. [Google Scholar] [CrossRef] [PubMed]
  74. Gulisano, A.; Alves, S.; Rodriguez, D.; Murillo, A.; van Dinter, B.J.; Torres, A.F.; Gordillo-Romero, M.; de Lourdes Torres, M.; Neves-Martins, J.; Paulo, M.J.; et al. Diversity and Agronomic Performance of Lupinus mutabilis Germplasm in European and Andean Environments. Front. Plant Sci. 2022, 13, 903661. [Google Scholar] [CrossRef] [PubMed]
Figure 1. Genome-wide density plot of 5922 SNPs in the tarwi genome.
Diversity 15 00437 g001
Figure 2. Population structure of 89 samples of tarwi inferred by the STRUCTURE analysis using 5922 SNP markers.
Diversity 15 00437 g002
Figure 3. Principal coordinate analysis (PCoA) of 89 samples of Peruvian tarwi germplasm. Percentages of variance explained by each coordinate are noted in parentheses.
Diversity 15 00437 g003
Figure 4. Dendrogram based on Provesti’s genetic distance and the UPGMA clustering method for 89 accessions of tarwi using 5922 SNP markers. Bootstrap values greater than 70% are shown.
Diversity 15 00437 g004
Table 1. Genomic distribution of 5922 SNPs across 20 chromosomes of L. mutabilis.
ChromosomesNo. of SNPs% SNPsTotal Length (Mb)Density (Kb)
13636.1336.46100.43
23225.4424.7076.70
34106.9230.1573.54
44307.2623.7763.57
53035.1226.3887.05
63445.8133.1196.25
72944.9619.7867.29
83305.5725.5277.34
93315.5921.7565.72
102734.6116.3459.86
113195.3935.96112.74
122374.0019.0780.45
132303.8817.8277.48
142504.2216.2565.01
152804.7320.9674.87
162444.1220.7985.19
172524.2621.3084.52
181843.1116.5990.15
192484.1918.1673.23
202784.6921.9979.10
Table 2. Origin of the tarwi germplasm collection among the two clusters inferred by the STRUCTURE analysis.
Department (Region)Cluster 1Cluster 2
Ancash (north)113
Apurimac (south)31
Cajamarca (north)12
Cusco (south)321
Huancavelica (center)31
Huanuco (center)12
Junin (center)52
La Libertad (north)05
Puno (south)133
Total5930
Table 3. Genetic diversity indices based on 5922 SNPs among two clusters of tarwi.
ClusterNumber of AccessionsNaARHoHeHFisFst
15921.9970.6410.4214.08−0.524
2301.9991.9980.6570.4333.4−0.518
Mean1.9991.9990.6490.4273.74−0.5210.019
Na: number of different alleles, AR: allelic richness, Ho: observed heterozygosity, He: expected heterozygosity, H: Shannon–Wiener index, Fis: inbreeding coefficient, Fst: gene differentiation coefficient.
Table 4. Analysis of molecular variance (AMOVA) of the genetic variation between and within two clusters of 89 accessions of tarwi.
Source of VariationdfSSMSEst. Var.%
Between clusters14960.234960.2395.487.59
Within clusters87101,150.541162.651162.6592.41
Total88106,110.771205.801258.13100
Disclaimer/Publisher’s Note: The statements, opinions and data contained in all publications are solely those of the individual author(s) and contributor(s) and not of MDPI and/or the editor(s). MDPI and/or the editor(s) disclaim responsibility for any injury to people or property resulting from any ideas, methods, instructions or products referred to in the content.

