Article

Assessing the Influence of Anthropogenic Land-Use Changes on Bird Diversity and Feeding Guilds—A Case Study of Kalametiya Lagoon (Southern Sri Lanka)

1
Systems Ecology and Resource Management Research Unit (SERM), Department of Organism Biology, Université Libre de Bruxelles, 1050 Brussels, Belgium
2
Department of Botany, Faculty of Science, University of Ruhuna, Matara 81000, Sri Lanka
3
Ecology & Biodiversity Research Unit, Biology Department, Vrije Universiteit Brussel, 1050 Brussels, Belgium
4
Department of Environmental Sciences, Open University of The Netherlands, 6401 Heerlen, The Netherlands
5
Centre for Environmental Sciences, Research Group Zoology: Biodiversity and Toxicology, Hasselt University, 3500 Diepenbeek, Belgium
6
Faculty of Fisheries and Ocean Sciences, Ocean University of Sri Lanka, Tangalle 82200, Sri Lanka
7
Department of Zoology and Environment Sciences, Faculty of Sciences, University of Colombo, Colombo 00300, Sri Lanka
8
Department of Zoology, Faculty of Science, University of Ruhuna, Matara 81000, Sri Lanka
9
Mangrove Specialist Group (MSG), Species Survival Commission (SSC), International Union for the Conservation of Nature (IUCN), London NW1 4RY, UK
*
Author to whom correspondence should be addressed.
Diversity 2023, 15(3), 383; https://doi.org/10.3390/d15030383
Submission received: 31 January 2023 / Revised: 28 February 2023 / Accepted: 1 March 2023 / Published: 7 March 2023

Abstract

:
Kalametiya Lagoon, a highly threatened Sri Lankan wetland, has undergone drastic hydrological changes in recent decades, due to an upstream irrigation project. These changes led to the invasion of the lagoon water by monospecific Sonneratia caseolaris mangrove stands and Typha angustifolia reedbeds. As Kalametiya has been a nationally recognized bird sanctuary since 1984, this invasion is expected to have brought significant changes upon local avifauna. Therefore, this study aimed at determining the lagoon’s current bird diversity and distribution in relation with habitat types and environmental variables. Thirty-seven point-count stations were studied, between January and April 2022. Seventy-nine bird species, including four endemic and ten nationally threatened species, were encountered during the study period. Invertebrate feeders and polyphages were the richest and most diverse guilds. Bird communities were also found richer and more diverse in T. angustifolia reedbeds than in S. caseolaris mangroves. As feeding guild composition was significantly influenced by several environmental variables (i.e., water nitrate content, water TDS, water pH, soil pH), guilds could have great potential as bioindicators of the ecosystem if further studies are done to explore these relationships. Considering the important bird diversity found in the new habitats, this research brings additional proof that a management aiming at restoring the lagoon to its past state would bring significant changes to its avifaunal community. These changes could, in the future, be more precisely defined by a thorough comparison with past inventories of the lagoon’s bird community.

1. Introduction

In Sri Lanka, 82 lagoons have been recorded, with the majority located in the southern, south-eastern, and eastern coasts of Sri Lanka, where the littoral drift causes accreted sand to form barriers [1,2]. They are ecosystems that contribute to numerous ecosystem services such as food and water provisioning, coastal protection, water quality regulation, nutrient cycling, carbon storage, and several cultural services [3,4]. Mangrove forests associated with coastal lagoons provide additional support to fisheries and additional natural hazard control and regulating and cultural services, and also contribute to wood, fuel, and ethnomedicinal provisioning [5,6,7,8]. Despite these ecological services and economic benefits, overexploitation of the resources, urbanization, eutrophication, pollution, and modification in their watersheds have been threatening coastal lagoons around the world [3]. Coastal ecosystems in Sri Lanka have not escaped from this pressure, as many lagoons have been subject to anthropogenic-driven changes in recent times [1,9,10,11,12]. Among the human activities that have been affecting coastal lagoons, inland irrigation projects are prominent in Sri Lanka [11,13]. Kalametiya Lagoon, on the southern coast of Sri Lanka, is an example of an altered ecosystem caused by such human pressure.
Kalametiya Lagoon, now home to a large mangrove forest, is part of the Kalametiya-Lunama Wetland Sanctuary (Lunama being a smaller lagoon connected to Kalametiya), created by the Fauna and Flora Protection Ordinance of 1984 [14,15]. For the past six decades, Kalametiya’s mangrove forest has been in constant expansion, increasing its cover from 77.5 ha in 1956 to 385.3 ha in 2016, while reducing the lagoon water surface of 86% in the same period [11]. Those changes have been linked to the Udawalawe Irrigation and Resettlement Project (UWIRP), which took place about 40 km upstream of the lagoon [11,13,15]. A direct consequence of the UWIRP has been the constant change of Kalametiya lagoon conditions in recent decades, as illustrated by the high turbidity and nutrient levels as well as the low salinity levels recorded in 2016 [11]. The modified physiochemical parameters, combined with a strong increase in siltation filling at least 40% of the lagoon between 1990 and 2005, caused the co-invasion of the lagoon by Sonneratia caseolaris (L.) Engl. mangrove stands, a low-saline mangrove species, and Typha angustifolia L., a brackish water marsh plant [11,16]. The associated land-use changes are very likely to have brought about changes for the fauna and flora of Kalametiya.
In an ecosystem subject to environmental modifications, species that can show early, clear and easily detected ecological changes are called indicator species [17,18]. They can be used to assess the environmental conditions since they provide an early warning signal of changes in the environment [19,20]. Particularly for mangroves, studying functional diversity of faunal assemblages has been put forward as one of the research priorities for the future [21]. Birds were investigated as indicator species in this study since: (i) they are sensitive to environmental change; (ii) their ecology is generally well-known; (iii) they are ecologically versatile; (iv) they are conspicuous and easily surveyed in many environments; and (v) Kalametiya Lagoon is an important bird sanctuary [14,15,22,23,24,25,26].
Several studies have been conducted on avifaunal changes in response to environmental alterations in Sri Lankan coastal ecosystems. A direct relationship was established between anthropogenic disturbance intensity and the loss of avifaunal diversity in a Sri Lankan estuary [27]. Waterbird abundance and species composition were also linked to salinity levels, water depth, and aquatic macrophyte abundance in three Sri Lankan lagoons, which had been impacted by a similar irrigation scheme as Kalametiya’s [28]. By comparing two of those lagoons, hydrology alterations were shown to impact the same parameters, as well as the bird foraging ecology [29]. Relationships between ecological alterations and bird diversity, assemblage, and foraging guilds have also been recorded in several wetlands around the world. In a lagoon in south-eastern Spain, a strong relationship was observed between the nitrogen load and the abundance of two grebes species [30]. Lake morphometry and water chemistry were found to be significantly connected to the richness and composition of different foraging guilds in eutrophic boreal lakes in Canada [31]. Additionally, in Ethiopian lakes, overall species richness as well as insectivore and granivore species richness were correlated to anthropogenic disturbances [32].
The avifauna of Kalametiya has been well documented by ornithologists and official reports. In 1995, a site report was published on Kalametiya and Lunama lagoons, recording around 151 bird species, with 54 migrant species [33]. Another biodiversity record of the Kalametiya–Lunama Sanctuary was published in 2005, with 168 bird species recorded in a 6-month survey, including 121 residents, 46 winter migrants, and one offshore marine bird [14]. Among those residents, five species were endemic and five were nationally threatened. These reports demonstrated the rich avifaunal diversity and thus conservation importance of the Kalametiya area.
However, variation in species richness or abundance has not been regularly studied, particularly not in response to the ongoing land-use and associated ecological changes. Thus, the aim of this research was to evaluate the current avifaunal diversity and establish a current baseline relationship between ecological variables and bird populations, against which future changes may be compared in Kalametiya. Four specific objectives were formulated: (i) preparation of an extensive list of bird species currently present in the study area; (ii) investigation of habitat-wise differences and overall pattern of diversity indices; (iii) analysis of the relationship between avifaunal species composition and the lagoon’s environmental parameters; and (iv) analysis of the relationship between avifaunal feeding guilds and the lagoon’s environmental parameters.

2. Materials and Methods
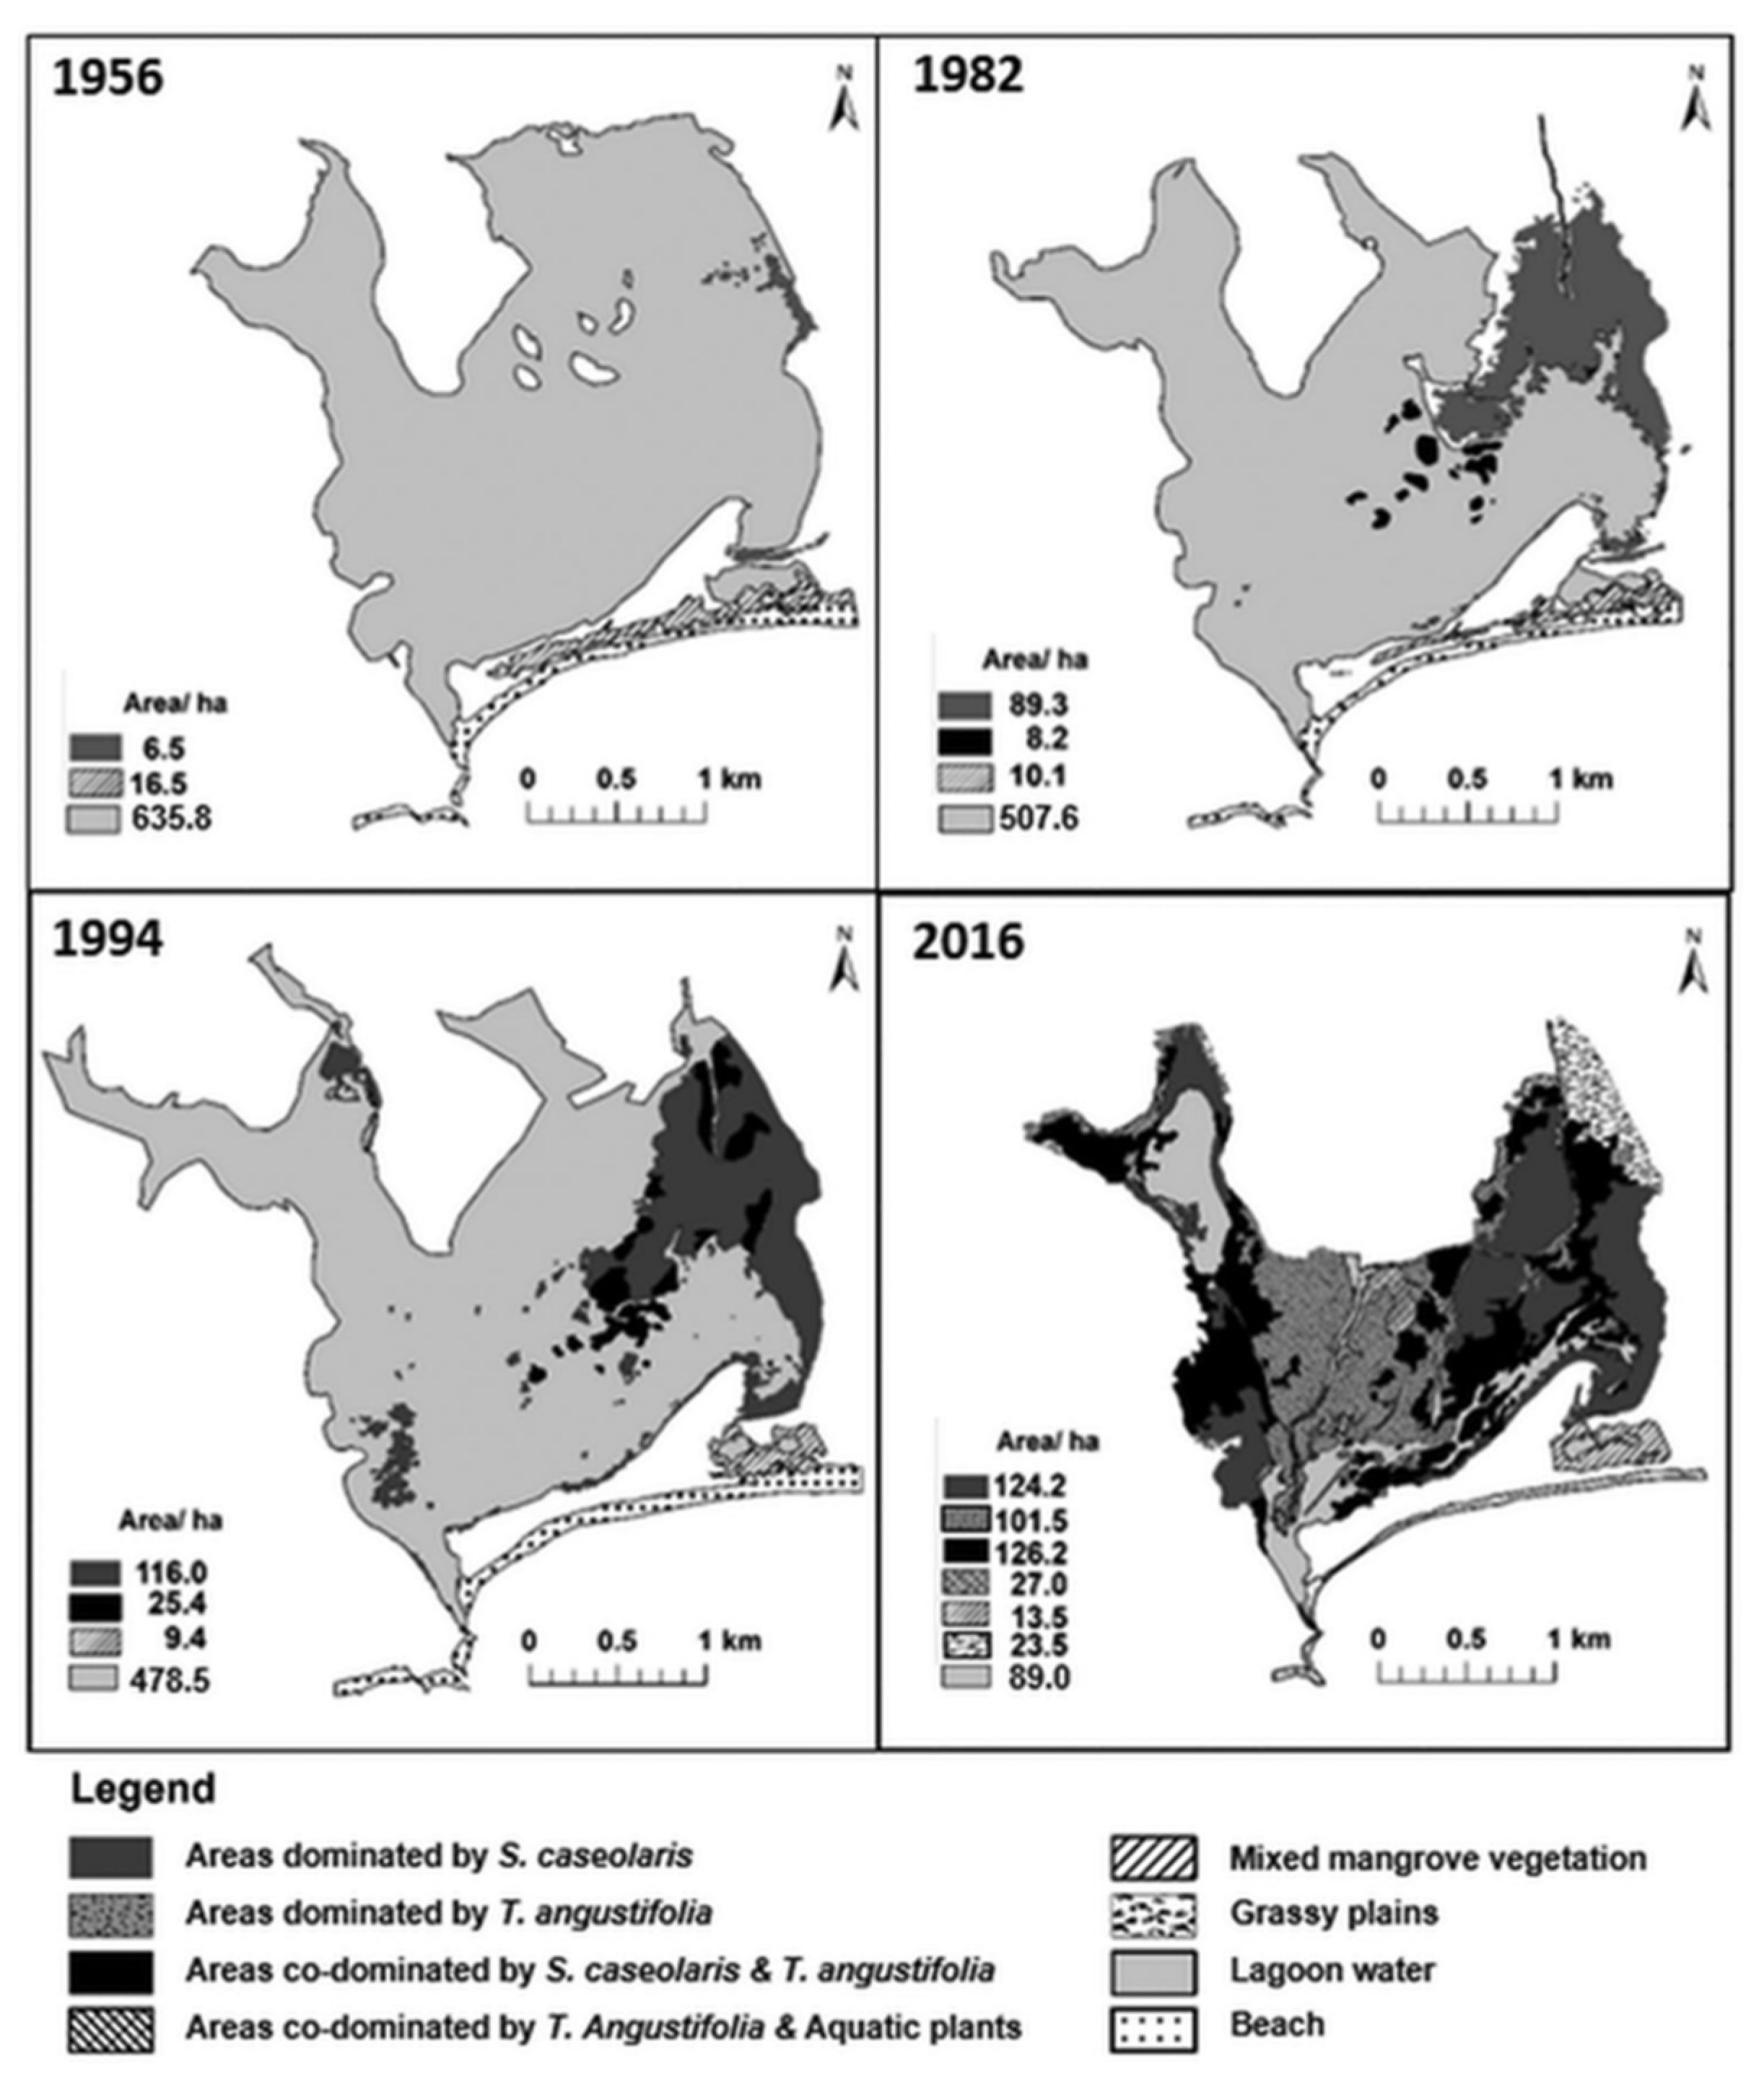
2.1. Study Area

The study area is Kalametiya Lagoon and its direct surroundings. It is located on the southern coast of Sri Lanka in the district of Hambantota, situated in the Low Country Dry Zone of Sri Lanka [34]. Three main habitats were considered since they represent the major land covers of the Kalametiya area: (1) Mature S. caseolaris-dominated habitat (Sc); (2) Young S. caseolaris and T. angustifolia co-dominated habitat (Sc-Ta); and (3) T. angustifolia-dominated habitat (Ta). Maps depicting the years 1956, 1982, 1994, and 2016, combined with the different habitat covers for each period are presented in Figure 1.

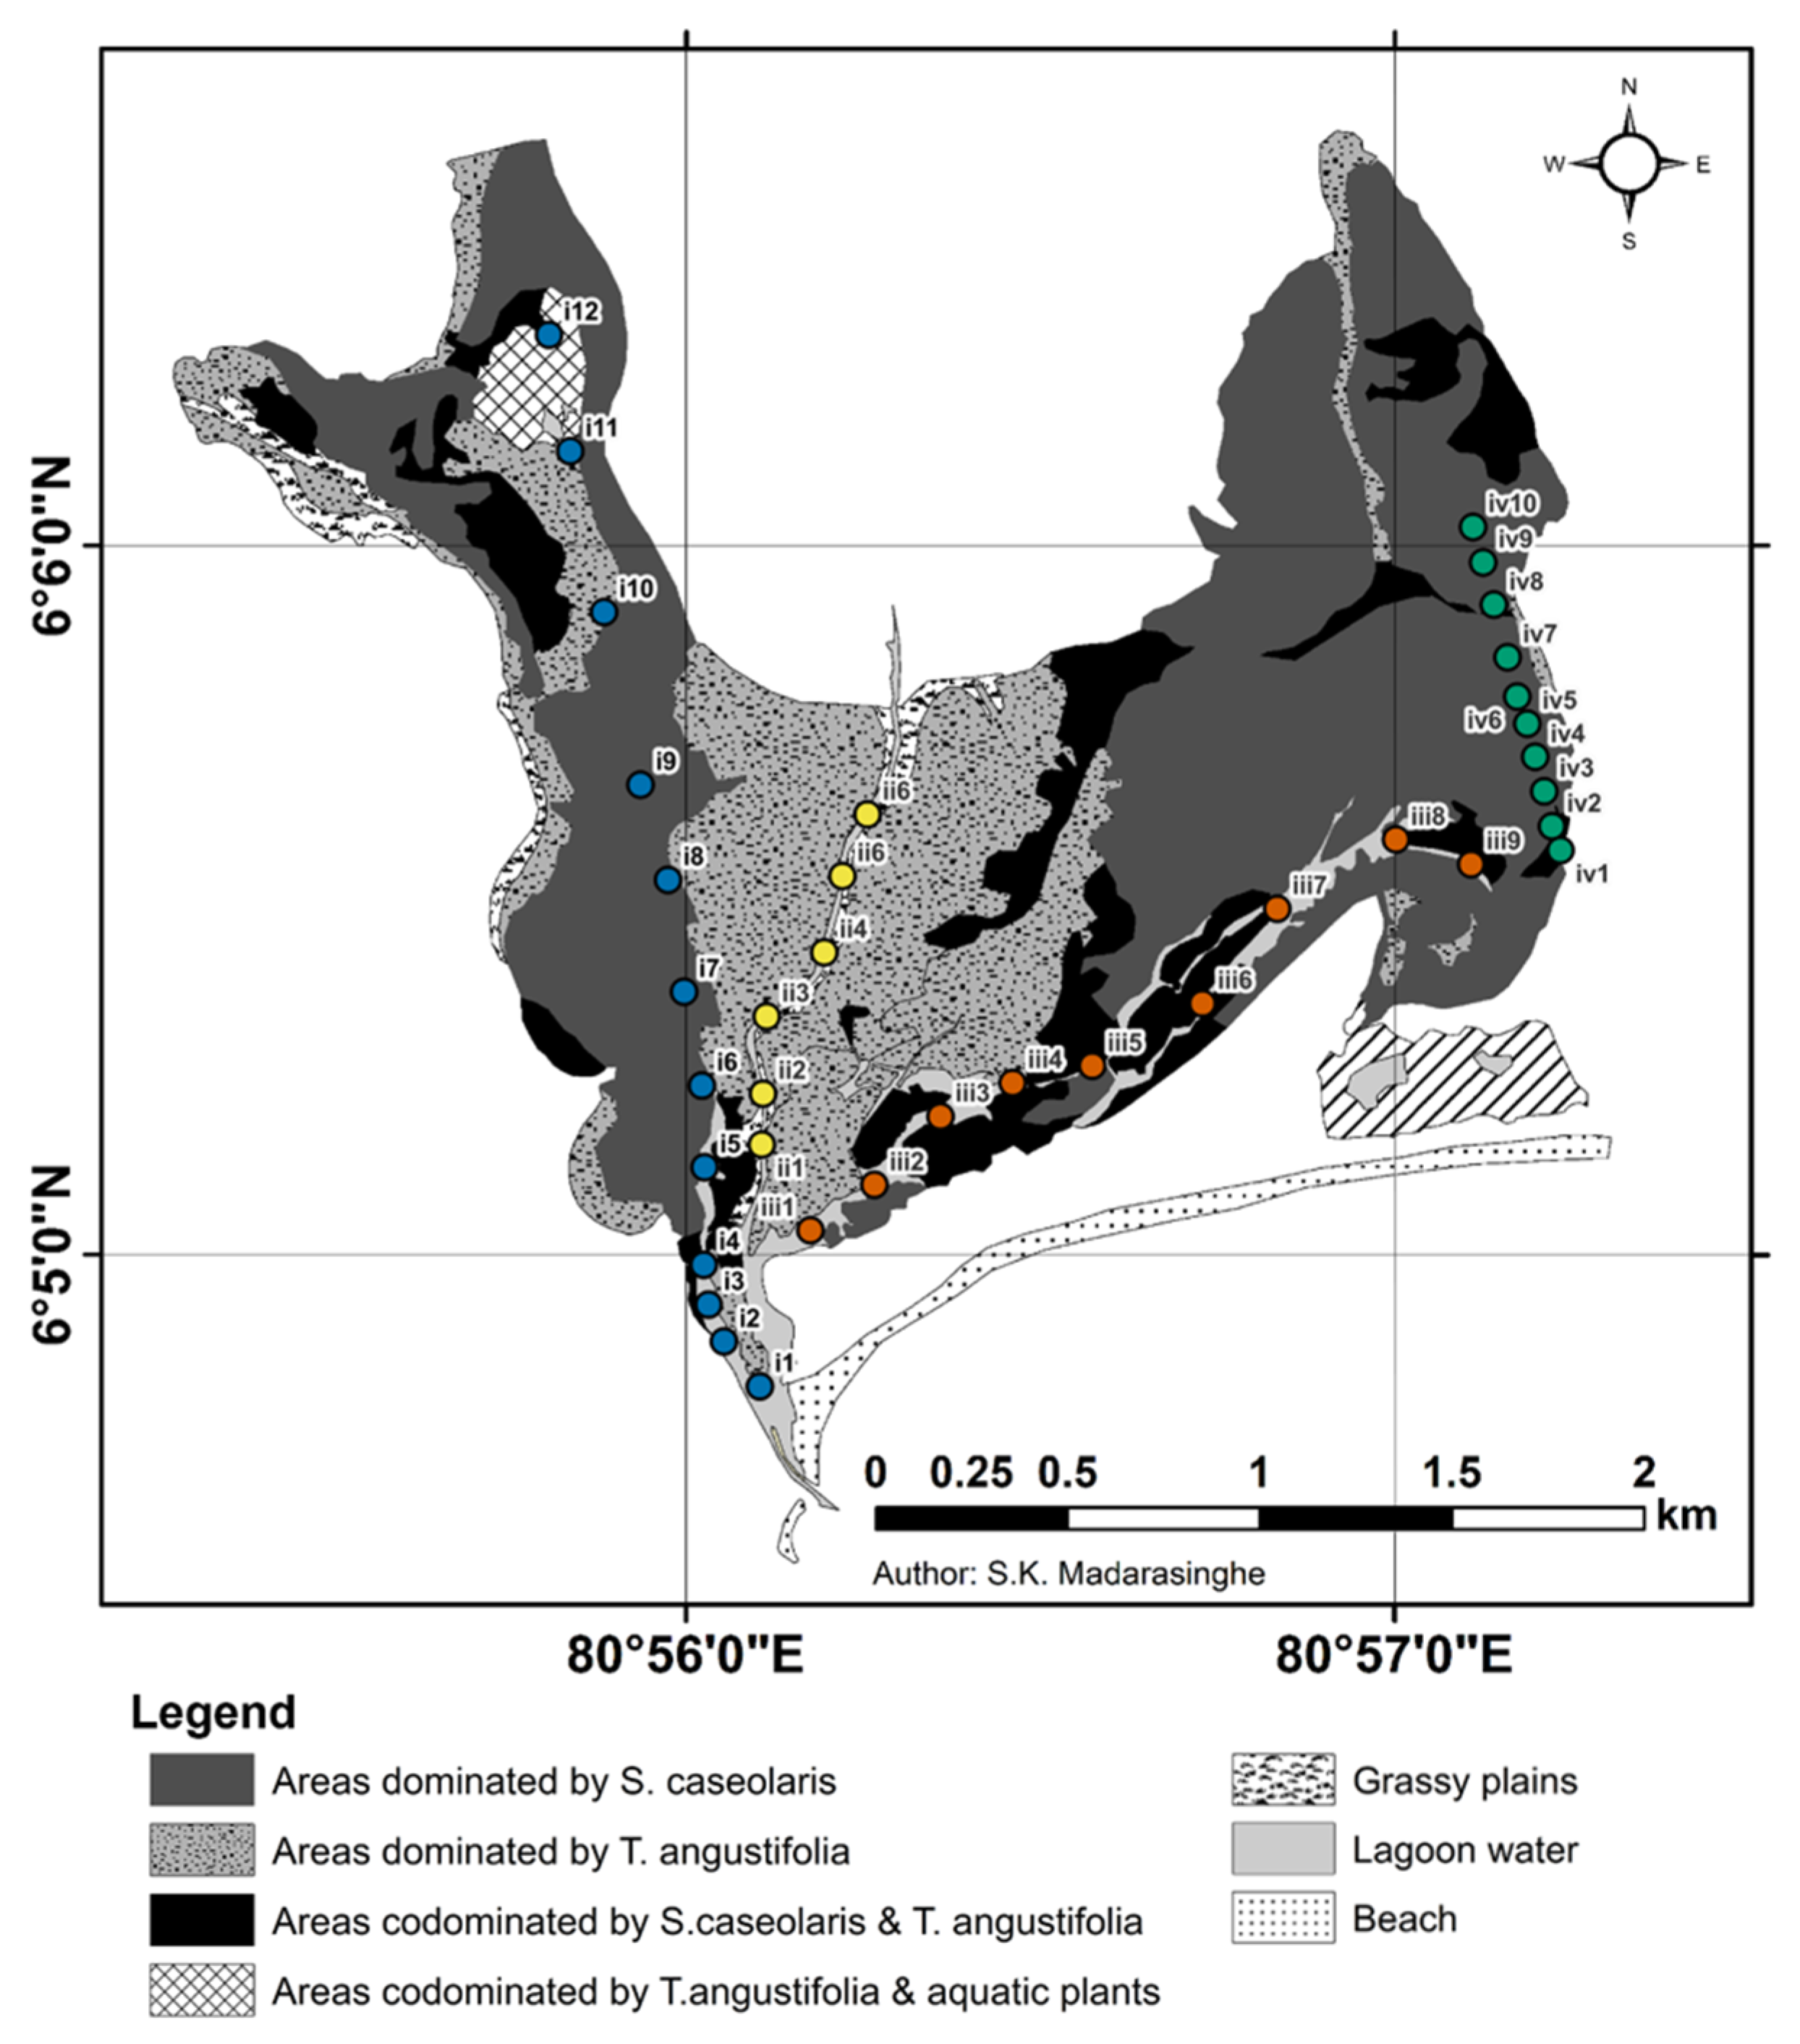
2.2. Sampling Design

The study area boundaries and vegetation distribution were obtained from S.K. Madarasinghe (University of Ruhuna, Sri Lanka) (Figure 2). The location of three transects mainly following the waterways of Kalametiya Lagoon were defined using ArcMap 10.3 Software (Transect I = 06°4′47.486″ N, 080°56′5.586″ E–06°6′20.506″ N, 080°55′44.422″ E; Transect II = 06°5′5.957″ N, 080°56′7.5912″ E–06°5′34.919″ N, 080°56′13.787″ E; Transect III = 06°5′7.775″ N, 080°56′10.691″ E–06°5′36.420″ N, 080°57′4.824″ E; Figure 2). The three transects included the three aforementioned vegetation regions (i.e., Sc, Sc-Ta, and Ta), and their physiochemical parameters had already been measured. An additional fourth transect going through the Sc dense vegetation was surveyed (Transect IV = 06°6′0.508″ N, 080°57′15.127″ E–06°6′31.7664″ N, 080°57′4.468″ E; Figure 2). It allowed for including birds not present at the edge of the mangrove habitat and thus not visible from the waterways. As the mangroves were dense habitats, the point-count method was selected over the line transect method for bird surveys, to allow for a higher detection rate.
Based on field accessibility, we established 37 point-count stations, further referred to as “sites”, following the previously mentioned transects. Coordinates of each site were determined using the Google Earth Pro mobile application (Table S1). The sites were placed on a 2021 LULC map of the study area (Figure 2). Sites were located at a minimum distance of 100 m for the first three transects. The recommended distance of 200 m between sites [35,36,37,38] was not respected for three main reasons: (i) to account for the high density of birds in the Kalametiya sanctuary, (ii) to reduce time spent between sites, as the paddle boat was slow, and (iii) the high visibility from the waterway already reduces the probability of double counting birds. A shorter minimum distance of 50 m between sites was used for the fourth transect, because of its reduced accessibility. A pilot study was also made in August to check the relevance of the sampling method and obtain a preview of the bird community.

2.3. Bird Surveys

Sampling was performed in small observer groups at sunrise and ended before noon as birds are mostly active during that time [35,36]. Evening surveys were also conducted, starting at 4 pm and closing shortly before sunset, as some birds are also active during that time and different species may be observed [35]. No waiting time was needed before the start of the survey located in the waterway, as the paddle boat was discrete enough to not disturb the birds. When walking was necessary to access a certain site, the observations began after an approximate wait of one minute to allow the birds to settle again [38]. The chosen count period was 5 min, in correspondence to the time range advised by several studies [35,36,37,38]. Thus, birds were surveyed in an approximate 50 m radius for 5 min at each site, using both visual and auditive recognition. Birds in flight were not recorded during the surveys, except if their origin or landing point was observed. PENTAX SP 8 × 40 WP binoculars were used for the survey. The Birds of Sri Lanka guidebook was used to identify the birds if needed [39]. The survey period lasted for four months, from January to April 2022. During this period, all sites were surveyed twice in the morning and twice in the evening. The dates of the surveys are as follows: (i) 08 April (morning and evening) and 28 April (morning and evening) for Transect I, (ii) 14 January (morning and evening) and 06 April (morning and evening) for Transect II, (iii) 10 January (evening), 11 January (morning), and 18 April (morning and evening) for Transect III, and (iv) 20 March (morning and evening) and 07 April (morning and evening) for Transect IV.
The vernacular name in English, order, family, genus, and species were collected for all species observed on the study site. Species taxonomy followed the IOC Master List V12.1 [40]. The Global Conservation Status (GCS) of each species was extracted from the recently updated IUCN Red List [41]. The species’ phenological status was also extracted for each species, using the 2021 National Red List of Sri Lanka [42]. The Birds of the World database was used to describe the feeding guilds [43], mainly based on the categories defined by [44]: Carnivorous (Car), (ii) Piscivorous (Psc), (iii) Invertebrate feeders (Inv), (iv) Herbivorous (Hrb), or (v) Polyphage (combination of two or more of the previous categories; Pol). Herbivorous then was divided in four feeding guilds: frugivorous (Hrb-F), granivorous (Hrb-G), frugivorous–granivorous (Hrb-FG), and a guild containing species primarily consuming plants’ vegetative parts (Hrb-P). Hrb-P was considered in the analysis to include the specific diet of Porphyrio poliocephalus (Latham, 1801) (i.e., plants’ vegetative parts), which represented a significant portion of the observations. Thus, eight feeding guilds in total were considered. Habitat was mentioned when species were observed on affiliated sites.

2.4. Vegetation Sampling

Vegetation sampling was performed at the 37 sites, in the last week of May. Two parameters, tree height, and tree girth at 130 cm above the soil and along the stem (G130), were measured in the field. These parameters were collected for the 10 closest trees to each site centre within a radius limit of 50 m. If no or less than 10 trees were present within the 50 m radius, then no or less than 10 trees were measured. Only trees with a G130 superior to 16 cm were considered, to avoid underestimates for sites displaying a high density of both mature and juvenile trees. Based on all the trees measured in the 50 m radius, the height and G130 means were calculated for each site. The mean basal area ( Basal   Area ¯ ) was then computed with the following formula:
Basal   Area ¯ = π   ×   ( D ¯ 130 / 2 ) 2
where D ¯ 130 is the mean diameter at 130 cm above the soil and along the stem, which was calculated as follows:
D ¯ 130 = G ¯ 130 / π
where G ¯ 130 is the mean girth at 130 cm above the soil and along the stem. To assess variations in forest structures, the variances of the basal area and height were also determined for each site.

2.5. Environmental Sampling

Six water variables were used to assess the environmental conditions of Transect I/II/III sites: water pH, water Total Dissolved Solids (TDS), water salinity, water Biochemical Oxygen Demand (BOD), water phosphate content, water nitrate content. As no water body was remotely close to Transect IV, five sediment variables were used instead for its sites: soil pH, soil salinity, soil phosphate content, and soil nitrate content. The water and sediment variable dataset was shared by G.G.N.K. Wijeratne, from her previous study on Kalametiya’s soils [45].

2.6. Habitat Affiliation

Spatial analysis was needed to affiliate a specific habitat to each site, as several were surrounded by more than one habitat type. This analysis was performed on QGIS 3.24.3, using the 2021 LULC-map of the Kalametiya area (Figure 2) and the mobile-based Google Earth Pro site coordinates (Table S1). First, a 100 m radius buffer was created around every sampling site. The distance of 100 m was chosen to compensate for the inaccuracy of mobile-based coordinates. The area covered by every habitat type was then measured within each buffer, and those values were converted to percentages of the 100 m radius area. Areas belonging to the Grassy Plain habitat were not considered in the percentage calculations since they accounted for a low proportion of the buffer area while hiding the overall Ta-habitat affiliation. A minimum coverage of 75% of the buffer area by one habitat was chosen as the threshold for the habitat-site affiliation.

2.7. Avifauna Analysis

Two types of index values were used in the analysis: (i) the total index value using the pooled data of all sites included in a category, and (ii) the mean index value corresponding to the mean of individual index values of each site included in a category. Mean index values were calculated to account for the difference in site sample size between habitats.
Along with the number of observations (N), three estimates of species richness were computed for the overall study and each habitat: observed species richness (S), and two incidence-based nonparametric estimators Chao2 and Jacknife2 [46,47]. The aim of the nonparametric methods was to control for sampling effort effect and estimate the lower boundary of the actual species richness. Both total and mean index values were calculated for S and N ( S ¯ and N ¯ for the respective means).
Six diversity indices were additionally computed in PRIMER 7 v.7.0.21 for the overall study, the feeding guilds, and the habitats: (i) the commonly used Shannon–Wiener Index H, (ii) a modified form of Simpson’s dominance index 1−λ, (iii) an equitability index, Pielou’s evenness J, (iv) the average taxonomic distinctness Δ*, (v) the average taxonomic breadth Δ+, and (vi) the taxonomic distinctness variation Λ+. The average taxonomic distinctness estimates taxonomic diversity based on abundance data, whereas the average taxonomic breadth uses incidence data. The taxonomic distinctness variation estimates the variation of the average taxonomic breadth within a sample. Formulas of the indices are as defined by [48]:
(i)
Shannon–Wiener’s Index:
H = i p i   log ( p i )
where pi is the proportion of the total abundance of species i.
(ii)
Simpson’s Index:
1 λ = 1 ( i p i 2 )
where pi is the proportion of the total abundance of species i.
(iii)
Pielou’s Evenness:
J = H / H max
where H max is the maximum value of Shannon–Wiener diversity, reached if all species are equally abundant.
(iv)
Taxonomic Distinctness:
Δ = [ i < j ω ij x i x j   ] / [ i < j x i x j   ]
where xi is the number of individuals of species I, xj is the number of individuals of species j, and wij is the taxonomic distance between species i and species j.
(v)
Taxonomic Breadth:
Δ + = [ i < j ω ij ] / [ S ( S 1 ) / 2 ]
where i and j are a pair of distinct species, wij is the taxonomic distance between species i and species j, and S is the observed species richness.
(vi)
Taxonomic Distinctness Variation:
Λ + = [ i < j ( ω ij Δ + ) 2 ] / [ S ( S 1 ) / 2 ]
where i and j are a pair of distinct species, wij is the taxonomic distance between species i and species j, S is the observed species richness, and ∆+ is the Taxonomic Breadth. For the overall study and feeding guilds, total diversity indices were calculated using data from all the sites. For habitats, mean diversity indices and their standard deviations were calculated using affiliated sites data. To compare habitats, statistical tests were performed in R-Studio 2022.02.3 [49]. Normality and homoscedasticity were verified with the Shapiro–Wilk test (package stats [49], function shapiro.test) and the Levene test (package car [50], function leveneTest), respectively. When those two assumptions were met, a two-sided Welch t-test (package stats, function t.test) was performed to account for differences in sample size. When they were not met, a two-sided nonparametric Wilcoxon test (package stats, function wilcox.test) was used. Means and standard deviations were also calculated for S and Relative Abundances (RA) for each guild within each habitat. Their statistical comparisons were performed as explained above and plotted on a bar chart (package ggplot2 [51], function ggplot).
R-Studio 2022.02.3 was also used for multivariate analysis. To visualize species composition differences between sites and habitats, the Principal Component Analysis (PCA) (package vegan [52], function rda) unconstrained ordination method was used. To model relationships between environmental variables and species composition, the Redundancy Analysis (RDA) (package vegan, function rda) constrained ordination method was used. Both methods follow [53]. Abundance data was transformed in Hellinger distances (package vegan, function decostand and rda) with the formula [53,54]:
D Hellinger ( x 1 , x 2 ) = j = 1 p [ y 1 j y 1 + y 2 j y 2 + ]
where x 1 and x 2 are two distinct sites, j = { 1 p } is the species, y i j is the number of individuals of species j at site i , and y i + is the sum of species numbers of individuals of site i . Two sets of ordination analysis were performed: (i) on species transformed abundances and (ii) on feeding guild transformed abundances. Feeding guild abundances of a site are further referred to as feeding guild composition. Each set of ordination included one PCA and two RDA ordinations: one RDA on Transects I/II/III sites for which water variables were available, and one on Transect IV sites for which sediment variables were available. For Transect I/II/III RDA ordinations, twelve explanatory variables were used: latitude, longitude, water pH, water TDS, water salinity, water BOD, water phosphate content, water nitrate content, mean tree basal area, mean tree height, tree basal area variance, and tree height variance. For Transect IV RDA ordinations, ten explanatory variables were used: latitude, longitude, soil pH, soil salinity, soil phosphate content, soil nitrate content, mean tree basal area, mean tree height, tree basal area variance, and tree height variance. Explanatory variables were first standardized (package base [49], function scale). A matrix of correlation was then created for each set of variables (package stats, function cor) using nonparametric Spearman’s rank correlation coefficient. The variable with the highest mean absolute correlation was then removed for each pair of variables with a correlation coefficient superior to 0.7 (package caret [55], function findCorrelation). Final RDA models were created with a forward selection of explanatory variables using the double R2 stopping criterion (package vegan, function ordiR2step), in order to reduce the overestimation of explained variance and the high Type 1 error [56]. Variables were added randomly to the model in order to maximize its adjusted R2 ( R   adj 2 ). It stopped when the adjusted R2 decreased or exceeded the model including all explanatory variables, or when the permutation p-value limit of 0.05 was exceeded. RDA ordinations were plotted using their first two ordination axis, explaining the most amount of variance (package ggplot2, function ggplot).

3. Results

3.1. Habitat Affiliation

Out of the 37 sites sampled, 16 were affiliated to a specific habitat (i.e., Sc, Ta, Sc-Ta). Five sites, all from Transect II (i.e., ii2, ii3, ii4, ii5, ii6), were affiliated with the Ta habitat. Ten sites, from both Transect I and Transect IV (i.e., i7, i9, iv3, iv4, iv5, iv6, iv7, iv8, iv9, iv10), were affiliated with the Sc habitat. Only one site, from Transect III (i.e., iii6), was affiliated with the Sc-Ta habitat. As one site is not a statistically sufficient sample size, the Sc-Ta habitat was not included in most of the following analyses.

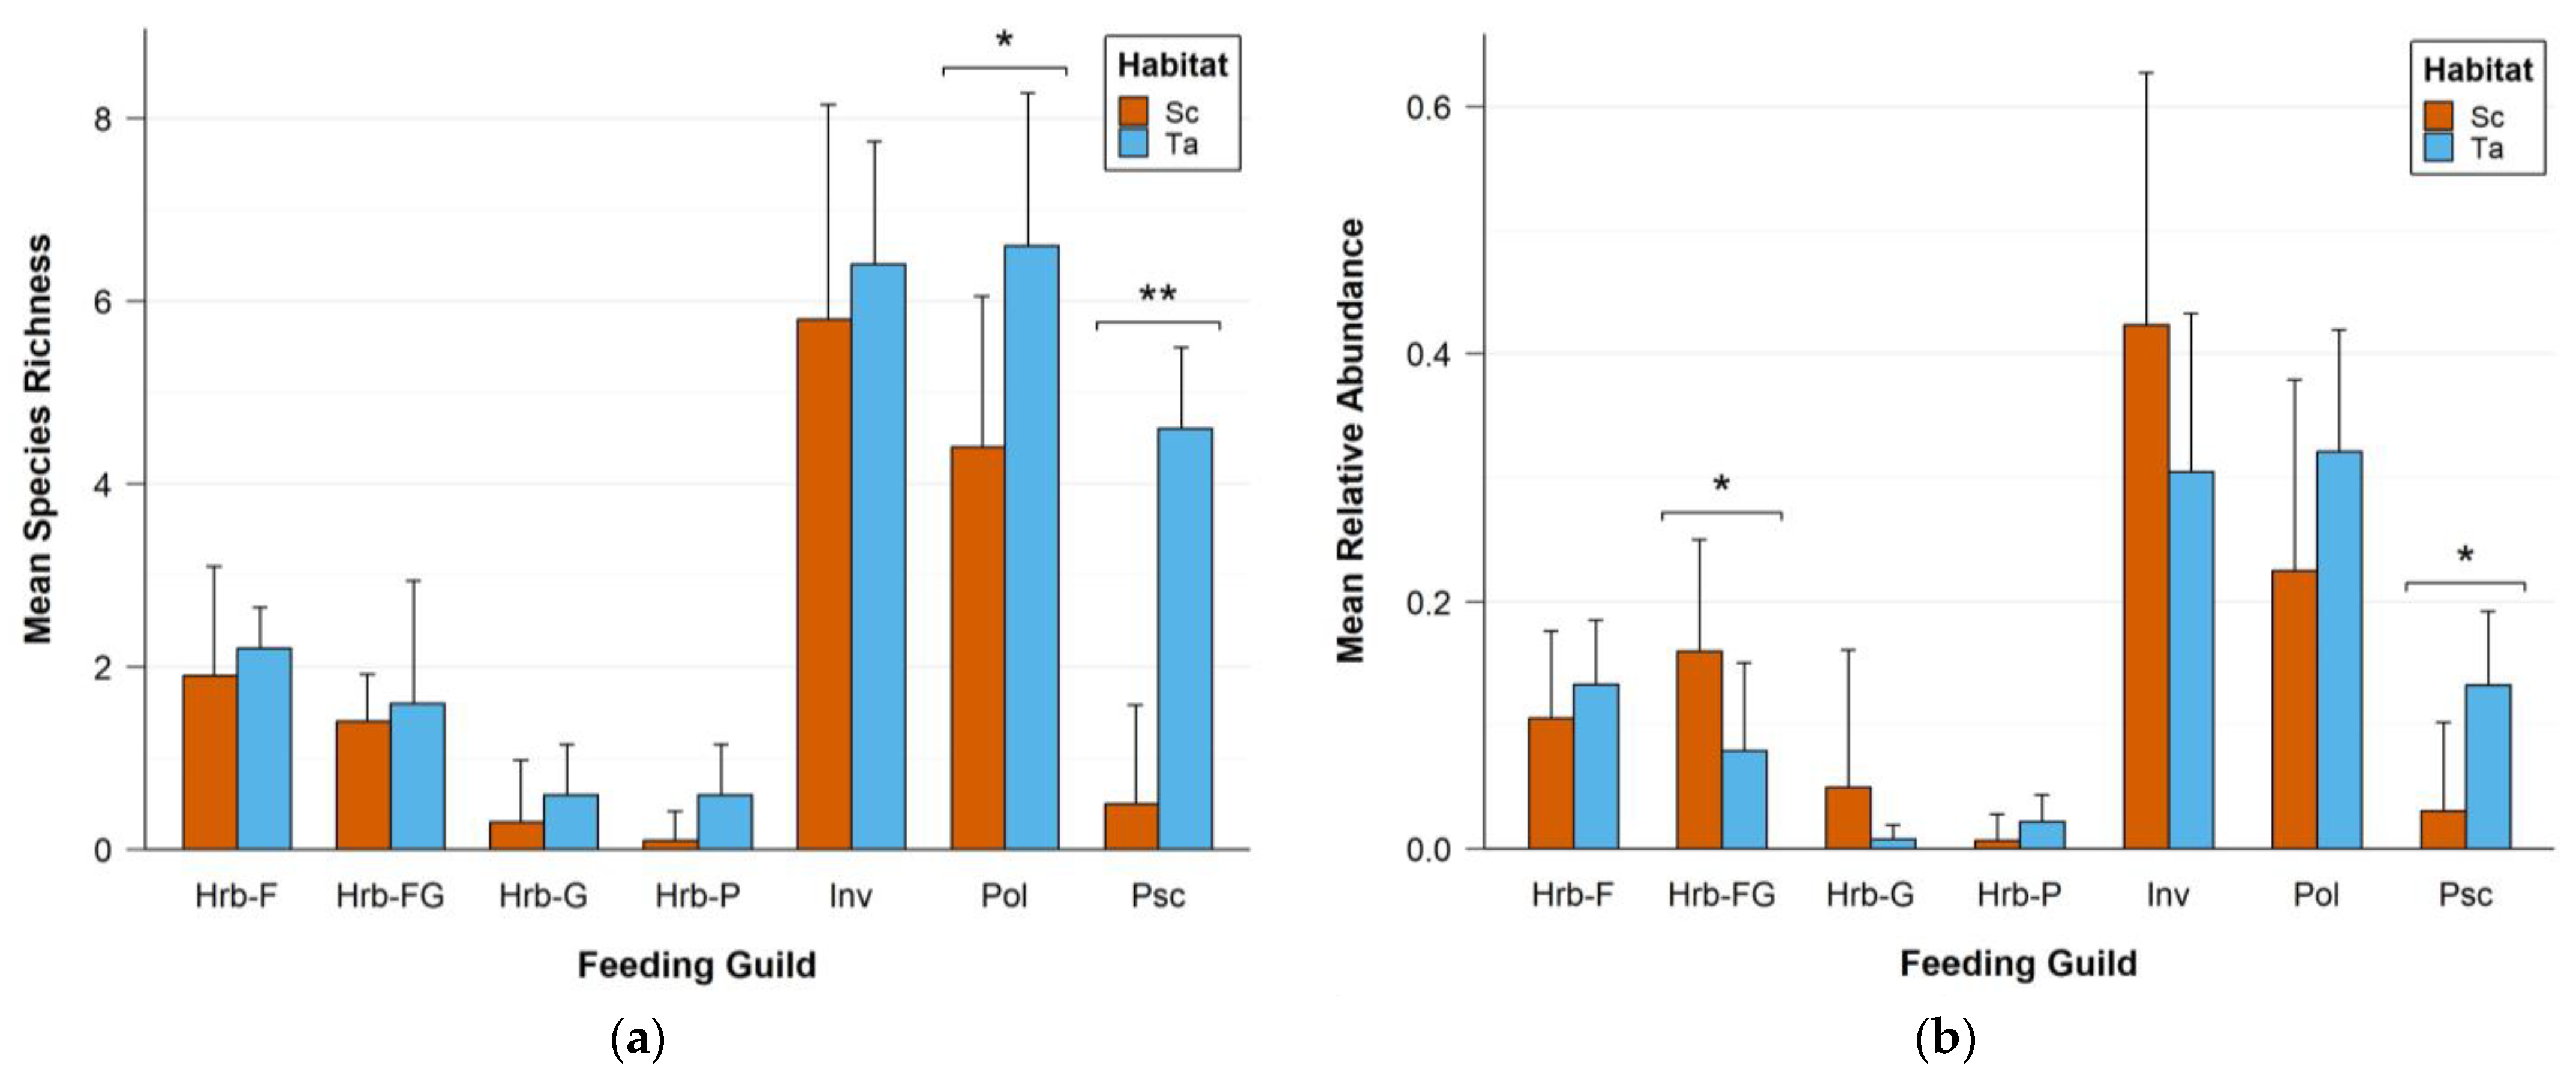
3.2. Diversity Analysis

The extensive list of birds encountered during the study period in Kalametiya is provided in the Supplementary Materials (Table S2). Over the totality of the study period (including observations made outside of survey periods), 79 species, belonging to 40 families and 14 orders, were observed. A total of four endemic species were encountered: Cecropis hyperythra (Blyth, 1849), Dicaeum vincens (Sclater, 1872), Dinopium psarodes (Lichtenstein, 1793), and Gallus lafayettii (Lesson, 1831). Ten nationally threatened species were observed: three critically endangered (Sterna hirundo (L., 1758), Columba livia (Gmelin, 1789), and Merops philippinus (L., 1767), three endangered (Acrocephalus stentoreus (Hemprich and Ehrenberg, 1833), Dicaeum vincens, and Ixobrychus sinensis (Gmelin, 1789)), one vulnerable (Sternula albifrons (Pallas, 1764)), and three near threatened (Streptopelia decaocto (Frivaldszki, 1838), Merops leschenaulti (Vieillot, 1817), and Lonchura malacca (L., 1766)). Additionally, seven of the 79 encountered species were considered globally threatened, and all were classified as near threatened. A large majority of the birds were residents, with only 10 observed migrant species.
During the surveys, the three most abundant birds were Himantopus himantopus (L., 1758), Tringa totanus (L., 1758), and Corvus splendens (Vieillot, 1817), accounting for 10.29%, 9.35%, and 5.67% of the total number of observations, respectively. Five of the ten most abundant species belonged to the invertebrate feeder guild. Relative abundances, number of observations, feeding guild, and affiliated habitats are presented below for all species observed during the surveys (Table 1).
Among the seven considered feeding guilds, the invertebrate feeder and polyphage guilds displayed a notably higher total observed species richness (i.e., 21 and 19 species, respectively) and relative abundance (i.e., 41.18% and 28.86%). The piscivorous guild only included nine species with a total relative abundance of 9.67%. The herbivorous guild, when all sub-categories were combined, was represented by 15 species and a relative abundance of 20.29%. Within the herbivorous guild, eight species were frugivorous, four frugivorous–granivorous, two granivorous, and one primarily consumed plants’ vegetative parts (Grey-headed Swamphen). Both the Shannon–Wiener (H) and Simpson’s indices (1−λ) showed higher values for guilds with a higher observed species richness, although it was lower for the richest guild (invertebrate feeders) ( H Inv = 2.263) than for the polyphage guild ( H Pol = 2.483). The polyphage guild displayed the second highest evenness ( J Pol = 0;8432) whereas the invertebrate feeders exhibited the lowest ( J Inv = 0.7434). The highest taxonomic diversity was found in the frugivorous guild when the index factored in abundances ( Δ Hrb - F = 97.54). When only incidence of species was considered, the polyphage guild showed the highest taxonomic diversity ( Δ   Pol + = 96.05). The variation of taxonomic distances between the species of a same guild was the highest in the frugivorous–granivorous guild ( Λ   Hrb - FG + = 625) and the lowest in the polyphage guild ( Λ   Pol + = 141.6). All diversity indices for each feeding guild are displayed below (Table 2).
Total S, Total N, Chao2, and Jacknife2 were higher in the Sc habitat than in the Ta habitat (Table 3). ( S ¯ was found statistically higher in Ta ( S ¯ Ta = 22.6 ± 2.61) than in Sc ( S ¯ Sc = 14.4 ± 2.17) (t = 5.06, df = 6.88, p-value = 0.00054). Species richness estimators and number of observations for the overall study are also presented in Table 3.
Among the six diversity indices of Sc and Ta habitats (Table 4), only the Shannon–Wiener Index was found to be significantly different. Its mean was significantly higher in the Ta habitat ( H ¯ Ta = 2.83 ± 0.31) than in the Sc habitat ( H ¯ S c = 2.39 ± 0.16) (t = 3, df = 5.10, p-value = 0.029).
Among their five most abundant species (Table 5), Sc and Ta habitats only shared one: Leptocoma zeylonica (L., 1766). Leptocoma zeylonica, Spilopelia chinensis (Scopoli, 1786), and Vanellus indicus (Boddaert, 1783) were the three most abundant species in the Sc habitat with 13.57%, 12.12%, and 7.43% of total bird count, respectively. For the Ta habitat, the three most abundant species were Himantopus himantopus, Ardea purpurea (Sykes, 1832), and Leptocoma zeylonica with 9.14%, 5.91%, and 5.65% of total bird count, respectively. Corvus splendens represented a significant part of the observations in both habitats (sixth most abundant species in Sc, fifth most abundant species in Ta).
Comparison of the foraging guilds mean observed species richness and relative abundance between the Sc and Ta habitats is displayed on Figure 3. The polyphage guild ( S ¯ Pol - Ta = 6.6 ± 1.67, S ¯ Pol - Sc = 4.4 ± 1.65; t = −2.41, df = 7.98, p-value = 0.042) and the piscivorous guild ( S ¯ Psc - Ta = 4.6 ± 0.89, S ¯ Psc - Sc = 0.5 ± 1.08; W = 0.5, p-value = 0.0013) showed a higher species richness in Ta than in Sc. The frugivorous–granivorous guild ( RA ¯ FG - Sc = 0.16 ± 0.09, RA ¯ FG - Ta = 0.08 ± 0.071; t = 2.83, df = 12.27, p-value = 0.015) was significantly more abundant in Sc than in Ta, in contrast to the piscivorous guild ( RA ¯ Psc - Ta = 0.13 ± 0.06, RA ¯ Psc - Sc = 0.03 ± 0.07; W = 6, p-value = 0.014).

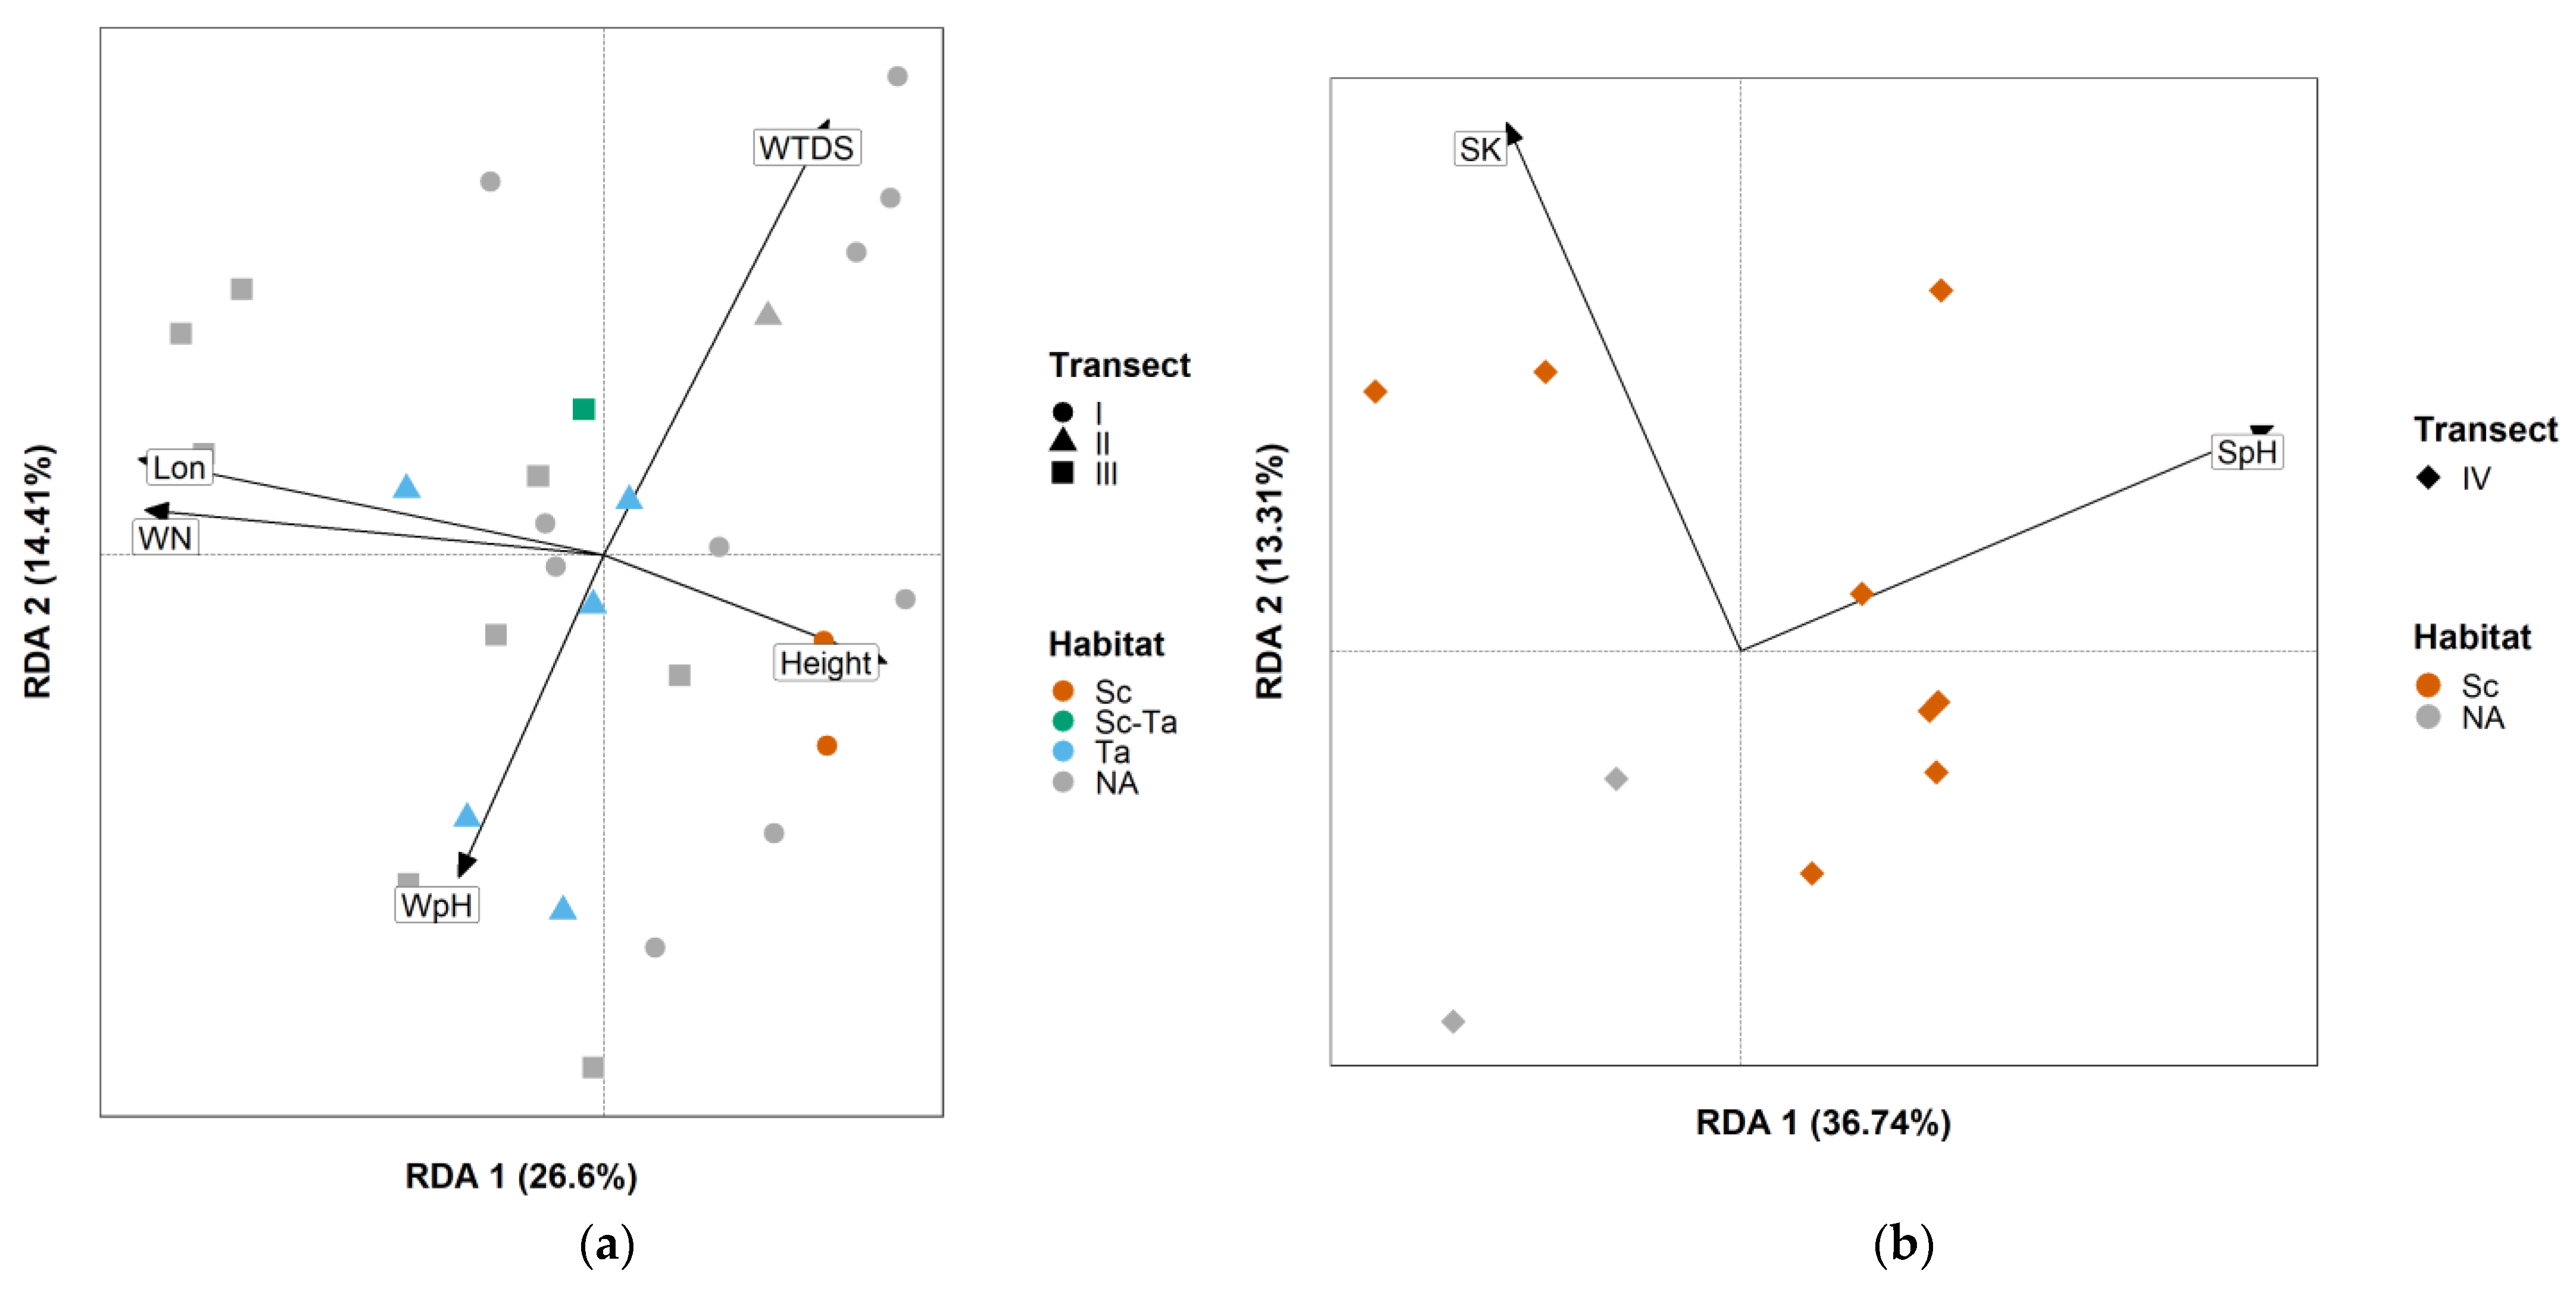
3.3. Multivariate Analysis

As multivariate analysis of species composition poorly explained the variation in both PCA (proportion of explained variation of 29.74% when the two first ordination axes were added) and RDA ( R   adj 2 of 8.96% and 14.52% for the first and second model, respectively) compared to feeding guild composition, and guild abundances were used for both ordination methods.
The PCA ordination diagram was built with the two first ordination axes PC1 (Eigenvalue = 0.089, Explained Proportion = 42.79%) and PC2 (Eigenvalue = 0.041, Proportion Explained = 19.99%), accounting for a total of 62.78% of the guild composition variation among sites (Figure 4). The only observed pattern was a cluster of Transect IV sites, as habitat affiliation did not show significant impact on the grouping of affiliated sites.
In the Transect I/II/III environmental dataset, mean tree basal area and water salinity were removed because of their respective correlation with mean tree height ( r S = 0.769) and latitude ( r S = 0.758). Following the forward selection, five variables were found to have significantly influenced feeding guild composition: water nitrate content (p-value = 0.001), water TDS (p-value = 0.006), longitude (p-value = 0.006), water pH (p-value = 0.014), and mean tree height (p-value = 0.023). The final RDA model was strongly significant (p-value = 0.001, variance = 0.077, F = 3.90) and explained more than a third of the guild abundances’ variations ( R   adj 2 = 0.36). Habitat affiliation did not show any significant pattern in the RDA ordination diagram (Figure 5A). After the removal of correlated variables in the Transect IV environmental dataset, five variables remained: soil pH, soil salinity, soil phosphate content, tree basal area variance, and tree height variance. After the forward selection, only soil pH (p-value = 0.006) was found to significantly influence feeding guild composition. Soil phosphate content was also added to the model as it almost reached the significance threshold (p-value = 0.066), and in order to explore possible patterns. The final model was strongly significant (p-value = 0.008, variance = 0.057, F = 3.51) and explained again more than a third of the guild composition variation ( R   adj 2 = 0.36). A no habitat affiliation visual pattern was also observed (Figure 5B).

4. Discussion

During this research, 15% of the 522 bird species present in Sri Lanka were encountered, encompassing nearly half of the country’s taxonomic families [57]. Locally, the observed avifaunal richness of Kalametiya Lagoon was slightly lower than neighbouring Rekawa Lagoon, where 104 bird species have been recorded [58]. Kalametiya Lagoon thus includes more than 40% of the 184 bird species present in the Rekawa, Ussangoda, Kalametiya inland coastal area [59]. Four of the 34 nationally endemic bird species were encountered in Kalametiya Lagoon: Dicaeum vincens, Dinopium psarodes, Gallus lafayettii, and Cecropis hyperythra.
In the last inventory of the area, 168 species were recorded including five endemic birds [14]: Gallus lafayettii, Treron pompadora (Gmelin, 1789), Cecropis hyperythra, Tephrodornis affinis (Blyth, 1847), and Pellorneum fuscocapillum (Blyth, 1849). The lower number of species observed in the current study could likely be due to the lower sampling effort, as the previous inventory was conducted for 6 months at fortnightly intervals both day and night. This supposition is however not supported by the fact that non-parametric species richness estimators were almost equal to the observed species richness for the overall study site. The previous study also used line transects in addition to point-counts, whereas this study only relied on point-counts. As the last inventory surveyed the entire Lunama–Kalametiya Wetland Sanctuary, the covered area was at that time much larger and included several additional habitats (e.g., anthropogenic habitats, sand dunes, salt marches) [14]. Furthermore, no sampling site was placed in the Kalametiya Lagoon mixed-mangrove patch (Figure 2), which could be the reason for some of the missed diversity. The difference in species richness and assemblage (e.g., new endemic species) could finally be the result of the rapid evolution of Kalametiya Lagoon, due to a continuous co-invasion of lagoon water by T. angustifolia reedbeds and S. caseolaris mono-specific mangrove forests [11]. Several nationally important species were however observed in both studies, such as Merops philippinus, Colomba livia, and Sterna hirundo, which are globally common but critically endangered in Sri Lanka [42]. Four of the five most abundant species observed in this study were also labelled as very abundant in the last inventory [14], suggesting that the bird community did not experience a complete turn-over in the last two decades.
The abundant presence of Corvus splendens, species known to be an anthropogenic disturbance indicator [27], indicates that the lagoon itself is subject to important human influence. This is in agreement with the “High Threat” status given by the National Wetland Directory to Kalametiya–Lunama lagoons [58]. Corvus splendens did not, however, dominate the lagoon bird assemblages (i.e., relative abundance of 5.67%), suggesting that the lagoon avifauna could still be driven by natural variables. However, abundance-based results must be considered carefully in this research as bird counts are strongly influenced by the detectability variation between species, caused by differences in species’ physical and behavioural attributes such as body size and vocalization characteristics [60,61].
Among the feeding guilds, the invertebrate feeders were the most abundant and displayed the highest species richness. This pattern could be explained by the abundance of mangrove patches in Kalametiya, which tend to support important insectivorous communities [62]. It is however not consistent with the history of the lagoon, as insectivores has been shown to respond negatively to disturbances [63]. The polyphages were the second richest and most abundant guild, as well as the most diverse. It could be due to the multiplicity of habitats in Kalametiya Lagoon (Figure 2), creating an important diversity of available resources.
The total species richness was found to be higher in the S. caseolaris-dominated habitat (mangrove habitat, Sc) than in the T. angustifolia-dominated habitat (reedbed habitat, Ta). This pattern could be explained by the larger number of sites affiliated to Sc than to Ta (respectively 10 and 5 sites), which lead to a relatively higher sampling effort and a higher absolute number of observations (619 in Sc, 372 in Ta). As more birds were observed, more species could be affiliated with the mangrove habitat. To overcome this sample size effect, the mean species richness and diversity indices were compared between habitats. Ta harboured a higher mean species richness than Sc, as well as a higher mean diversity (i.e., Shannon–Wiener Index). First, it can be hypothesized that a species detectability varied in the different habitats. Species traits and distinct habitat structures have already been shown to bring heterogeneity in bird detectability [64,65]. It could thus be one explanation for the decrease in species richness in the mangrove forest, which is notably more complex and hosts forest specialists. The presence of one of the lagoon’s main waterways running across reedbeds might be another reason for their higher mean bird richness, by promoting the presence of birds relying on flowing water resources. Indeed, the Ta habitat included a higher piscivores mean and total species richness than the Sc habitat. The presence of fruiting trees (i.e., mangrove apples of S. caseolaris) would be expected to lead to an opposite increase in the richness of frugivorous and granivorous species, and thus the general bird richness in mangroves. However, this hypothesis was not entirely supported by our findings, since no significant difference was found between mangroves and reedbeds in the frugivores/granivores/frugivores–granivores mean species richness. A factor that could play an important role in both richness and diversity differences is the relative location of the affiliated sampling sites in the lagoon. Ta-affiliated sites were almost exclusively located at the centre of the lagoon, whereas most of the Sc-affiliated sites were located near the right border of Kalametiya area. The proximity with areas under anthropogenic influence (e.g., habitations, roads) could be the reason for the lower diversity in Sc-affiliated sites [28,66].
Apart from those differences, these two main habitats resulting from lagoon modification in recent decades, as well as the entire study area, displayed strong species and taxonomic diversities. This suggests that the lagoon currently supports a diverse community of birds that not only relies on S. caseolaris mangrove stands but also on T. angustifolia reedbeds. Indeed, even though the reedbeds resulted from a recent invasion of the lagoon, they now sustain an important part of Kalametiya’s avifaunal diversity. This confirms that, as mentioned by [12], a management plan with the objective of returning the entire lagoon to its past state could disturb this community and lead to significant changes in bird species composition. The removal of vegetated areas to retrieve past water surfaces could be expected to negatively impact bird species relying on the new habitats while benefiting species relying on water resources, leading to a shift in the community composition. Despite methodological differences with previous inventories, a more thorough comparison of bird diversity and community composition of this study dataset and datasets collected in 1995 and 2004 would help to understand the changes a restoration of the lagoon would imply.
Feeding guild composition was used as a surrogate of changes in bird assemblages in a multivariate analysis, as species composition variation was not properly summarized by the PCA. Feeding guild composition seemed more influenced by the site transect, and thus position in the lagoon, than by its affiliation to the Sc or Ta habitat. Indeed, guild composition was found to be similar for all sites from Transect IV, which is the closest to the lagoon borders and human infrastructures. This finding, if confirmed, would support the previously mentioned hypothesis that proximity with anthropogenic pressure influences Kalametiya bird assemblages. Transect IV is also the furthest from the large patches of T. angustifolia reedbeds, Kalametiya’s second main habitat, which could induce weaker interactions with its avifauna community. It has indeed been shown that mangroves should be considered as part of a landscape mosaic, in which bird communities are heavily influenced by surrounding habitats [67,68]. The mosaic effect could also explain the differences in feeding guild composition for the last three sites of Transect III (isolated cluster of three sites in the upper part of Figure 4: iii7, iii8, iii9; Figure 2), which are relatively far from the T. angustifolia patches without being inside the S. caseolaris mangrove forest.
Species composition was not found to be significantly driven by the studied physiochemical and vegetation variables, as final RDA models explained a low proportion of the variation (Transect I/II/III: R2 = 9%; Transect IV: R2 = 15%). Feeding guilds were a more reliable indicator of bird community responses to environmental variables, as respective RDA models explained a higher proportion of variation (R2 = 36% for both models). Several physiochemical variables (i.e., water nitrate content, water TDS, water pH, soil pH) were found to significantly influence guild assemblages, though no prominent site clustering was observed in response to those. This supports the fact that bird communities experienced great changes with the hydrological modifications resulting from the Udawalawe inland irrigation project [11]. The observed influence of these variables on birds is consistent with several other studies on wetlands [28,29,31].

5. Conclusions

Overall, this study showed that Kalametiya Lagoon supported an important and diverse avifauna despite the recent invasion of S. caseolaris and T. angustifolia. It suggested that T. angustifolia reedbeds harboured a higher richness and stronger bird diversity than S. caseolaris mangroves. However, multivariate analysis showed that habitat types did not have a great influence on bird assemblages composition. These assumptions need further verification for two main reasons: (i) mean and not total diversity indices were used, (ii) most of the S. caseolaris-affiliated sites were significantly closer to the lagoon border than the T. angustifolia-affiliated sites. An additional study with random stratified design and equal sampling effort for both habitats could confirm the diversity differences between S. caseolaris mangroves and T. angustifolia reedbeds, as well as include S. caseolarisT. angustifolia co-dominated patches in the analysis. As bird feeding guilds were significantly influenced by several environmental variables, they could have great potential as proxies in Kalametiya Lagoon state. It is recommended that additional research is performed to confirm their bioindicator statuses.

Supplementary Materials

The following supporting information can be downloaded at https://www.mdpi.com/article/10.3390/d15030383/s1. Table S1: Sampling sites coordinates, habitat affiliation, and species richness; Table S2: Complete list of the avifauna encountered during the study period in Kalametiya.

Author Contributions

Conceptualization, T.B., K.A.S.K., J.S., F.D.-G., J.H., M.P.K., and M.A.Y.N.W.; methodology, T.B., K.A.S.K., J.S., G.G.N.K.W., and M.A.Y.N.W.; software, T.B.; validation, T.B., K.A.S.K., J.S., F.D.-G., J.H., M.P.K., and M.A.Y.N.W.; formal analysis, T.B.; investigation, T.B., K.A.S.K., D.P.D.R., and W.A.K.G.T.; resources: K.A.S.K., G.G.N.K.W., and J.S.; data curation: T.B., K.A.S.K., D.P.D.R., and W.A.K.G.T.; writing—original draft preparation, T.B.; writing review and editing, K.A.S.K., J.S., F.D.-G., G.G.N.K.W., J.H., M.P.K., M.A.Y.N.W., D.P.D.R., and W.A.K.G.T.; visualization, T.B.; supervision, K.A.S.K., J.S., F.D.-G., J.H., M.P.K., and M.A.Y.N.W.; project administration, T.B., K.A.S.K., and F.D-G; funding acquisition, T.B. and F.D.-G. All authors have read and agreed to the published version of the manuscript.

Funding

This research was funded by a thesis grant awarded by the EC-funded Erasmus Mundus Joint Master Degree in Tropical Biodiversity and Ecosystems—TROPIMUNDO (grant number 2019-1451).

Institutional Review Board Statement

Not applicable.

Data Availability Statement

Not applicable.

Acknowledgments

Special thanks to Isuru Wijesundara and Don Udara Vishwa Gunathilaka for being of great help with data collection, particularly in such difficult times for Sri Lanka.

Conflicts of Interest

The authors declare no conflict of interest.

References

  1. Silva, E.I.L.; Katupotha, J.; Amarasinghe, O.; Manthrithilake, H.; Ariyaratna, R. Lagoons of Sri Lanka: From the Origins to the Present; International Water Management Institute: Colombo, Sri Lanka, 2013; pp. 6–8. [Google Scholar]
  2. Balasuriya, A. Coastal Area Management: Biodiversity and Ecological Sustainability in Sri Lankan Perspective. In Biodiversity and Climate Change Adaptation in Tropical Islands; Sivaperuman, C., Velmurugan, A., Singh, K.A., Jaisankar, I., Eds.; Academic Press: Cambridge, MA, USA, 2018; pp. 701–724. [Google Scholar]
  3. Burke, L.; Kura, Y.; Kasem, K.; Revenga, C.; Spalding, M.; McAllister, D. Pilot Analysis of Global Ecosystems: Coastal Ecosystems; World Resources Institute: Washington, DC, USA, 2001. [Google Scholar]
  4. Newton, A.; Brito, A.C.; Icely, J.D.; Derolez, V.; Clara, I.; Angus, S.; Schernewski, G.; Inácio, M.; Lillebø, A.I.; Sousa, A.I.; et al. Assessing, Quantifying and Valuing the Ecosystem Services of Coastal Lagoons. J. Nat. Conserv. 2018, 44, 50–65. [Google Scholar] [CrossRef]
  5. Martínez, M.L.; Intralawan, A.; Vázquez, G.; Pérez-Maqueo, O.; Sutton, P.; Landgrave, R. The Coasts of Our World: Ecological, Economic and Social Importance. Ecol. Econ. 2007, 63, 254–272. [Google Scholar] [CrossRef]
  6. Lee, S.Y.; Primavera, J.H.; Dahdouh-Guebas, F.; McKee, K.; Bosire, J.O.; Cannicci, S.; Diele, K.; Fromard, F.; Koedam, N.; Marchand, C.; et al. Ecological Role and Services of Tropical Mangrove Ecosystems: A Reassessment. Glob. Ecol. Biogeogr. 2014, 23, 726–743. [Google Scholar] [CrossRef]
  7. Mukherjee, N.; Sutherland, W.J.; Dicks, L.; Hugé, J.; Koedam, N.; Dahdouh-Guebas, F. Ecosystem Service Valuations of Mangrove Ecosystems to Inform Decision Making and Future Valuation Exercises. PLoS ONE 2014, 9, e107706. [Google Scholar] [CrossRef] [Green Version]
  8. Ermgassen, P.S.E.z.; Mukherjee, N.; Worthington, T.A.; Acosta, A.; Araujo, A.R.d.R.; Beitl, C.M.; Castellanos-Galindo, G.A.; Cunha-Lignon, M.; Dahdouh-Guebas, F.; Diele, K.; et al. Fishers Who Rely on Mangroves: Modelling and Mapping the Global Intensity of Mangrove-Associated Fisheries. Estuar. Coast. Shelf Sci. 2020, 247, 106975. [Google Scholar] [CrossRef]
  9. Satyanarayana, B.; Stocken, T.V.d.; Rans, G.; Kodikara, K.A.S.; Ronsmans, G.; Jayatissa, L.P.; Husain, M.-L.; Koedam, N.; Dahdouh-Guebas, F. Island-Wide Coastal Vulnerability Assessment of Sri Lanka Reveals That Sand Dunes, Planted Trees and Natural Vegetation May Play a Role as Potential Barriers against Ocean Surges. Glob. Ecol. Conserv. 2017, 12, 144–157. [Google Scholar] [CrossRef]
  10. Gunarathne, K.; Kodikara, K.; Kokuhennadige, H.; Madarasinghe, S.; Loku Pulukkuttige, J. Diversity and Ecosystem Health of Inland Mangrove Forest in Garanduwa Lagoon, Southern Province, Sri Lanka. In Proceedings of the 15th Academic Sessions, University of Ruhuna, Matara, Sri Lanka, 7 March 2018. [Google Scholar]
  11. Madarasinghe, S.K.; Yapa, K.K.A.S.; Satyanarayana, B.; Udayakantha, P.M.P.; Kodikara, S.; Jayatissa, L.P. Inland Irrigation Project Causes Disappearance of Coastal Lagoon: The Trajectory of Kalametiya Lagoon, Sri Lanka from 1956 to 2016. Coast. Manag. 2020, 48, 188–209. [Google Scholar] [CrossRef]
  12. Madarasinghe, S.K.; Amarasinghe, Y.W.P.; Liyanage, C.H.; Gunathilake, H.M.S.A.T.; Jayasingha, J.A.I.K.; Jayasingha, M.; Priyankara, W.K.L.; Kodikara, K.A.S.; Koedam, N.; Dahdouh-Guebas, F.; et al. Retrospective Study on Changes in Dondra Lagoon (2006–2017) Resulting from Tsunami Impact and Post-Tsunami Development. J. Coast. Conserv. 2020, 24, 58. [Google Scholar] [CrossRef]
  13. Dahdouh-Guebas, F.; Hettiarachchi, S.; Lo Seen, D.; Batelaan, O.; Sooriyarachchi, S.; Jayatissa, L.P.; Koedam, N. Transitions in Ancient Inland Freshwater Resource Management in Sri Lanka Affect Biota and Human Populations in and around Coastal Lagoons. Curr. Biol. 2005, 15, 579–586. [Google Scholar] [CrossRef] [Green Version]
  14. Ekanayake, S.P.; Bambaradeniya, C.N.B.; Perera, W.P.N.; Perera, M.S.J.; Rodrigo, R.K.; Samarawickrema, V.A.M.P.K.; Peiris, T.N. A Biodiversity Status Profile of Lunama—Kalametiya Wetland Sanctuary; IUCN—Sri Lanka: Colombo, Sri Lanka, 2005. [Google Scholar]
  15. Jayatissa, L.P.; Guero, M.-C.; Hettiarachchi, S.; Koedam, N. Changes in Vegetation Cover and Socio-Economic Transitions in a Coastal Lagoon (Kalametiya, Sri Lanka), As Observed by Teledetection and Ground Truthing, Can Be Attributed to an Upstream Irrigation Scheme. Environ. Dev. Sustain. 2002, 4, 167–183. [Google Scholar] [CrossRef] [Green Version]
  16. Duke, N.; Ball, M.; Ellison, J. Factors Influencing Biodiversity and Distributional Gradients in Mangroves. Glob. Ecol. Biogeogr. Lett. 1998, 7, 27–47. [Google Scholar] [CrossRef] [Green Version]
  17. Siddig, A.A.H.; Ellison, A.M.; Ochs, A.; Villar-Leeman, C.; Lau, M.K. How Do Ecologists Select and Use Indicator Species to Monitor Ecological Change? Insights from 14 Years of Publication in Ecological Indicators. Ecol. Indic. 2016, 60, 223–230. [Google Scholar] [CrossRef] [Green Version]
  18. Birkhofer, K.; Rusch, A.; Andersson, G.K.S.; Bommarco, R.; Dänhardt, J.; Ekbom, B.; Jönsson, A.; Lindborg, R.; Olsson, O.; Rader, R.; et al. A Framework to Identify Indicator Species for Ecosystem Services in Agricultural Landscapes. Ecol. Indic. 2018, 91, 278–286. [Google Scholar] [CrossRef]
  19. Cairns, J.; McCormick, P.V.; Niederlehner, B.R. A Proposed Framework for Developing Indicators of Ecosystem Health. Hydrobiologia 1993, 263, 1–44. [Google Scholar] [CrossRef]
  20. Godefroid, S.; Koedam, N. Identifying Indicator Plant Species of Habitat Quality and Invasibility as a Guide for Peri-Urban Forest Management. Biodivers. Conserv. 2003, 12, 1699–1713. [Google Scholar] [CrossRef]
  21. Dahdouh-Guebas, F.; Friess, D.A.; Lovelock, C.E.; Connolly, R.M.; Feller, I.C.; Rogers, K.; Cannicci, S. Cross-Cutting Research Themes for Future Mangrove Forest Research. Nat. Plants 2022, 8, 1131–1135. [Google Scholar] [CrossRef]
  22. Järvinen, O.; Väisänen, R.A. Changes in Bird Populations as Criteria of Environmental Changes. Ecography 1979, 2, 75–80. [Google Scholar] [CrossRef]
  23. Morrison, M.L. Bird Populations as Indicators of Environmental Change. In Current Ornithology: Volume 3; Johnston, R.F., Ed.; Springer US: Boston, MA, USA, 1986; pp. 429–451. [Google Scholar] [CrossRef]
  24. Koskimies, P. Birds as a Tool in Environmental Monitoring. Ann. Zool. Fenn. 1989, 26, 153–166. [Google Scholar]
  25. Becker, P.H. Chapter 19 Biomonitoring with Birds. In Trace Metals and other Contaminants in the Environment; Markert, B.A., Breure, A.M., Zechmeister, H.G., Eds.; Elsevier: Amsterdam, The Netherlands, 2003; Volume 6, pp. 677–736. [Google Scholar] [CrossRef]
  26. Amat, J.A.; Green, A.J. Waterbirds as Bioindicators of Environmental Conditions. In Conservation Monitoring in Freshwater Habitats: A Practical Guide and Case Studies; Hurford, C., Schneider, M., Cowx, I., Eds.; Springer Netherlands: Dordrecht, The Netherlands, 2010; pp. 45–52. [Google Scholar] [CrossRef] [Green Version]
  27. Jayathilake, M.B.; Chandrasekara, W.U. Variation of Avifaunal Diversity in Relation to Land-Use Modifications around a Tropical Estuary, the Negombo Estuary in Sri Lanka. J. Asia-Pac. Biodivers. 2015, 8, 72–82. [Google Scholar] [CrossRef] [Green Version]
  28. Chandana, E.; Amarasinghe, N.; Samayawardhena, L. Factors Affecting the Avi-Faunal Distribution in the Three Lagoons (Malala, Embillakala and Bundala Lewaya) of Bundala National Park (A Ramsar Wetland) in Sri Lanka. Ruhuna J. Sci. 2008, 3, 34–43. [Google Scholar]
  29. Bellio, M.; Kingsford, R.T. Alteration of Wetland Hydrology in Coastal Lagoons: Implications for Shorebird Conservation and Wetland Restoration at a Ramsar Site in Sri Lanka. Biol. Conserv. 2013, 167, 57–68. [Google Scholar] [CrossRef]
  30. Fernández, J.M.; Selma, M.A.E.; Aymerich, F.R.; Sáez, M.T.P.; Fructuoso, M.F.C. Aquatic Birds as Bioindicators of Trophic Changes and Ecosystem Deterioration in the Mar Menor Lagoon (SE Spain). Hydrobiologia 2005, 550, 221–235. [Google Scholar] [CrossRef]
  31. Paszkowski, C.A.; Tonn, W.M. Foraging Guilds of Aquatic Birds on Productive Boreal Lakes: Environmental Relations and Concordance Patterns. Hydrobiologia 2006, 567, 19–30. [Google Scholar] [CrossRef]
  32. Asefa, A.; Mengesha, G.; Sori, T.; Mamo, Y. Local- and Landscape-Level Effects of Land Use Change on Bird Diversity in Abiata-Shalla Lakes National Park, Ethiopia. Afr. J. Ecol. 2019, 57, 51–58. [Google Scholar] [CrossRef] [Green Version]
  33. CEA; Euroconsult. Wetland Site Report and Conservation Management Plan: Kalametiya and Lunama Lagoons; Central Environmental Authority: Sri Jayawardenapura Kotte, Sri Lanka, 1995. [Google Scholar]
  34. Punyawardena, B.V.R. Climate. In The Soils of Sri Lanka; Mapa, R.B., Ed.; Springer International Publishing: Cham, Switzerland, 2020; pp. 13–22. [Google Scholar] [CrossRef]
  35. Bibby, C.J.; Jones, M.; Marsden, S. Expedition Field Techniques: Bird Surveys; Expedition Advisory Centre: London, UK, 1998. [Google Scholar]
  36. Huff, M.H.; Bettinger, K.A.; Ferguson, H.L.; Brown, M.J.; Altman, B. A Habitat-Based Point-Count Protocol for Terrestrial Birds, Emphasizing Washington and Oregon; U.S. Department of Agriculture, Forest Service, Pacific Northwest Research Station: Portland, OR, USA, 2000. [Google Scholar] [CrossRef]
  37. Gregory, R.D.; Gibbons, D.W.; Donald, P.F. Bird Census and Survey Techniques. In Bird Ecology and Conservation: A Handbook of Techniques; Gibbons Gregory, W.J., Newton, I., Green, R., Eds.; Oxford University Press: Oxford, UK, 2004; pp. 17–56. [Google Scholar] [CrossRef]
  38. Gibbons, D.W.; Gregory, R.D. Birds. In Ecological Census Techniques: A Handbook, 2nd ed.; Sutherland, W.J., Ed.; Cambridge University Press: Cambridge, UK, 2006; pp. 308–350. [Google Scholar]
  39. De Silva Wijeyeratne, G.; Warakagoda, D. Birds of Sri Lanka; Bloomsbury Publishing Plc: London, UK, 2016. [Google Scholar]
  40. Gill, F.; Donsker, D.; Rasmussen, P. IOC World Bird List (V12.1). Available online: https://www.worldbirdnames.org/new/ (accessed on 30 January 2023).
  41. The IUCN Red List of Threatened Species. Available online: https://www.iucnredlist.org/ (accessed on 30 January 2023).
  42. MOE. The National Red List 2021—Conservation status of the birds of Sri Lanka (2021); Biodiversity Secretariat, Ministry of Environment: Battaramulla, Sri Lanka, 2021. [Google Scholar]
  43. Birds of the World. Available online: https://birdsoftheworld.org/bow/home (accessed on 30 January 2023).
  44. Bezzalla, A.; Houhamdi, M.; Chenchouni, H. Bird Ecological Status of Two Internationally Important Wetlands ‘Ramsar Sites and IBA’ in Algeria. Estuar. Coast. Shelf Sci. 2019, 227, 106308. [Google Scholar] [CrossRef]
  45. Wijeratne, G.G.N.K.; Ranawaka, D.P.D.; Gunathilaka, D.U.V.; Wijesundara, W.M.I.C.; Abeysinghe, N.K.; Thilakarathna, N.D.S.D.; Perera, A.J.D.; Dissanayake, N.P.; Andrieu, J.; Kodikara, K.A.S. Soil Organic Carbon in Mixed Mangroves and Monospecific Stands; A Case Study from Rekawa and Kalametiya Lagoons in Southern, Sri Lanka. In Proceedings of the International Symposium on Agriculture and Environment 2022, University of Ruhuna, Matara, Sri Lanka, 13 May 2022. [Google Scholar]
  46. Burnham, K.P.; Overton, W.S. Robust Estimation of Population Size When Capture Probabilities Vary Among Animals. Ecology 1979, 60, 927–936. [Google Scholar] [CrossRef]
  47. Chao, A. Estimating the Population Size for Capture-Recapture Data with Unequal Catchability. Biometrics 1987, 43, 783–791. [Google Scholar] [CrossRef]
  48. Clarke, K.R.; Gorley, R.N.; Somerfield, P.J.; Warwick, R.M. Change in Marine Communities: An Approach to Statistical Analysis and Interpretation, 3rd ed.; PRIMER-E: Plymouth, UK, 2014. [Google Scholar]
  49. R Core Team. R: A Language and Environment for Statistical Computing; R Foundations Foundation for Statistical Computing: Vienna, Austria, 2021. [Google Scholar]
  50. Fox, J.; Weisberg, S. An R Companion to Applied Regression, 3rd ed.; Sage: Thousand Oaks, CA, USA, 2019. [Google Scholar]
  51. Wickham, H. ggplot2: Elegant Graphics for Data Analysis; Springer: New York, NY, USA, 2016. [Google Scholar]
  52. Oksanen, J.; Simpson, G.; Blanchet, F.; Kindt, R.; Legendre, P.; Minchin, P.; O’Hara, R.; Solymos, P.; Stevens, M.; Szoecs, E.; et al. Vegan: Community Ecology Package. R Package Version 2.6-2. 2022. Available online: https://cran.r-project.org/package=vegan (accessed on 25 July 2022).
  53. Khun, M. Caret: Classification and Regression Training. R Package Version 6.0-92. 2022. Available online: https://CRAN.R-project.org/package=caret (accessed on 30 January 2023).
  54. Legendre, P.; Legendre, L. Numerical Ecology, 3rd ed.; Elsevier: Amsterdam, The Netherlands, 2012. [Google Scholar]
  55. Rao, C.R. A Review of Canonical Coordinates and an Alternative to Correspondence Analysis Using Hellinger Distance. Qüestiió 1995, 19, 23–63. [Google Scholar]
  56. Blanchet, F.G.; Legendre, P.; Borcard, D. Forward Selection of Explanatory Variables. Ecology 2008, 89, 2623–2632. [Google Scholar] [CrossRef]
  57. Seneviratne, S.S.; Dayananda, S.K. History, Taxonomy and Evolutionary Status of Sri Lankan Avifauna. In The National Red List 2021—Conservation Status of the Birds of Sri Lanka (2021); Biodiversity Secretariat, Ministry of Environment: Battaramulla, Sri Lanka, 2021. [Google Scholar]
  58. IUCN; CEA. National Wetland Directory of Sri Lanka; IUCN—Sri Lanka: Colombo, Sri Lanka, 2006. [Google Scholar]
  59. Perera, N.; Perera, S.; Rodrigo, R.; Pelris, N.; Samarawickrama, P.; Ekanayake, S.; Bambaradeniya, C. An Assessment of Biodiversity in the Rekawa, Ussangoda and Kalametiya Inland Coastal Ecosystems in Southern Sri Lanka. In Proceedings of the Ninth Annual Forestry and Environment Symposium of the Department of Forestry and Environmental Science, University of Sri Jayewardenepura, Colombo, Sri Lanka, 29 December 2003. [Google Scholar] [CrossRef] [Green Version]
  60. Rosenstock, S.S.; Anderson, D.R.; Giesen, K.M.; Leukering, T.; Carter, M.F. Landbird Counting Techniques: Current Practices and an Alternative. Auk 2002, 119, 46–53. [Google Scholar] [CrossRef]
  61. Sólymos, P.; Matsuoka, S.M.; Stralberg, D.; Barker, N.K.S.; Bayne, E.M. Phylogeny and species traits predict bird detectability. Ecography 2018, 41, 1595–1603. [Google Scholar] [CrossRef] [Green Version]
  62. Buelow, C.; Sheaves, M. A Birds-Eye View of Biological Connectivity in Mangrove Systems. Estuar. Coast. Shelf Sci. 2015, 152, 33–43. [Google Scholar] [CrossRef]
  63. Michael, A.G.; Baldauf, S.L.; Mayhew, P.J.; Hill, J.K. The Response of Avian Feeding Guilds to Tropical Forest Disturbance. Conserv. Biol. 2007, 21, 133–141. [Google Scholar]
  64. Boulinier, T.; Nichols, J.D.; Sauer, J.R.; Hines, J.E.; Pollock, K.H. Estimating Species Richness: The Importance of Heterogeneity in Species Detectability. Ecology 1998, 79, 1018–1028. [Google Scholar] [CrossRef]
  65. Johnston, A.; Newson, S.E.; Risely, K.; Musgrove, A.J.; Massimino, D.; Baillie, S.R.; Pearce-Higgins, J.W. Species Traits Explain Variation in Detectability of UK Birds. Bird Study 2014, 61, 340–350. [Google Scholar] [CrossRef]
  66. Alwis, N.S.; Perera, P.; Dayawansa, N.P. Response of Tropical Avifauna to Visitor Recreational Disturbances: A Case Study from the Sinharaja World Heritage Forest, Sri Lanka. Avian Res. 2016, 7, 15. [Google Scholar] [CrossRef] [Green Version]
  67. Mohd-Azlan, J.; Lawes, M.J. The Effect of the Surrounding Landscape Matrix on Mangrove Bird Community Assembly in North Australia. Biol. Conserv. 2011, 144, 2134–2141. [Google Scholar] [CrossRef]
  68. Mohd-Azlan, J.; Noske, R.A.; Lawes, M.J. Avian Species-Assemblage Structure and Indicator Bird Species of Mangroves in the Australian Monsoon Tropics. Emu Austral Ornithol. 2012, 112, 287–297. [Google Scholar] [CrossRef]
Figure 1. Maps of Kalametiya Lagoon showing spatio-temporal changes of vegetation over the last six decades (1956–2016). Eight considered habitat types are described in the legend, along with their respective patterns: (i) areas dominated by S. caseolaris (dark grey), (ii) areas dominated by T. angustifolia (grey with black spots), (iii) areas co-dominated by S. caseolaris and T. angustifolia (black), (iv) areas co-dominated by T. angustifolia and aquatic plants (white with two layers of black stripes), (v) mixed mangrove vegetation (white with one layer of black stripes), (vi) grassy plains (white with grass symbols), (vii) lagoon water (light grey), (viii) beach (white with black spots). When habitats are present in the map, corresponding area is added in ha on the side of the map. A scale in kilometres is presented under each map. Figure adopted from Madarasinghe et al. (2020) [11].
Diversity 15 00383 g001
Figure 2. Land-Use Map of Kalametiya Lagoon (© S. K. Madarasinghe) with the 37 point-count station sites. Seven considered habitat types are described in the legend, along with their respective patterns: (i) areas dominated by S. caseolaris (dark grey), (ii) areas dominated by T. angustifolia (grey with black spots), (iii) areas co-dominated by S. caseolaris and T. angustifolia (black), (iv) areas co-dominated by T. angustifolia and aquatic plants (white with two layers of black stripes), (v) grassy plains (white with grass symbols), (vi) lagoon water (light grey), (vii) beach (white with black spots).Sites are displayed in four different colours: blue for Transect I, yellow for Transect II, red for Transect III, green for Transect IV. Sites labels show their respective transect (i = Transect I, ii = Transect II, iii = Transect III, iv = Transect IV) and numbers. The area coordinates are present on the left and bottom sides of the map. A scale in kilometres is presented under the map.
Diversity 15 00383 g002
Figure 3. Comparison of (a) mean observed species richness and (b) mean relative abundance of the seven feeding guilds between the Sc and Ta habitats. For habitat and feeding guild labels, cf. Table 1. An asterisk represents a statistically significant difference between the two habitats (* for p-values < 0.05, ** for p-values < 0.01). Error bars represent the standard deviations.
Diversity 15 00383 g003
Figure 4. PCA ordination diagram on Kalametiya Lagoon feeding guilds abundance variation among study sites. It uses the two first ordination axes, PC1 and PC2, displayed on the left and bottom sides of the figure with their explained proportion in percentages. For habitat labels, cf. Table 1, except for NA, which is used for sites with no habitat affiliation. The shape of the dots displays transect affiliation: circle for Transect I, triangle for Transect II, square for Transect III, and diamond for Transect IV.
Diversity 15 00383 g004
Figure 5. RDA ordination diagram for (a) Transect I/II/III and (b) Transect IV, linking Kalametiya Lagoon environmental variables and feeding guild composition among study sites. They use the two first ordination axes, RDA 1 and RDA 2, displayed on the left and bottom sides of each figure with their explained proportion in percentages. For habitat labels, cf. Table 1, except for NA, which is used for sites with no habitat affiliation. The shape of the dots displays transect affiliation: circle for Transect I, triangle for Transect II, square for Transect III, and diamond for Transect IV. Labels for environmental variables are: Lon = longitude, WN = water nitrate content, WTDS = water total dissolved solids, WpH = water pH, Height = mean tree height, SK = soil phosphate content, SpH = soil pH.
Diversity 15 00383 g005
Table 1. List of bird species, in order of relative abundances, observed during point-count surveys performed in Kalametiya Lagoon, Sri Lanka. This table only includes observations made during the surveys. Feeding Guild labels: (i) Inv = Invertebrate feeder, (ii) Pol = Polyphage, (iii) Hrb-FG = Frugivorous–granivorous, (iv) Hrb-F = Frugivorous, (v) Hrb-G = Granivorous, (vi) Hrb-P = Species consuming plants’ vegetative parts, (vii) Psc = Piscivorous. Habitat labels: (i) Sc = Sonneratia caseolaris-dominated habitat, (ii) Sc-Ta = S. caseolaris – Typha angustifolia co-dominated habitat, (iii) Ta = T. angustifolia-dominated habitat. Taxonomic authorities are provided for all species in the Supplementary Materials (Table S2).
Latin NameVernacular Name Relative
Abundance
Number of
Observations
Feeding GuildHabitat
Himantopus himantopusBlack-winged Stilt10.29%252InvSc/Ta
Tringa totanusCommon Redshank9.35%229InvSc
Corvus splendensHouse Crow5.67%139PolSc/Sc-Ta/Ta
Leptocoma zeylonicaPurple-rumped Sunbird5.22%128InvSc/Sc-Ta/Ta
Spilopelia chinensisSpotted Dove4.57%112Hrb-FGSc/Ta
Acridotheres tristisCommon Myna4.41%108PolSc/Ta
Vanellus indicusRed-wattled Lapwing3.59%88InvSc/Ta
Merops philippinusBlue-tailed Bee-Eater3.31%81InvSc/Sc-Ta/Ta
Plegadis falcinellusGlossy Ibis3.18%78Pol__
Microcarbo nigerLittle Cormorant2.90%71PscSc-Ta/Ta
Ardea purpureaPurple Heron2.90%71PolSc/Sc-Ta/Ta
Hirundo rusticaBarn Swallow2.16%53InvSc/Ta
Ducula aeneaGreen Imperial Pigeon2.12%52Hrb-FSc/Sc-Ta/Ta
Ardea intermediaIntermediate Egret2.12%52PscSc/Sc-Ta/Ta
Egretta garzettaLittle Egret2.12%52PolSc/Ta
Psittacula krameriRose-ringed Parakeet2.12%52Hrb-FGSc/Ta
Porphyrio poliocephalusGrey-headed Swamphen2.08%51Hrb-PSc/Ta
Dendrocygna javanicaLesser Whistling-Duck1.88%46PolSc/Sc-Ta/Ta
Eudynamys scolopaceusAsian Koel 1.84%45Hrb-FSc/Ta
Ardeola GrayiiIndian Pond Heron1.76%43PolSc/Ta
Sternula albifronsLittle Tern1.76%43PolSc/Ta
Psilopogon zeylanicusBrown-headed Barbet1.51%37Hrb-FSc/Sc-Ta/Ta
Ardea cinereaGrey Heron1.47%36PscTa
Lonchura punctulataScaly-breasted Munia1.39%34Hrb-GSc
Threskiornis melanocephalusBlack-headed Ibis 1.31%32PolSc/Sc-Ta/Ta
Columba liviaRock Dove1.31%32Hrb-FGSc/Ta
Pelecanus philippensisSpot-billed Pelican1.31%32PscSc/Ta
Lonchura malaccaTricolored munia1.10%27Hrb-GSc/Ta
Orthotomus sutoriusCommon Tailorbird1.06%26InvSc/Ta
Anthus rufulusPaddyfield Pipit1.02%25InvSc/Sc-Ta
Hydrophasianus chirurgusPheasant-tailed Jacana0.82%20InvTa
Pycnonotus caferRed-vented Bulbul0.82%20Hrb-FSc
Dinopium psarodesRed-backed Flameback0.78%19InvSc/Ta
Anastomus oscitansAsian Openbill0.69%17InvSc/Ta
Anhinga melanogasterOriental Darter0.69%17PscSc/Sc-Ta/Ta
Halcyon smyrnensisWhite-throated Kingfisher0.69%17PolSc/Sc-Ta/Ta
Argya affinisYellow-billed Babbler0.65%16PolSc/Ta
Centropus sinensisGreater Coucal0.61%15PolSc/Sc-Ta/Ta
Tringa glareolaWood Sandpiper0.57%14PolSc
Prinia socialisAshy Prinia 0.53%13InvTa
Sterna hirundoCommon Tern0.49%12PolTa
Mycteria leucocephalaPainted Stork0.49%12PscSc/Ta
Chalcophaps indicaCommon Emerald Dove0.45%11Hrb-FGTa
Pycnonotus luteolusWhite-browed Bulbul0.45%11Hrb-FSc
Lalage melanopteraBlack-headed Cuckooshrike0.41%10InvSc/Ta
Oriolus xanthornusBlack-hooded Oriole 0.37%9Hrb-FSc/Ta
Alcedo atthisCommon Kingfisher0.37%9PscSc/Ta
Prinia inornataPlain Prinia0.37%9InvSc
Ixobrychus sinensisYellow Bittern0.37%9InvTa
Vanellus malabricusYellow-wattled Lapwing0.37%9InvSc
Pavo cristatusIndian Peafowl0.33%8PolSc/Ta
Ceryle rudisPied Kingfisher0.29%7PscTa
Motacilla cinereaGrey Wagtail0.24%6InvSc
Gallus lafayettiiSri Lanka Junglefowl0.24%6Pol__
Rhipidura aureolaWhite-browed Fantail 0.20%5InvTa
Merops orientalisAsian Green Bee-Eater 0.16%4InvSc
Copsychus saularisOriental Magpie-Robin0.16%4InvSc
Gallinula chloropusCommon Moorhen0.12%3Pol__
Lanius cristatusBrown Shrike0.08%2InvSc
Treron bicinctusOrange-breasted Green Pigeon0.08%2Hrb-FSc
Pelargopsis capensisStork-billed Kingfisher0.08%2PolSc
Amaurornis phoenicurusWhite-breasted Waterhen0.08%2PolSc
Dicaeum vincensLegge’s Flowerpecker0.08%2Hrb-FSc
Ardea albaGreat Egret0.04%1Psc__
Table 2. Comparison of number of observations (N), relative abundance (RA), observed species richness (S), and six diversity indices in the overall study and in the seven different bird feeding guilds of Kalametiya Lagoon, Sri Lanka. For feeding guild labels, cf. Table 1. The presented diversity indices are Shannon–Wiener’s Index (H), Simpson Index (1−λ), Pielou’s Evenness (J), Average Taxonomic Distinctness (Δ*), Average Taxonomic Breadth (Δ+), and Variation in Taxonomic Distinctness (Λ+).
Feeding GuildNRASH1−λJΔ*Δ+Λ+
Overall2450__643.5840.95940.861895.6695.51140.40
Inv100941.18%212.2630.85030.743491.3891.07214.9
Pol70728.86%192.4830.89420.843293.0596.05141.6
Psc2379.67%91.8420.81080.838388.9589.58499.1
Hrb-F1787.27%81.700.790.8297.5491.07322.1
Hrb-FG2078.45%41.120.620.8180.4775625
Hrb-G612.49%20.690.490.992525__
Hrb-P512.08%1____________
Table 3. Comparison of species richness estimators (S, Chao2, Jacknife2) and number of observations (N) of birds between the overall study site and the Sc and the Ta habitats. For habitat labels, cf. Table 1. SD stands for Standard Deviation. An asterisk represents a statistically significant (p-value < 0.05) difference between the two habitats.
CategoriesNSChao2 (±SD)Jacknife2
Total N ¯ (±SD) Total S ¯ (±SD)
Overall245066.22 (56.04)6415.59 (4.01)65 (1.46)64.32
Sc61961.9 (9.86)5114.4 * (2.17)69.18 (10.69)77.18
Ta37274.4 (13.59)4422.6 * (2.61)48.55 (3.83)53.05
Table 4. Comparison of the mean diversity indices of the avifaunal community between the Sc and Ta habitats. For habitat labels, cf. Table 1. For diversity indices symbols, cf. Table 2. SD stands for Standard Deviation. An asterisk represents a statistically significant difference (p-value < 0.05) between the two habitats.
Categories H ¯ (±SD) 1 λ ¯ (±SD) J ¯ (±SD) Δ ¯ (±SD) Δ + ¯ (±SD) Λ + ¯ (±SD)
Sc2.39 * (0.16)0.88 (0.03)0.9 (0.04)93.12 (3.41)94.03 (2.61)167.13 (65.62)
Ta2.83 * (0.31)0.92 (0.05)0.91 (0.08)94.72 (1.62)95.9 (0.71)152.86 (28.31)
Table 5. List of the five most abundant bird species, in order of relative abundances, in the Sc and Ta habitats. For habitat labels, cf. Table 1. RA stands for Relative Abundance.
ScTa
Common NameRACommon NameRA
Leptocoma zeylonica13.57%Himantopus himantopus9.14%
Spilopelia chinensis12.12%Ardea purpurea5.91%
Vanellus indicus7.43%Leptocoma zeylonica5.65%
Acridotheres tristis5.98%Ducula aenea5.38%
Merops philippinus4.52%Corvus splendens4.57%
Disclaimer/Publisher’s Note: The statements, opinions and data contained in all publications are solely those of the individual author(s) and contributor(s) and not of MDPI and/or the editor(s). MDPI and/or the editor(s) disclaim responsibility for any injury to people or property resulting from any ideas, methods, instructions or products referred to in the content.

