Article

Investigating the Potential Utility of Environmental DNA to Provide a Relative Abundance Index for the Depleted Teleost, Mulloway, Argyrosomus japonicus

by
Meaghan L. Rourke
1,2,*,
Matt K. Broadhurst
3,4,
Ashley M. Fowler
5,
Jackson Wilkes Walburn
1,
Julian M. Hughes
5,
Donald Stewart Fielder
6,
Joseph D. DiBattista
7 and
Elise M. Furlan
8
1
Department of Primary Industries, Narrandera Fisheries Centre, Narrandera, NSW 2700, Australia
2
Gulbali Institute for Agriculture, Water and Environment, Charles Sturt University, Albury, NSW 2640, Australia
3
Fisheries Conservation Technology Unit, NSW Department of Primary Industries, National Marine Science Centre, Southern Cross University, Coffs Harbour, NSW 2450, Australia
4
Marine and Estuarine Ecology Unit, School of Biological Sciences, University of Queensland, Brisbane, QLD 4072, Australia
5
New South Wales Department of Primary Industries, Sydney Institute of Marine Science, Building 19, Chowder Bay Road, Mosman, NSW 2088, Australia
6
NSW Department of Primary Industries, Port Stephens Fisheries Institute, Locked Bag 1, Nelson Bay, NSW 2315, Australia
7
Australian Museum Research Institute, Australian Museum, Sydney, NSW 2010, Australia
8
Centre for Conservation Ecology and Genomics, Institute for Applied Ecology, University of Canberra, University Drive, Bruce, ACT 2617, Australia
*
Author to whom correspondence should be addressed.
Diversity 2023, 15(3), 322; https://doi.org/10.3390/d15030322
Submission received: 21 December 2022 / Revised: 7 February 2023 / Accepted: 15 February 2023 / Published: 22 February 2023
(This article belongs to the Special Issue eDNA for Basic and Applied Sciences)

Abstract

:
Non-invasive, low-cost methods for censusing depleted fish populations are being prioritised among many jurisdictions worldwide. Collecting environmental DNA (eDNA) could offer one such option for augmenting fish population assessments. However, candidate species need to be carefully selected because species-specific DNA shedding and decay rates are affected by many biotic and abiotic factors that may influence relative abundance estimates. In this study, we sought to ascertain if the eDNA of a depleted Australian teleost, mulloway, Argyrosomus japonicus, reflects its weight under controlled aquaria conditions. With four experiments, we investigated the relationships between mulloway eDNA concentrations and their weight tank−1 as a function of: (1) time post-tank establishment; (2) water temperatures (within the species’ tolerance range); (3) stocking densities; and (4) among individual, similar-sized fish. The concentrations of eDNA in tanks stabilised after six days, and a positive relationship was found between fish weight and eDNA concentration, despite some variability in shedding rates by similar-sized fish. There was also a positive effect of water temperature on eDNA concentrations, which reinforces the need to control for such abiotic factors. We conclude that there is strong utility in applying eDNA concentrations as an index of relative abundance for mulloway under controlled conditions, which justifies future field-based investigations.

1. Introduction

Globally, anthropogenic impacts, including habitat destruction, overexploitation, pollution, and introduced alien species, have resulted in many species becoming depleted and fragmented, which represent substantial risks to biodiversity. Of concern are losses to genetic variation and inbreeding, frequently manifesting themselves in populations that have substantially declined [1]. These genetic losses increase the risk of population collapse and must be carefully managed through reintroducing population connectivity, managing harvests (where appropriate), preserving genetically distinct stocks, or translocating individuals from other populations to improve genetic diversity and reduce inbreeding [2,3].
While the need for effective wildlife management is clear, it requires adequate information on species’ ecologies, including population sizes [4]. For harvested aquatic species such as marine teleosts that are not easily censused, it is crucial to have accurate assessments of population sizes to enable appropriate harvest levels to be determined. However, traditional methods for estimating teleost populations remain expensive and are often fishery-dependent (i.e., data are collected during fishing operations), which may create management problems where population issues are identified too late or not at all [5,6]. Relying solely on fishery-dependent data for population assessments is particularly concerning for depleted populations. In some cases, fisheries are eventually limited or closed to fishing, precluding the continued provision of time-series data. Alternative data sources and population assessment methods should therefore be considered in cases where there is the potential for loss of fishery-dependent data series.
An alternative approach that may support traditional population assessments is by sampling environmental DNA (eDNA), which comprises the traces of DNA left behind by an organism in its environment [7]. Beyond simply confirming the presence or absence of a particular species, in some cases, eDNA can also facilitate estimating relative population sizes under controlled and natural conditions [8,9]. However, the utility of eDNA to provide relative population sizes is influenced by several factors including: rates of species-specific DNA shedding and decay; body size, distribution, reproduction, and migrations; hydrological variables affecting DNA dispersal and persistence (especially water temperature); and methodologies for processing samples [8,9,10,11]. Therefore, the utility of eDNA for monitoring the abundance or biomass of a species must be carefully verified prior to its application. More specifically, it is evident from the increasing literature focused on eDNA that to fully assess its potential application among individual species, it is important to assess the impacts of various factors such as water temperature under controlled conditions prior to applications under natural conditions [8,9,10,11]. Further, such work should be prioritised among those species not only considered of most concern but also inhabiting environments appropriate for sampling and validating eDNA, which often include closed or estuarine systems (e.g., easily accessed on a regular basis and often with known species assemblages) [8].
In eastern Australia, one inshore/estuarine teleost for which there are considerable concerns over long-term sustainability is mulloway, Argyrosomus japonicus: an apex euryhaline predator with a key ecosystem role and of considerable economic value [12,13]. Due to historically high fishing mortality, coupled with possible environmental influences (e.g., periods of prolonged drought [14], the regional populations of mulloway in New South Wales (NSW) have been assessed as ‘overfished’ or ‘depleted’ (<20% of virgin biomass) for almost 20 years [14,15,16]. The stock decline has warranted rigorous and representative monitoring and assessment, but approaches currently rely on fishery-dependent data sources.
Mulloway are caught by recreational and commercial fishing sectors, although the primary source of monitoring data comes from the latter. Commercial fishing is increasingly limited owing to management changes, including closures within key estuaries, and more recently, reductions in efforts [15]. Assessing population abundance across the species’ range remains a challenge if limited to these traditional fishery-dependent approaches, particularly if further restrictions to fishery operations are implemented in response to continued low biomass. There is therefore a clear requirement to develop fishery-independent population-monitoring approaches that simultaneously encompass sufficient spatial coverage and are cost-effective. Using eDNA as a potential index of relative abundance may be an effective option, but as for all candidate species, there is a need to investigate suitability under controlled conditions as a precursor to rigorous field applications. Here, we sought to address this shortfall by using a series of controlled experiments to quantify the relationships between mulloway eDNA concentrations and their weights across the range of their typical thermal tolerances and schooling densities.

2. Materials and Methods

This study was conducted at the Port Stephens Fisheries Institute (PSFI) aquaria (32.74° S, 152.05° E) in NSW, Australia, from May to August 2021. Four controlled experiments were conducted to investigate the relationships between the mulloway eDNA concentrations and their weight tank−1 as a function of: (1) sampling times (i.e., to capture any temporal changes in eDNA concentration); (2) water temperatures; (3) stocking densities; and (4) variability in eDNA shedding among individual fish.

2.1. Aquaria Configuration and Fish Collection

Two enclosed rooms (12:12 h photoperiod) within the PSFI aquaria were configured to hold 18 × 150-L tanks (in groups of four for experiments 1–3) and 10 × 16-L tanks (experiment 4). All ‘experimental’ tanks were made from polyvinyl chloride and enclosed with lids. Prior to starting the experiments, each tank was sterilised for 24 h with a 2% chlorine (146 g L−1) solution to remove any residual mulloway DNA. All the tanks were supplied with flow-through water at ambient salinity (sourced from Tilligerry Creek, an adjacent tributary) and aerated using ceramic diffusers (at approximately 10 L air min−1) that had been previously sterilised. The 150-L tanks were supplied with ultraviolet (UV)-treated water, pre-heated or cooled to the required temperatures for relevant experiments (1–3) at 2.0 L min−1 (±10%), while the 16-L tanks were held in a temperature-controlled room and supplied with water at a rate of 0.1 L min−1. During each experiment, individual tank temperatures were constantly monitored with sterilised probes, and water flows were checked daily and adjusted if beyond a ± 10% range.
Juvenile mulloway were used in the experiments because it was impractical to house adults given they grow to >1 m total length (TL) and >30 kg [16]. The mulloway used in the experiments were hatched at the PSFI aquaria on 5 February 2021 and reared following the methods described by Fielder and Heasman [17]. After 33 days, ~1500 fish (all < ~10 mm TL) were transferred to a 5000-L flow-through (~50% volume replacement hour−1) holding tank, which was situated indoors, supplied with ambient, filtered seawater, and fed daily with a commercial diet at 5% biomass (Nutragard Start Sink, Ridley, Australia). At the start of each experiment, all the fish in the 5000-l holding tank were anesthetised (20 mg L−1 AQUI-S®, Fresh by Design, Moss Vale, NSW, Australia), and the required numbers were randomly selected (see below) and weighed (nearest 1.0 g) prior to release into the experimental tanks (Figure 1). Fish were not measured to minimise handling stress. All the experimental fish were fed daily at a reduced rate (1% of their tank biomass) given the lower flow rate in the experimental tanks compared with the holding tank to maintain fish health but not impact water quality. Any uneaten food or waste were siphoned (using sanitised siphons) prior to the following feed. All tanks were monitored daily for mortalities. Prior to most experiments, fish were acclimated for three days to the required experimental temperature (18.0 ± 1.0 °C) in the holding tanks.
To confirm whether experimental tanks were free of mulloway DNA prior to adding the fish, we filtered a 1.0-L water sample from each tank using a Smith Root eDNA sampler™ (EnviroDNA, Brunswick, Victoria, Australia) and a 5-µm polyethersulfone (PES) filter, enclosed in a sterile self-preserving filter housing (Smith–Root, EnviroDNA, Brunswick, Victoria, Australia) at 1.0 L min−1 and a maximum pressure of 69 kPa and stored at 4 °C. The 5 µm filter size was selected for consistency with planned field trials that minimise clogging due to the high turbidity typical of many Australian estuaries. All water sampling for the four experiments was conducted as described above. The filters were tested for the presence of mulloway DNA, as described in Section 2.3. An equipment control (EC) consisting of 1.0 L of sterile water was filtered prior to the sampling of tanks at every time point.

2.2. Experimental Procedure

Common among all the experiments, two tanks were always designated controls (containing no fish) and were sampled to test for mulloway DNA on day zero and at the conclusion of each experiment. For all tanks, the water temperature was maintained at 18.0 ± 1.0 °C, except those used in experiment 2. For experiment 1, we collected one 1-L sample tank−1, while for experiments 2 to 4, we collected four 1-L samples tank−1 to account for the unequal dispersion of eDNA in the water [18]. Sampling for experiments was conducted after six (experiments 3 and 4) or eight days (experiment 2, due to a 48 h acclimation period within the experimental tank; see below) (Figure 1; see Results).
In experiment 1, we investigated the temporal changes in eDNA concentrations by sampling from each tank on days 1, 2, 3, 6, 9, and 12 (post-stocking) across two stocking densities (20 vs. 40 fish in each of the four tanks) (Figure 1). In experiment 2, we investigated the effects of temperature on the relationship between eDNA concentration and weight by holding mulloway (20 fish tank−1) at either low (16.0 ± 1.0 °C) or high (24.0 ± 1.0 °C) temperatures, each replicated across seven tanks (Figure 1). Fish were stocked into the experiment at 19.0 ± 1.0 °C and then transitioned to the two treatment temperatures over 48 h. During experiment 3, we investigated the relationship between weight and eDNA concentrations by holding mulloway in tanks at 18 densities ranging from two to 60 fish (with 1 replicate tank density−1) (Figure 1). In experiment 4, we investigated individual variability in eDNA shedding rates by holding 10 mulloway of similar weights (30.5–32.0 g) in individual tanks for six days, after which the tanks were sampled (Figure 1).

2.3. Filters, DNA Extraction, and Quantitative PCR

All the laboratory processing of filters to isolate and amplify DNA took place in a purpose-built eDNA facility at the Narrandera Fisheries Centre (NFC), Australia. This facility includes three separate UV-sterilised rooms each with a PCR hood (AirClean Systems, Ferntree Gully, VIC, Australia) for DNA extraction, PCR preparation, and DNA template loading. The DNA was extracted from the filter papers within four weeks of collection using a PureLink™ Genomic DNA Mini Kit (Invitrogen, Waltham, MA, USA) with a modified protocol [19].
A 166-bp fragment of the mitochondrial 12S rRNA gene was amplified using quantitative PCR (qPCR) with a custom Applied Biosystems TaqManTM assay (Thermo Fisher Scientific, Scoresby, VIC, Australia)). Mitochondrial 12S rRNA gene fragments were amplified using the primers A.jap_12S_F (5′-CTCACCCTTCTTTGTTTCCC-3′); A.jap_12S_R (5′-CATCATTCGTTTTCTCTGTGTC-3′) and probe (FAM-dye-labelled); and A.jap_12S_probe (5′-CCGTCGTCAGCTTACCCTGTG-3′) [19]. All samples, including the EC and negative extraction control, were analysed using six replicate 20 µL qPCR reactions, comprising 10 µL Environmental Master Mix 2.0, 1 µL TaqManTM Gene Expression assay 20×, 7 µL DNase/RNase free water, and 2 µL of DNA template. In addition, six no-template control (NTC) PCR replicates were included on each plate to identify the potential contaminants introduced in the molecular workflow. Standards, with six concentrations ranging between 10–3 and 10–8 ng µL−1, comprising 166 bp of mulloway 12S rRNA synthetic oligonucleotides diluted in tRNA buffer (1:250 diluted in DNase/RNase water; Sigma-Aldrich, Burlington, MA, USA), were included on each plate in triplicate to generate a standard curve for quantifying eDNA concentrations. To facilitate detecting the potential contamination of EC or NTC samples with the synthetic oligonucleotide, we included an eight-base pair reverse complement within the synthetic sequence. The reactions were run on a QuantStudio3 PCR System (Applied Biosystems, Waltham, MA, USA) with thermal cycling conditions set at 50 °C (2 min) and 95 °C (10 min), followed by 50 cycles of 95 °C (15 s) and 56°C (60 s).

2.4. Statistical Analyses

Variability in eDNA concentrations (ng l−1; response variable) among the replicate tanks in all the experiments was investigated using fixed- or mixed-effect models. For all models, the underlying distributions of eDNA concentration were first assessed, and functions were applied where required, dictating linear (Gaussian) or generalised linear (gamma) approaches. Except for experiment 1, the blocking effects of ‘tanks’ were always included as a random factor (i.e., mixed-effect models). Fixed effects varied according to the hypothesis being tested and included the stocking ‘density’ (two levels) and sampling ‘time’ (and their interaction) in experiment 1, water ‘temperature’ (two levels) in experiment 2, and ‘weight’ of mulloway tank−1 for experiments 3 and 4. The significance for all categorical fixed effects in all the experiments was determined using likelihood ratio tests. All models were run using the glm or glmmTMB functions in R (R Development Core Team 2020).

3. Results

3.1. Experimental Fish

There was minimal intra-experimental variability in the sizes of mulloway selected from the 1500 fish housed in the 5000-L holding tank, but owing to the temporal staggering of the trials, the mean (±SE) fish weights were lower in experiment 1 (9.9 ± 2.4 g) than in experiments 2 (32.2 ± 9.8 g), 3 (33.5 ± 12.6 g), and 4 (31.3 ± 0.8 g). There were no fish mortalities in the 5000-L holding tank or experimental tanks during the study period. The fish used in experiments 1–3 were not visibly disturbed during the water sampling process. In contrast, the mulloway held in individual tanks for experiment 4 were observed to swim rapidly and frequently contacted the tank walls during water sampling.

3.2. Quality Control

One litre of water was successfully filtered across all replicates and in all experiments, indicating no issues related to water turbidity or clogging of the filters. Mulloway eDNA concentrations ranged between 1.94 × 10⁻⁶ and 4.16 × 10⁻⁴ ng L−1 across all the treatments in the four experiments. No mulloway DNA was detected in any of the equipment controls, NTC controls, or the control tanks at the beginnings and ends of experiments 1 and 3. However, for experiment 4, one positive qPCR out of six replicates was recorded in one control tank on day zero and a single positive qPCR replicate was recorded in the other control at the end of the experiment. Two of the experimental tanks also had a single positive qPCR replicate (from six replicates) on day zero. The quantity of DNA in the controls and two experimental tanks at time zero (mean ± SE 7.44 × 10⁻¹¹ ± 4.25 ng L–11) was much lower than the quantity in all treatments at day six (8.37 × 10⁻⁵ ± 2.54 × 10⁻⁵ ng L−1) and therefore was not considered to influence the interpretation of the overall results. We attribute these detections (at low relative concentrations) to either residual mulloway eDNA remaining in the tanks prior to adding fish, cross-contamination between the experimental tanks, and/or laboratory contamination.

3.3. Environmental DNA Variability within and among Experiments

In all the experiments, the key fixed factors of interest significantly explained the variability among eDNA concentrations tank−1 (p < 0.05). For experiment 1, there were significant effects of time (negative coefficient; generalised linear model (GLM); p < 0.001), but the interaction term was not significant (p > 0.05; Figure 2). The model in experiment 1 was best represented by a cubic polynomial term with the concentrations of eDNA decreasing up to the third day, remaining stable up to day six, peaking at day eight, and then declining gradually until the end of the experiment (Figure 2). Based on these results, we determined six days was the most appropriate time point to collect water samples during the remaining experiments.
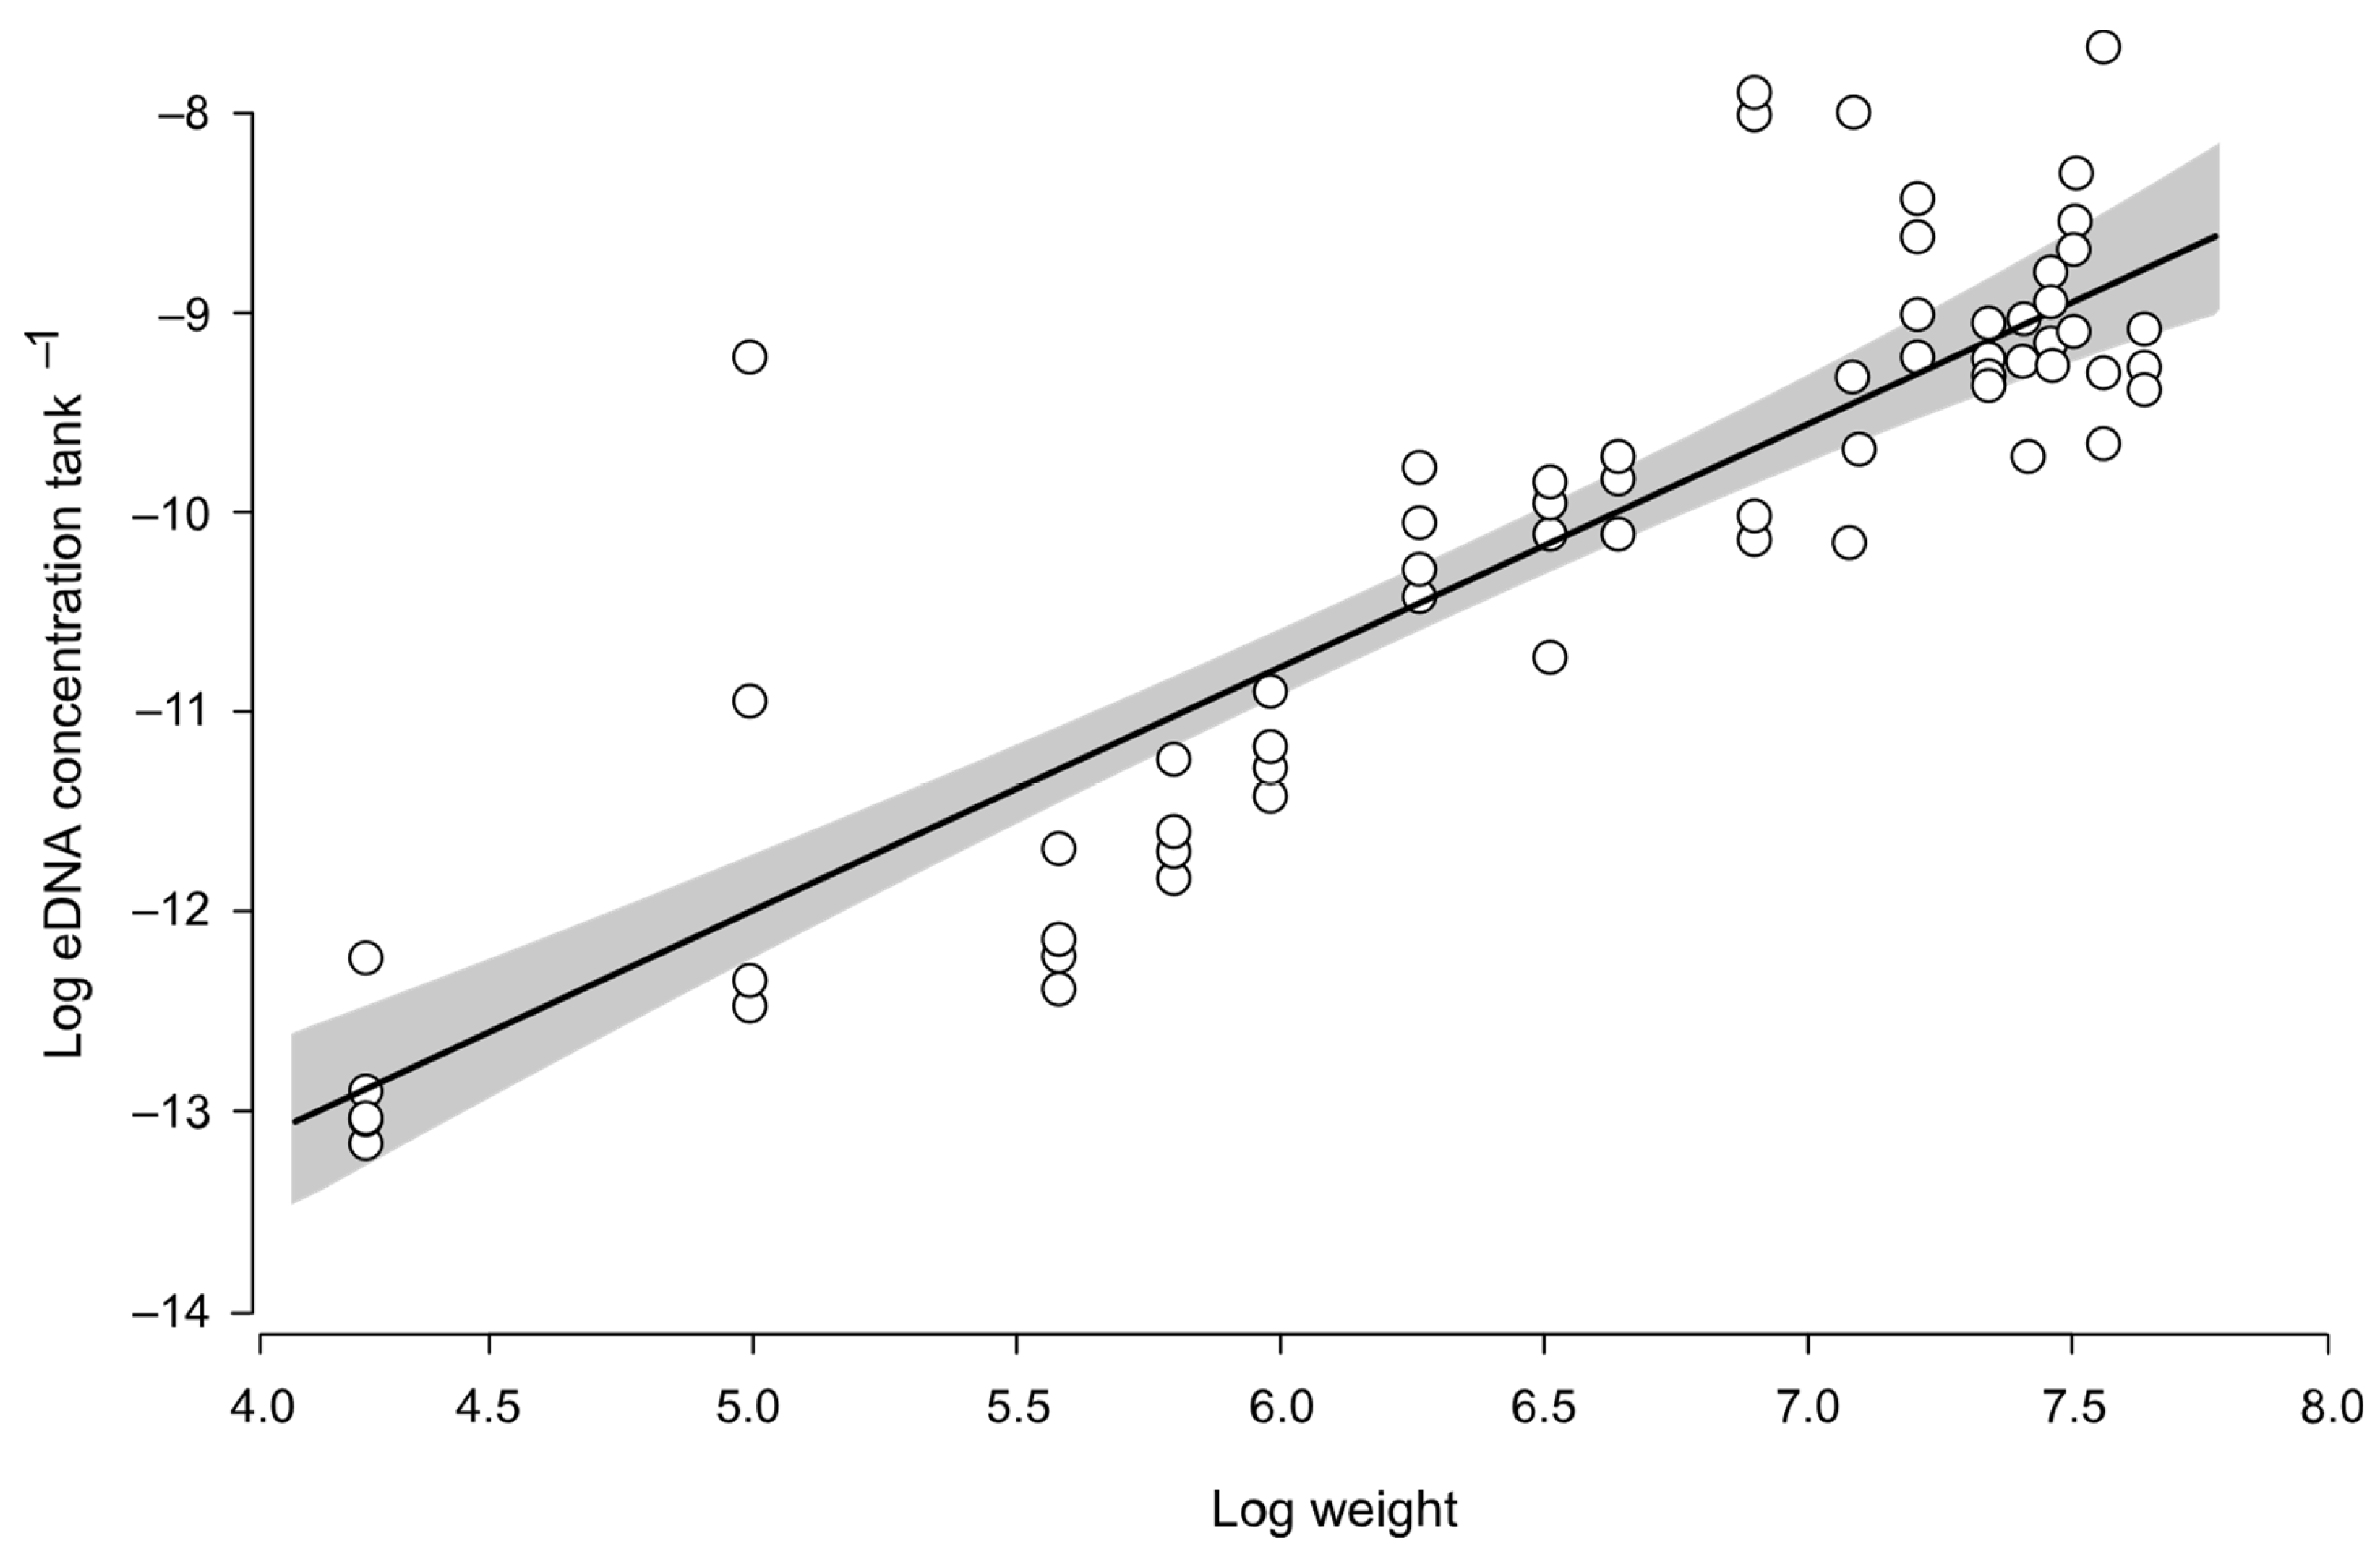
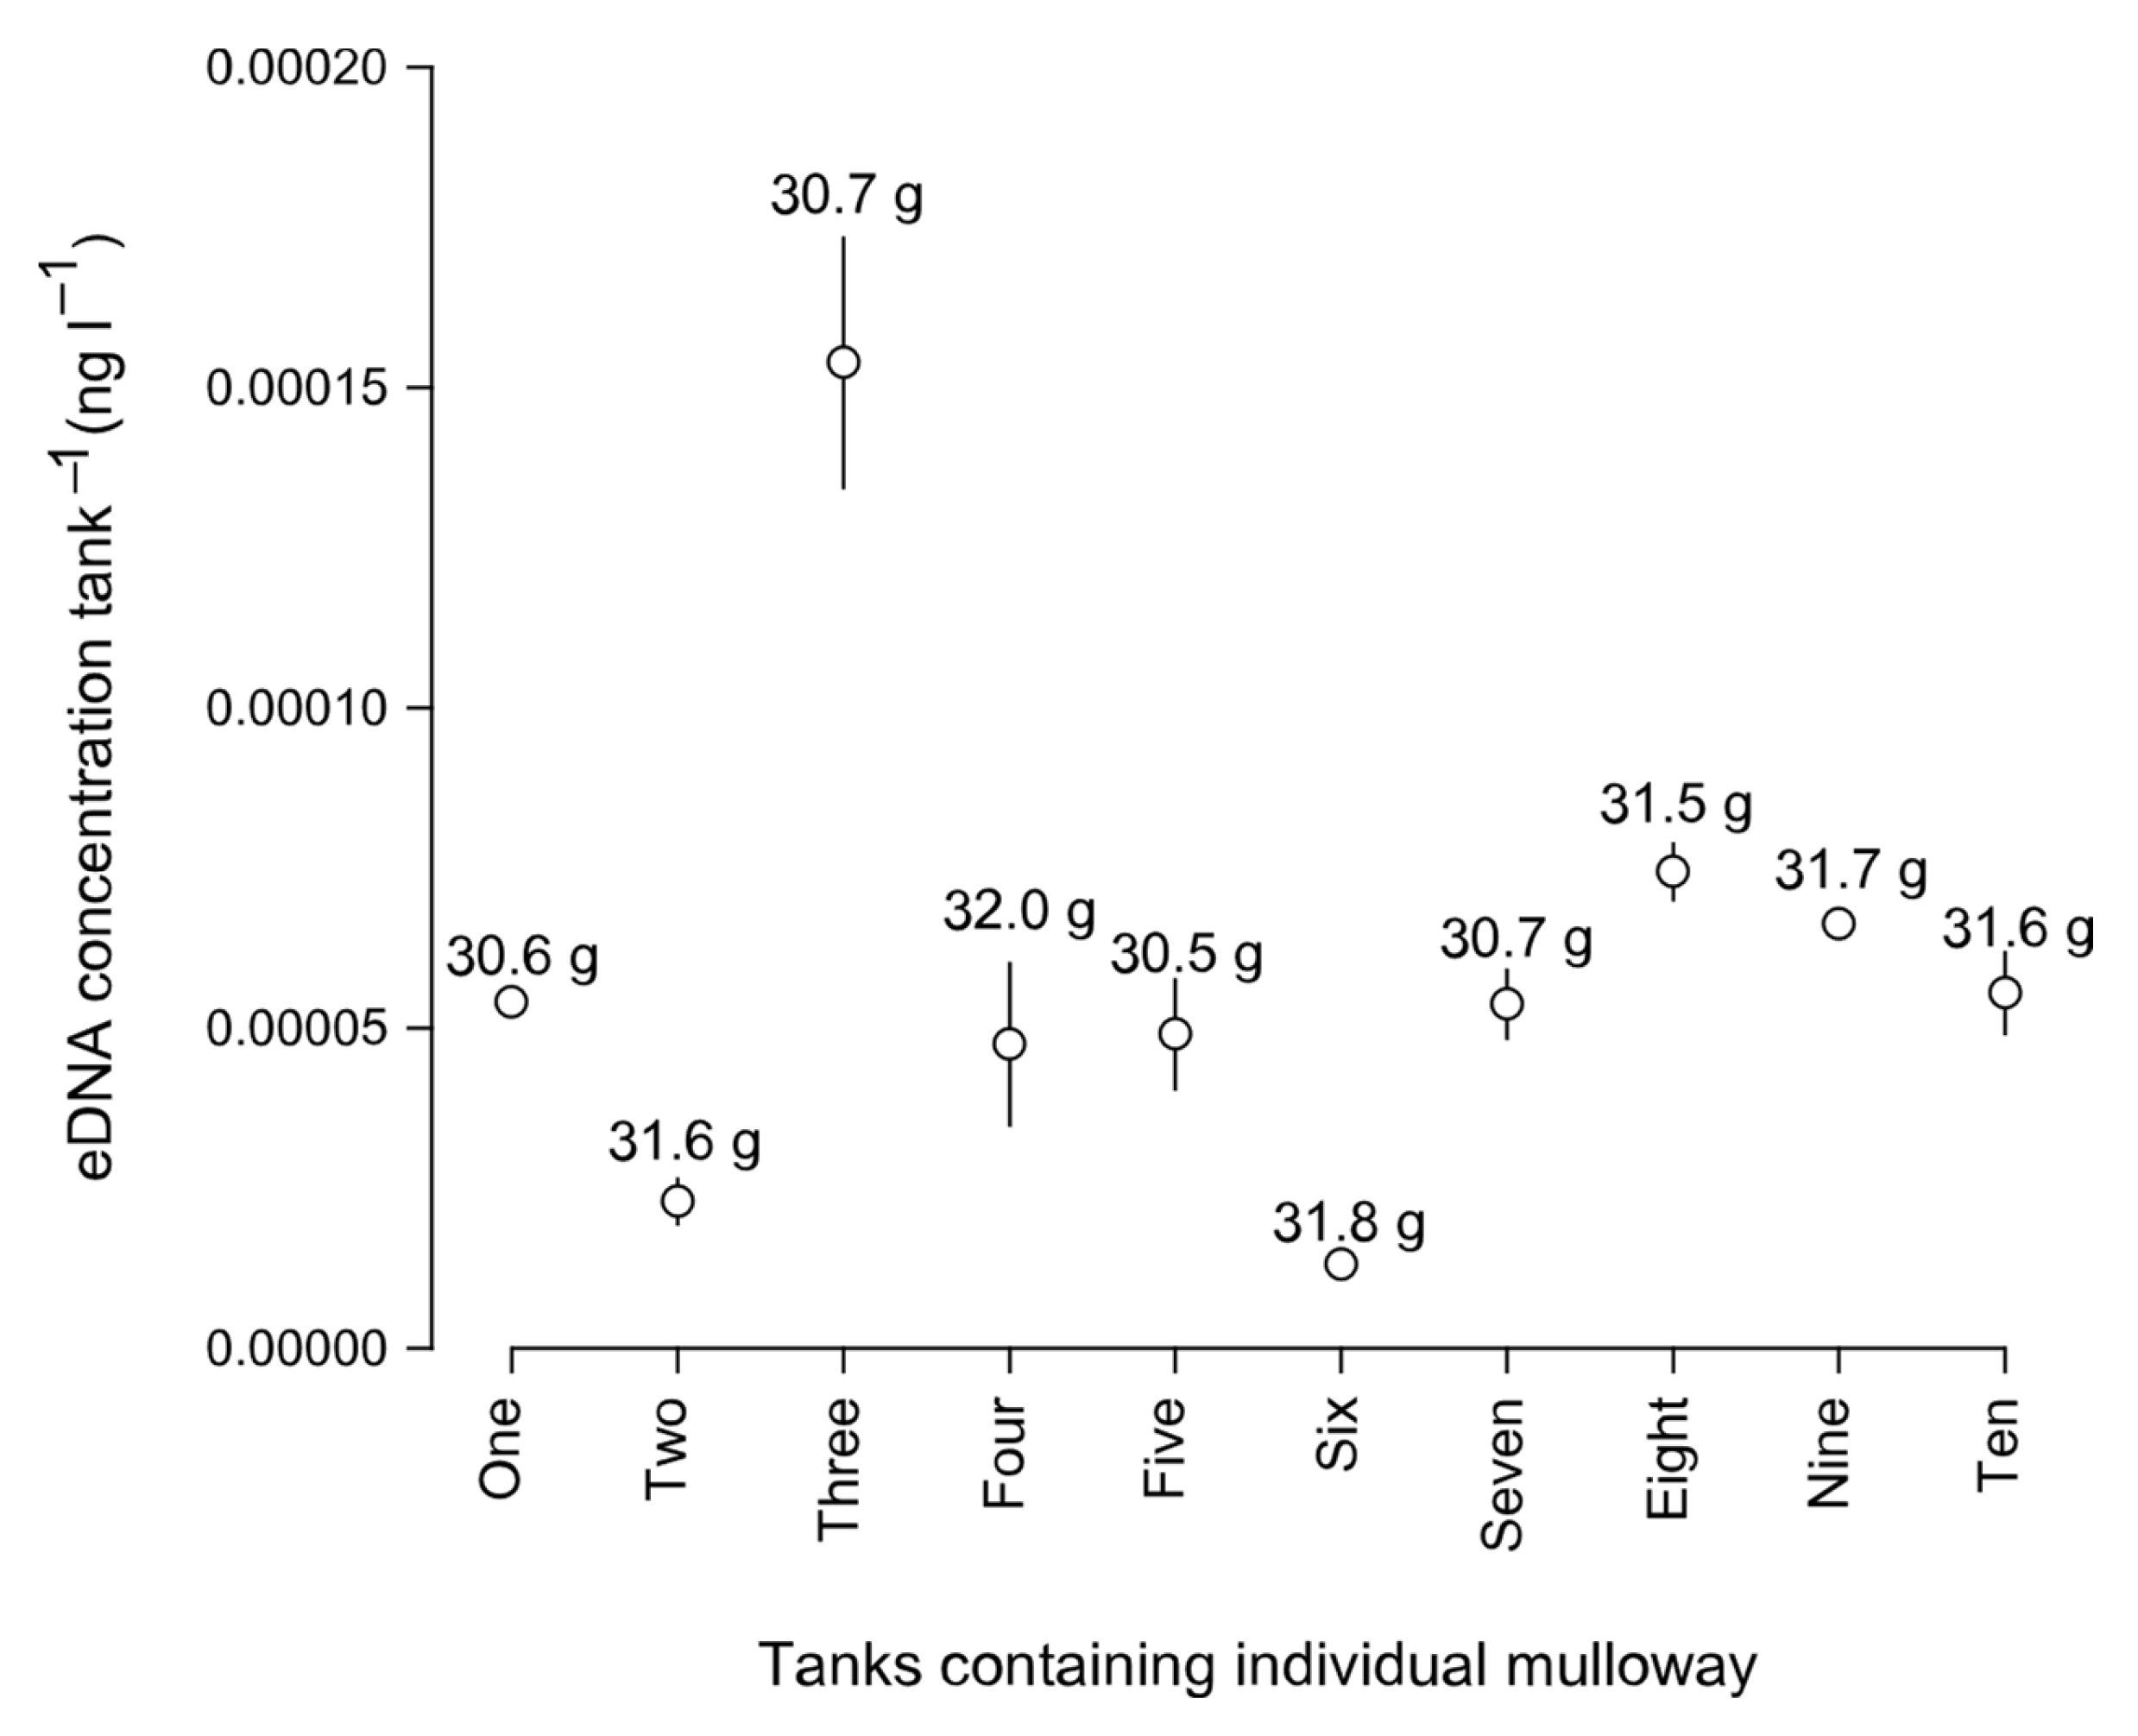
In experiment 2, there was a significant main effect of temperature, with predicted eDNA concentrations tank−1 ~1.5 times greater at warmer (1.01 × 10⁻⁴ ± 0.93 × 10⁻⁵ ng L−1) versus cooler temperatures (6.86 × 10⁻⁵ ± 0.48 × 10⁻⁵ ng L−1) (generalised linear mixed model (GLMM); p < 0.05). For experiment 3, we detected a significant positive linear relationship between the log eDNA concentration tank−1 and the log weight of fish tank−1 (linear mixed model (LMM); p < 0.001; Figure 3). In experiment 4, there were significant differences detected among eDNA concentrations in the tanks containing individual fish (LMM; p < 0.01), which was not explained by their minimally variable weights (30.5–31.8 g tank−1; p > 0.05; Figure 4).

4. Discussion

The data from this study imply a strong positive relationship between juvenile mulloway eDNA concentrations and their weights under controlled conditions—an outcome that occurred despite significant variations among individual shedding rates and the influences of temperature. This trend supports the general consensus from the recent literature on the potential for eDNA concentration to serve as a proxy for biomass/abundance [8]. Collectively, the data justify pursuing further research (especially field trials) to test the potential associations between eDNA and the weight/abundance of mulloway in the wild [20]. However, there are some considerations in terms of our chosen experimental design that warrant discussion prior to future regional work with this species, and possibly other species occupying similar habitats and with similar ecologies.
A key consideration is our necessitated use of small fish and any possible confounding effects of body size on the eDNA and weight/abundance relationships. While the positive relationship for juvenile mulloway is consistent with aquaria experiments for numerous other species [8,21,22], it is possible that DNA shedding rates in adult mulloway might not scale linearly with body size. Given mulloway are segregated by size across dynamic estuarine and coastal environments, with juveniles mostly in estuaries and adults moving between estuaries and inshore marine waters, [13,23], eDNA probably will not be useful for predicting absolute biomass or abundances unless size distributions are known [24]. Future research, therefore, warrants assessing the consistency in the relationships between eDNA concentrations and the biomass/abundance of larger fish. The same argument supports re-evaluating the effects of water temperature variability and any size-specific effects. Owing to the limitations of aquaria work, this future field-based research would require concomitant sampling of wild populations (e.g., using fishing gear or hydroacoustic surveys).
A second consideration when interpreting the results presented here is that notwithstanding the significant relationship between eDNA and the abundance of juvenile mulloway overall, there was substantial variability among the tanks containing individual fish (experiment 4) that was not explained by their weight. This result implies that the amount of DNA shed by juvenile mulloway varies between individuals, supporting similar conclusions in other aquatic studies [21,25,26]. For example, Rourke et al. [26] found individual variation in the shedding rate resulted in no useful relationship between weight and eDNA concentrations for Murray cod, Maccullochella peelii under similar controlled conditions. Given Murray cod are typically solitary, such individual variation is likely to be maintained in wild populations where they are more sparsely distributed than schooling species [26]. For species such as mulloway that strongly shoal as juveniles but develop more solitary behaviour as adults, any differences in eDNA shedding rates may confound biomass estimates when different life history stages are present.
Such differences in shedding rates are potentially caused by variations in metabolic rates (either standard or maximum), driving the differences in activity, feeding, and growth [27]. Increased feeding results in increased gastrointestinal transit, potentially increasing DNA shedding from the intestinal wall [21,28]. Boldness may also vary considerably among individual fish, resulting in significant differences in activity levels and therefore shedding from external vs. internal tissue [29].
Alternatively, the observed agitation of solitary juveniles (which would not occur in the wild) during sampling in experiment 4 might have variably affected DNA shedding rates. Specifically, during eDNA sampling, we observed isolated fish to be more agitated, swimming rapidly, and more frequently colliding with the walls of their tanks than those housed with multiple conspecifics. Such stress responses may have been amplified because the fish were not part of an optimally sized school previously shown to reduce predator avoidance behaviour [30]. We did not observe similar agitation among juvenile mulloway held in groups of two or more fish during experiment 3. Hence, under similar conditions, isolated juvenile mulloway may shed DNA more than conspecifics in larger groups.
Irrespective of the causes of significant intra-specific variation in eDNA shedding, caution is required when designing experiments to examine the factors affecting concentrations simply because variable shedding among individuals may overwhelm biologically relevant effect sizes between treatments. It may be beneficial to use small groups of individuals in each replicate tank rather than single individuals to minimise stress and also reduce the effects of any single individual with an unusually high or low shedding rate. For example, when examining the relationship between eDNA concentration and biomass, the same levels of biomass could be established using a large number of small fish rather than a small number of large fish. This approach assumes uniform shedding rates across size classes, which also requires prior validation.
Despite the above caveats of size- and intra-specific variability, our experimental methodology was sufficient to isolate the importance of abiotic factors on eDNA concentration. Specifically, warmer water (24 vs. 16 °C) resulted in ~1.5 times more DNA in the water. Notwithstanding possible size-dependence effects (as discussed above), it is well established that eDNA concentrations can be influenced by water temperature acting via mechanisms of: (1) eDNA degradation and/or, (2) animal physiology and/or behaviour [8,31,32,33,34]. Warmer water tends to increase eDNA degradation (but see [35]), although it is rarely due to direct DNA denaturation but rather the indirect activity of hydrolysing microbes and exonucleases [36,37,38].
Owing to increased activity and metabolic rates in warmer water and greater DNA shedding, species-specific physiology is also likely to affect eDNA concentrations [34,39]. Therefore, warmer temperatures within a species’ range could increase the risk of overestimating fish biomass in the field, so temperatures should be recorded and accounted for under natural conditions where possible [39]. This prerequisite is particularly important for juvenile mulloway, given that they inhabit temperate estuaries where the temperature fluctuates widely among seasons and with depth. Conceivably, individuals may seek ideal water temperatures (i.e., depth-dependent) to optimise their routine metabolic rate [40].
Such estuarine environments also present additional challenges for eDNA-based biomass estimates due to: (1) the potential for dilution, deposition, and transport of eDNA away from source individuals; and (2) the increased risk of PCR inhibition due to high turbidity [41,42,43]. This means that the estimated eDNA concentrations may not reflect the biomass of mulloway at the sampling location. Consequently, hydrological models are needed to better understand eDNA transport in estuaries [20], which may be unique to each system. Nevertheless, the few studies assessing the tidal influences on eDNA distribution in estuarine environments have shown minimal effects, but accounting for eDNA transport can improve the correlation between concentrations and biomass [44,45,46]; however, see [47] for a counter-example.
In summary, this study identified a significant relationship between eDNA concentrations and the weights of juvenile mulloway under controlled conditions, which represents a positive first step towards developing a potential fishery-independent, non-lethal, and cost-effective monitoring method. If reproducible under natural conditions, the approach might be developed into a regular monitoring program that supports developing an index of relative biomass which could be used to infer biomass trends through time. However, to move beyond associations between eDNA concentrations and weights and to begin to acquire absolute measures of biomass, considerably more data are required on the abiotic and biotic factors impacting the eDNA concentration in the water [8].
Given the ongoing reductions in costs of processing eDNA samples as technology advances, it may be feasible to collect eDNA samples concurrently with other sampling methods (e.g., trawling or hydroacoustic surveys) to build a reference database to inform future quantitative work. Over sufficient temporal scales, concurrent monitoring using other methods may facilitate the development of field-based eDNA–biomass conversion factors to estimate absolute biomass from eDNA concentrations. However, the feasibility of such an approach depends on identifying and quantifying sources of variance in the eDNA–biomass relationship. Ultimately, the declining cost of eDNA techniques will assist both rigorous field validation and the development of a robust monitoring program for aquatic species, should validation prove successful.

Author Contributions

Conceptualisation, M.L.R., M.K.B., A.M.F., J.M.H., D.S.F., J.D.D. and E.M.F.; data curation, M.L.R. and J.W.W.; formal analysis, M.L.R., M.K.B., A.M.F., J.M.H. and E.M.F.; funding acquisition, M.L.R., M.K.B., A.M.F., J.M.H., D.S.F. and J.D.D.; investigation, M.L.R., J.W.W. and D.S.F.; methodology, M.L.R., M.K.B., A.M.F., J.W.W., J.M.H., D.S.F., J.D.D. and E.M.F.; project administration, M.L.R.; resources, M.L.R., M.K.B., A.M.F., J.M.H. and D.S.F.; supervision, M.L.R.; validation, M.L.R., J.W.W., J.D.D. and E.M.F.; visualisation, M.K.B. and A.M.F.; writing—original draft preparation, M.L.R., M.K.B., A.M.F., J.W.W., J.M.H. and J.D.D.; writing—review and editing, M.L.R., M.K.B., A.M.F., J.W.W., J.M.H., D.S.F., J.D.D. and E.M.F. All authors have read and agreed to the published version of the manuscript.

Funding

This research was funded by the NSW Department of Primary Industries (DPI) and the Fisheries Research and Development Corporation (project no. 2019-016) on behalf of the Australian Government.

Institutional Review Board Statement

The animal study protocol was approved by the Fisheries Animal Care and Ethics Committee of NSW DPI (ACEC permit number 20/01, 20/09/2019).

Data Availability Statement

Data will be made available on request by contacting the corresponding author.

Acknowledgments

We thank Luke Cheviot, Brendan Findlay, and Daniel Yee for assistance with setting up and maintaining mulloway in the aquaria and Andrew Bruce for assistance with filtering water samples.

Conflicts of Interest

The authors declare no conflict of interest.

References

  1. Petit-Marty, N.; Liu, M.; Tan, I.; Chung, A.; Terrasa, B.; Guijarro, B.; Ordines, F.; Ramırez-Amaro, S.; Massutı, E.; Schunter, C. Declining Population Sizes and Loss of Genetic Diversity in Commercial Fishes: A Simple Method for a First Diagnostic. Front. Mar. Sci. 2022, 9, 1–11. [Google Scholar] [CrossRef]
  2. Attard, C.R.M.; Möller, L.M.; Sasaki, M.; Hammer, M.P.; Bice, C.M.; Brauer, C.J.; Carvalho, D.C.; Harris, J.O.; Beheregaray, L.B. A novel holistic framework for genetic-based captive-breeding and reintroduction programs. Conserv. Biol. 2016, 30, 1060–1069. [Google Scholar] [CrossRef]
  3. Hilborn, R.; Quinn, T.P.; Schindler, D.E.; Rogers, D.E. Biocomplexity and fisheries sustainability. Proc. Natl. Acad. Sci. USA 2003, 100, 6564–6568. [Google Scholar] [CrossRef] [Green Version]
  4. King, M. Fisheries Biology, Assessment and Management. Fishing News Books; Blackwell Science: London, UK, 1995; p. 342. [Google Scholar]
  5. Tilzey, R.D.J.; Rowling, K.R. History of Australia’s South East Fishery: A scientist’s perspective. Mar. Freshw. Res. 2001, 52, 361–375. [Google Scholar] [CrossRef]
  6. Maunder, M.N.; Sibert, J.R.; Fonteneau, A.; Hampton, J.; Kleiber, P.; Harley, S.J. Interpreting catch per unit effort data to assess the status of individual stocks and communities. ICES J. Mar. Sci. 2006, 63, 1373–1385. [Google Scholar] [CrossRef] [Green Version]
  7. Thomsen, P.F.; Willerslev, E. Environmental DNA–An emerging tool in conservation for monitoring past and present biodiversity. Biol. Conserv. 2015, 183, 4–18. [Google Scholar] [CrossRef]
  8. Rourke, M.L.; Fowler, A.M.; Hughes, J.M.; Broadhurst, M.K.; DiBattista, J.D.; Fielder, S.; Wilkes Walburn, J.; Furlan, E.M. Environmental DNA (eDNA) as a tool for assessing fish biomass: A review of approaches and future considerations for resource surveys. Environ. DNA 2022, 4, 9–33. [Google Scholar] [CrossRef]
  9. Yao, M.; Zhang, S.; Lu, Q.; Chen, X.; Zhang, S.-Y.; Kong, Y.; Zhao, J. Fishing for fish environmental DNA: Ecological applications, methodological considerations, surveying designs, and ways forward. Mol. Ecol. 2022, 31, 5132–5164. [Google Scholar] [CrossRef]
  10. Lamb, P.D.; Fonseca, V.G.; Maxwell, D.L.; Nnanatu, C.C. Systematic review and meta-analysis: Water type and temperature affect environmental DNA decay. Mol. Ecol. Resour. 2022, 22, 2494–2505. [Google Scholar] [CrossRef]
  11. Xing, Y.; Gao, W.; Shen, Z.; Zhang, Y.; Bai, J.; Cai, X.; Ouyang, J.; Zhao, Y. A Review of Environmental DNA Field and Laboratory Protocols Applied in Fish Ecology and Environmental Health. Front. Environ. Sci. 2022, 10, 1–17. [Google Scholar] [CrossRef]
  12. Taylor, M.D.; van der Meulen, D.E.; Ives, M.C.; Walsh, C.T.; Reinfelds, I.V.; Gray, C.A. Shock, Stress or Signal? Implications of Freshwater Flows for a Top-Level Estuarine Predator. PLoS ONE 2014, 9, e95680. [Google Scholar] [CrossRef] [Green Version]
  13. Hughes, J.M.; Meadows, N.M.; Stewart, J.; Booth, D.J.; Fowler, A.M. Movement patterns of an iconic recreational fish species, mulloway (Argyrosomus japonicus), revealed by cooperative citizen-science tagging programs in coastal eastern Australia. Fish. Res. 2022, 247, 106179. [Google Scholar] [CrossRef]
  14. Stewart, J.; Hughes, J.M.; Stanley, C.; Fowler, A.M. The influence of rainfall on recruitment success and commercial catch for the large sciaenid, Argyrosomus japonicus, in eastern Australia. Mar. Environ. Res. 2020, 157, 104924. [Google Scholar] [CrossRef]
  15. Silberschneider, V.; Gray, C.A.; Stewart, J. Age, growth, maturity and the overfishing of the iconic sciaenid, Argyrosomus japonicus, in south-eastern, Australia. Fish. Res. 2009, 95, 220–229. [Google Scholar] [CrossRef]
  16. Earl, J.; Fairclough, D.; Fisher, E.; Hughes, J.; Roelofs, A. Mulloway Argyrosomus Japonicus; Fisheries Research and Development Corporation: Canberra, NSW, Austria, 2021. [Google Scholar]
  17. Fielder, S.; Heasman, M.P. Hatchery Manual for the Production of Australian Bass, Mulloway and Yellowtail Kingfish; Industry and Investment NSW and Fisheries Research and Development Corporation: Orange, NSW, Australia, 2011. [Google Scholar]
  18. Furlan, E.M.; Gleeson, D.; Hardy, C.M.; Duncan, R.P. A framework for estimating the sensitivity of eDNA surveys. Mol. Ecol. Resour. 2016, 16, 641–654. [Google Scholar] [CrossRef]
  19. Wilkes Walburn, J.; Rourke, M.L.; Furlan, E.; DiBattista, J.D.; Broadhurst, M.K.; Fowler, A.M.; Hughes, J.M.; Fielder, S. Robust environmental DNA assay development and validation: A case study with two vulnerable Australian fish. Aquat. Conserv. Mar. Freshwat. Ecosyst. 2022, 32, 1225–1231. [Google Scholar] [CrossRef]
  20. Harrison, J.B.; Sunday, J.M.; Rogers, S.M. Predicting the fate of eDNA in the environment and implications for studying biodiversity. Proc. R. Soc. B 2019, 286, 20191409. [Google Scholar] [CrossRef]
  21. Klymus, K.E.; Richter, C.A.; Chapman, D.C.; Paukert, C. Quantification of eDNA shedding rates from invasive bighead carp Hypophthalmichthys nobilis and silver carp Hypophthalmichthys molitrix. Biol. Conserv. 2015, 183, 77–84. [Google Scholar] [CrossRef]
  22. Eichmiller, J.J.; Miller, L.M.; Sorensen, P.W. Optimizing techniques to capture and extract environmental DNA for detection and quantification of fish. Mol. Ecol. Resour. 2016, 16, 56–68. [Google Scholar] [CrossRef]
  23. Russell, A.; Taylor, M.D.; Barnes, T.C.; Johnson, D.D.; Gillanders, B.M. Habitat transitions by a large coastal sciaenid across life history stages, resolved using otolith chemistry. Mar. Environ. Res. 2022, 176, 105614. [Google Scholar] [CrossRef]
  24. Yates, M.C.; Glaser, D.M.; Post, J.R.; Cristescu, M.E.; Fraser, D.J.; Derry, A.M. The relationship between eDNA particle concentration and organism abundance in nature is strengthened by allometric scaling. Mol. Ecol. 2021, 30, 3068–3082. [Google Scholar] [CrossRef]
  25. Takeuchi, A.; Iijima, T.; Kakuzen, W.; Watanabe, S.; Yamada, Y.; Okamura, A.; Horie, N.; Mikawa, N.; Miller, M.J.; Kojima, T.; et al. Release of eDNA by different life history stages and during spawning activities of laboratory-reared Japanese eels for interpretation of oceanic survey data. Sci. Rep. 2019, 9, 6074. [Google Scholar] [CrossRef] [Green Version]
  26. Rourke, M.L.; Walburn, J.W.; Broadhurst, M.K.; Fowler, A.M.; Hughes, J.M.; Fielder, D.S.; DiBattista, J.D.; Furlan, E.M. Poor utility of environmental DNA for estimating the biomass of a threatened freshwater teleost; but clear direction for future candidate assessments. Fish. Res. 2023, 258, 106545. [Google Scholar] [CrossRef]
  27. Metcalfe, N.B.; Van Leeuwen, T.E.; Killen, S.S. Does individual variation in metabolic phenotype predict fish behaviour and performance? J. Fish Biol. 2016, 88, 298–321. [Google Scholar] [CrossRef] [Green Version]
  28. Ghosal, R.; Eichmiller, J.J.; Witthuhn, B.A.; Sorensen, P.W. Attracting Common Carp to a bait site with food reveals strong positive relationships between fish density, feeding activity, environmental DNA, and sex pheromone release that could be used in invasive fish management. Ecol. Evol. 2018, 8, 6714–6727. [Google Scholar] [CrossRef]
  29. Raoult, V.; Brown, C.; Zuberi, A.; Williamson, J.E. Blood cortisol concentrations predict boldness in juvenile mulloway (Argyosomus japonicus). J. Ethol. 2012, 30, 225–232. [Google Scholar] [CrossRef]
  30. Pirozzi, I.; Booth, M.A.; Pankhurst, P.M. The effect of stocking density and repeated handling on the growth of juvenile mulloway, Argyrosomus japonicus (Temminck & Schlegel 1843). Aquac. Int. 2008, 17, 199. [Google Scholar] [CrossRef]
  31. Person-Le Ruyet, J.; Mahé, K.; Le Bayon, N.; Le Delliou, H. Effects of temperature on growth and metabolism in a Mediterranean population of European sea bass, Dicentrarchus labrax. Aquaculture 2004, 237, 269–280. [Google Scholar] [CrossRef] [Green Version]
  32. Takahara, T.; Yamanaka, H.; Suzuki, A.A.; Honjo, M.N.; Minamoto, T.; Yonekura, R.; Itayama, T.; Kohmatsu, Y.; Ito, T.; Kawabata, Z.I. Stress response to daily temperature fluctuations in common carp, Cyprinus carpio L. Hydrobiologia 2011, 675, 65. [Google Scholar] [CrossRef]
  33. Jo, T.; Murakami, H.; Yamamoto, S.; Masuda, R.; Minamoto, T. Effect of water temperature and fish biomass on environmental DNA shedding, degradation, and size distribution. Ecol. Evol. 2019, 9, 1135–1146. [Google Scholar] [CrossRef] [Green Version]
  34. Thalinger, B.; Rieder, A.; Teuffenbach, A.; Pütz, Y.; Schwerte, T.; Wanzenböck, J.; Traugott, M. The Effect of Activity, Energy Use, and Species Identity on Environmental DNA Shedding of Freshwater Fish. Front. Ecol. Evol. 2021, 9, 1–13. [Google Scholar] [CrossRef]
  35. Takahara, T.; Minamoto, T.; Yamanaka, H.; Doi, H.; Kawabata, Z.i. Estimation of Fish Biomass Using Environmental DNA. PLoS ONE 2012, 7, e35868. [Google Scholar] [CrossRef] [Green Version]
  36. Barnes, M.A.; Turner, C.R. The ecology of environmental DNA and implications for conservation genetics. Conserv. Genet. 2016, 17, 1–17. [Google Scholar] [CrossRef] [Green Version]
  37. Eichmiller, J.J.; Best, S.E.; Sorensen, P.W. Effects of Temperature and Trophic State on Degradation of Environmental DNA in Lake Water. Environ. Sci. Technol. 2016, 50, 1859–1867. [Google Scholar] [CrossRef]
  38. Tsuji, S.; Ushio, M.; Sakurai, S.; Minamoto, T.; Yamanaka, H. Water temperature-dependent degradation of environmental DNA and its relation to bacterial abundance. PLoS ONE 2017, 12, e0176608. [Google Scholar] [CrossRef]
  39. Lacoursière-Roussel, A.; Rosabal, M.; Bernatchez, L. Estimating fish abundance and biomass from eDNA concentrations: Variability among capture methods and environmental conditions. Mol. Ecol. Resour. 2016, 16, 1401–1414. [Google Scholar] [CrossRef]
  40. Pirozzi, I.; Booth, M.A. The effect of temperature and body weight on the routine metabolic rate and postprandial metabolic response in mulloway, Argyrosomus japonicus. Comp. Biochem. Physiol. Part A: Mol. Integr. Physiol. 2009, 154, 110–118. [Google Scholar] [CrossRef]
  41. Shogren, A.J.; Tank, J.L.; Andruszkiewicz, E.; Olds, B.; Mahon, A.R.; Jerde, C.L.; Bolster, D. Controls on eDNA movement in streams: Transport, Retention, and Resuspension. Sci. Rep. 2017, 7, 5065. [Google Scholar] [CrossRef] [Green Version]
  42. Hallam, J.; Clare, E.L.; Jones, J.I.; Day, J.J. Biodiversity assessment across a dynamic riverine system: A comparison of eDNA metabarcoding versus traditional fish surveying methods. Environ. DNA 2021, 3, 1247–1266. [Google Scholar] [CrossRef]
  43. Sanches, T.M.; Schreier, A.D. Optimizing an eDNA protocol for estuarine environments: Balancing sensitivity, cost and time. PLoS ONE 2020, 15, e0233522. [Google Scholar] [CrossRef]
  44. Pochardt, M.; Allen, J.M.; Hart, T.; Miller, S.D.L.; Yu, D.W.; Levi, T. Environmental DNA facilitates accurate, inexpensive, and multiyear population estimates of millions of anadromous fish. Mol. Ecol. Resour. 2020, 20, 457–467. [Google Scholar] [CrossRef]
  45. Lafferty, K.D.; Garcia-Vedrenne, A.E.; McLaughlin, J.P.; Childress, J.N.; Morse, M.F.; Jerde, C.L. At Palmyra Atoll, the fish-community environmental DNA signal changes across habitats but not with tides. J. Fish Biol. 2021, 98, 415–425. [Google Scholar] [CrossRef]
  46. Kelly, R.P.; Gallego, R.; Jacobs-Palmer, E. The effect of tides on nearshore environmental DNA. PeerJ 2018, 6, e4521. [Google Scholar] [CrossRef] [Green Version]
  47. Saenz-Agudelo, P.; Delrieu-Trottin, E.; DiBattista, J.D.; Martínez-Rincon, D.; Morales-González, S.; Pontigo, F.; Ramírez, P.; Silva, A.; Soto, M.; Correa, C. Monitoring vertebrate biodiversity of a protected coastal wetland using eDNA metabarcoding. Environ. DNA 2022, 4, 77–92. [Google Scholar] [CrossRef]
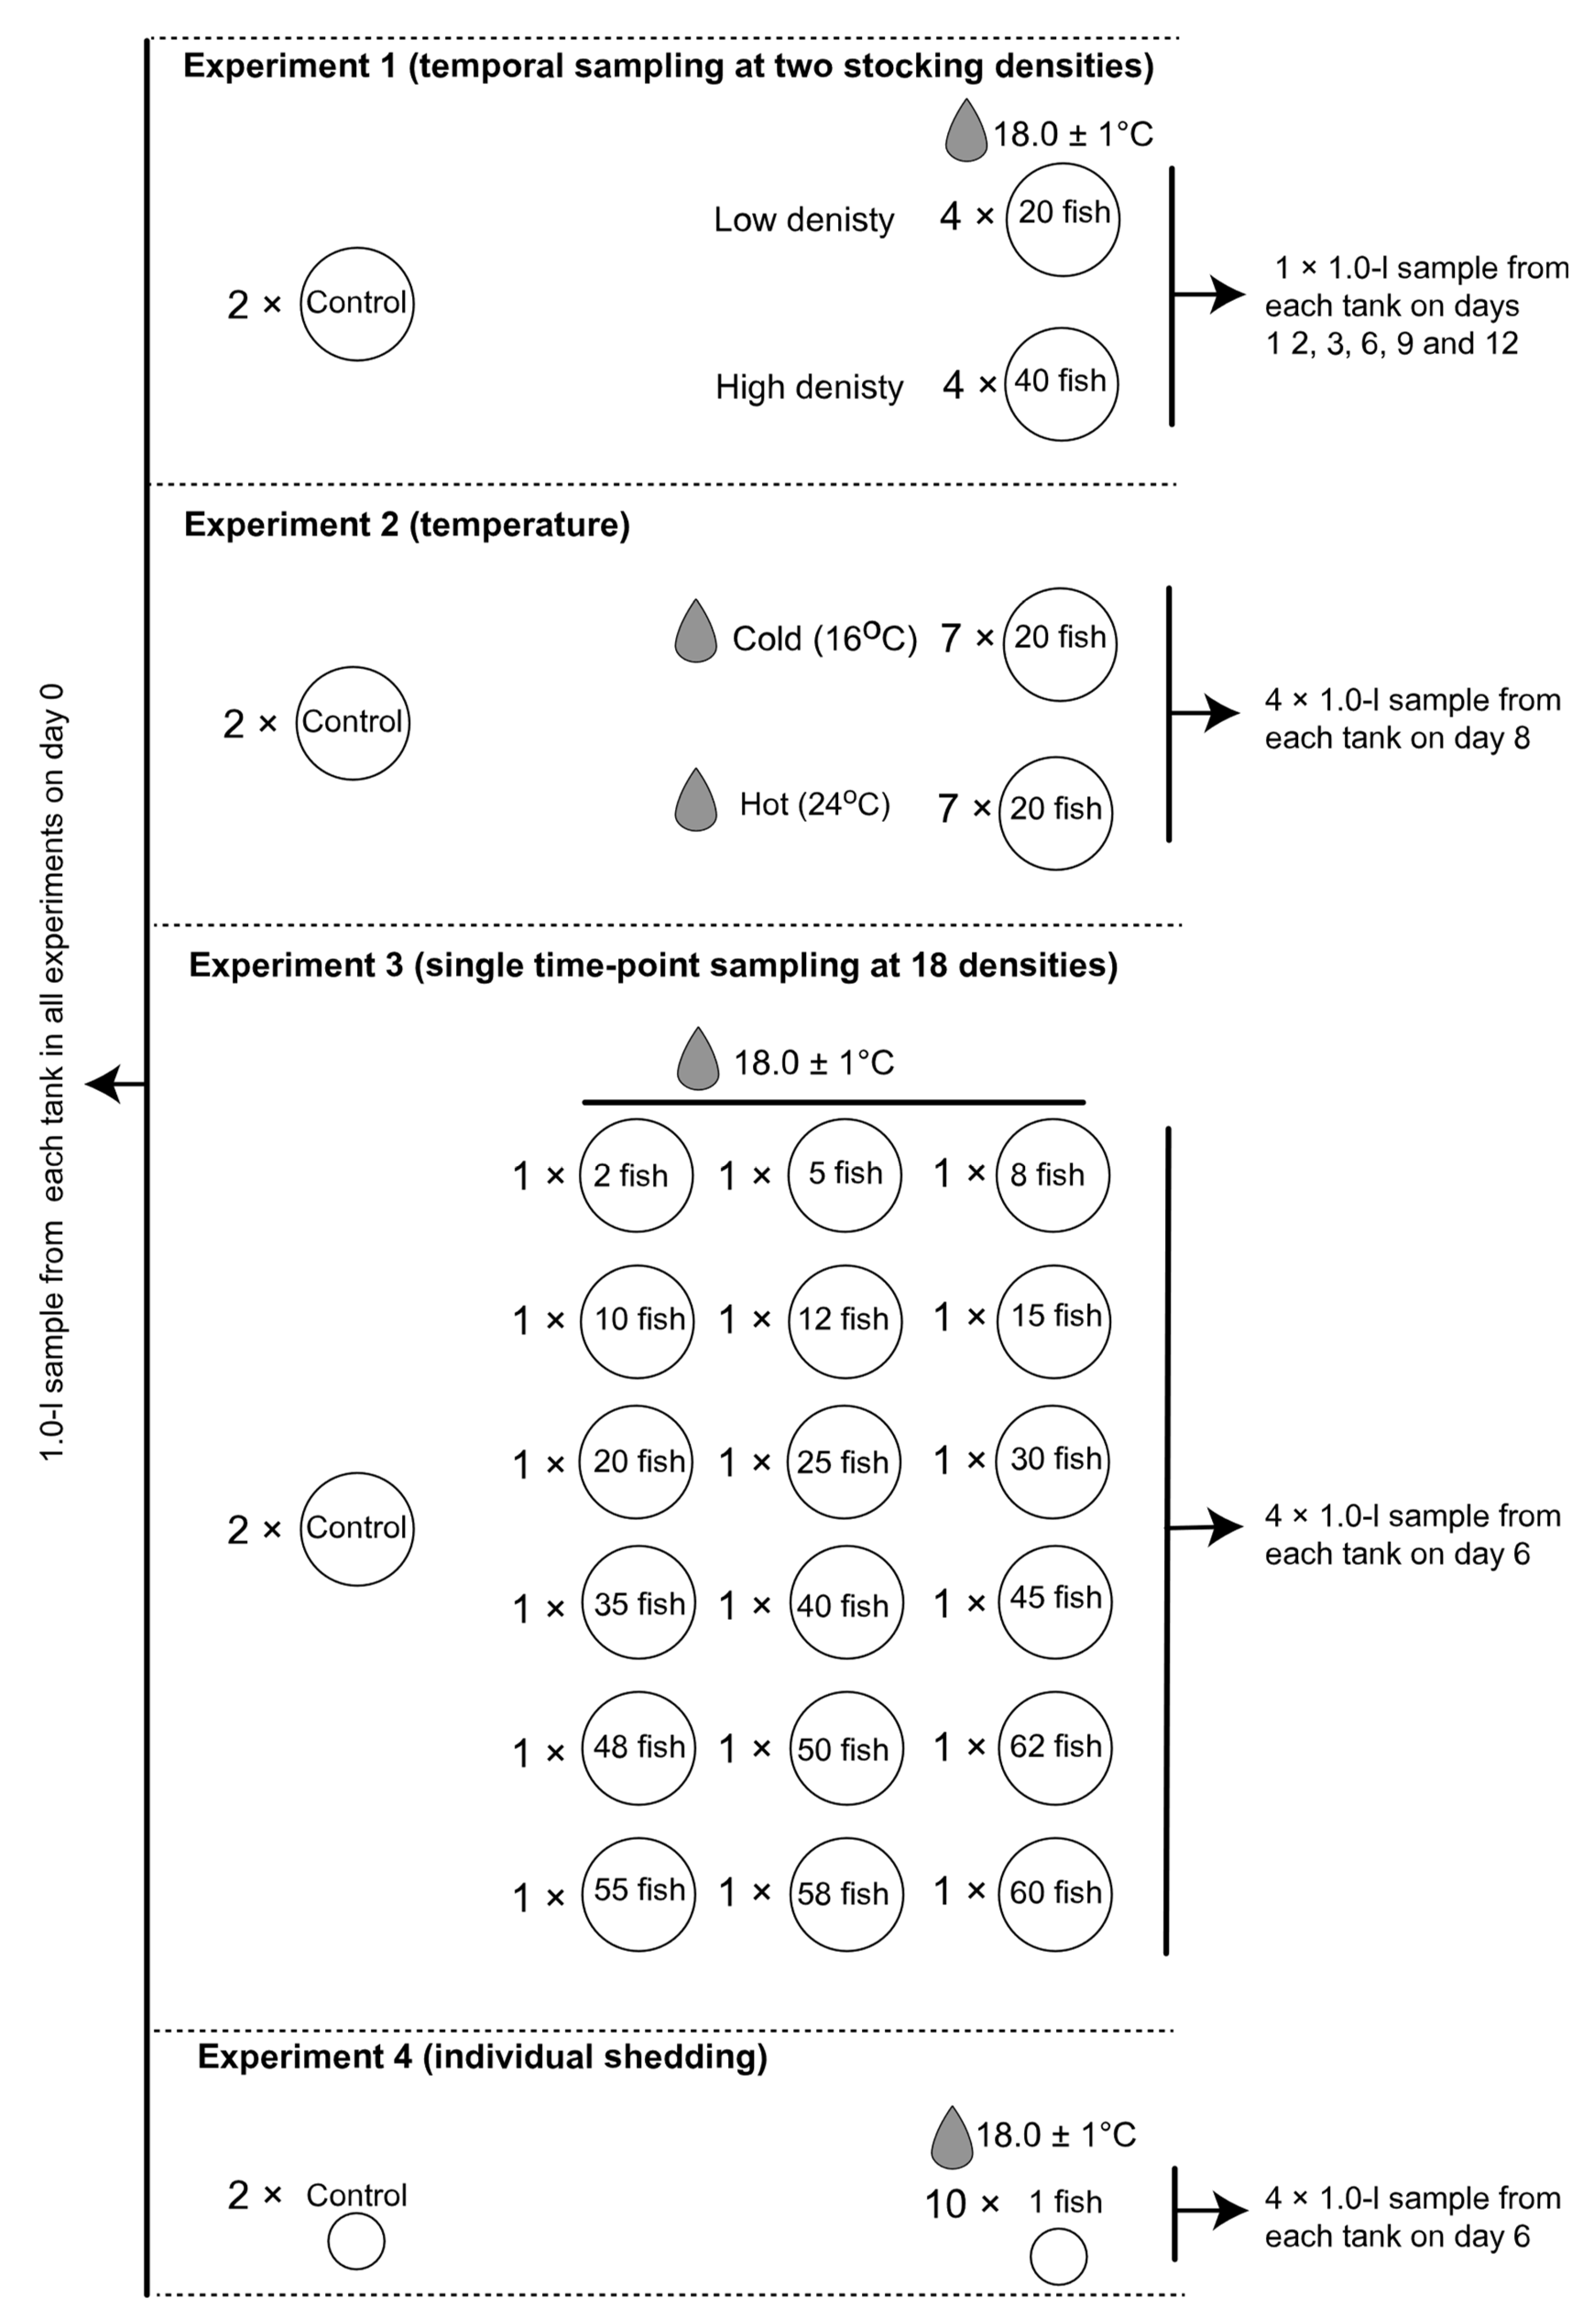
Figure 1. Schematic representation of the four experiments completed at the Port Stephens Fisheries Institute New South Wales, Australia during May to August 2021 to quantify relationships between mulloway, Argyrosomus japonicus eDNA concentrations and their weights across the range of their typical thermal tolerances and schooling densities. The replicate experimental tanks used for controls (left) and treatments (right) with stocking densities of mulloway and temporal water sampling for eDNA indicated.
Diversity 15 00322 g001
Figure 2. Relationship between eDNA concentration tank−1 and time of sampling assessed during experiment 1 completed at the Port Stephens Fisheries Institute, New South Wales, Australia during May, 2021. Data points reflect the raw data from high- and low-density tanks (open circles and squares), whereas solid and shaded lines indicate the generalised linear model fit and 95% confidence intervals, respectively, for the data irrespective of temperature.
Diversity 15 00322 g002
Figure 3. Relationship between log eDNA concentration tank−1 and log weight of mulloway, Argyrosomus japonicus assessed during experiment 3 completed at the Port Stephens Fisheries Institute, New South Wales, Australia during August, 2021. Open circles are the raw data, whereas the solid and dashed lines indicate the linear model fit and 95% confidence intervals, respectively.
Diversity 15 00322 g003
Figure 4. Mean (±SE) eDNA concentrations sampled from 10 identical 16-l tanks containing individual mulloway, Argyrosomus japonicus (with their weights displayed above each data point) during experiment 4 completed at the Port Stephens Fisheries Institute, New South Wales, Australia during August, 2021.
Diversity 15 00322 g004
Disclaimer/Publisher’s Note: The statements, opinions and data contained in all publications are solely those of the individual author(s) and contributor(s) and not of MDPI and/or the editor(s). MDPI and/or the editor(s) disclaim responsibility for any injury to people or property resulting from any ideas, methods, instructions or products referred to in the content.