1. Introduction
Current extinction rates are unprecedented in human history and greatly surpass the natural average background rates [
1]. The current rate of extinctions is a major environmental issue affecting populations across the globe [
1]. Identifying extinctions of species is crucial for tracking global biodiversity loss, but also for understanding loss of ecosystem services and the direct/indirect impacts that follow. Likewise, rediscovering missing species that are extant can lead to active conservation and recovery efforts for those species. However, extinctions are difficult to determine as they are rarely observed directly [
2] and can be incorrectly inferred through misinterpretation of negative evidence [
3]. The fact that one third of mammal species previously declared extinct have been rediscovered demonstrates the difficulty of correctly determining a species as truly extinct [
4]. Incorrectly labeling a species as extinct when it is extant is costly, causing loss of conservation effort, loss of public trust or scientific credibility, and wrongful accusations towards individuals/organizations [
5].
Studying endangered species is of the utmost importance but can be costly and require significant effort. The ability to rediscover missing mammals is influenced by search effort, area searched, and the time the species has been missing [
4]. The threats causing endangerment also influence the likelihood the animal will be rediscovered [
4]. Mammals missing due to habitat loss are the most likely to be rediscovered [
4]. This may be due to these species being pushed to their range’s edge thereby making them more likely to be rediscovered at the periphery [
6]. Therefore, in addition to thorough surveys for endangered species in their former range, edges of their suspected habitat also need thorough searches, requiring additional cost and effort.
Given the effort and cost associated with searching for missing mammals [
7], limited resources are not distributed evenly across missing mammals. Missing small mammal species receive less research money and effort compared to large, charismatic missing mammals [
7,
8]. Sitas et al. [
9] found that small mammals, including insectivores, South American marsupials, rodents, and bats, receive the least conservation effort. This disproportionately low effort is despite the fact that bats and rodents alone comprise approximately 60% of all mammals. Compounding the lack of conservation attention with the difficulty of correctly determining extinction with the costs and effort, it is extremely challenging to determine extinction for small, endangered mammals.
The IUCN defines a species as extinct when “the last individual has died or where systematic and time-appropriate surveys have been unable to log even a single individual” [
10]. Yet, Fisher and Blomberg [
4] found that in 187 species considered missing or extinct, 67 (39%) were eventually rediscovered. This rediscovery rate suggests that in some of the 67 species, analyses might have needed to conclude “present”, while attributing the observed lack of detections to false absences resulting from a low detection probability, possibly due to rareness or low density.
Collectively, kangaroo rats are regarded as keystone species and ecosystem engineers [
11,
12] with a strong influence on plant community structure [
11,
12]. The Morro Bay kangaroo rat (MBKR),
Dipodomys heermanni morroensis, is a small, nocturnal rodent that is suspected to be extinct. The subspecies is endemic to the Morro Bay area [
13] within San Luis Obispo County, California and was listed as an endangered subspecies pursuant to the U.S. Endangered Species Conservation Act in 1970 [
14] followed by the U.S. Endangered species act in 1973 [
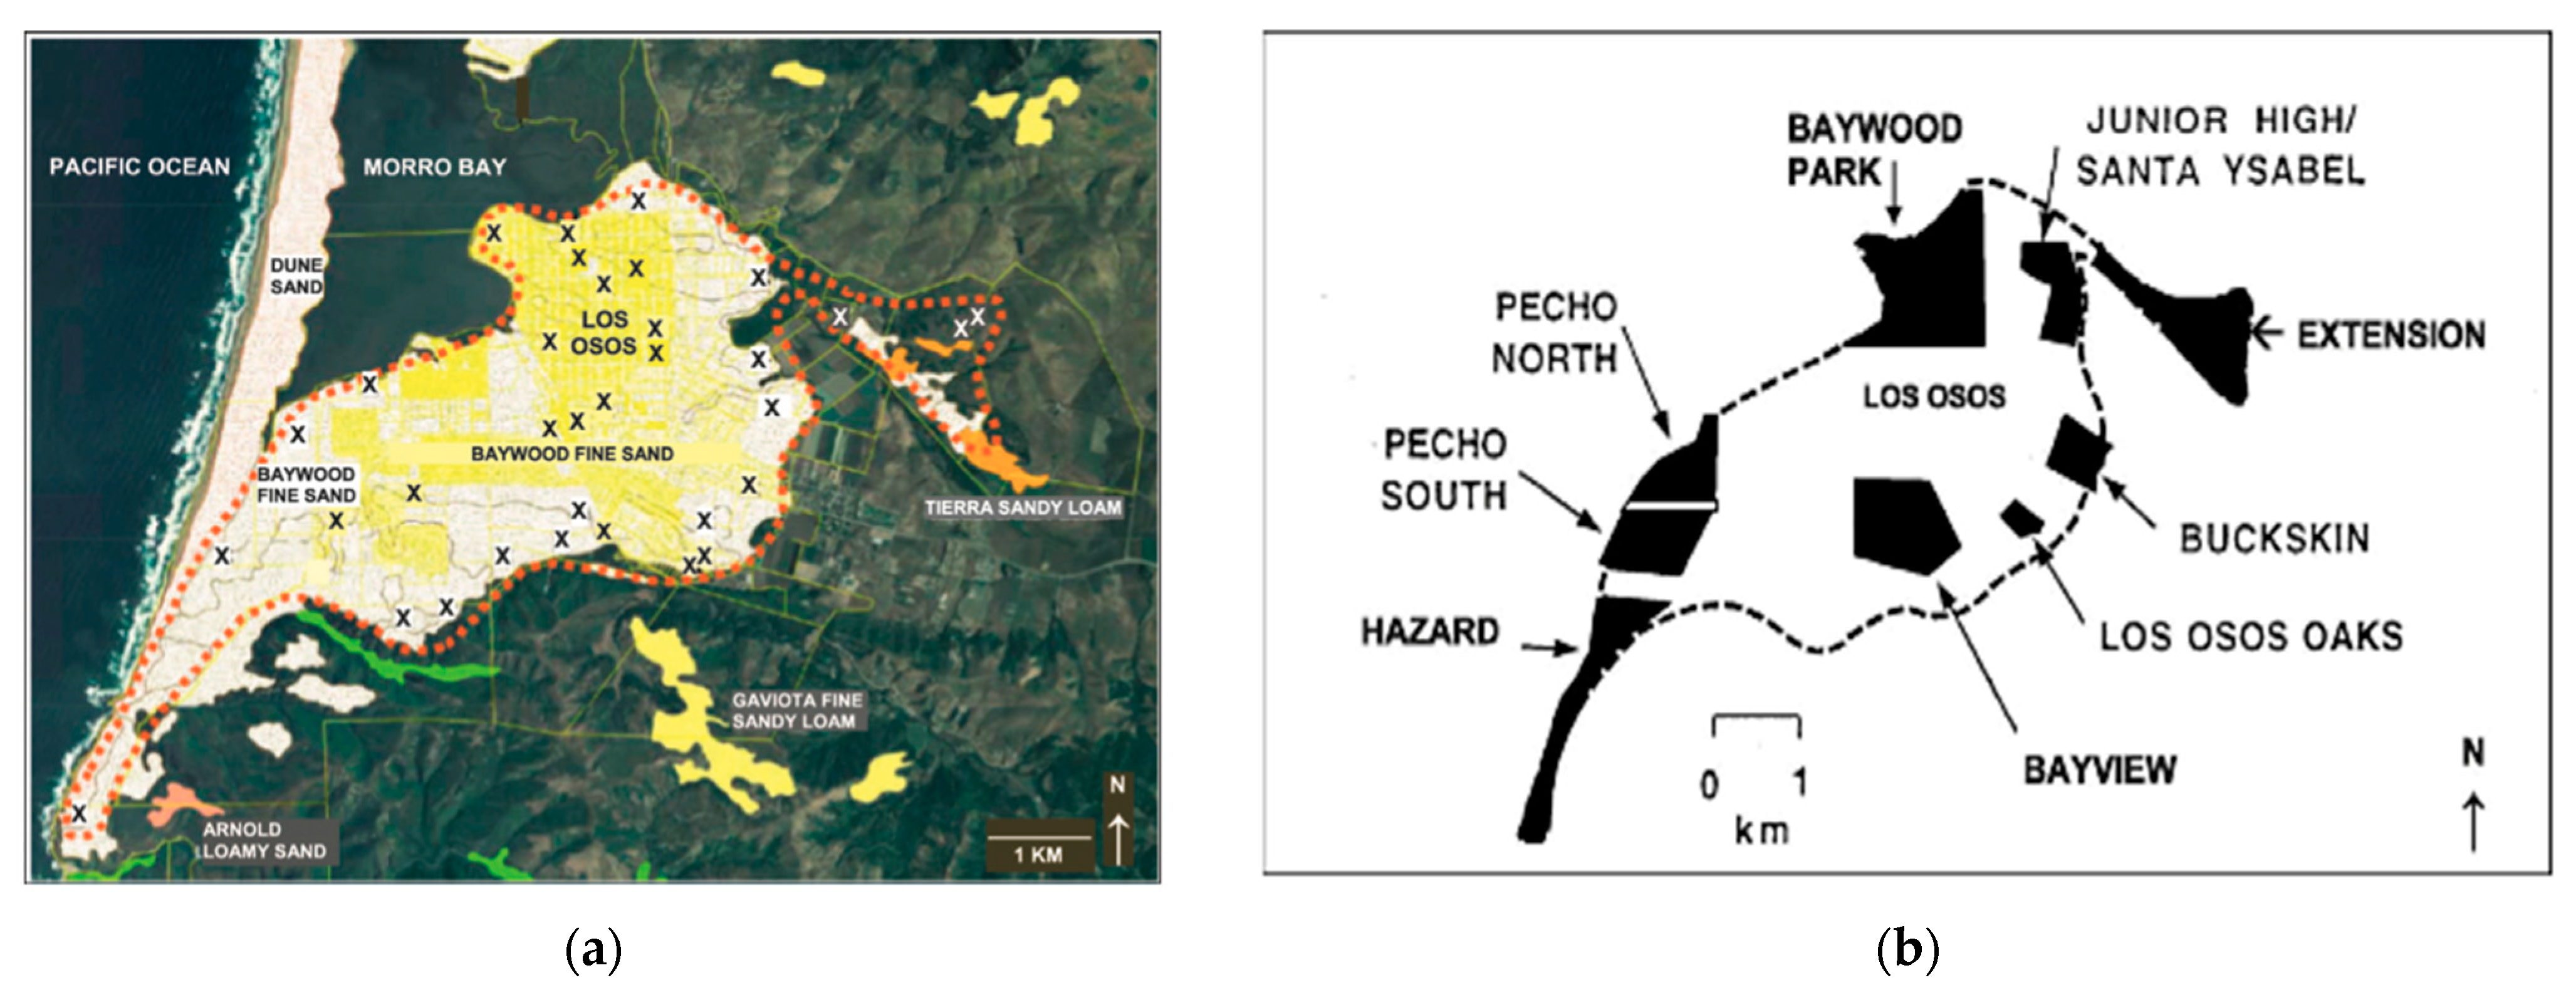
15]. Within the Morro Bay region (
Figure 1a), the historical geographical range of the MBKR is restricted to Los Osos, on old stabilized sand dune complex [
16]. The historic range amounts to approximately 12.4 km
2 and is composed principally of Baywood Fine Sand [
16,
17,
18]. Much of the MBKR’s historic range has been developed (
Figure 1a). The MBKR population has been studied since the 1950s [
16]. Across these studies, the MBKR’s geographical range has been divided into eight areas within Los Osos (
Figure 1b). Across these eight areas, there is variation in the estimated historical MBKR abundance and suspected last years of occupancy (literature and reports from the 1950s–2010 are summarized by Kofron & Villablanca [
16]). Collectively, these surveys have demonstrated a drastic population decline, with an estimated 8000 individuals in 1957, to just 50 individuals in 1986. Following this decline, no individual has been seen or captured in the wild since 1986 [
16]. A review by USFWS [
19] attributed the main cause of population decline to development and vegetation change (succession) due to fire suppression [
16]. As shown in
Figure 1a, the historical range of the MBKR has experienced significant development, causing a direct loss of habitat. Additionally, Heermann’s kangaroo rats are adapted to sparse vegetation and Kofron and Villablanca [
16] demonstrated that succession has occurred within the historical range. Fire suppression has allowed succession to continue without wildfire to revert areas back to early successional stages. This succession of vegetation negatively impacts kangaroo rat locomotion and the abundance of annual food plants, making it the second main cause of decline for the MBKR [
16].
Since 1986, numerous surveys have been conducted to try to detect the MBKR, including two range-wide surveys in 1995 and 2002, and a range-wide search from 2008 to 2012 [
16]. Combined, these three range-wide surveys totaled more than 5000 trap-nights (one trap-night equals one live trap out for one night). In addition, a survey of historically occupied areas was conducted with a wildlife scent-detecting dog and wildlife cameras [
3]. However, even with the negative survey results for the MBKR, it cannot be justifiably concluded that the MBKR is extinct, as lack of detection does not confirm absence [
3,
6,
8]. It would also be incorrect to conclude extinction, without a reasonable doubt that all individuals have died, given the species’ behavior, patchy remaining habitat, and human development and land ownership limiting access for surveys [
3]. Importantly, not all the sites that could support this taxon have been accessible to researchers. While the MBKR has not been seen since 1986 [
3], and, given the potential for a low detection probability of this small nocturnal rodent [
4], the survey presented herein aimed to provide additional survey data towards determining if the Morro Bay kangaroo rat is extant or extinct while emphasizing that survey results be coupled with an estimated detection probability.
Since no individuals of
Dipodomys heermanni morroensis have been seen (detected) since 1986, more recently developed methods to estimate detection probability [
21] are not applicable to this taxon. The Lompoc kangaroo rat (LKR),
Dipodomys heermanni arenae, is the closest geographically and genetically to the MBKR [
13,
22]. Its closest population is approximately 19 km south of the MBKR’s historic range [
16,
23]. Thus, the LKR subspecies is the best available proxy for informing detection probability of the MBKR subspecies. The LKR has populations available for surveys from which the probability of detection could be estimated. Therefore, herein, survey results obtained from the LKR were used to inform the detection probability for the MBKR.
For it to be appropriate to make a determination that the MBKR is extinct, all of the subspecies’ habitat must first be thoroughly searched. Given the development and plant succession in the delineated geographic range, the MBKR may have been pushed to the periphery of its previous habitat. Specifically, the Morro Bay sandspit, which can be seen in
Figure 1a, had not been considered as habitat for the MBKR. Yet, from studies of the LKR subspecies, we know that at least one member of the species can occupy sites comprised of soil classified as dune sand, and coastal subspecies occur on sandy substrate. Therefore, we hypothesize that the sandspit (also composed of dune sand) may in fact be habitat for the MBKR and needs to be assessed as part of the process by which extinction might be determined.
There is additional evidence that the Morro Bay sandspit could be suitable habitat for the MBKR. The original description of the MBKR was provided by Grinnell (1922), where the elevational distribution was described as extending from “sea level up to 250 feet”. Therefore, the sandspit fits Grinnell’s description. Furthermore, study of the LKR has demonstrated that the species inhabits the foredunes at the Oceano Dunes State Vehicle Recreation Area (ODSVRA) [
3]. European searocket,
Cakile maritima, is the predominant foredune plant both at Oceano Dunes and at the sandspit, and is used by the LKR at the Oceano Dunes, further suggesting that the sandspit may be habitat for kangaroo rats [
3]. Finally, the MBKR’s Critical Habitat [
20] includes the base of the sandspit, but it is unclear why only the base and not the entirety are considered since the habitat seems contiguous. With all this possible evidence, it seemed justifiable that the sandspit should be thoroughly surveyed for presence of the MBKR.
Occupancy models described by MacKenzie et al. [
21] allow researchers to estimate the probability of detecting a species, should it be present, through collection of presence/absence data. The model considers imperfect detection, meaning that non-detection does not necessarily equate with absence [
21]. When a species is not detected, there are two possibilities: (1) the species is absent, or (2) the species is present but undetected. As mentioned above, because no known populations of MBKR exist, occupancy models and detection probabilities could not be estimated. However, detection probability could be estimated for the LKR in similar habitat; therefore, this will serve as a proxy for MBKR detection probability.
The LKR has been studied extensively at ODSVRA in San Luis Obispo County, California. At this location, the species has an affinity for the silver beach lupine–mock heather plant alliance [
24]. The silver beach lupine–mock heather alliance is scrub. It is characterized by sparse, low-growing vegetation. It includes abundant open space between shrubs, which is filled seasonally with annuals. This vegetation is very similar to that on the sandspit. Therefore, we analyzed the individuals monitored in the scrub alliance at the ODSVRA to estimate the probability of detection to inform the probability of detection of MBKR at the Morro Bay sandspit.
At the ODSVRA, the LKR occupies the foredunes, which is the same habitat that occurs on the sandspit. Field observations in the foredunes where LKR is known to occur (confirmed through live trapping) demonstrated the high detection probability of visual signs (e.g., bipedal footprints, tail drag marks, burrow openings—see methods) in this vegetation type. The large amount of open sand with little vegetation cover allowed kangaroo rat signs to be easily detected. Therefore, based on this observation from the LKR, we prioritized the sandspit surveys in open areas with little or sparse vegetation to maximize the probability of detecting signs of MBKR.
2. Materials and Methods
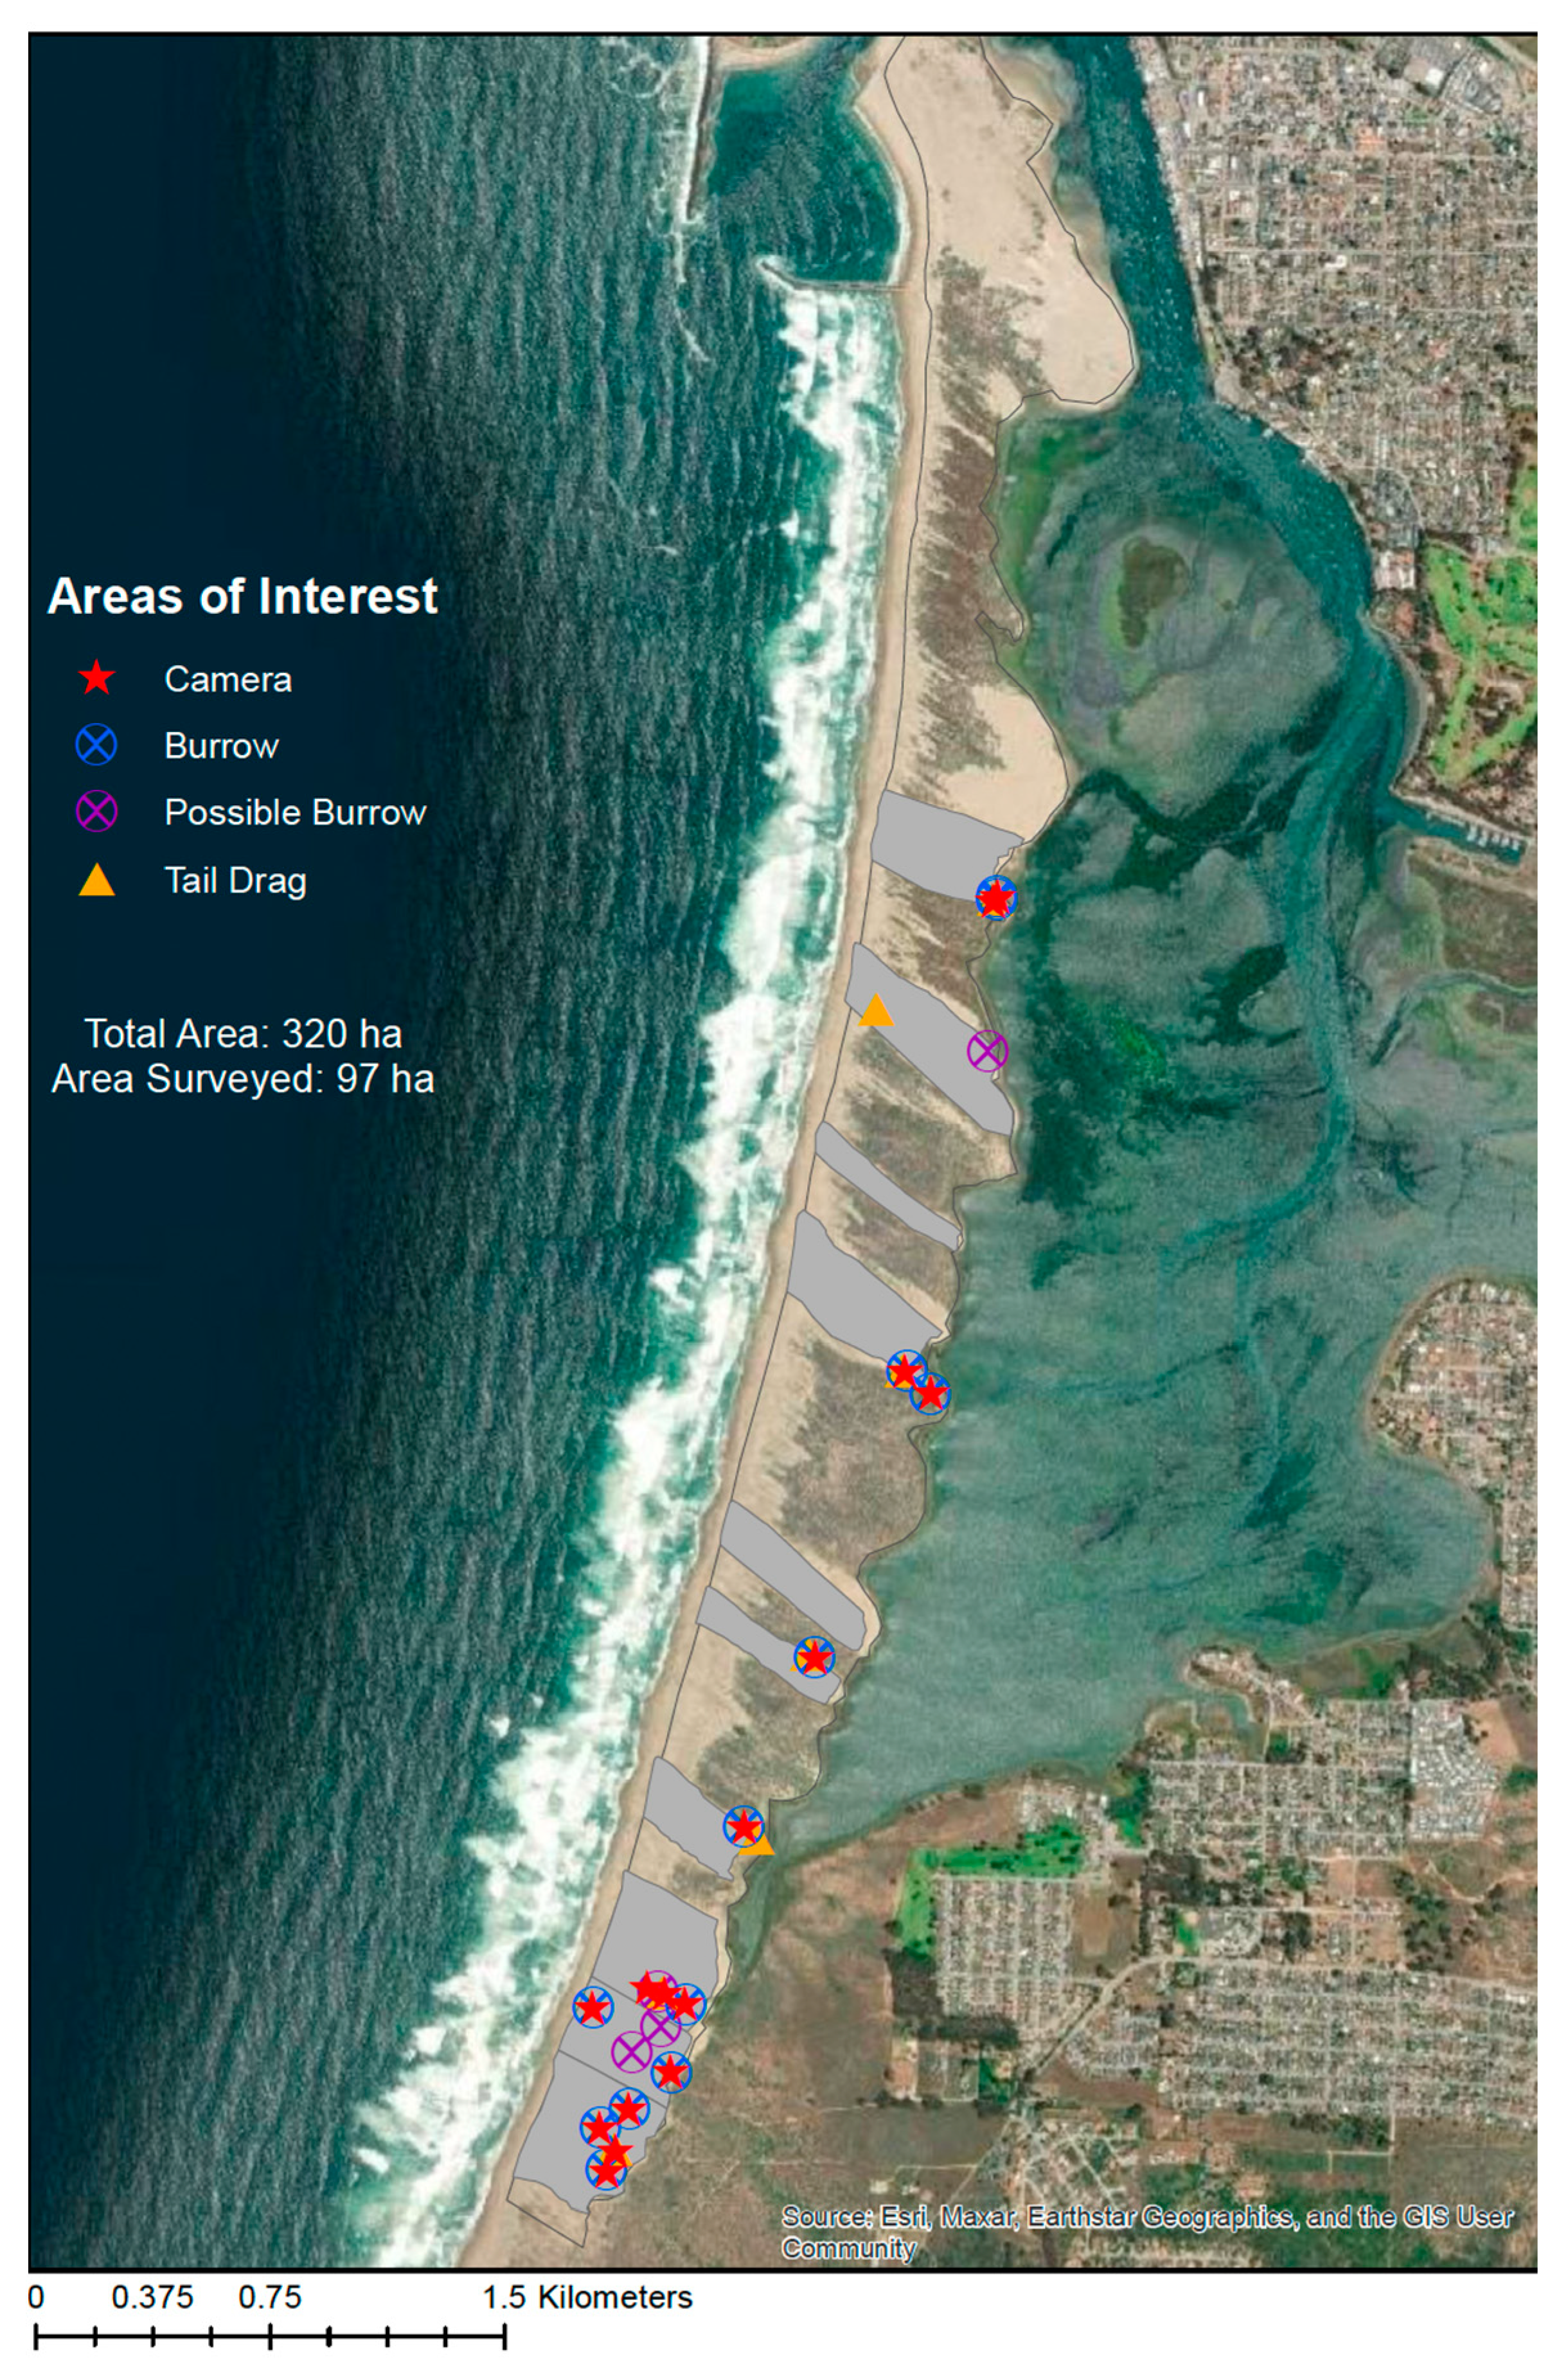
The survey of the Morro Bay sandspit was a collaborative effort between the California Department of Parks and Recreation (CDPR) and the California Polytechnic State University (CPSU). Surveys were carried out by personnel with experience in kangaroo rat field surveys. The total area of the sandspit, and the area to potentially be surveyed, was 320 ha, excluding land below the mean high tide line. The sandspit was surveyed visually through walking transects and wildlife cameras were installed at locations where possible MBKR signs had been visually detected. The survey method details are provided below.
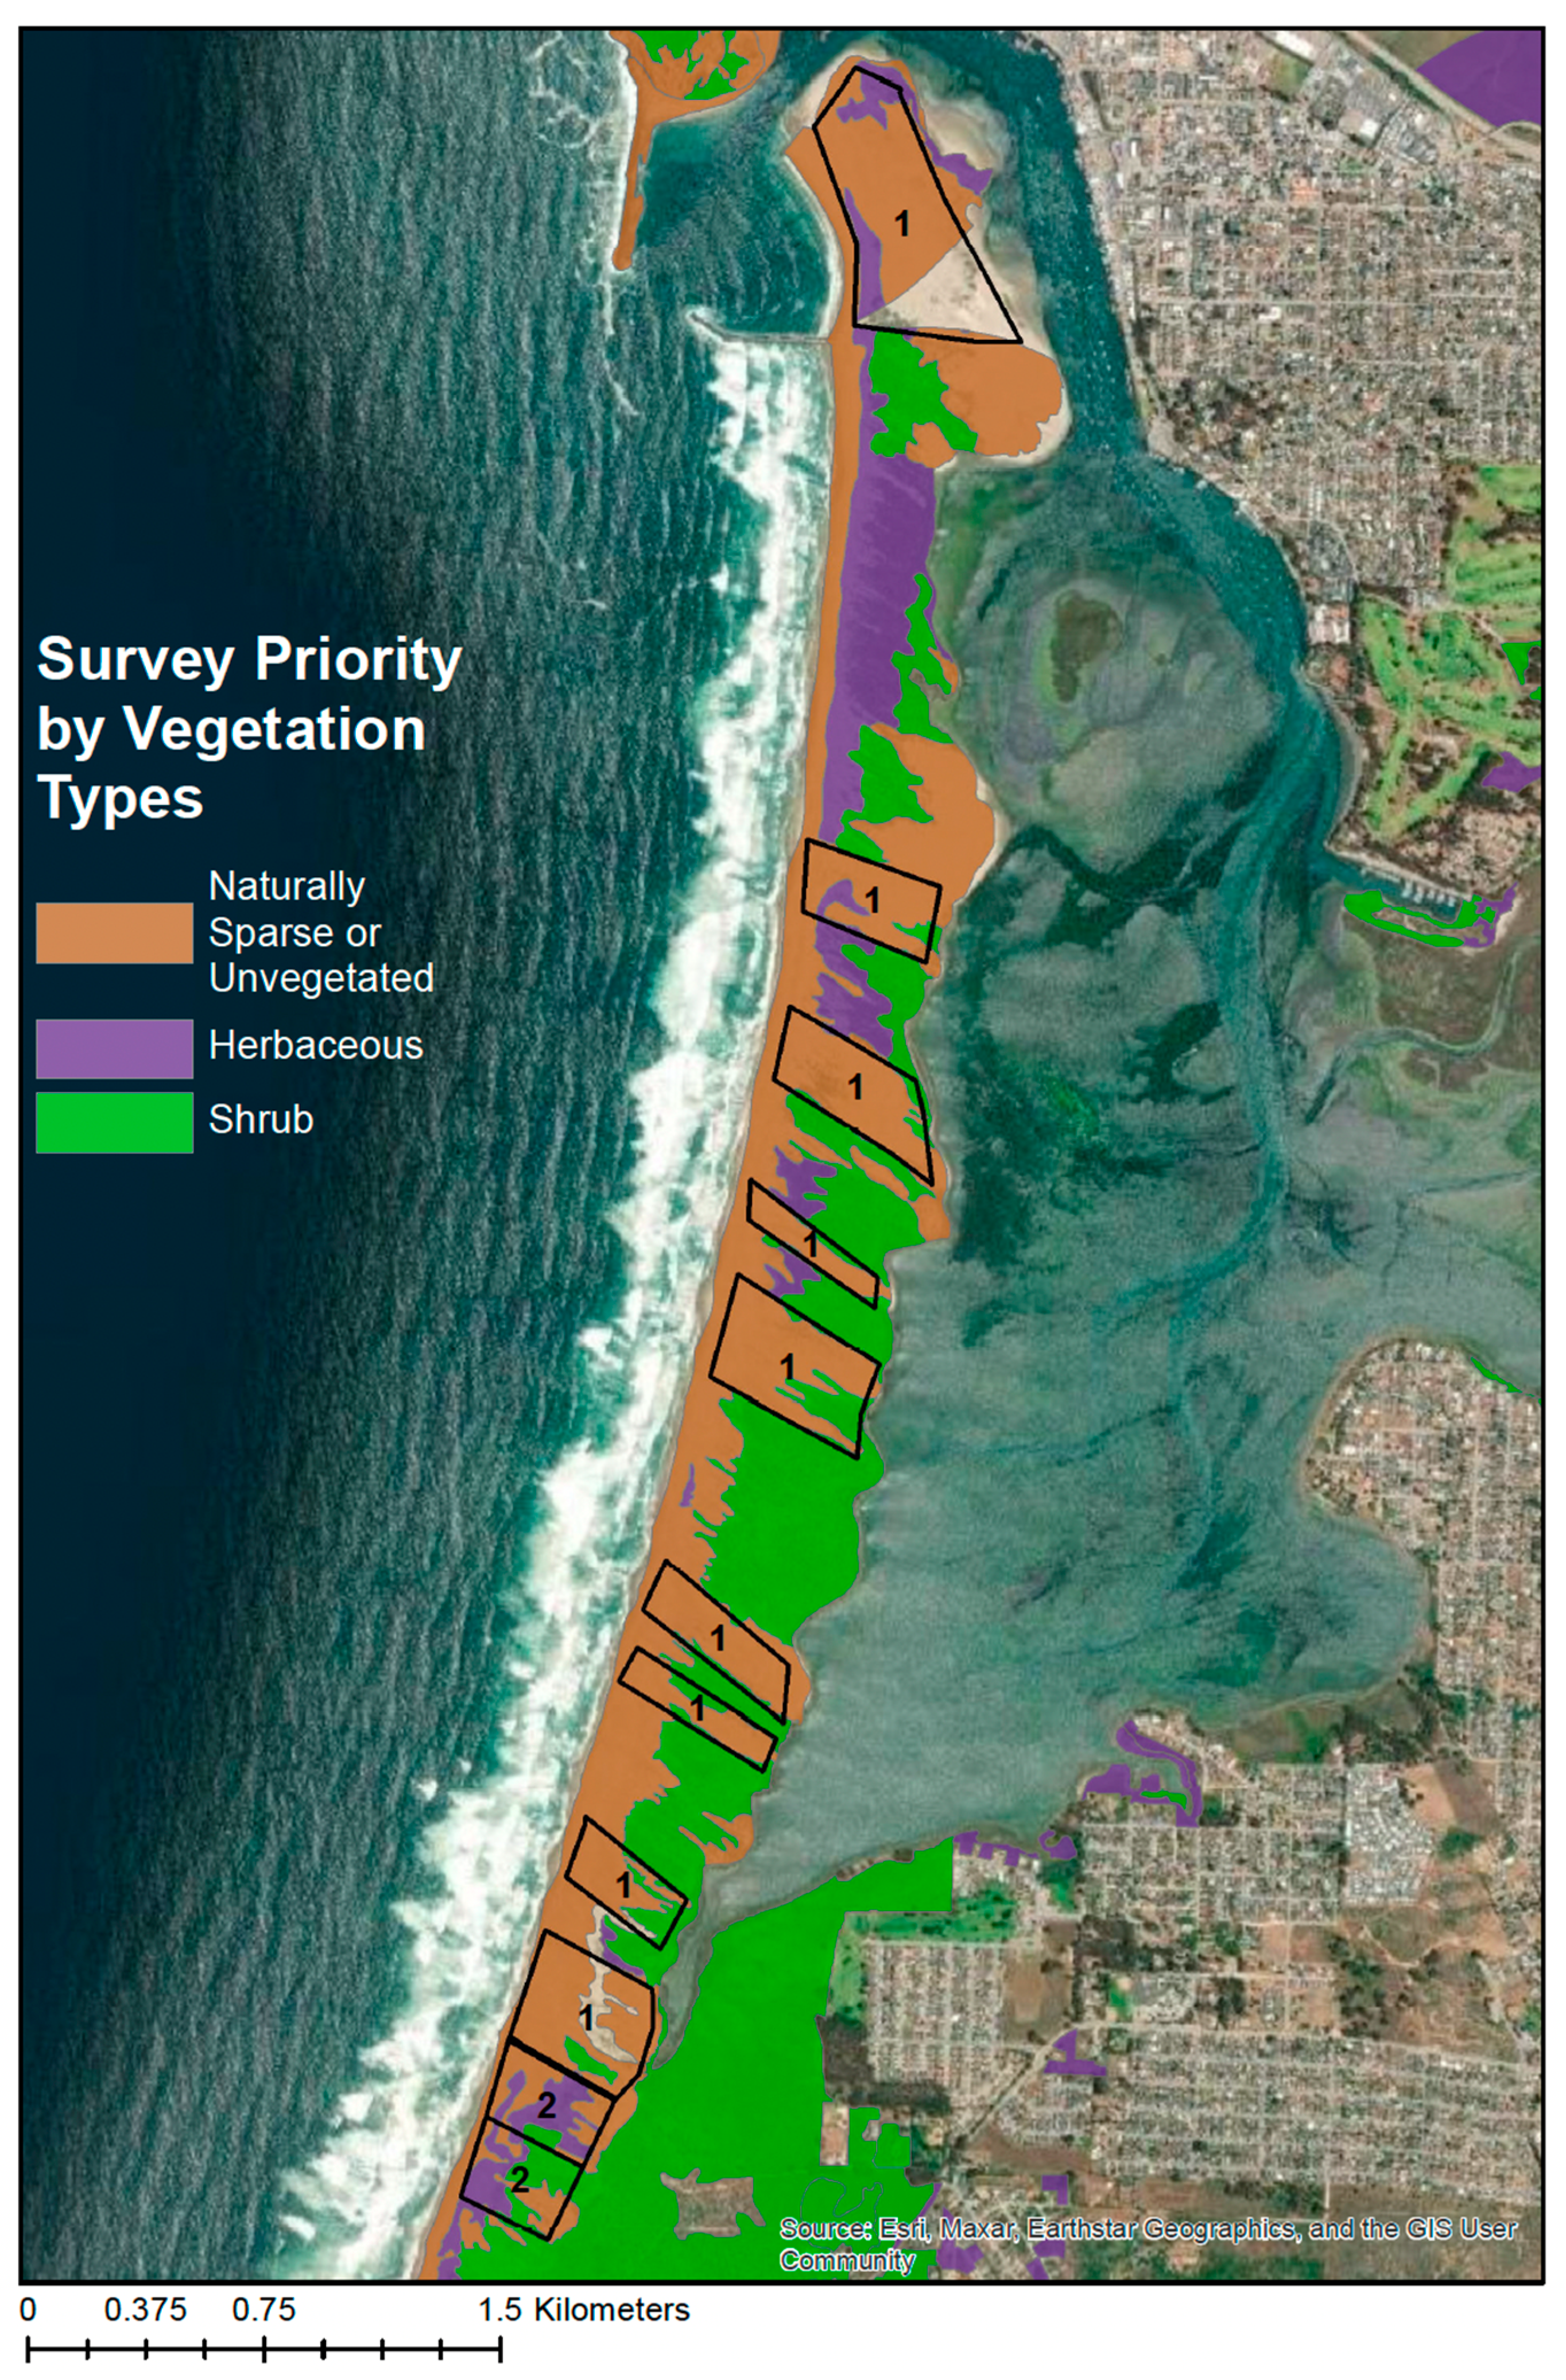
Visual surveys of the Morro Bay sandspit took place between October 2021 and March 2022. Sandspit vegetation was divided into three types: naturally sparsely vegetated/unvegetated, herbaceous, and shrub (
Figure 2). The best vegetation type for observing kangaroo rat signs was in naturally sparse or unvegetated areas similar to the foredunes of the ODSVRA. Open sand areas with sparse vegetation allow tracks and burrows to be easily seen. In dense herbaceous and shrub areas, signs are more difficult to locate, and burrows can be hidden under the vegetation layer. Due to the nature of the sandspit, specifically the active sand dunes and winds, naturally sparse or unvegetated areas exist across the sandspit and occur in patches that follow the northwest/southeast orientation of prevailing winds. Therefore, in order for surveys to be most likely to result in detecting signs, we prioritized surveys in naturally sparse or unvegetated areas (
Figure 2, areas labeled ‘1’).
Transects were walked in the southeast and northwest directions. Walking in these directions was the most efficient and followed the natural contours created by prevailing winds. The sun’s angle (October–March) was optimal for the detection of signs when looking towards the south. Therefore, each surveyor visually searched from their transect to their south side and to the next transect (surveyor), or if they were the southernmost transect, visually surveying no further than 4 m south of their transect.
To begin surveys, surveyors lined up on the eastern side of the sandspit. The surveyor farthest north collected data for “transect 1”, while the surveyor farthest south (assuming four surveyors) collected data for “transect 4”. Before beginning transects, initial GPS coordinates were recoded for each surveyor. Each surveyor also recorded the number of the polygon, (i.e., GPS coordinates for the northeastern corner of a polygon (
Figure 2) that the transect was located in). Percent cloud cover was also recorded. Surveyors then walked northwest at a matched pace. One surveyor ensured a correct transect path by maintaining a constant compass bearing. All transect paths were recorded by all surveyors using the CarryMap app. Once a transect was completed and the surveyor reached the western edge of the sandspit, final GPS coordinates were taken for each surveyor’s transect. To continue the same polygon, surveyors moved south 4 m past the farthest south transect and repeated the process moving east. If surveyors moved to a different area, the polygon (
Figure 2) ended and a new polygon, with its own transect numbers, began at the new area.
Distances between transects were a function of the vegetation density and were modified to allow for 100% visual coverage. In other words, for surveys in sparce or unvegetated areas, transects were spaced four meters apart, but if transects crossed multiple areas, such as unvegetated and herbaceous areas, the transect spacing was reduced to the largest distance possible for 100% visual coverage in the densest area the transect traversed. Due to vegetation and slope, some hill sides were not covered with a standardized transect distance. On steep slopes, one surveyor walked the top ridge and looked down, while another surveyor walked the bottom of the slope looking up. If the distance between observers became too great, then an additional surveyor traversed at mid slope.
Metadata was collected on all transects in order to assess the tracking conditions. Each time a small mammal, bird, or insect trail was crossed it was counted. Likewise, non-kangaroo rat burrows were also counted. This was done to confirm that signs were available to be seen under the existing conditions, and that if kangaroo rats were present, their signs would have been visible as well. If no tracks of small mammals, birds, or insects had been seen, and only undisturbed sand had been present, that would have been recorded. But this never occurred (see Results in
Section 3).
If possible MBKR signs were detected, surveyors collected additional data at each location, including the type of sign and the number of times (places) it was observed, the GPS coordinates at the geographic center of sign, and the transect and polygon number. Once the transect was complete, if possible MBKR signs had been detected, the amount and type of signs were evaluated to determine if a camera should be deployed (see camera deployment below).
CarrpMap was used by surveyors on their mobile devices (accuracy ~3 m). The app provided redundancy to the GPS coordinates of each transect and provided data on the transect paths. The app was unable to work for all surveyors under all occasions. However, in every case, at least one surveyor was able to use CarryMap. Therefore, the transect locations were sufficiently accurate to graphically represent the areas surveyed by the transects.
The sand substrate of the sandspit was optimal for the detection of signs. Surveys were only carried out on days with low wind and were always preceded by low wind days. The following signs were regarded as possible evidence of MBKR: bipedal hind footprints or tracks, tail drags, pit caches (tablespoon size imprints where kangaroo rats temporarily store seeds and then leave empty and exposed), sand-bathing spots, top-hole burrow escapes, possible burrows, burrows, and burrows with runways). Burrows met two criteria, shape of the burrow (inverted ‘U’), and size of the burrow (approximately 6.5 cm wide at base and 8 cm tall). Burrows with runway also met a third criterion: flat trail or runway into the burrow, with a fan shape of trampled sand extending out from the burrow entrance. If a burrow demonstrated one of the three criteria (e.g., correct size but not shape and lacking a flat runway), it was labeled as a possible burrow.
If a possible burrow, burrow, or burrow with runways was detected, it was further classified as a burrow without sign or a burrow with sign. If no tail drags or bipedal prints were seen near the entrance, it was labeled a burrow without sign. If tail drags or possible kangaroo rat prints were seen near the entrance, it was labeled a burrow with sign.
Probable MBKR signs warranted camera deployment. For tracks, tail drags, seed pit cache, sand-bathing spots, possible burrows, and top-hole escapes, at least two types of signs (in any combination) were required for deployment. For burrows or burrows with runway detection, a camera was installed even if additional signs were not detected. The camera location was determined by visibility from trails and best proximity to the sign observed.
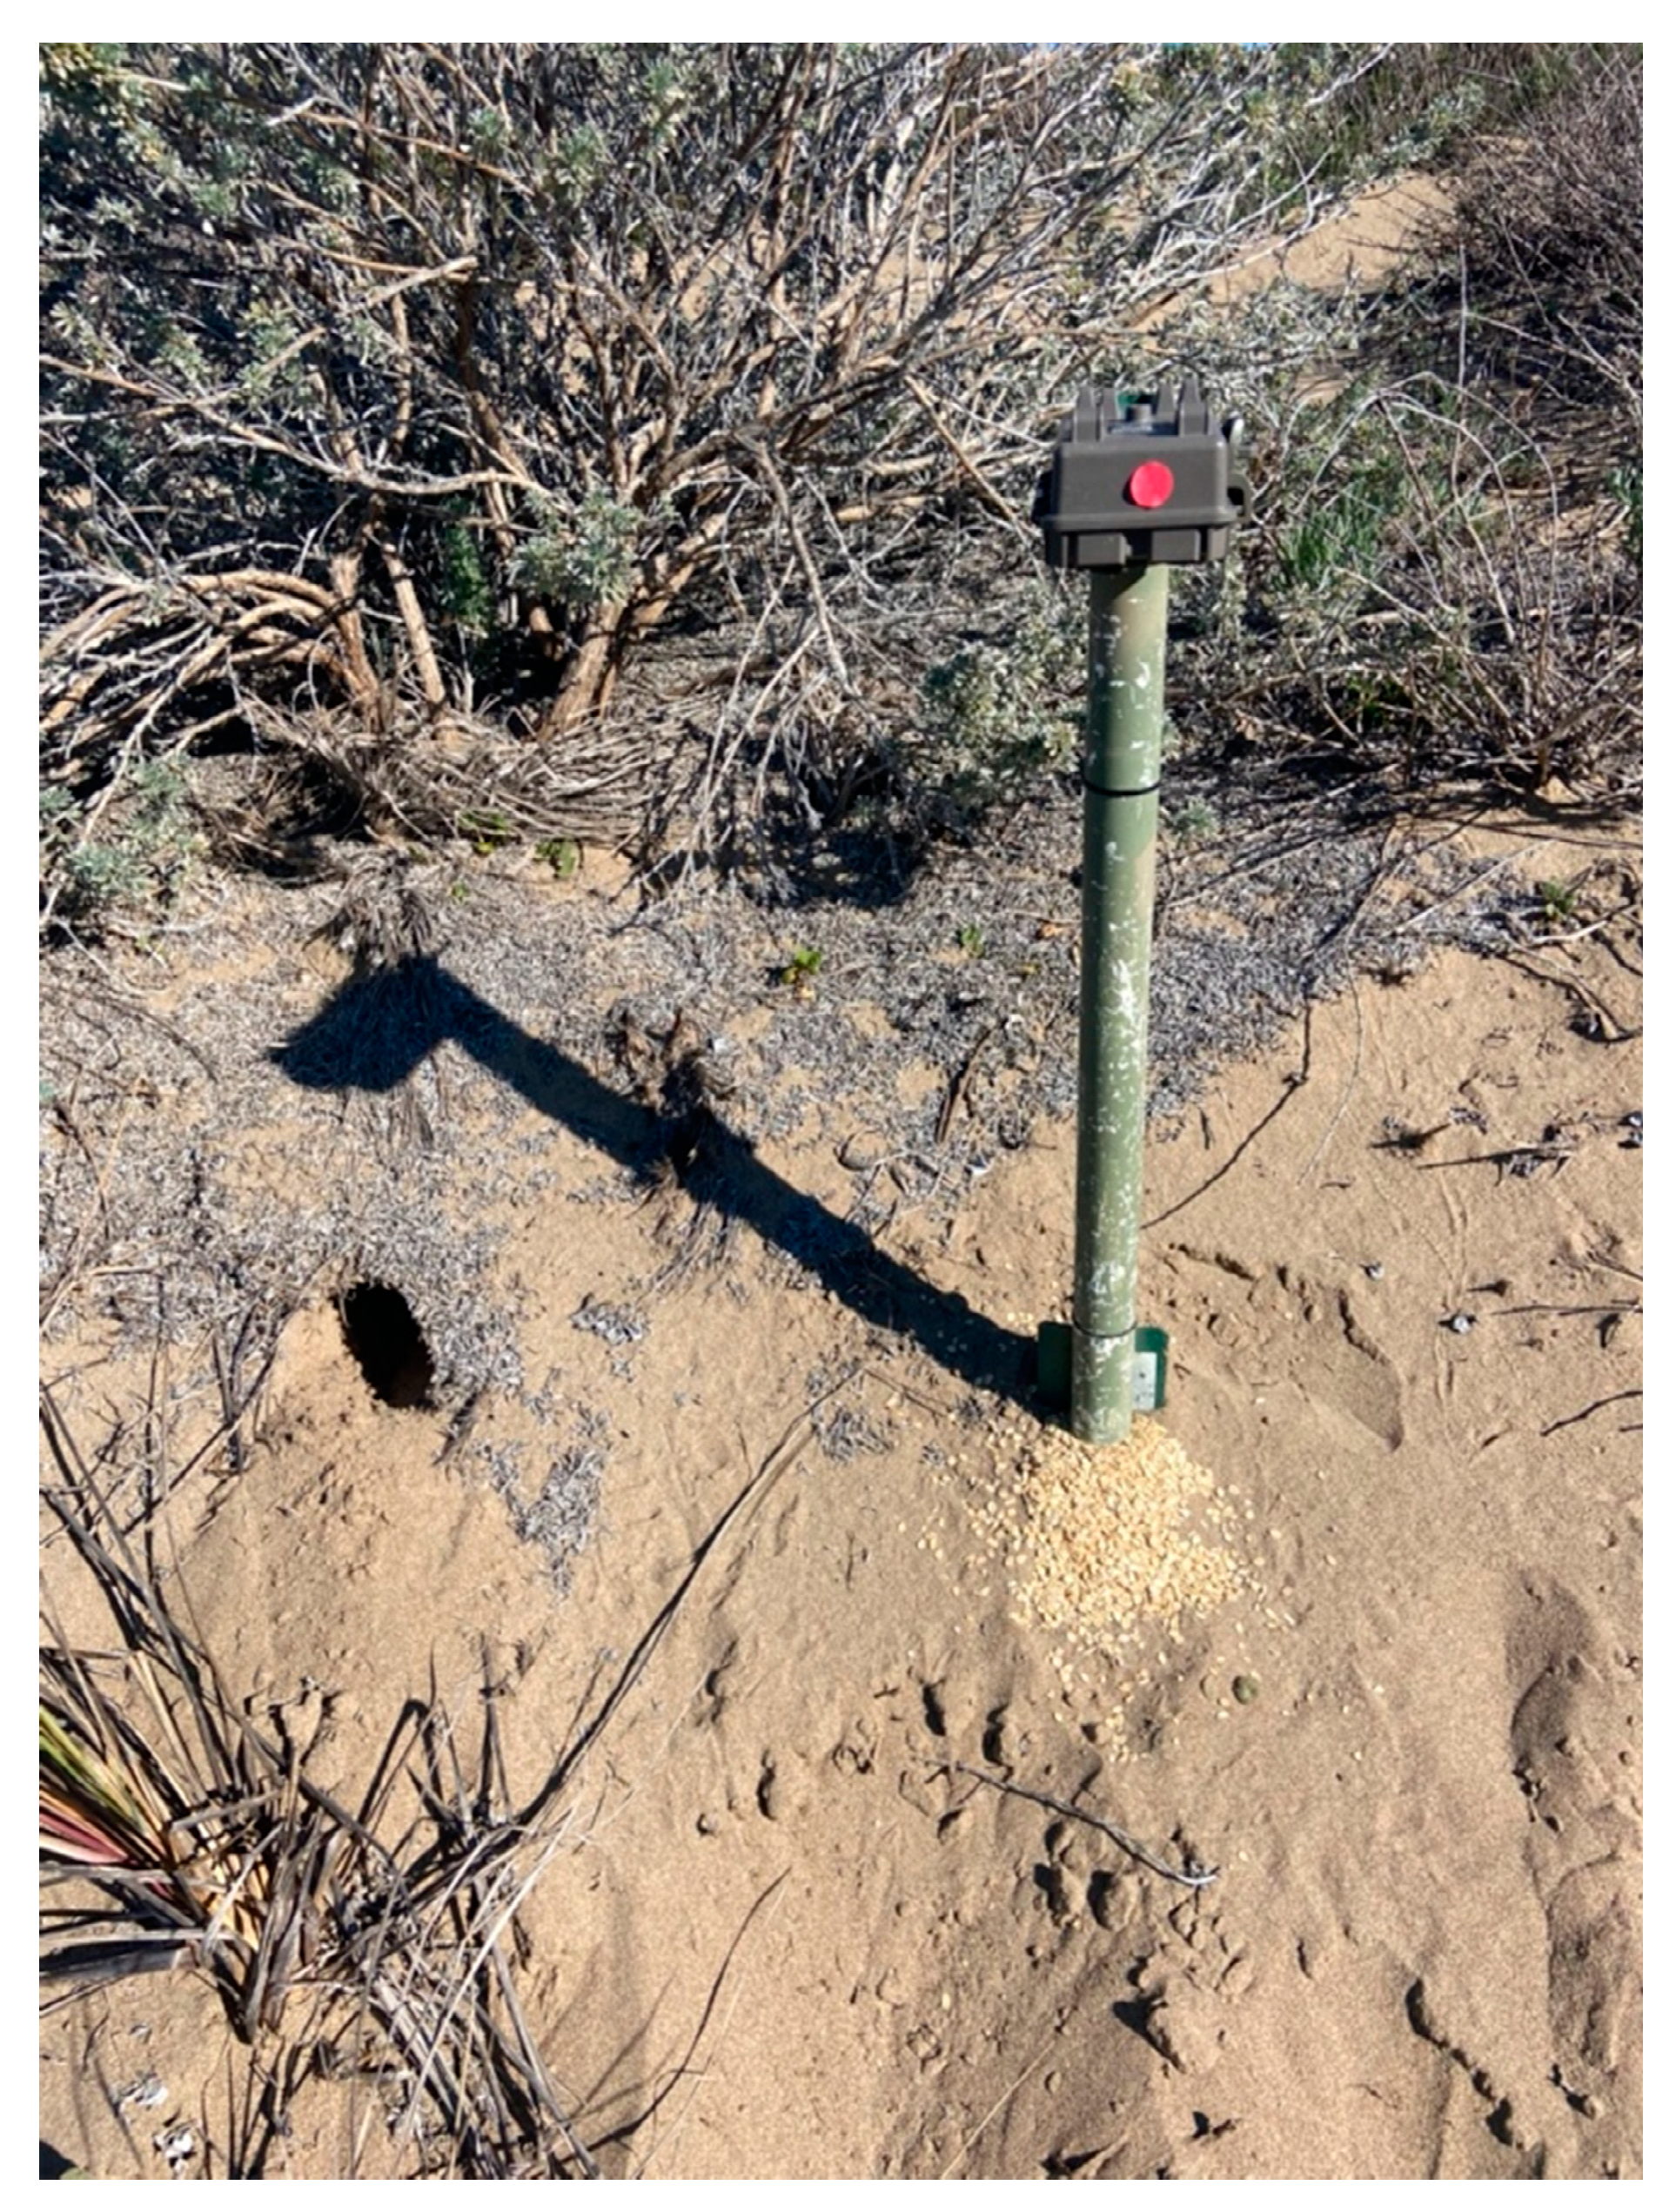
Bushnell Trophy Cam HD Essential E3 cameras were set to capture three images per event, with a one-minute delay between events. Camera traps were mounted, camera lens facing down, to a 3-foot metal U post so that the view was of the animal’s dorsal surface (
Figure 3). Each U post had a PVC pipe attached to it a few inches below the camera. The bottom of the PVC pipe was set ~1 inch from the ground, allowing the bait to flow down via gravity to replace bait that was consumed. Traps were baited with packaged rolled oats.
Cameras were deployed for a minimum of three nights. Most cameras were deployed longer (dependent on personnel availability and weather conditions). GPS coordinates, date, transect number, polygon number, and camera number were recorded for each camera. Cameras were deployed within 3 to 12 days following the transect survey.
Camera deployments were repeated in summer 2022 at the same locations that were sampled between October 2021 and March 2022, to replicate the camera survey. Unfortunately, one camera could not be redeployed in summer 2022 due to its proximity to a Western Snowy Plover nest site (
Charadrius alexandrinus nivosus, a federally listed species). All camera images were examined by J.H. to determine if any MBKR had been captured. In addition, the camera images captured during the summer survey were also processed through an artificial intelligence (AI) supervised machine learning (SML) model [
25] trained on images of the LKR.
To inform our camera surveys, data was collected on the LKR at ODSVRA to estimate the probability of detection [
21] for MBKR when using wildlife camera traps. Data from LKR was collected using the same equipment as at the sandspit. The LKR cameras were deployed in 2021 across four seasons (spring, summer, fall, and winter), and across five plots (Hopkins et al.
in prep). Three plots contained equal parts of the ODSVRA’s two dominant plant alliances (half willow and half scrub), and two plots were comprised only of scrub vegetation. All plots were sampled using a standardized grid with eight stations at 40-m intervals. The scrub vegetation at ODSVRA is most similar to the vegetation found on the sand spit. Therefore, only cameras from stations in scrub vegetation (
n = 28) were used for the analysis herein. Spring camera trapping occurred between 23 March 2021 and 8 May 2021. Summer trapping occurred between 12 June 2021 and 2 July 2021. Fall trapping occurred between 20 September 2021 and 29 September 2021. Winter trapping occurred between 10 December 2021 and 29 December 2021.
At the ODSVRA one camera was deployed at each station for three nights and presence/absence data was collected. To process these camera trap images and obtain each station’s nightly detection history, an artificial intelligence (AI) supervised machine learning (SML) model was developed and used [
25]. The model drastically reduced the effort needed to process the camera trap images. Hopkins et al. [
25] utilized YoloV5, an object detection model, to discriminate between the six small mammal species commonly detected at the ODSVRA and to recognize LKR. YoloV5 was selected for species identification and localization due to Yolo’s state-of-the-art accuracy and speed in object detection [
26]. Six species of rodents were captured through camera images and the model was trained to correctly identify each species: Lompoc kangaroo rat (
Dipodomys heermanni arenae), California mouse (
Peromyscus californicus), deer mouse (
Peromyscus maniculatus), Monterey big-eared woodrat (
Neotoma macrotis), California vole (
Microtus californicus), and California spiny pocket mouse (
Chaetodipus californicus).
The “unmarked” package [
27] in R [
28] was used to determine the detection probability per night for the LKR. The function “occu” was used to fit the single season occupancy model of MacKenzie et al. [
21]. The probability of detection was modeled as a function of one observer covariate: season (fall, winter, spring, summer). Since this analysis was focused on the detection probability and not the occupancy rate, no site covariates were tested with occupancy. Package “AICcmodavg” [
29] was used to compute the MacKenzie and Bailey [
30] goodness-of-fit test for single-season occupancy models based on Pearson’s chi-square through 1000 simulations on the model with season as a covariate. The two models were ranked with the obtained c-hat score from the goodness-of-fit test to ensure the models were a good fit to the data. Model ranking was performed using the “MuMln” package, where both models were ranked using the Akaike Information Criterion for over-dispersed data adjusted for small sample size (QAICc) with the c-hat score taken into account [
31]. Since both LKR models had a ΔQAICc ≤ 2.0, they were both considered competitive (see Results in
Section 3), and we used model-averaging from “AICcmodavg” to calculate detection probability [
29].
Once the detection probability was obtained, we estimated the probability of not detecting the MBKR if it was present at a station for the winter and the summer camera deployments [
32]. This was performed by multiplying the probability of being missed (1-detection probability) each night by the total number of nights. We used the minimum number of nights (3) that cameras were deployed and matched the surveys of the LKR (three-night deployments). Since detection varied by season and our initial deployment was across three seasons, we averaged the nightly detection probability across fall, winter, and spring for the first deployment’s calculation, and used the summer detection probability for the second deployment’s calculation. The probability of being missed from the first and the second deployment were multiplied to achieve the joint probability the MBKR was missed from both deployments combined.
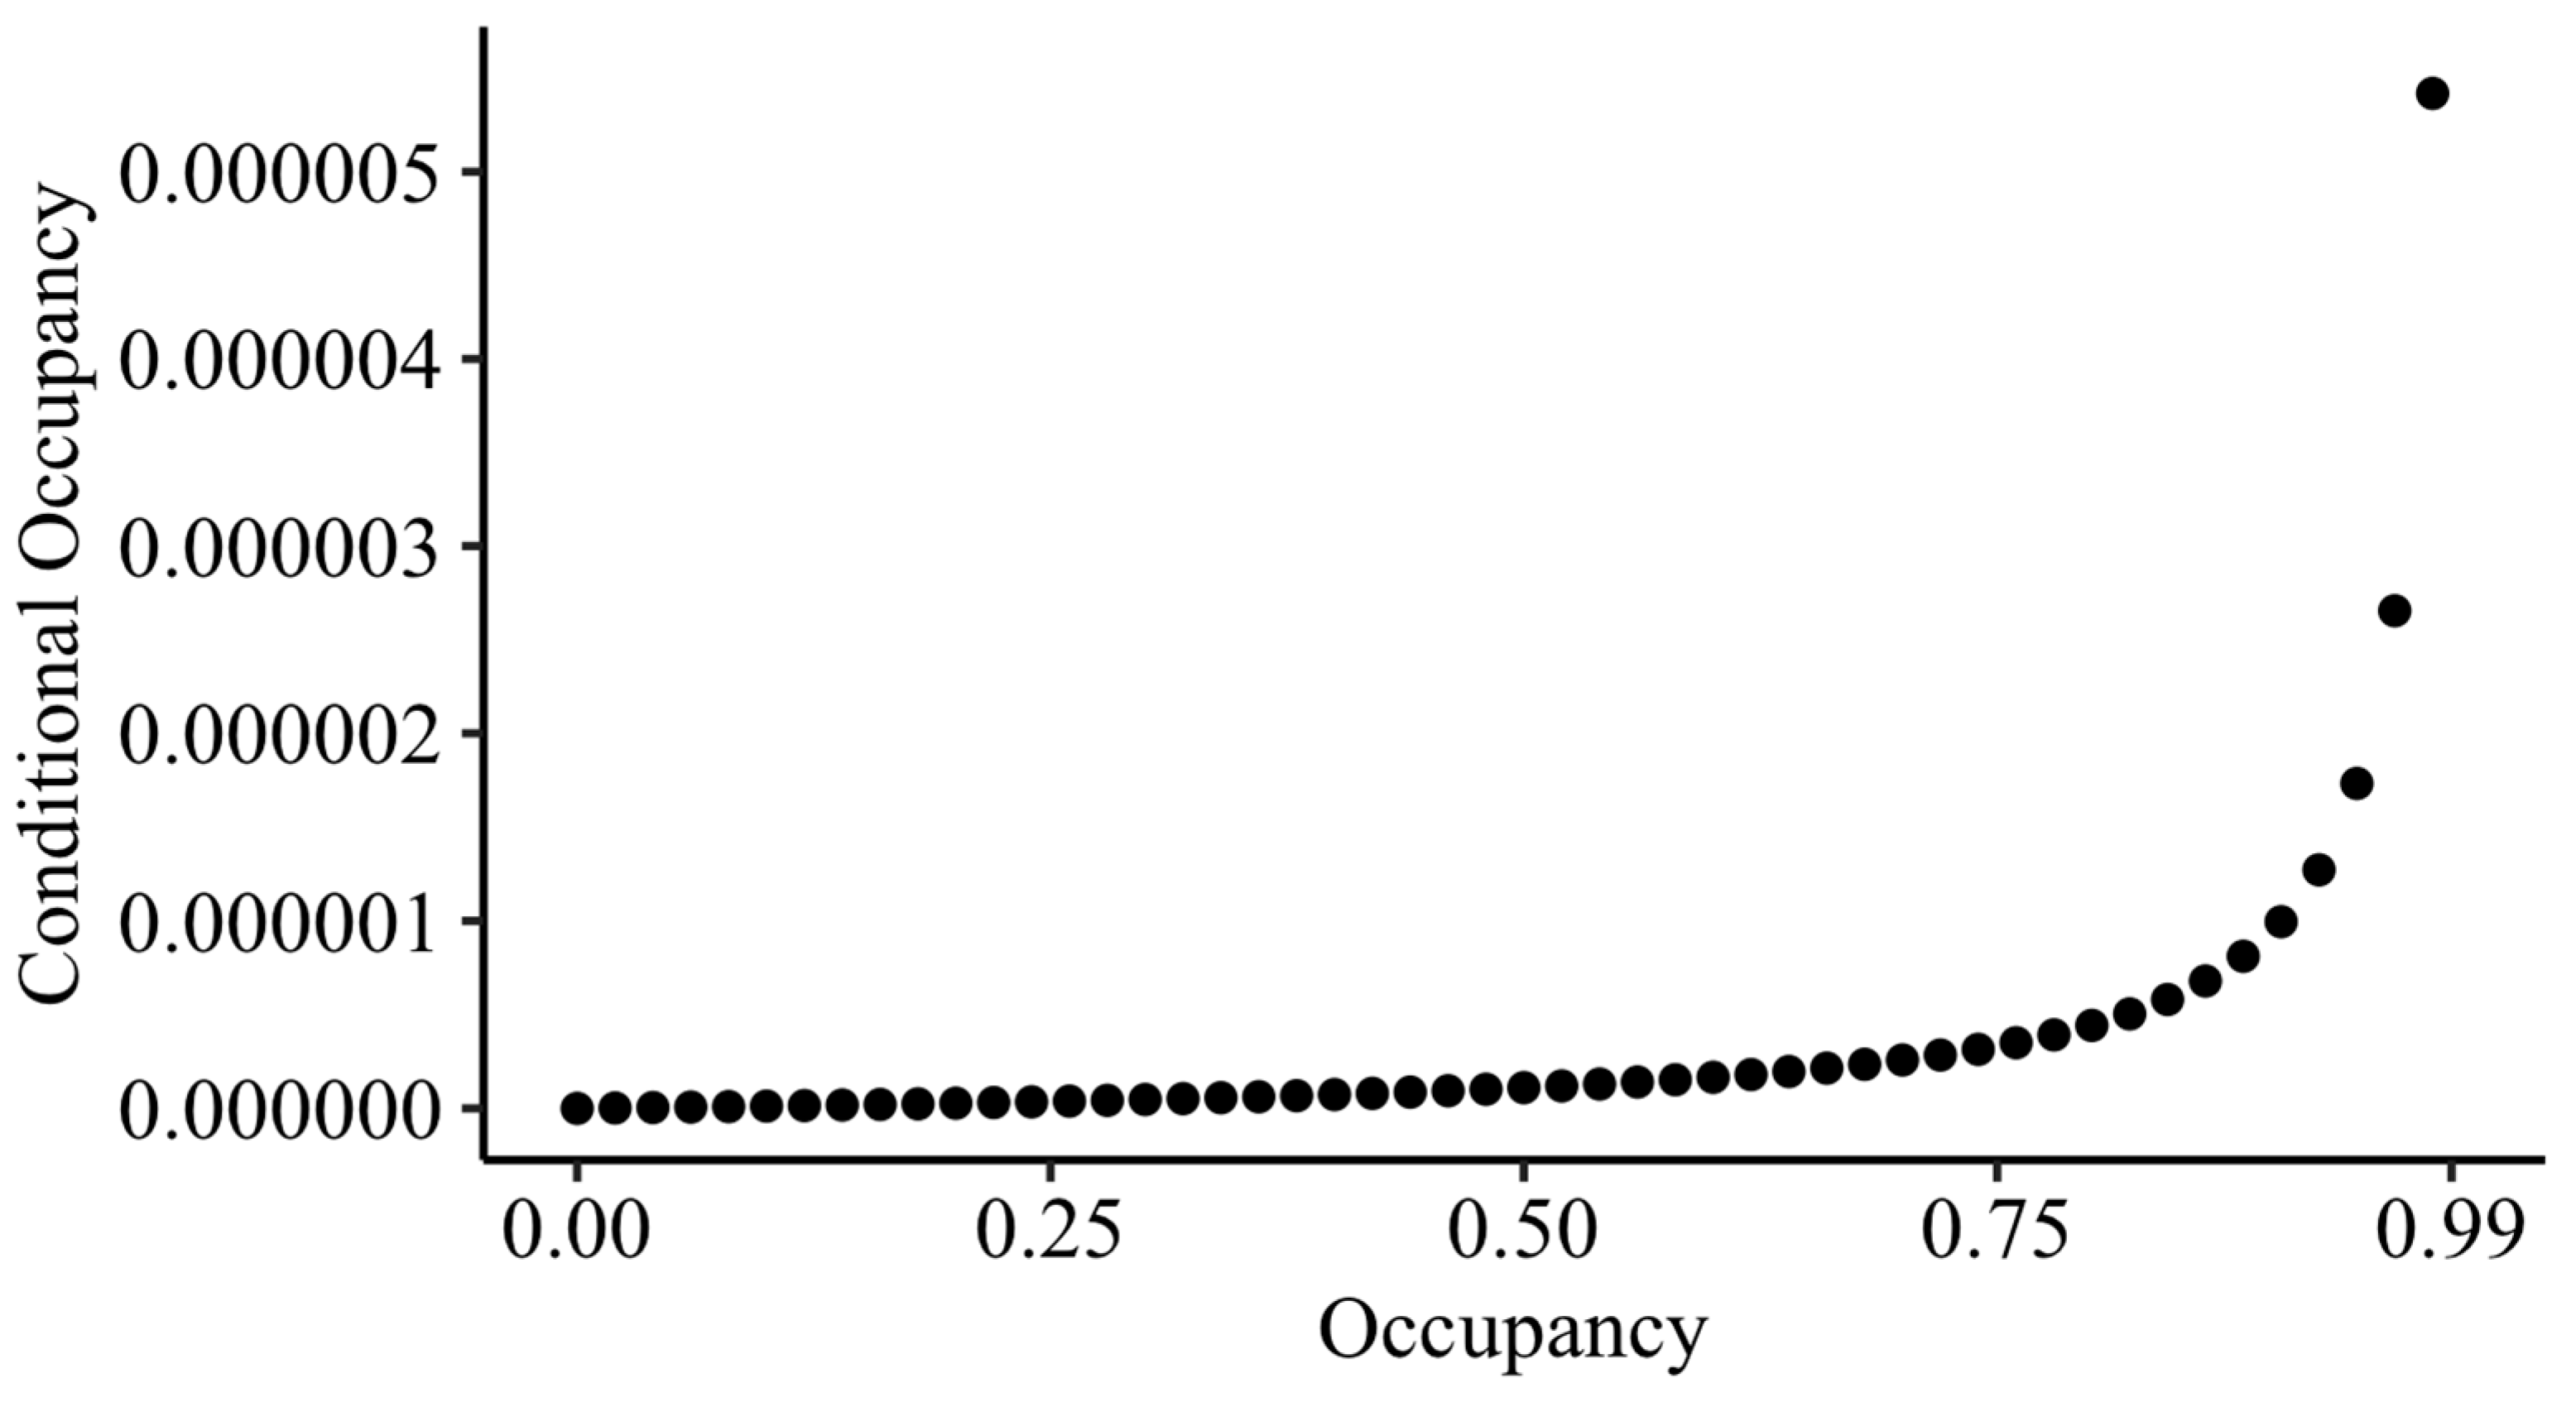
To estimate the conditional probability of a station being occupied by MBKR if they were not detected in any surveys, ψ
condl [
32], an estimate of the occupancy rate for the site, is needed. However, the LKR occupancy rate across the five plots at ODSVRA would not be a meaningful estimate for the MBKR’s occupancy rate at the sandspit. Instead, we calculated conditional occupancy estimates for the MBKR across occupancy rates from 0.01 to 0.99 and present all conditional occupancy values that could be possible using the average detection probability across the two deployments (as calculated above) and K = 6, for three nights of replicated camera deployment.
4. Discussion
Our surveys did not yield confirmed presence of the MBKR on the Morro Bay sandspit. While possible signs were found, cameras yielded no detections of the MBKR. This is despite high detection probabilities with camera traps, especially given the seasonality of camera trapping in summer of 2022. Additionally, given the area surveyed (97 ha), the quantity of signs that were found was very low and does not suggest a sustained kangaroo rat population exists on the Morro Bay sandspit. At best, it suggests scattered individuals and a low-density population, if any.
At no time did we discover what would have been an ‘active burrow’, meaning a burrow with clear tracks leading to it that suggested active foraging, or a clear trail of tracks showing repeated movement from a foraging area back to a burrow. Even the burrows that we classified as burrows (rather than possible burrows) did not look like active burrows. None of them had tracks leading in or out. Only one burrow was found with a sign and this was ‘tail drag’ with no hind footprints. Thus, the strongest sign was the presence of burrows, rather than the presence of clear kangaroo rat activity.
It is possible that there were occupied burrows on the sandspit, but that occupants were not active during the visual surveys or camera trapping that occurred between October and March. The MBKR Recovery Plan [
20] discusses reductions and increases in activity across the year, and it suggests reduced activity in the winter. Most of this discussion is based on a poster (Amer. Soc. of Mammalogists) by A.I. Roest [
33], which unfortunately summarizes the seasonality of live captures without considering effort. We acknowledge that detection probability was lower in winter and highest in summer, which supports that the LKR, and thus possibly
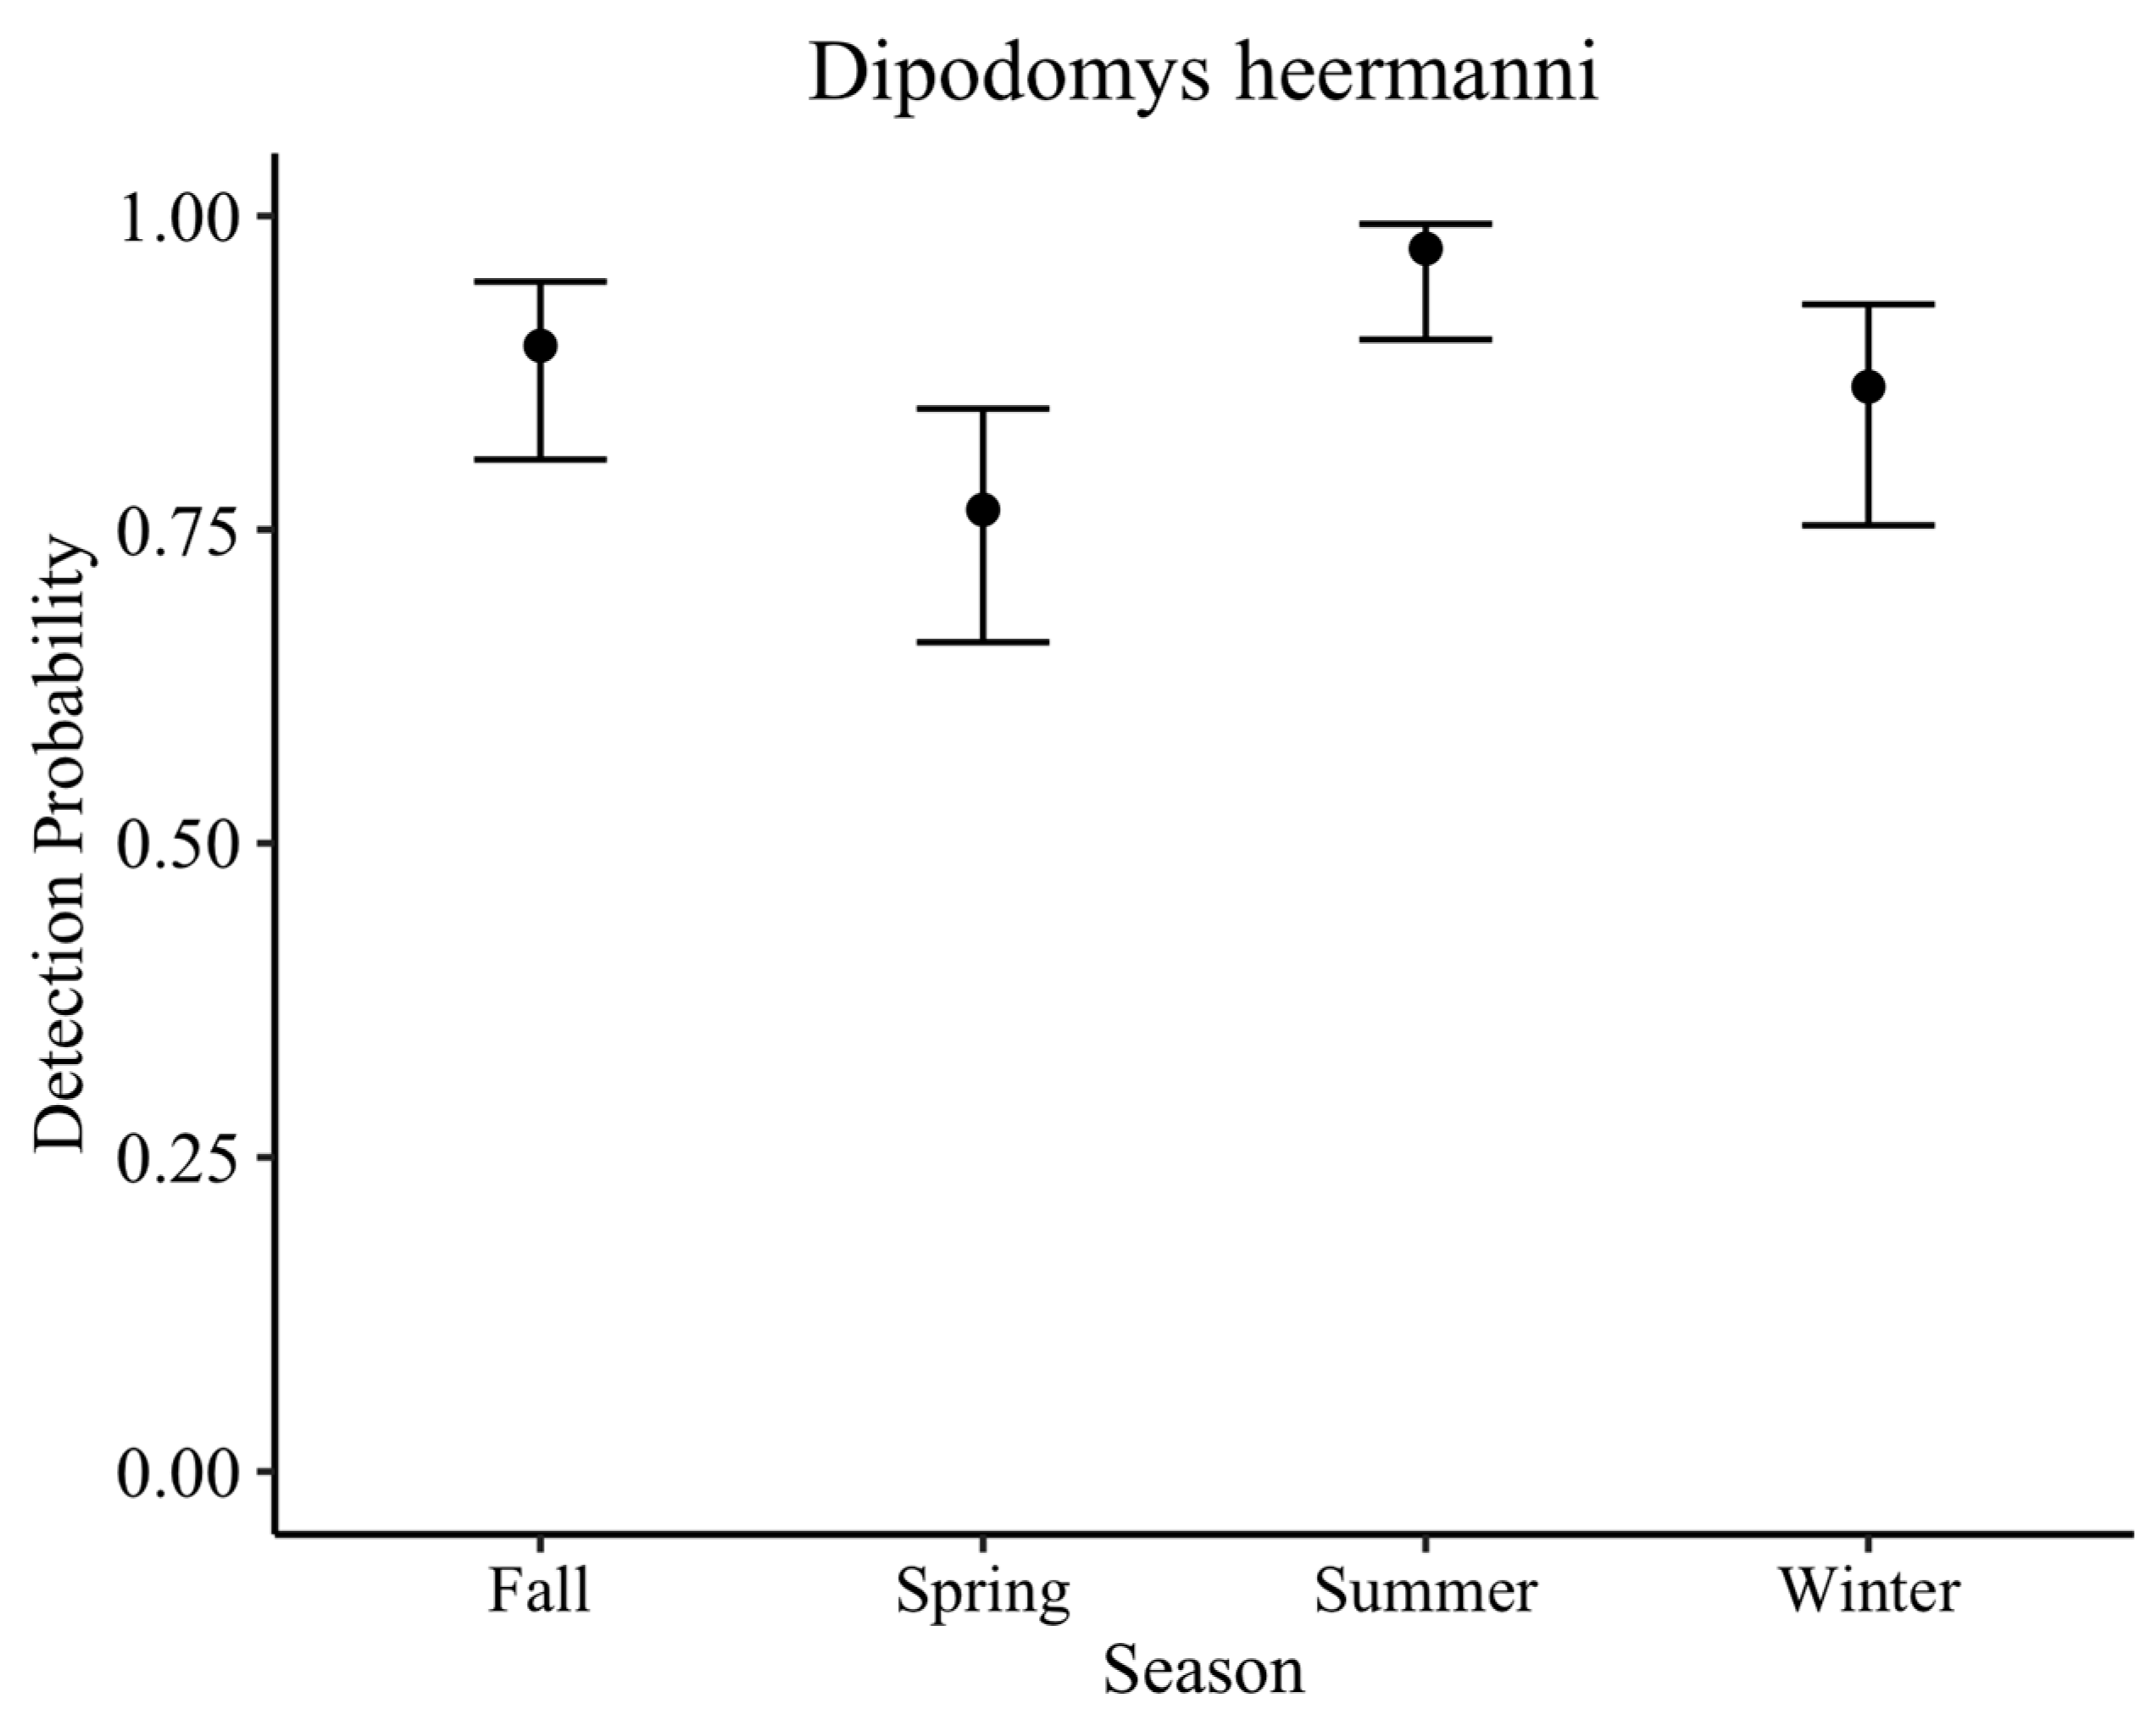
D. heermanni in general, are slightly less active in winter than summer, but note that they are active all year. Additionally, our analysis found spring to have the lowest detection probability. Thus, given consistent seasonal effort at the ODSVRA, we show about an 11% reduction in detection probability in winter and a 20% reduction in spring compared to the peak in summer. However, we also show year-round detections.
The best time to conduct surveys is during the time with the greatest activity, meaning summer. Unfortunately, there are two complications that make this challenging or impossible. First, the area of the sandspit is so large that it takes multiple visits to conduct visual surveys. These surveys cannot simply follow a calendar schedule given that surveys need to be conducted when there is and has been little to no wind, when the sky is clear (sunny), and when the sun is at a low angle, such as in the morning or evening (so tracks can be more easily resolved). Even though summer is the season with the highest apparent activity and detection probability via camera trapping, summer is also the season with the most fog, meaning that it is unlikely visual surveys could be conducted over that one season. Exacerbating this, during summer only a few hours a day have a suitable sun angle for resolving tracks in sand. Second, access to the sandspit is curtailed from 1 March through 31 September annually to protect breeding western snowy plovers. This would entirely preclude being able to search large areas of priority habitat (
Figure 2 and
Figure 4) except from 1 October through 28 February. Indeed, this is the reason our surveys were conducted from October through March, which we infer could have resulted in a reduction in detections of about 20%.
In order to provide insight on the detection probability of the MBKR through the camera trap method used, work on the LKR was used. The detection probability for the LKR through baited camera stations for each night of deployment in scrub vegetation averaged 88% across all seasons. Though we recognize that, biologically, these two species have different detection probabilities due to their different abundances, we argue that, methodologically, this detection probability (88%) would be similar for the MBKR if it were present, given they are the same species monitored through the same method in similar vegetation. Initial camera deployment at the sandspit occurred in fall, winter, and spring, which have a slightly lower detection probability (84%) than the year average. However, cameras were repeated in summer when detection is extremely high (97%). Across both camera deployments, the probability of not detecting the MBKR if it was present is extremely low: 0.00001%. Likewise, the probability that the MBKR occupied a camera station but was not detected for six nights of surveys (two camera deployments) is approximately 0% (0.0005%).
Kangaroo rats are central place foragers. They can, and often do, repeatedly visit a productive seed patch multiple times within one night [
34]. Our experience is that areas with kangaroo rats will often have camera stations that are depleted of seed within the first or second night. Thus, within areas that are occupied by kangaroo rats, it is not common for bait to remain at camera stations into the third, fourth or fifth night. Yet half of our camera stations deployed in summer had bait remaining upon retrieval, even with an average deployment of over 5 days.
Given the lack of detection from the cameras of the MBKR, and the understanding of the species detection probability to baited camera stations through the LKR, our study leads to three possible interpretations: 1. The MBKR is absent on the sandspit, and we misinterpreted signs; 2. We interpreted signs correctly and they are present, but they were not captured on camera; or 3. MBKR were present in October through March surveys but undetected in cameras, and then absent in August. We conclude that the first interpretation, that MBKR is absent from the sandspit and we misinterpreted signs, is the most parsimonious and has the highest probability (given estimates of the detection probability). If this study is warranted to be repeated, we suggest prioritizing efforts at the southern end of the sandspit, as that area had the largest amount of sign (
Figure 4).
While this survey provides needed information towards determining whether the MBKR is extinct or extant, not all necessary information has been acquired to conclusively infer extinction or persistence. We would have concluded persistence with positive results (by a camera detection), but negative evidence (absence) is more problematic. Herein, we have tried to inform the meaning of absence by estimating the detection probability in an area that has not been previously searched. However, in order to conclude extinction, we recommend surveying the private property areas that have not been accessible to researchers in the past, and to couple these surveys with a detection probability approach. The four private properties are (
Figure 1b): (1) Buckskin (26.3 ha), (2) a property immediately northwest (35.3184548, −120.8154728, 16 ha), (3) a property south of Junior High/Santa Ysabel (35.3207448, −120.8196588; 5.7 ha), and (4) a property in Baywood Park (35.3156828, −120.8396648; 21.9 ha) [
3]. Importantly, at least one of these properties contained MBKR when it was last live trapped prior to 1986 [
16]. In addition to the private properties lacking thorough surveys, peripheral edges of designated critical and essential habitat, and those that adjoin them and possess qualities of suitable habitat should also be considered. Specifically, there are two areas that had not been integrated into survey efforts but could harbor the MBKR. An area north of the delineated habitat (
Figure 1) in Morro Bay and within Morro Bay State Park is composed of Baywood fine sand (
Figure 1a) [
35], a habitat feature clearly associated with the MBKR. Another area located off the east corner of the delineated range (south of ‘Extension’ in
Figure 1b) is also composed of Baywood fine sand [
35] and requires a habitat assessment. If these habitat assessments find suitable habitat for the MBKR, the areas should be surveyed for individuals.
Alternatively, the information known thus far could be used to estimate extinction using probabilistic methods. Thompson et al. [
36] developed a theoretical approach for estimating the extinction probability that incorporates both certain and uncertain observations with targeted survey data. Following this, Thompson et al. [
37] developed a practical adaptation that integrates historical records and survey data. This model provides year-by-year updates on the probability a taxon is extant [
37]. The model uses both positive detection records and unsuccessful survey results, which can be dedicated (intentional surveys) or passive (incidental), combining various lines of evidence into the overall probability that a taxon is extant. Given the years of surveys for this species, and the various methods used, this model could allow incorporation of all surveys across methods and areas within the range. This model could be used to determine the probability the MBKR is extant using historic live trapping data and unsuccessful surveys carried out by various methods.


