Article

Density Estimates and Habitat Preferences of Two Sympatric Bird Species as Potential Bioindicators of Tropical Forest Alterations

1
Department of Life Sciences and Systems Biology, University of Turin, Via Accademia Albertina 13, 10123 Turin, Italy
2
Department of Life Sciences, University of Trieste, Via L. Giorgieri 10, 34127 Trieste, Italy
3
Department of Physical Sciences, Earth and Environment, University of Siena, Via Mattioli 4, 53100 Siena, Italy
4
Department of Life Sciences, University of Modena and Reggio Emilia, Via Campi 213/D, 41125 Modena, Italy
*
Author to whom correspondence should be addressed.
The authors contributed equally to the study.
Diversity 2023, 15(2), 208; https://doi.org/10.3390/d15020208
Submission received: 7 November 2022 / Revised: 24 December 2022 / Accepted: 25 December 2022 / Published: 2 February 2023

Abstract

:
Forestry management can shape the structure of habitat types and have important biological consequences on the composition of biodiversity. This study focused on Momotus lessonii and Eumomota superciliosa, two potential bioindicators of local and wide scale tropical forest alterations. The study took place in the Karen Mogensen Wildlife Refuge (Costa Rica), a protected area characterized by two main forest habitats where the two species coexist, i.e., primary moist and second-growth dry forest. A distance sampling method was used to obtain density estimates for each species. A spot mapping approach showed an apparent partitioning of the two species at the site. The Kilometric Abundance Index (KAI) and statistical analyses revealed significant differences between the two habitats, i.e., E. superciliosa tended to be more abundant and preferred the dry forest, whilst M. lessonii favored moist environments. The development of arid and semi-arid environments characterized by open areas will probably lead to a numerical increase in E. superciliosa with a consequent expansion, while the decline of moister and homogeneously forested environments will likely affect negatively M. lessonii. We argue that these birds will act as bioindicators of local and global environmental changes, and their monitoring will enable appropriate forest management decisions for conservation purposes.

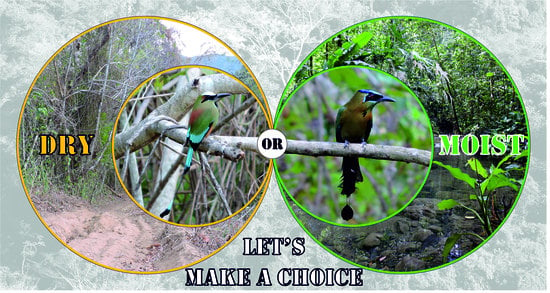
Graphical Abstract

1. Introduction

Being some of the most biodiverse ecosystems of the world and providing a wide range of ecosystem services, tropical forests deserve special attention in terms of their management and conservation [1]. This is particularly the case for the forests of Costa Rica, which is known to be a highly biodiverse country with the highest species density (number of species per unit of area) in the world [2]. Although severely affected by unsustainable management practices and fragmentation in the past, Costa Rican tropical forests have now almost doubled in just a few decades thanks to innovative forest conservation and management policies [3]. Significantly, most of the tree canopy is now secondary rainforest, characterized by different levels of vegetation structure and complexity, resulting in a mosaic of diverse types of habitats [4]. Such differences are also reflected in the levels of diversity and composition of bird species inhabiting these environments [5,6]. Moreover, the potential of some target species to act as indicators of habitat structure and quality can be used to monitor forest quality and health and, in turn, suggest how to improve the effectiveness of their management, for long-lasting conservation purposes [7]. Within this context, tropical avian communities have been widely used to examine changes in species diversity and composition of successional primary and secondary habitats and to inform on a variety of factors contributing to shape species-distribution patterns [5].
Motmots (Coraciiformes: Momotidae) are typical birds of the Neotropics, occurring from northern Mexico (Momotus mexicanus) to southernmost Brazil and northern Argentina (Baryphtengus ruficapillus, M. momota), with fourteen recognized species [8,9]. Extant species are generally small to medium sized, with morphometric traits and weight close to other Coraciiformes, such as the old world bee-eaters (Meropidae) and rollers (Coraciidae). They are conspicuous birds, sharing with other members of the order a strikingly colorful not sexually dimorphic plumage. The majority of Momotidae have an insectivorous or omnivorous diet and inhabit the dense tropical forests typical of low latitudes [9]. Despite its limited size, Costa Rica hosts six out of the fourteen recognized species, belonging to five out of the six known genera [10]. This high diversity derives from several factors, such as geographical location, climate, and variety of habitats. Notably, the north-western part of the country, characterized by some of the most threatened ecosystems of Mesoamerica [11,12,13,14], hosts two species of Momotidae, i.e., the turquoise-browed motmot (Eumomota superciliosa, Figure 1A) and the Lesson’s motmot (Momotus lessonii, Figure 1B), the former being the single representative of its genus. Both species live and widely overlap in Central America. Several aspects of these birds have been investigated, for instance, taxonomy [15], phylogeny and biogeography [16,17,18,19,20,21,22], morphometry [23], osteology [24], ethology [21,25], with particular regard to the motmots’ racket tail and the tail wag-display [25,26,27,28,29,30,31,32], breeding biology [33,34,35,36,37], and diet [38,39,40,41,42,43]. Conversely, information concerning numerous other ecological aspects is far from exhaustive. Studies on habitat selection, niche relationships or interspecific interactions are either scarce, dated e.g., [44] or totally absent. The limited information on population density, in particular, is sparse and derives from general surveys led on multiple species. Moreover, the few studies under discussion only surveyed the Amazon Basin, where the two target species are absent. In other studies, Skutch [36,37] reported some general observations addressing habitat selection, whereas the only detailed investigation in this regard registered primarily qualitative data [44,45]. The latter study focused on the breeding biology and diet of turquoise-browed motmot and Lesson’s motmot (formerly M. momota), and on the niche relationships between the two species. Density data have been recorded for E. superciliosa only, and regarded merely its breeding concentrations at colonial nesting sites [9,34].
Due to the lack of reliable and recent information concerning basic demographic parameters and habitat relationships of the target species, our research aimed to assess the population densities of Momotus lessonii and Eumomota superciliosa in a north-western Costa Rican area and to determine if the abundance of the two taxa differs between two main habitat types, moist and dry forests. We further evaluate their role as potential indicator species of wide-scale alterations, such as climate change and resulting habitat modifications, similarly to other bird species recently investigated in various Mesoamerican contexts [46,47,48]. This aspect is of particular relevance in a geographical region characterized by the most endangered environments of Central America [4]. Finally, the two targeted species are typical flagship animals, like other extremely colorful and conspicuous neotropical species. For this reason, undertaking quantitative studies that lead to a deeper understanding of the ecology of these birds, and their role as bioindicators of neotropical forests, is of great importance in a country such as Costa Rica, which bases a considerable part of its income on environmental tourism and particularly on ornithological tourism.
For this purpose, we carried out an investigation in the Karen Mogensen Wildlife Refuge, a protected area of north-western Costa Rica, which is part of the Biological Corridor of the Nicoya Peninsula. This study was supported by the presence within the Wildlife Refuge of the Research Station “Italia Costa Rica”, a facility managed by Italian and Costa Rica associations, in cooperation with the University of Modena and Reggio Emilia. The local avifauna is fairly well known in terms of species richness (around 209 species reported), thanks to numerous bird surveys conducted in recent years [49]. These studies provided baseline information which enabled us to perform further investigations on the avian community of the area. In particular, for the two target species, we were interested in evaluating two aspects: (i) density estimates over the greatest part of the area; (ii) distribution within the Wildlife Refuge, in relation to the occupancy and abundance in its main environments (primary moist and second growth dry forests). Answering these questions could help in evaluating how the change in the structure and vegetation composition of forest microhabitats affects the presence of the two species at different levels, and more generally, the importance of connectivity between forest portions separated by open patches.

2. Materials and Methods

2.1. Study Area

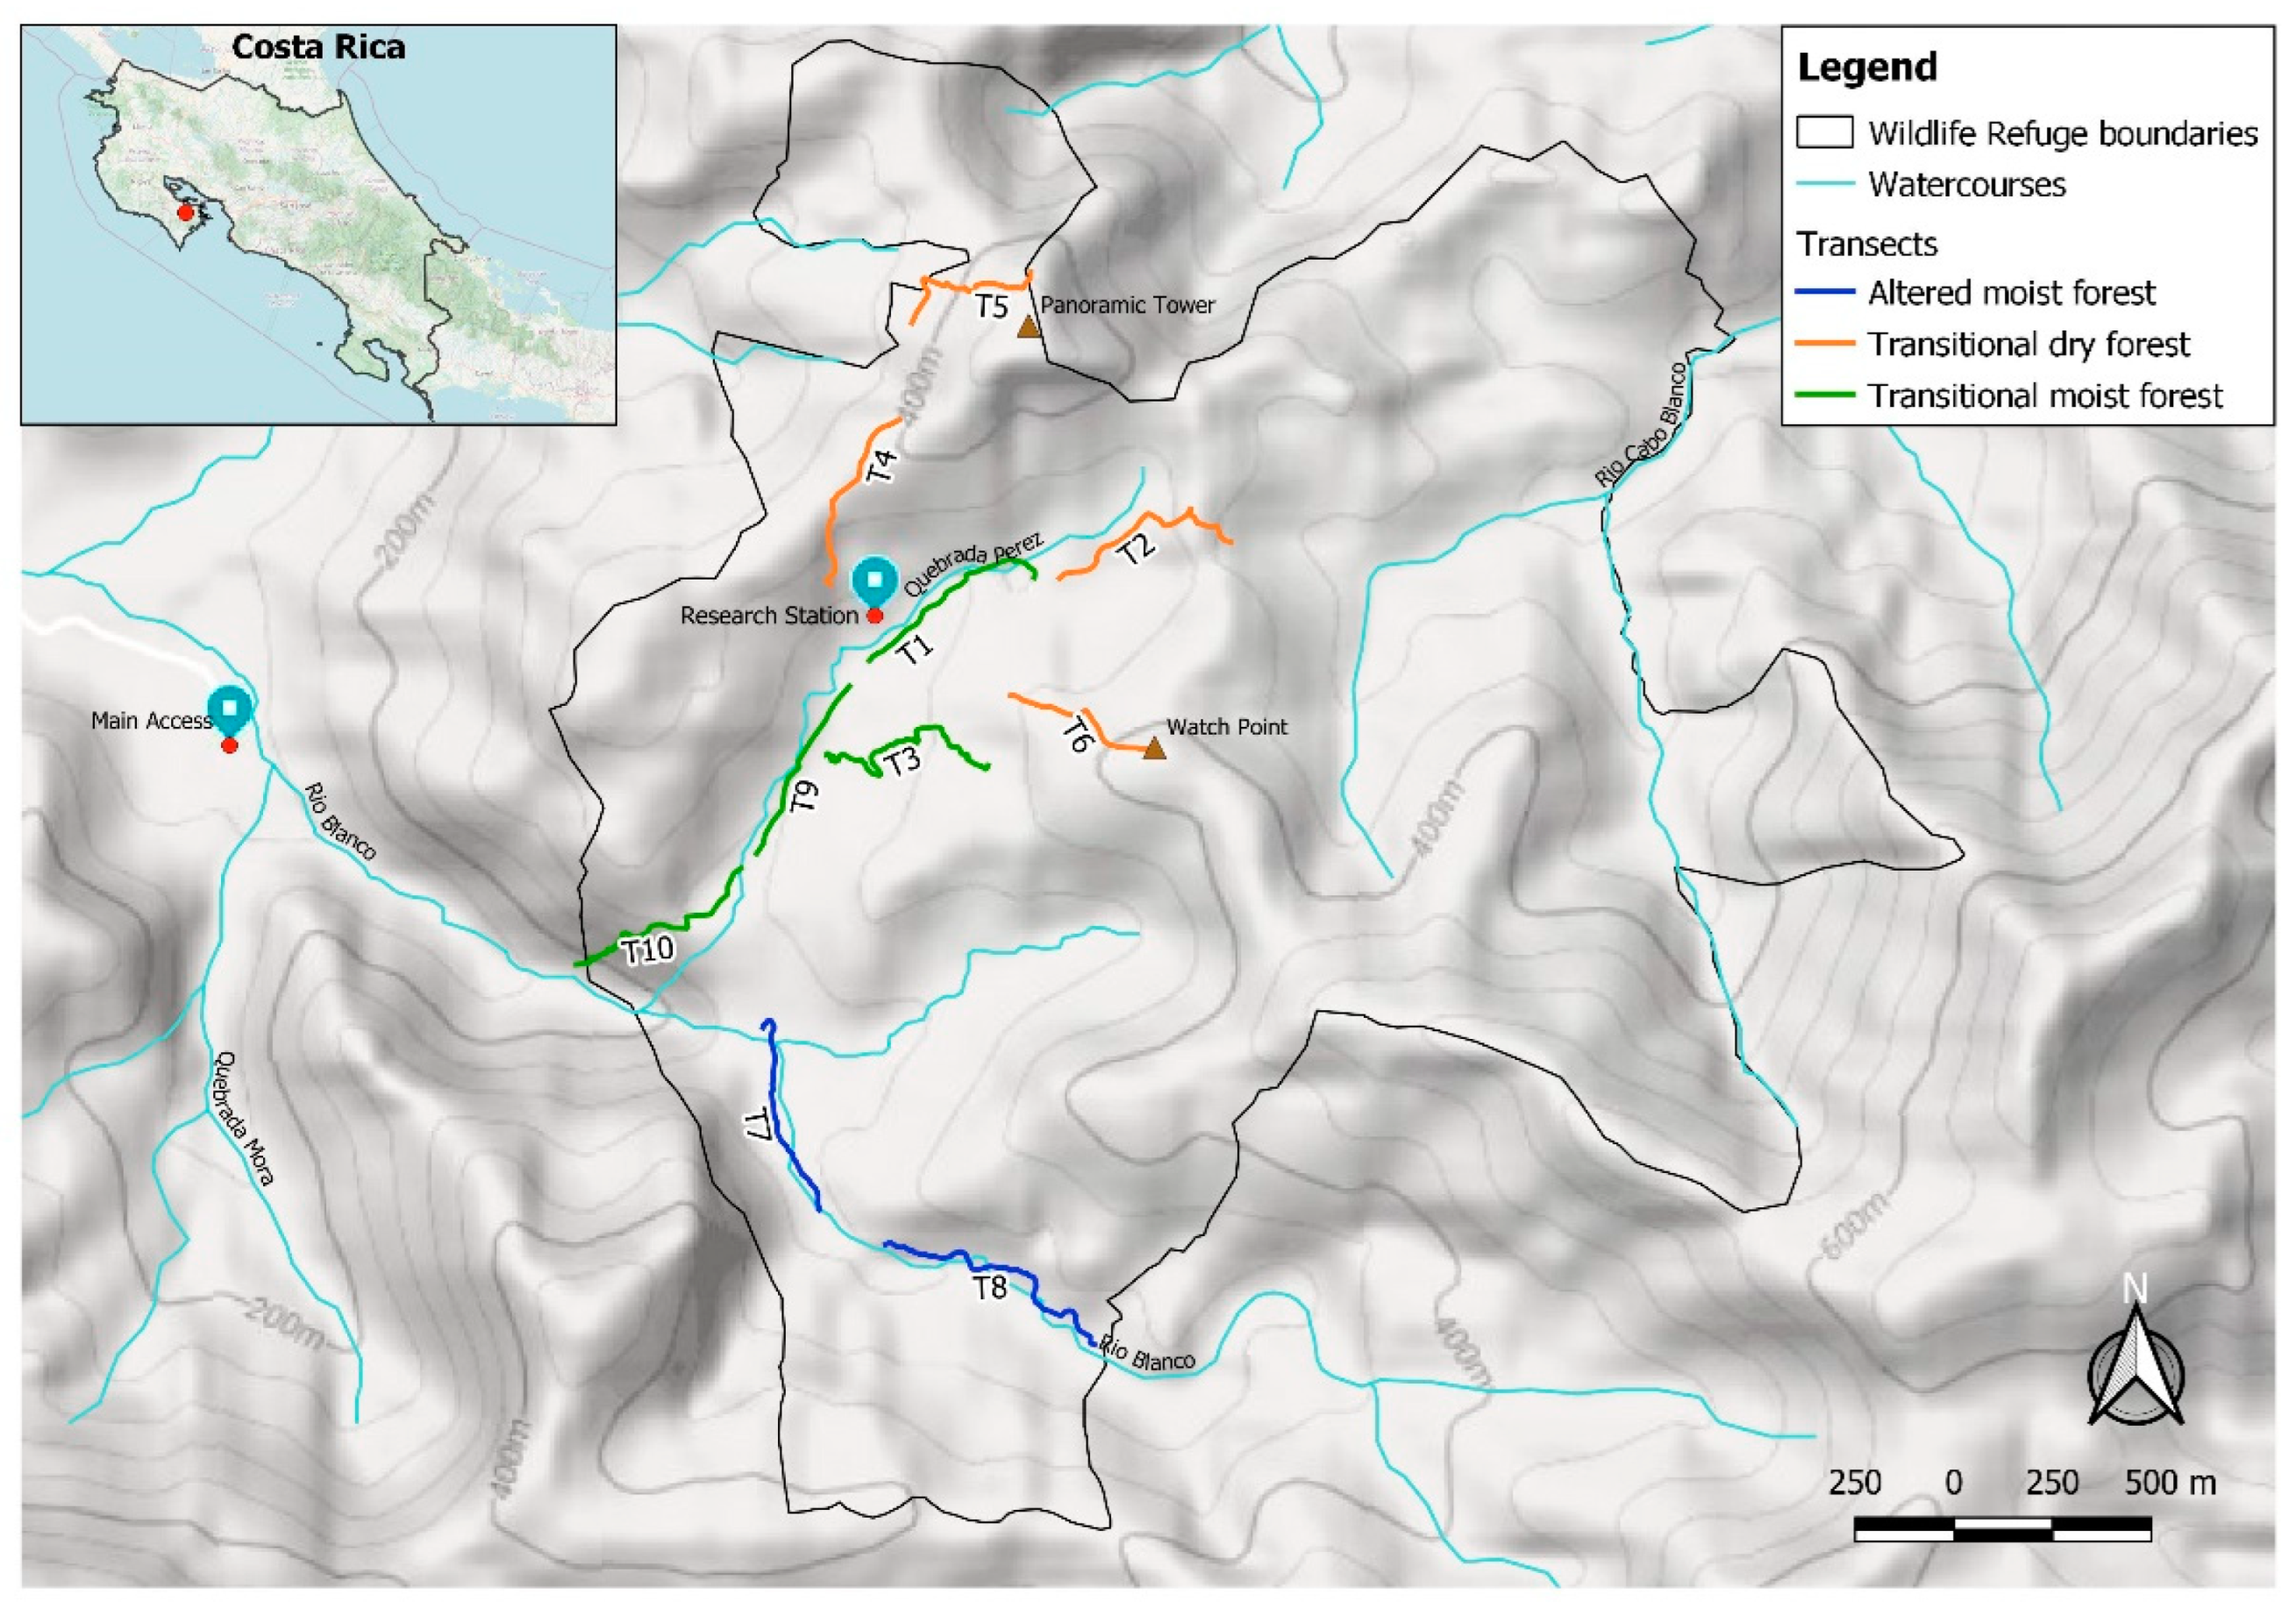
The Karen Mogensen Wildlife Refuge is a foothill area (altitudinal range: 130–600 m a.s.l.), which covers approximately 1000 hectares of forested land (Figure 2). Its centroid is located at geographical coordinates 09.86° N, 85.05° W. The climate conditions of the zone are markedly seasonal, with a rainy season running from the end of April to the end of November and a dry season occurring between December and April. There is an average annual rainfall of 1900 mm; temperatures are high throughout the year, with a mean of 25.3 °C, and with maximum values of around 35 °C in the dry season [49,50]. Based on precipitations and temperatures, the Wildlife Refuge is located in a transitional zone between neotropical moist and dry forests [51,52] similarly to other north-western Costa Rican contexts [13], resulting in a mosaic of two main types of habitat: (i) The transitional moist forest, mostly primary, is usually found close to the streams that cross the Wildlife Refuge, which are tributaries of the Rio Blanco River flowing in the south-western part of the protected area. This habitat is dominated by evergreen and semi-deciduous tree species. The vegetation is dense and includes several large individuals of some species, often exceeding 40 m in height (e.g., Anacardium excelsium, Brosimum alicastrum, Manilkara chicle), that form a complex canopy and, in some cases, give rise to gallery forests. (ii) The transitional dry forest, secondary in prevalence, characterizes the areas at higher altitudes and the most exposed sides of the foothills. This habitat is distinguished by a lower arboreal height and a relatively dense ground cover. The upper vegetation strata are characterized by numerous open patches, where lianas typically dominate. Generally, second growth patches are of various ages (from 20 to more than 50 years), partially resulting from conservation measures implemented from the 1990s. These actions fostered the natural regeneration of the land, which was formerly used for subsistence farming and cattle pastures. Primary forest patches, on the other hand, survived deforestation thanks to topography, or because trees represented valuable shade for cattle when close to streams; they were included too in the protected area when conservation measures were taken.
Within this diversified environmental context, nearly 210 bird species were reported. The two species targeted by the present study are known to be resident and, providing that investigations are carried out with the appropriate timing (see Section 2.2.), are easily detectable in the investigation area [49].

2.2. Data Collection

The study was led in the innermost part of the protected area in order to avoid large-scale edge effects and for logistical reasons, in agreement with several other investigations e.g., [53]. We adopted a sample count by placing counting units systematically over a representative part of the territory (i.e., crossing different habitats and elevations) and assuming that data obtained from the investigated zones can be extrapolated also for non-surveyed ones [53,54,55,56]. We based our approach on the Distance Sampling method, thus adjusting the data collected according to the detectability of the species in order to obtain population density estimates [57,58,59,60,61,62]. This method considers the probability of detection, which varies depending on the distance from the observer [55]. Data were collected by walking transects, a prerequisite of Distance Sampling. Additional reasons for the use of transects stem from the fact that, according to various studies, this method results in more accurate estimates than others in tropical forested environments, such as fixed points and territory mapping [63,64]. Furthermore, the use of transects reduces biases due to the observer and diminishes the influence of the vagility of birds [61]. Finally, line transects are extremely effective with conspicuous species rather than with dull and secretive ones [52]. The two target species are in fact medium-sized and brightly colored, make unmistakable and insistent calls, and perform characteristic tail waggling when a predator/observer is approaching [26]. Finally, they favor the middle level of vegetation see e.g., [49], and not the canopy or the understory, where the detection is typically more difficult. Line transects had repeatedly been used for avian studies in the Wildlife Refuge [49], therefore we based our work on a pre-existing transect network. In total, we selected ten transects, each on average 570 m long (Figure 2), following similar studies [60,65]. Four transects were positioned within the secondary transitional dry forest, while the primary transitional moist forest was crossed by six transects, two of which showed features that were intermediate between the two forest types due to recent unforeseen environmental changes (see further in the text and Figure 2). Transects were placed along six existing paths that widely run through the area. These were mostly narrow trails creating neither gaps into the canopy nor large spaces in the understory. The only exception was transect T4, where the trail was slightly wider (see the discussion in Section 4). Given also the impossibility of moving off the path into the dense vegetation without cutting it, the use of the Transects was essential to maximize the data collection in closed habitats and avoid habitat alteration, in agreement with bird study guidelines [66,67,68,69].
Some standardizations were applied to obtain the most reliable density estimates. Firstly, the counts were carried out between February and March 2019, both because this period falls in the middle of the dry season (absence of heavy rain, low wind) and also because it is the time of year when the target species become more territorial and vocal [36,37], therefore more detectable [58,59]. A pilot survey recorded the peak of activity in the first daylight hours, thus every count was restricted to 5.45 and 8.00 a.m. All transects were surveyed three times during the research. The total sampling effort resulted in over 17 km walked along 30 transects (10 transects per three replicates each; Figure 2). The transects were walked by two operators [55] at an average speed of 1–2 km/h as recommended by most studies [53,56]. All birds seen or heard were recorded, while birds flying over transects were excluded [53,56,65]. For every record, we registered the following data: day, hour, type of record (visual or acoustic), estimated distance of the individual from the operator (or transect), direction (deviation angle from the north), and the exact position of the observer through a GPS map (Garmin Gpsmap 64s, precision: 3 m).

2.3. Analyses

Data were analyzed with the software Distance Sampling v. 7.3 [59,62]. We applied truncation to make the resulting estimates more reliable and to minimize the gaps in the histograms. We tried an array of truncation distances (w) and, in particular, spanning between 150 m and 300 m, we simulated a different w every 10 m. We excluded the attempts with the worst goodness of fit (GoF) parameters, thus narrowing down the number of models (e.g., see Supplementary Materials, Figures S1 and S2, and Table S1) and, finally, the detections’ limits were set at 210 m for both Momotus lessonii and Eumomota superciliosa (see Supplementary Materials, Figure S3). In this way, outliers were not taken into account and ratios of truncated contacts (9% for E. superciliosa and 6% for M. lessonii) were in line with the suggested amount of approximately 5% [62]. In order to obtain overall density estimates for the Wildlife Refuge, detection functions [60] were computed separately for each species. These were based on the curve’s goodness of fit plotted on the histogram. Differentiated models with different series expansions were fitted to each histogram. The selection among these models was based on the graphical fitness of the curve; hence the Chi-squared test and the Q-Q Plots with related Kolmogorov–Smirnov (KSt) and Cramer–von Mises (CvMt) tests were taken into account [54,60]. Akaike’s Information Criterion (AIC), which incorporates likelihood (L) and the number of parameters (k), was applied for selection among models with the same n (number of observations) and w (width of truncation). We used both Conventional Distance Sampling (CDS) and Multiple-Covariate Distance Sampling MCDS; [70]. The latter approach helps in reducing the biases in case the true detection function differs by stratum, but the sample size is not large enough to apply stratification properly [70]. This proved to be useful in our case, given that in the less occupied habitat, each species was represented by a number of individuals insufficient and too small (i.e., 11 and 13 contacts for M. lessonii and E. superciliosa, respectively) to produce reliable estimates and to highlight any significant results. Hence, in MCDS analyses, the stratum or covariate is represented by the main habitat type: transitional dry forest on one side and transitional moist on the other. Subsequently, for the specific purpose of analyzing differences in species distribution between the two main habitats, we used a different approach (see below). Among the best CDS analyses for E. superciliosa were “Uniform + Cosine”, “Hazard Rate + Cosine” and “Half Normal + Cosine”, even though all of them were excluded based on the above-mentioned criteria. The model chosen for this species was MCDS “Half Normal + Cosine” (AIC = 602.54, χ2 = 7.59, df = 7.00, p(χ2) = 0.37; see also Supplementary Materials, Figures S3 and S4, and Table 1), which, on comparison to its corresponding CDS analysis, had similar GoF values but also a significantly lower AIC (ΔAIC = 3.49); this parameter in particular provides an objective, quantitative method for model selection [60]. Thus, comparing it with MCDS “Hazard Rate + Cosine”, AIC and all GoF measures were better. For M. lessonii, MCDS “Hazard Rate” without adjustments (AIC = 649.59, χ2 = 10.59, df = 8.00, p(χ2) = 0.23) was chosen above MCDS model “Half Normal” due to lower AIC and much better GoF; it was also selected above CDS “Hazard Rate”, despite a negligibly higher AIC (ΔAIC = 0.09), because of a more reliable GoF according to the CvMt and higher precision in the estimates (see also Supplementary Materials, Figures S3 and S5, and Table 1).
By using the software QGIS (QGIS v. 2.18), each geographically referenced record was pinpointed on the map of the study area, allowing the position of each detection to be estimated. The creation of maps, together with the knowledge of the exact time of each record, enabled the detection of any double counts which were then omitted from the analyses, in agreement with other studies [71]. Furthermore, the use of this method for extremely territorial individuals of both motmot species, or for individuals of other easily detectable species inhabiting the area, e.g., the crested guan (Penelope purpurascens), enabled us to check the accuracy of several distance estimates, on the basis of those individuals contacted on numerous occasions at the same location but from different positions, showing precise distances each time.
The Kilometric Abundance Index KAI; [66], i.e., the number of detections per transect length, was calculated along each transect to assess the relative abundances of both species in the two habitats considered, i.e., transitional dry forest and transitional moist forest. With this approach, we aimed to quantify discrepancies in the distribution of the two taxa among two habitat types coexisting in the Wildlife Refuge. In order to obtain the most reliable results, we did not include in this analysis the most distant aural contacts. We also excluded the data collected along transects T7 and T8, as some violent storms preceding our study (which occurred in 2018) partially modified the targeted environment, creating a combination of denser moist forest alternated by some open patches, which simulated a dry forest habitat. The nested analysis of variance (ANOVA) was used to test for differences in KAIs, in order to assess if the relative abundance varied both for each species in the two investigated habitats (transitional dry forest and transitional moist forest), and for each habitat between the two species.
To better show whether the relative abundance of the two target species varied in the two habitats, a Similarity Percentages analysis (SIMPER) was performed, along with Cluster Analysis and Analysis of Similarities (ANOSIM), using the Bray–Curtis similarity measure on the detections of the two species in the different strata sampled.
All statistical analyses were performed in the R environment (R Core Team 2022, v.4.2.0).

3. Results

Overall, after the exclusion of double counts, a total of 66 and 69 records were obtained for Eumomota superciliosa and Momotus lessonii, respectively; the majority of the contacts was aural, namely 76% and 91%, and a proportion of the records was truncated, at 9% and 6% for the two species. The remaining 60 and 65 records, respectively, were modeled using Distance. Therefore, both truncation percentages were close to the 5% threshold suggested by other authors [58].

Density Estimates and Relative Abundance

The overall resulting density estimate for E. superciliosa was 22.78 ± 5.70 individuals/km2 (CV = 25.01%, 95% CI = 13.43–38.64), with a detection probability of 0.36 (CV = 11.22%, 95% CI = 0.29-0.45), while M. lessonii showed a density estimate of 21.32 ± 5.65 individuals/km2 (CV = 26.49, 95% CI = 12.09-37.57), with a detection probability of 0.43 (CV = 9.85%, 95% CI = 0.35–0.51) (Table 1 and Supplementary Materials, Figure S3).
Table 1. Summary of the results of some of the models performed for Eumomota superciliosa and Momotus lessonii. Analyses number (no.) 1 and 5 were used for E. superciliosa and M. lessonii, respectively.
Nr.SpeciesAnalysisModelkwnΔAICKSt GoFCvMt GoFp(χ2)pESWD ± SE%CV95% CI
1E. superciliosaMCDSHalf Normal + Cosine3210600.000.590.60 < p ≤ 0.700.370.3676.3522.78 ± 5.7025.0113.43–38.64
2E. superciliosaMCDSHazard Rate + Cosine5210601.090.510.40 < p ≤ 0.500.140.4084.0720.69 ± 5.0924.6012.26–34.91
3E. superciliosaCDSHalf Normal + Cosine3210603.490.450.60 < p ≤ 0.700.430.4186.2720.16 ± 5.5927.7211.44–35.54
4M. lessoniiCDSHazard Rate2210650.000.640.50 < p ≤ 0.600.310.4083.7322.50 ± 6.5028.8812.38–40.91
5M. lessoniiMCDSHazard Rate3210650.090.600.70 < p ≤ 0.800.230.4288.3921.32 ± 5.6526.4912.09–37.57
6M. lessoniiMCDSHalf Normal 2210651.130.410.40 < p ≤ 0.500.160.4389.2921.10 ± 5.5726.4111.98–37.17
Abbreviations: 95% CI = confidence interval of 95%; % CV = percentage coefficient of variation; ΔAIC = Akaike’s Information Criterion variation; CvMt = Cramer–von Mises test; D = density estimate; ESW = Effective Strip Width; GoF = goodness of fit; k = number of parameters; KSt = Kolmogorov–Smirnov test; n = number of observations used for the analysis; p = probability of detection; p(χ2) = probability of a greater chi-square value; SE = Standard Error; w = width of truncation.
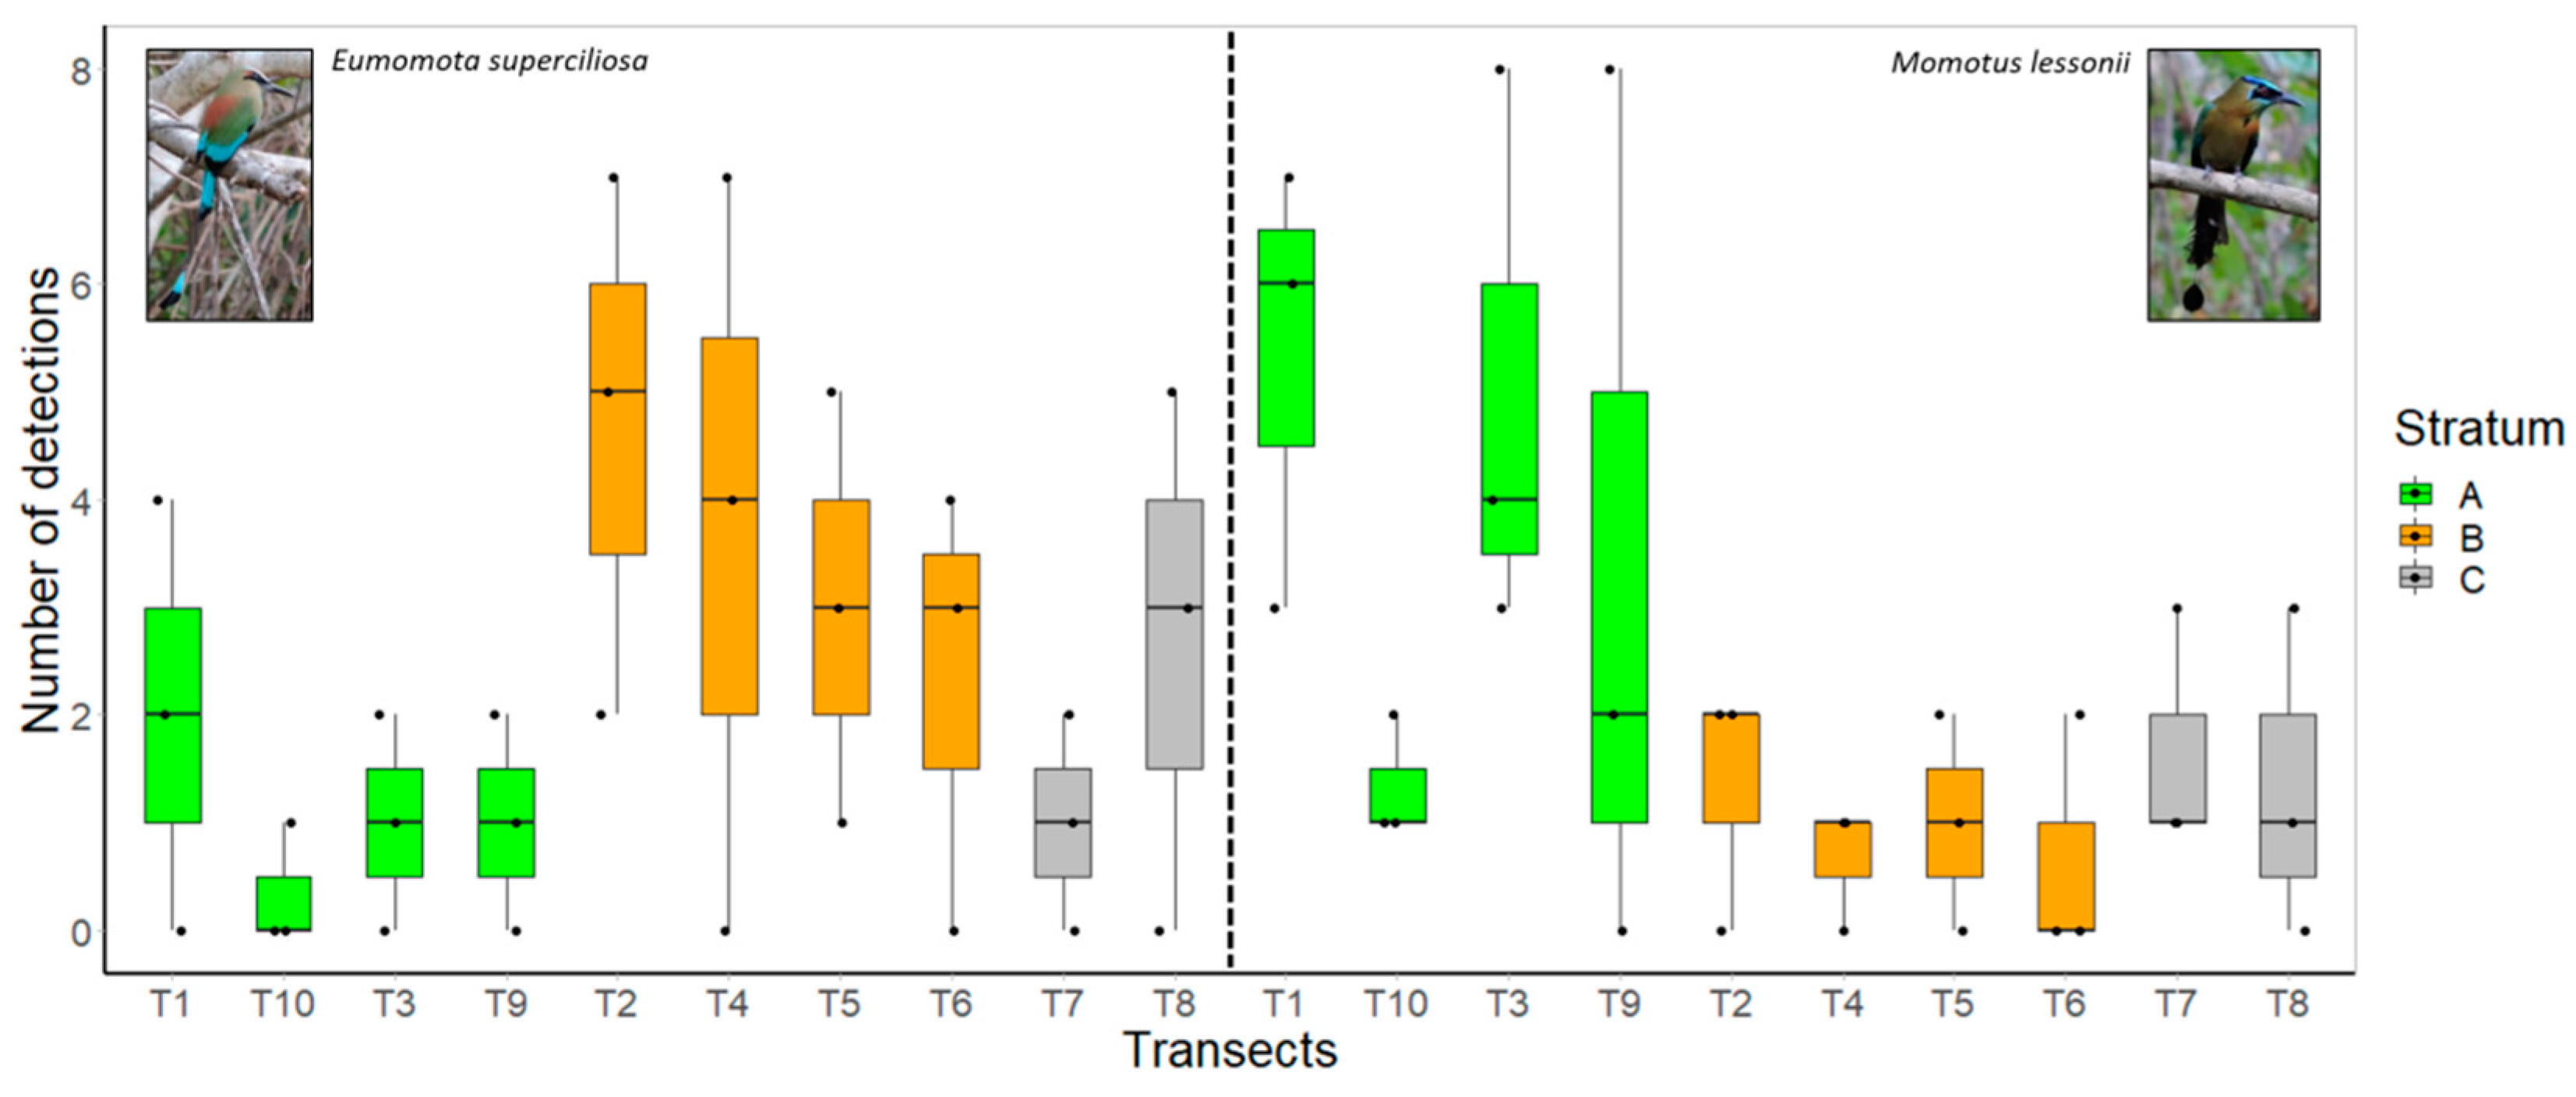
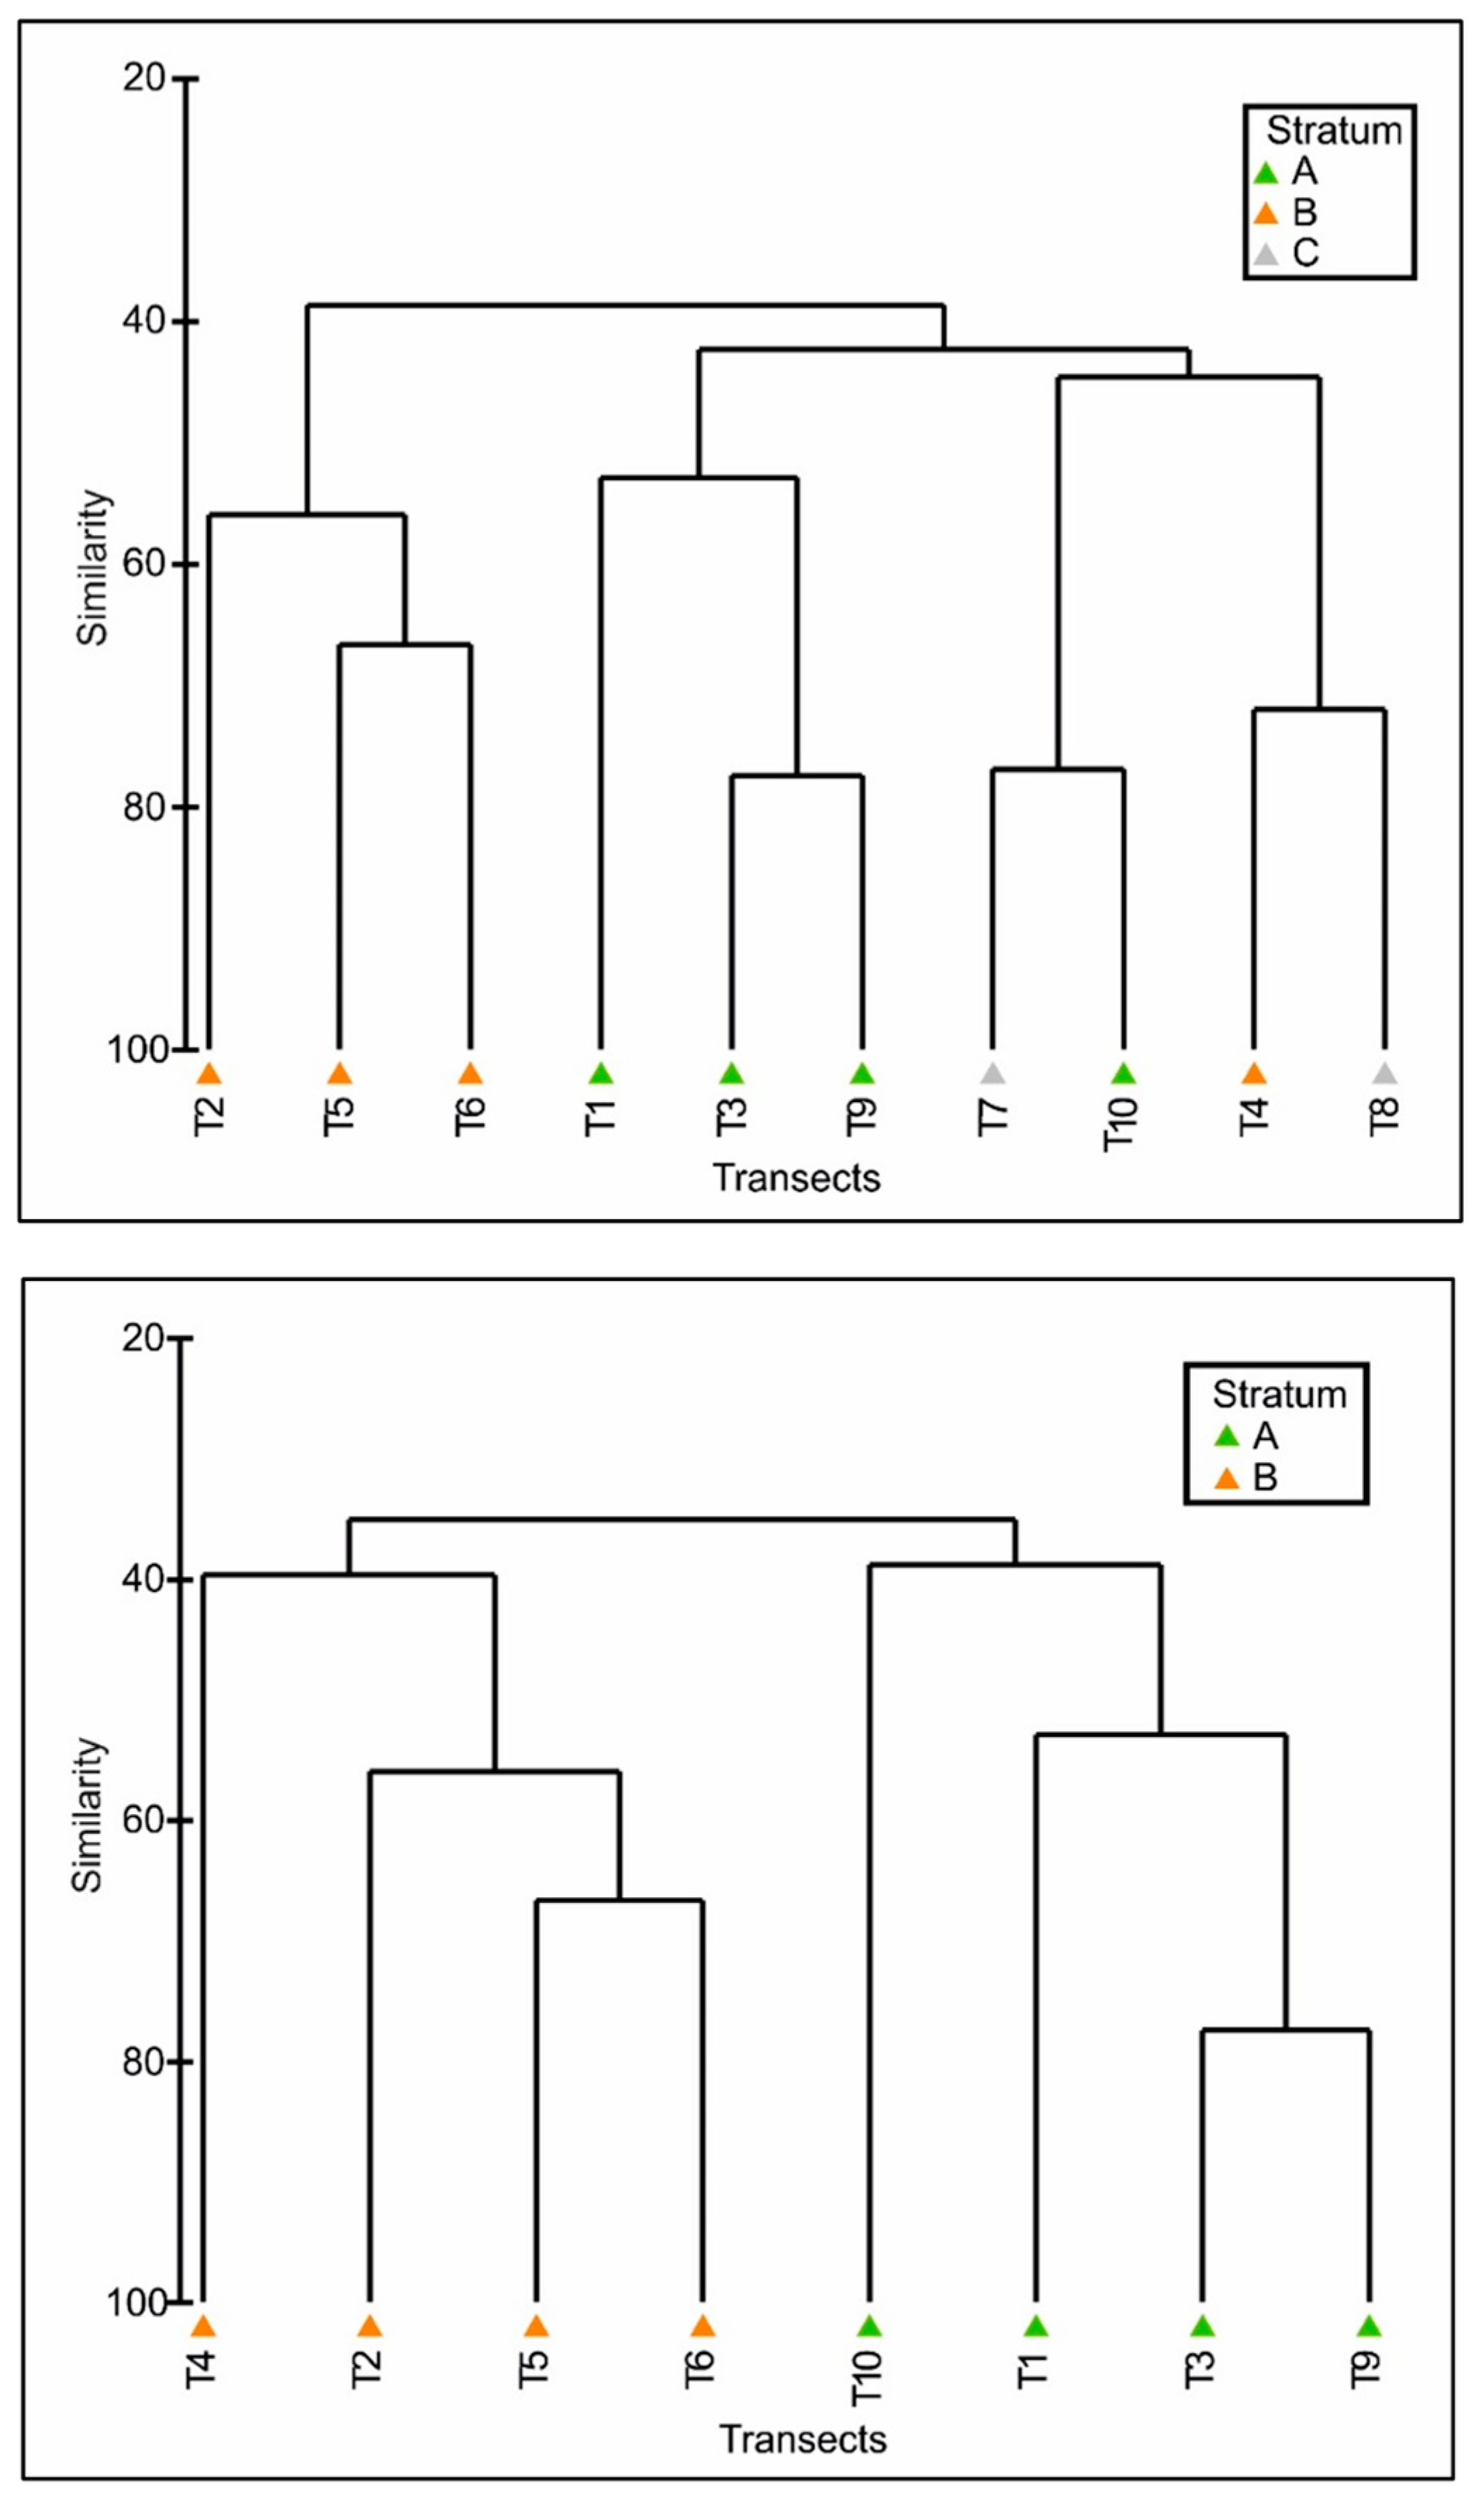
Maps of records for each sampling day were created to manage the double counts and assess the precision of the distance estimates. The maps were merged to obtain a map inclusive of all the records, which could show the distribution of the contacted individuals over the whole investigation period (Figure 3) and, therefore, provide information on the distribution of the two species in the investigated area. As for E. superciliosa, the majority of records were achieved along the transects crossing the transitional dry forest, i.e., T4 and T5, followed by transects T2 and T6. Conversely, the minimum number of records were obtained along transects T3, T9 and T10 (Figure 3 and Figure 4). These latter three transects and, to a minor extent, transect T1, all crossing the transitional moist forest, were characterized by the highest occurrence of individuals of M. lessonii. As previously reported, transects T7 and T8 crossed an altered habitat, characterized by a non-homogeneous moist forest (unlike prior to our study), with canopy openings and portions of soil devoid of arboreal vegetation (Figure 4). The modification was more obvious along T8, where the ground close to the track was steep and favored landslides. To avoid biases due to this heterogeneity, these transects were not included in the habitat analysis with KAI. The Cluster Analysis highlighted a similarity between T8 and T4 (Figure 5); further information is needed to clarify the origin of this similarity. This same analysis, performed after the exclusion of T7 and T8, clearly separated the transects into two clusters: one including the transects that crossed the dry forest (T2, T4, T5, T6; similarity: ca. 40%); the other, those transects comprised in the moist environment (T1, T3, T9, T10; similarity: ca. 40%; Figure 5). The analysis of similarities (ANOSIM) showed a significant dissimilarity among the transects from dry, moist and altered forests (Global R = 0.346; p < 0.05). Pairwise tests highlighted that this dissimilarity, based on motmot relative abundances, was driven by a significant difference between transects from dry forest and moist forest (R = 0.635; p < 0.05). SIMPER analysis showed a comparable level of similarity among the transects from dry forest and those from moist forest (49.57% and 49.90%, respectively). The two transects crossing the altered habitat exhibited a higher similarity (60%). Pairwise comparisons based on the three environmental contexts (dry, moist and altered forests) revealed that the highest dissimilarity was between dry and moist forests (64.97%), thus corroborating the results of ANOSIM.
ANOVA revealed significant differences in the relative abundance for each species in the two habitats and in each habitat between the two species (p < 0.05). The mean KAIs of E. superciliosa were 1.88 and 6.63 in the transitional moist forest and transitional dry forest, respectively, while the mean KAIs of M. lessonii were 6.32 in the transitional moist forest and 1.79 in the transitional dry forest (Table 2).

4. Discussion

The total amount of approximately 70 records for both species is in line with the criteria for obtaining reliable estimates with the software Distance [60]. This value is comparable with other studies of even longer duration e.g., [57] and higher if compared to investigations on rare species e.g., [68], and is therefore considered reliable. The presence of a high percentage (76% and 91%) of aural contacts agrees with the information from other studies led in tropical forest environments, which reported values ranging from 70% to 90% e.g., [63], and reflects the typical complexities related to this kind of survey [69]. The truncations of records used for the general estimate corresponded to 6–9% of the total amount; these values are close enough to 5% suggested by [60,62].
Overall density estimates for E. superciliosa and M. lessonii deriving from our analysis are similar to each other (E. superciliosa: 22.78 ± 5.70 individuals/km2; M. lessonii: 21.32 ± 5.65 individuals/km2). The consistency of our density data is strengthened by the breeding features of the target species. Our study took place in February–March, owing to the fact that E. superciliosa and M. lessonii lay their clutch in March–April and then are more territorial and vocal, thus well detectable in the field [36,37]. In addition, these species are known to be monogamous throughout the year, with partners living in pairs and both calling [33,36,37]; moreover, both partner and site fidelity have been documented over the years [33]. Literature regarding M. lessonii’s densities are lacking and a single investigation on a colony of E. superciliosa reported breeding concentrations of 30 pairs (10 to 20 in most cases), nesting in adjacent holes [9,34]. We highlight that the focus on a colony is unlikely to give an accurate density value, especially for Costa Rican areas, where the latter species does not show a colonial behavior [9].
Generally, our values appear higher than those reported by the few other studies led on the closest taxon to M. lessonii, i.e., M. momota. Research undertaken in different parts of the Amazon Basin reported a population density of 5 pairs per 100 ha, i.e., 10 ind./km2, in a primary lowland forest [72], 6 pairs per 100 ha (12 ind./km2) in a floodplain forest [73], and 5.5 pairs per 100 ha (at least 11 ind./km2) in a lowland rainforest [74]. A further investigation, also led in Amazonia, recorded a similar number of individuals (6 pairs in territories of 100 ha, i.e., 12 ind./km2) within a “mature forest” habitat, even though the authors identified and distinguished two additional forest habitats: a “mixed canopy” and a “transitional forest” [75]. In these environments, the densities reported were much higher, i.e., 22 and 21 pairs in territories of 100 ha, respectively (44 and 42 ind./km2), almost twice the density estimates found in our study and substantially higher than those registered in the aforementioned studies.
The situation is noticeably heterogeneous for other momotid genera. Compared to our results, some studies reported either higher or considerably lower densities. For instance, density data recorded for Baryphthengus ruficapillus in Brasil corresponded to 30 ind./km2, and reached 48 ind./km2 for the congeneric B. martii in Panama [76]. Electron platyrhyincus reached the density of 30 ind./km2 in an Amazonian area [77], even though lower densities were reported in other Amazonian sites, i.e., 2 pairs per 100 ha (4 ind./km2) [73,75]. The congeneric keel-billed motmot, E. carinatum, revealed densities of 16–20 individuals in a protected area spreading over 2000 hectares, i.e., 0.8–1 ind./km2 [9,78]. Finally, low densities were reported also for Aspatha gularis, which reached 5 ind./100 hectares in a Guatemalan cloud forest [79].
As for the study of the habitat, the two species showed a spatial partitioning and only partially overlapped within the Reserve. Our investigation pointed out a difference in the abundance of the two target species along the transects crossing the primary transitional moist forest and the secondary transitional dry forest. The analyses performed indicate that the two motmots tend to replace each other within the two investigated habitats, though exhibiting substantially similar densities in relation to the whole surveyed area (Figure 3, Figure 4 and Figure 5; and Table 1; Table 2). The Cluster Analysis clearly separated the four transects crossing the dry forest (T2, T4, T5 and T6) from those included into the moist forest (T1, T3, T9 and T10), highlighting a similar number of detections of each species within each of the two habitats (Figure 5). Additionally, when also taking into account altered transects T7 and T8, this showed a more heterogeneous situation, with these mixing with the others and suggesting a possible intermediate habitat type. This would be an interesting point of investigation and should deserve more attention in future studies in the Wildlife Refuge. Following the results of the Cluster Analysis, ANOSIM and SIMPER showed significant dissimilarities between the composition of motmot communities from dry and from moist forest.
The Kilometric Abundance Index (KAI) for the turquoise-browed motmot was significantly higher along the four transects comprised in the transitional dry forest than in the remaining paths (Figure 3 and Figure 4; Table 1 and Table 2). Similarly to other Costa Rican, and, more generally, Central American contexts, this habitat is characterized by open upper vegetation strata [80,81]. Furthermore, the investigated habitat is a relatively young second-growth forest (on average 30 years old), thus the tree cover is particularly scarce and creates more space available for the development of fast-growing plants and an overall open canopy [82].
Conversely, the Lesson’s motmot was rarely contacted along the four transitional dry forest transects. Its KAIs results were significantly higher along transects T1, T3, T9 and T10 (Figure 3 and Figure 4; Table 2), characterized by a transitional moist forest, typically evergreen, densely vegetated, and often associated with the watercourses that cross the Wildlife Refuge (Figure 2). This observation is in line with the only extant study on the habitat preference of M. lessonii (addressed as M. momota instead of M. lessonii) which related the presence of this species to humid and medium-to-high altitude woods, represented by up to 20–40% of deciduous trees [44].
Table 2. Habitat and length of each transect, number of Eumomota superciliosa and Momotus lessonii observations, and Kilometric Abundance Index (KAI) for the two species along each transect replicate.
Transect
ID
HabitatLength
(km)
No. of Detections
E. superciliosa
No. of Detections
M. lessonii
KAI Mean
KAI/Transect
KAI Mean
KAI/Transect
E. superciliosaE. superciliosaM. lessoniiM. lessonii
T1Moist forest0.550603.6410.919.70
T1Moist forest0.55477.2712.73
T1Moist forest0.55233.645.45
T3Moist forest0.73131.371.374.116.85
T3Moist forest0.730405.48
T3Moist forest0.73282.7410.96
T9Moist forest0.50002.0006.67
T9Moist forest0.51224
T9Moist forest0.528416
T10Moist forest0.640100.521.562.08
T10Moist forest0.64111.561.56
T10Moist forest0.640203.12
Mean 1.88 6.32
T2Dry forest0.67211.677.783.332.22
T2Dry forest0.6508.330
T2Dry forest0.6223.333.33
T4Dry forest0.530106.921.891.26
T4Dry forest0.53407.550
T4Dry forest0.537113.211.89
T5Dry forest0.475010.646.3802.13
T5Dry forest0.47122.134.25
T5Dry forest0.47316.382.13
T6Dry forest0.43409.35.4301.55
T6Dry forest0.43326.984.65
T6Dry forest0.430000
Mean 6.63 1.79
More generally, the two motmots are depicted worldwide as largely overlapping both in terms of range and habitat preference, showing also a wide ecological tolerance across their global distribution, including Costa Rica [37,83,84]. However, this information tends to be sparse and partially ambiguous. In fact, there is a substantial lack of specific studies on the supposed habitat segregation of the two birds, especially at a finer level of spatial resolution. Nearly all the few available data are qualitative, based on bare direct observations, and do not derive from more analytical studies see e.g., [36]. The only systematic information gathered was during investigations led in Yucatán, Mexico, by Orejuela [44,45], even though partially derived from the analysis of colonies. However, this colonial breeding behavior for E. superciliosa is reported for the areas investigated in Mexico, but this bird seems not to be colonial in Costa Rica, as reported above [6]. Literature data report observations of E. superciliosa in both deciduous woodland and evergreen forests in Costa Rica, and, more generally, tend to highlight a preference for drier habitats and secondary woodland [9,36,44]. On the contrary, M. lessonii is assumed to prefer more humid forests, closed and shady habitats, with few lianas [44]. In this context, our results, based on quantitative data, give a significant support to the observations reported to date for both species.
Differences in abundances between habitats reflected by our study may be supported by other results, not least in terms of the difference in the aural/visual contact ratio between the two species. The majority of contacts of both species was aural but the aural/visual contact ratio was much higher for M. lessonii compared to E. superciliosa (M. lessonii: 91%; E. superciliosa: 76%). In addition, M. lessonii was frequently recorded at shorter distances than E. superciliosa. These results are likely due to the preference shown by the former species for habitats characterized by a denser vegetation cover. Moreover, in a dry forest environment, with less vegetation cover and a more open canopy, the chance of obtaining visual records of E. superciliosa was higher. This peculiarity could have increased the probability of also detecting individuals of this species located at a greater distance from the transects, resulting in a more uniform distribution of contacts. For this reason, the distance of truncation was fixed at a greater distance for E. superciliosa than M. lessonii (see above) in the analyses performed with Distance.
As reported above, we opted not to include in the KAI analyses those records deriving from transects T7 and T8, owing to recent upheavals that followed the storms of the 2018 rainy season. Various investigations led in Central American environments pointed out how the creation of open patches within forests influences the bird community and species occupancy, notably the most forest-dependent species, i.e., birds that require wide zones of mature forest. Moreover, the decrease in connectivity between forest portions separated by newly formed open patches and, more generally, the degradation of existing microhabitats, negatively affect the presence of some species at different levels [85] (see literature therein). Based on this information, even though the data deriving from transects T7 and T8 could not be considered, to some extent they may support a result of our analyses, i.e., the partial habitat segregation where the two species coexist in a restricted area. In fact, we would have expected to register a higher number of individuals of M. lessonii and relatively few E. superciliosa in the moist forest environment characterizing these transects prior to our study, similarly to the situation detected along transects T1, T3, T9 and T10 (see above). However, by observing on a map the georeferenced records along transects T7 and T8 (Figure 3), the total number of contacts for the two species was rather similar, even though a few more individuals of E. superciliosa were recorded along transect T8, which underwent major alterations, while a slightly higher number of M. lessonii was registered along transect T7. The peculiar situation observed along transects T7 and T8, though not statistically analyzed, could represent an additional, albeit merely qualitative, support to the results of our analyses. The presence of open patches across a denser primary moist forest environment may have created a balanced situation where the two species coexist with rather comparable abundances, despite a minimum difference in the openness of the forest environment that might influence, albeit slightly, the choice of the two species.
A further field observation that may corroborate the results of our analysis derives from the data collected along transect T4 (dry forest). The Cluster Analysis separated T4 (dry forest) and T8 (most altered transect) from the other transects, pointing out a similar number of detections of both species along each of these two transects (Figure 5). The frequency of contacts of E. superciliosa along T4 appears somewhat higher than along other transects of the same dry forest stratum. The dendrogram resulting from the Cluster Analysis, performed after the exclusion of T7 and T8, shows T4 detached from the other transects that cross the dry forest (Figure 5). T4 is the only path of our study lying on a road (Figure 2). Although the route is unpaved, narrow and scarcely used, it somewhat broadens the open space in the vegetation, in a context already characterized by sparse vegetation cover. Various wide-ranging studies on dry forest environments report that the abundance of forest gaps, the increasing openness of the canopy and the consequential growth of thickets are related to a higher number of disturbance-adapted species [82]. Conversely, the only location close to dry forest/open areas where M. lessonii was regularly recorded during our investigation was around the research station located within the Wildlife Refuge, which lies in an area of convergence of the two forest types (Figure 2). Based on these occasional observations, we may hypothesize that the openness typical of dry and, especially, secondary dry forests [79,82] could be crucial for the presence of Eumomota superciliosa.
Further considerations deriving from our results are related to the diet of the two motmots, so far investigated only by Orejuela [44]. E. superciliosa was reported to feed on a higher proportion of actively flying insects (mostly lepidopterans and hymenopterans) and a lower proportion of ground arthropods than M. lessonii [44]. Dry forests are usually less dense [86] and characterized by a more open canopy [80]; therefore, they can be more suitable for a species such as E. superciliosa, which predates actively flying insects. Moreover, our data collection took place during the dry season in the Nicoya Peninsula, typically characterized by a generalized decrease in prey availability and by a concentration of trophic resources in the limited moister environments. An additional working hypothesis, in line with Orejuela [44], is that M. lessonii tended to show more hostile interactions with E. superciliosa in the prey-richest part of the Wildlife Refuge (moist forest), further retaining the distribution of E. superciliosa to areas characterized by dry forest. These observations can be corroborated by several studies reviewed by Visco et al. [84], who pointed out that the degradation of preferred microhabitats jeopardizes specialized birds’ foraging opportunities. In addition, our observations are in line with the investigation by Orejuela [44], who reported an apparent superiority of M. lessonii in the competition with E. superciliosa in a stable forest environment. In support of this assumption, the habitat modifications recently undergone along transects T7 and T8 (moist forest prior to our study) might have been detrimental for M. lessonii, whilst positively affecting the presence of E. superciliosa which showed a clear opportunistic and colonizer behavior. In this case, the competitive superiority of M. lessonii might be reduced or even reversed by the demands for tolerance derived from habitat modification. Therefore, in altered situations where the two species coexist, E. superciliosa may restrict M. lessonii to a narrower range of microhabitats, or even locally replace it.
A further remark arising from our findings is related to the forthcoming development of the study area. According to the institution in charge of the Wildlife Refuge (i.e., The Ecological Association of Paquera, Lepanto and Cóbano), its area will expand in the near future, embedding the neighboring territories presently affected by the great exploitation and widespread deforestation that affected the whole region during the second half of twentieth century [87,88]. In line with the effects of the conservation measures implemented from the 1990s, the expansion of the Refuge’s boundaries will undoubtedly result in a rapid land reforestation, with a consequential reduction in the open dry forest environments. Based on the results of our study, we can hypothesize that for E. superciliosa, this could restrict the areas of its presence in the Refuge; the species might instead follow the shifting edges of the expanding forests and move to the new forest borders and the newborn sparse woodlands. On the other hand, M. lessonii would keep the denser and moist forest interior as its stronghold, remaining distant from the more open areas which border part of the Wildlife Refuge. This process would be the other side of the coin of the observation by Orejuela [44], who focused on the biological consequences of extensive deforestation programs in Yucatán, pointing out that the removal of highly developed forests, and the creation of roads, pastures and agricultural zones, fostered the spreading of colonizer and opportunistic species. As a consequence, man-induced deforestation would have favored E. superciliosa in the interspecific competition with M. lessonii.
A final remark is related to the global distribution of E. superciliosa. It is noteworthy that the population examined in the present study is among those reaching the southernmost range of this species [9]. Similarly to the populations of numerous other tropical species at the edge of their global ranges, this situation increases the probability of their being influenced by the effects of global modifications—most notably, climate change, and the resulting habitat alterations [89]. Although most of the species are negatively affected by these global alterations, which tend to cause a progressive worldwide expansion of arid and semi-arid environments, the preference of this motmot for such habitats may result in a numerical increase of densities with a consequent broadening of the areal to other areas of Costa Rica located further south. In this hypothetical scenario, the presence of M. lessonii may be restricted to the steadily declining moister environments. The ongoing creation of isolated patches of this forest type, and the progressive decreased connectivity between them, will probably foster the decline of local intraspecific breeding, the reduction in population rescue opportunities, and the decrease in gene flow among breeding nuclei, with detrimental effects from a genetic point of view, as reported in several studies see [80] and literature therein. Based on these considerations, our focus on the ecological features of the two momotids acquires a major importance in light of the potential use of these easily monitored animals as bioindicators of the aforementioned global alterations. Finally, our findings are of particular importance in a geographical zone characterized by some of the most threatened environments of Central America [12,13], therefore needing specific and constant biomonitoring programs.
Further investigations on the two target species, potentially to be conducted both on a long-term basis and at a broader scale, will hopefully support and strengthen the results of our research, thus allowing an increasingly extensive use of these birds in the monitoring of neotropical forests.
The development of balanced conservation measures in suitable areas, such as the Karen Mogensen Wildlife Refuge, will be of crucial importance for the preservation of vital populations of both the two momotids under consideration. Besides the conservation issues, these management actions will favor the presence in the same area of two flagship animals, as well as of many other tropical bird species, contributing in this way to the maintenance of and increase in the local income deriving from environmental tourism.

Supplementary Materials

The following supporting information can be downloaded at: https://www.mdpi.com/article/10.3390/d15020208/s1, Figure S1: Detection function (above) and Q-Q plot (below) relative to a CDS half-normal analysis performed with a distance of truncation (w) of 150 m for the species Eumomota superciliosa; Figure S2: Detection function (above) and Q-Q plot (below) relative to a CDS hazard rate analysis performed with a distance of truncation (w) of 150 m for the species Momotus lessonii; Figure S3: Detection functions of the selected analyses (analyses 1 and 5 in Table 1), based on the curve’s goodness of fit (GoF) on the histogram; Figure S4: Q-Q plots of models reported in Table 1 for Eumomota superciliosa; Figure S5: Q-Q plots of models reported in Table 1 for Momotus lessonii; and Table S1: Summary of the results of two illustrative analyses run at a distance of truncation (w) of 150 m for comparison with the selected models.

Author Contributions

Conceptualization, D.L. and M.D.Z.; methodology, D.L.; software, D.L.; validation, D.L., F.F., F.M. and M.D.Z.; formal analysis, D.L.; investigation, D.L., F.F., F.M. and M.D.Z.; resources, D.L.; data curation, D.L., F.F., F.M. and M.D.Z.; writing—original draft preparation, D.L. and M.D.Z.; writing—review and editing, F.F., F.M. and M.D.Z.; visualization, D.L., F.F., F.M. and M.D.Z.; supervision, M.D.Z. All authors have read and agreed to the published version of the manuscript.

Funding

This research received no external funding.

Institutional Review Board Statement

Not applicable.

Data Availability Statement

Data from this study are available upon request to the authors.

Acknowledgments

We want to thank Dario Sonetti, director of the Research Station “Italia Costa Rica”, fundamental facility for our investigation within the Karen Mogensen Wildlife Refuge. We are most grateful to Giuseppe Romeo, for his essential support during the field activities, and to all the members of Foreste per Sempre Association. Special thanks go to Mery, Arnulfo, and all the Ecological Association of Paquera, Lepanto and Cobano (ASEPALECO), along with Davide Iamonte and all the friends and other companions, who helped make this study possible. Furthermore, we acknowledge Gianpasquale Chiatante for his valuable assistance during data analyses. Finally, we wish to thank three anonymous reviewers for their helpful and much appreciated comments and suggestions.

Conflicts of Interest

The authors declare no conflict of interest.

References

  1. Putz, F.E.; Blate, G.M.; Redford, K.H.; Fimbel, R.; Robinson, J. Tropical forest management and conservation of biodiversity: An overview. Conserv. Biol. 2001, 15, 7–20. [Google Scholar] [CrossRef]
  2. Kohlmann, B. Biodiversity conservation in Costa Rica-An animal and plant biodiversity atlas. In Research in Biodiversity-Models and Applications; IntechOpen: Rijeka, Croatia, 2011. [Google Scholar]
  3. Calvo-Alvarado, J.; McLennan, B.; Sánchez-Azofeifa, A.; Garvin, T. Deforestation and Forest Restoration in Guanacaste, Costa Rica: Putting Conservation Policies in Context. For. Ecol. Manag. 2009, 258, 931–940. [Google Scholar] [CrossRef]
  4. Zahawi, R.A.; Duran, G.; Kormann, U. Sixty-Seven Years of Land-Use Change in Southern Costa Rica. PLoS ONE 2015, 10, e0143554. [Google Scholar] [CrossRef]
  5. Blake, J.G.; Loiselle, B.A. Bird Assemblages in Second-Growth and Old-Growth Forests, Costa Rica: Perspectives from Mist Nets and Point Counts. Auk 2001, 118, 304–326. [Google Scholar] [CrossRef]
  6. Casas, G.; Darski, B.; Ferreira, P.M.; Kindel, A.; Müller, S.C. Habitat Structure Influences the Diversity, Richness and Composition of Bird Assemblages in Successional Atlantic Rain Forests. Trop. Conserv. Sci. 2016, 9, 503–524. [Google Scholar] [CrossRef]
  7. Allen, L. The Application of Biodiversity indicators to Infer Ecosystem Health in Regenerating Tropical Forest. Doctoral Dissertation, University of Glasgow, Glasgow, UK, 2019. [Google Scholar]
  8. Gill, F.; Donsker, D.; Rasmussen, P. IOC World Bird List (V12. 2). 2022. Available online: https://www.worldbirdnames.org/new/ (accessed on 5 November 2022).
  9. Snow, D.W. Family Momotidae (Motmots). Handb. Birds World 2001, 6, 264–285. [Google Scholar]
  10. Winkler, D.W.; Billerman, S.M.; Lovette, I.J. Motmots (Momotidae), version 1.0. In Birds of the World 2022; Billerman, S.M., Keeney, B.K., Rodewald, P.G., Schulenberg, T.S., Eds.; Cornell Lab of Ornithology: Ithaca, NY, USA, 2022. [Google Scholar] [CrossRef]
  11. Gillespie, T.W. Life History Characteristics and Rarity of Woody Plants in Tropical Dry Forest Fragments of Central America. J. Trop. Ecol. 1999, 15, 637–649. [Google Scholar] [CrossRef]
  12. Huettmann, F. Central American Biodiversity: Conservation, Ecology, and a Sustainable Future; Springer: Berlin/Heidelberg, Germany, 2015. [Google Scholar]
  13. Janzen, D.H. Tropical Dry Forest: The Most Endangered Mayor Tropical Ecosystem. In Biodiversity; National Academy Press: Washington, DC, USA, 1988; pp. 130–137. [Google Scholar]
  14. Powers, J.S.; Becknell, J.M.; Irving, J.; Perez-Aviles, D. Diversity and Structure of Regenerating Tropical Dry Forests in Costa Rica: Geographic Patterns and Environmental Drivers. For. Ecol. Manag. 2009, 258, 959–970. [Google Scholar] [CrossRef]
  15. Stiles, F.G. A Review of the Genus Momotus (Coraciiformes: Momotidae) in Northern South America and Adjacent Areas: Una Revisión Del Género Momotus (Coraciiformes: Momotidae) En El Norte de Sudamérica y Áreas Adyacentes. Ornitol. Colomb. 2009, 8, 29–75. [Google Scholar]
  16. Becker, J.J. A Fossil Motmot (Aves: Momotidae) from the Late Miocene of Florida. Condor 1986, 88, 478–482. [Google Scholar] [CrossRef]
  17. Chapman, F.M.; Watkins, H. The Distribution of the Motmots of the Genus Momotus; American Museum of Natural History: New York, NY, USA, 1923. [Google Scholar]
  18. De Pietri, V.L.; Mourer-Chauviré, C.; Menkveld-Gfeller, U.; Meyer, C.A.; Costeur, L. An Assessment of the Cenozoic Avifauna of Switzerland, with a Description of Two Fossil Owls (Aves, Strigiformes). Swiss J. Geosci. 2013, 106, 187–197. [Google Scholar] [CrossRef]
  19. McCullough, J.M.; Moyle, R.G.; Smith, B.T.; Andersen, M.J. A Laurasian Origin for a Pantropical Bird Radiation Is Supported by Genomic and Fossil Data (Aves: Coraciiformes). Proc. R. Soc. B 2019, 286, 20190122. [Google Scholar] [CrossRef]
  20. Olson, S.L. Oligocene Fossils Bearing on the Origins of the Todidae and the Momotidae (Aves: Coraciiformes). In Collected Papers in Avian Paleontology Honoring the 90th Birthday of Alexander Wetmore; Smithsonian Institution Press: Washington, DC, USA, 1976. [Google Scholar]
  21. Smith, S.M. Innate Recognition of Coral Snake Pattern by a Possible Avian Predator. Science 1975, 187, 759–760. [Google Scholar] [CrossRef] [PubMed]
  22. Witt, C.C. Rates of Molecular Evolution and Their Application to Neotropical Avian Biogeography; Louisiana State University and Agricultural & Mechanical College: Baton Rouge, LA, USA, 2004. [Google Scholar]
  23. Korzun, L.P.; Érard, C.; Gasc, J.-P. Morphofunctional Study of the Bill and Hyoid Apparatus of Momotus momota (Aves, Coraciiformes, Momotidae): Implications for Omnivorous Feeding Adaptation in Motmots. Comptes Rendus Biol. 2004, 327, 319–333. [Google Scholar] [CrossRef]
  24. Pascotto, M.C.; Donatelli, R.J. Cranial Osteology in Momotidae (Aves: Coraciiformes). J. Morphol. 2003, 258, 32–48. [Google Scholar] [CrossRef] [PubMed]
  25. Murphy, T.G. Lack of Assortative Mating for Tail, Body Size, or Condition in the Elaborate Monomorphic Turquoise-Browed Motmot (Eumomota superciliosa). Auk 2008, 125, 11–19. [Google Scholar] [CrossRef]
  26. Murphy, T.G. Predator-Elicited Visual Signal: Why the Turquoise-Browed Motmot Wag-Displays Its Racketed Tail. Behav. Ecol. 2006, 17, 547–553. [Google Scholar] [CrossRef]
  27. Murphy, T. Lack of Melanized Keratin and Barbs That Fall off: How the Racketed Tail of the Turquoise-Browed Motmot Eumomota superciliosa Is Formed. J. Avian Biol. 2007, 38, 139–143. [Google Scholar] [CrossRef]
  28. Murphy, T.G. Display of an Inedible Prop as a Signal of Aggression? Adaptive Significance of Leaf-Display by the Turquoise-Browed Motmot, Eumomota Superciliosa. Ethology 2008, 114, 16–21. [Google Scholar] [CrossRef]
  29. Murphy, T.G. Tail-Racket Removal Increases Hematocrit in Male Turquoise-Browed Motmots (Eumomota superciliosa). J. Ornithol. 2010, 151, 241–245. [Google Scholar] [CrossRef]
  30. Murphy, T.G.; Pham, T.T. Condition and Brightness of Structural Blue-Green: Motmot Tail-Racket Brightness Is Related to Speed of Feather Growth in Males, but Not in Females. Biol. J. Linn. Soc. 2012, 106, 673–681. [Google Scholar] [CrossRef] [Green Version]
  31. Nishikawa, E. The Wag-Display of the Blue-Crowned Motmot (Momotus momota) as a Predator-Directed Signal. Undergraduate Honors Thesis, University of Colorado Boulder, Boulder, CO, USA, 2011. [Google Scholar]
  32. Tubaro, P.L.; Mahler, B.; Lijtmaer, D.A. Patterns of Rectrix Rachis Modification in Pintails and the Evolution of Sexually Selected Traits. Biol. J. Linn. Soc. 2005, 86, 477–485. [Google Scholar] [CrossRef]
  33. Martin, R.F.; Scott, P.E.; Martin, M.W. Mate Fidelity and Breeding-Site Specificity of the Turquoise-Browed Motmot. Condor 1989, 91, 217–219. [Google Scholar] [CrossRef]
  34. Scott, P.E.; Martin, R.F. Reproduction of the Turquoise-Browed Motmot at Archaeological Ruins in Yucatan. Biotropica 1983, 8–14. [Google Scholar] [CrossRef]
  35. Scott, P.E.; Martin, R.F. Clutch Size and Fledging Success in the Turquoise-Browed Motmot. Auk 1986, 103, 8–13. [Google Scholar] [CrossRef]
  36. Skutch, A.F. Life History of the Turquoise-Browed Motmot. Auk 1947, 64, 201–217. [Google Scholar] [CrossRef]
  37. Skutch, A.F. Life History of the Blue-Diademed Motmot Momotus momota. IBIS 1964, 106, 321–332. [Google Scholar] [CrossRef]
  38. Chacón-Madrigal, E.; Barrantes, G. Blue-Crowned Motmot (Momotus momota) Predation on a Long-Tongued Bat (Glossophaginae). Wilson Bull. 2004, 116, 108–110. [Google Scholar] [CrossRef]
  39. García-C, J.M.; Zahawi, R.A. Predation by a Blue-Crowned Motmot (Momotus momota) on a Hummingbird. Wilson J. Ornithol. 2006, 118, 261–263. [Google Scholar] [CrossRef]
  40. Remsen, J.V., Jr.; Hyde, M.A.; Chapman, A. The Diets of Neotropical Trogons, Motmots, Barbets and Toucans. Condor 1993, 95, 178–192. [Google Scholar] [CrossRef]
  41. Sandoval-Comte, A.; Degante-González, A.P.; Santiago-Alarcon, D. Predation of White Anole (Anolis laeviventris) by Blue-Crowned Motmot (Momotus momota) in a Montane Forest Reserve in Veracruz, Mexico. Herpetol. Notes 2014, 7, 721–722. [Google Scholar]
  42. Solano-Ugalde, A.; Arcos-Torres, A. Nocturnal Foraging Observations of the Blue-Crowned Motmot (Momotus momota) in San José, Costa Rica. Wilson J. Ornithol. 2008, 120, 653–654. [Google Scholar] [CrossRef]
  43. Thurber, W.A.; Komar, O. Turquoise-Browed Motmot (Eumomota superciliosa) Feeds by Artificial Light. Wilson Bull. 2002, 114, 525–526. [Google Scholar] [CrossRef]
  44. Orejuela, J.E. Niche Relationships between Turquoise-Browed and Blue-Crowned Motmots in the Yucatan Peninsula, Mexico. Wilson Bull. 1980, 9, 229–244. [Google Scholar]
  45. Orejuela, J.E. Comparative Biology of Turquoise-Browed Motmot and Blue-Crowned Motmot in the Yucatan Peninsula Mexico. Living Bird 1977, 16, 193–208. [Google Scholar]
  46. Anciães, M.; Peterson, A.T. Climate Change Effects on Neotropical Manakin Diversity Based on Ecological Niche Modeling. Condor 2006, 108, 778–791. [Google Scholar] [CrossRef]
  47. Langen, T.A.; Berg, E.C. What Determines the Timing and Duration of the Nesting Season for a Tropical Dry Forest Bird, the White-Throated Magpie-Jay (Calocitta formosa)? Wilson J. Ornithol. 2016, 128, 32–42. [Google Scholar] [CrossRef]
  48. Wolfe, J.D.; Ralph, C.J.; Elizondo, P. Changes in the Apparent Survival of a Tropical Bird in Response to the El Niño Southern Oscillation in Mature and Young Forest in Costa Rica. Oecologia 2015, 178, 715–721. [Google Scholar] [CrossRef] [PubMed]
  49. Dal Zotto, M.; Romeo, G.; Aguilar, L.A.M.; Sonetti, D.; Pederzoli, A. The Avian Community of the Karen Mogensen Reserve, a Wealth of Biodiversity within the Poorly Investigated and Threatened Environments of Northwestern Costa Rica. ZooKeys 2017, 722, 101–135. [Google Scholar] [CrossRef] [PubMed]
  50. Lombroso, L.; Teggi, S.; Despini, F.; Costanzini, S. Annuario Delle Osservazioni Meteoclimatiche Dell’anno 2018 Dell’Osservatorio Geofisico Di Modena: L’Osservatorio Restaurato. Atti Soc. Nat. Mat. Modena 2019, 150, 5–34. [Google Scholar]
  51. Griscom, H.P.; Ashton, M.S. Restoration of Dry Tropical Forests in Central America: A Review of Pattern and Process. For. Ecol. Manag. 2011, 261, 1564–1579. [Google Scholar] [CrossRef]
  52. Lugo, A.E.; Brown, S.L.; Dodson, R.; Smith, T.S.; Shugart, H.H. The Holdridge Life Zones of the Conterminous United States in Relation to Ecosystem Mapping. J. Biogeogr. 1999, 26, 1025–1038. [Google Scholar] [CrossRef]
  53. Gregory, R.D.; Gibbons, D.W.; Donald, P.F. Bird Census and Survey Techniques. In Bird Ecology and Conservation; Oxford University Press: Oxford, UK, 2004; pp. 17–56. [Google Scholar]
  54. Bibby, C.J.; Jones, M.; Marsden, S. Bird Surveys; Expedition Advisory Centre: London, UK, 1998. [Google Scholar]
  55. Sutherland, W.J. Ecological Census Techniques: A Handbook, 2nd ed.; Cambridge University Press: Cambridge, UK, 2006; ISBN 0-521-84462-2. [Google Scholar]
  56. Vorisek, P.; Klvanova, A.; Wotton, S.; Gregory, R. A Best Practice Guide for Wild Bird Monitoring Schemes; CSO/RSPB; JAVA: Třeboň, Czech Republic, 2008. [Google Scholar]
  57. Broekema, I.; Overdyck, O. Distance Sampling to Estimate Densities of Four Native Forest Bird Species during Multispecies Surveys. N. Z. J. Ecol. 2012, 36, 1. [Google Scholar]
  58. Buckland, S.T.; Marsden, S.J.; Green, R.E. Estimating Bird Abundance: Making Methods Work. Bird Conserv. Int. 2008, 18, S91–S108. [Google Scholar] [CrossRef]
  59. Buckland, S.T.; Rexstad, E.A.; Marques, T.A.; Oedekoven, C.S. Distance Sampling: Methods and Applications; Springer: Berlin/Heidelberg, Germany, 2015; Volume 431. [Google Scholar]
  60. Buckland, S.T.; Anderson, D.R.; Burnham, K.P.; Laake, J.L. Distance Sampling: Estimate Abundance of Biological Populations; Chapman and Hall: London, UK, 1993; University of St. Andrews; p. 448. [Google Scholar]
  61. Cassey, P.; Craig, J.L.; McArdle, B.H.; Barraclough, R.K. Distance Sampling Techniques Compared for a New Zealand Endemic Passerine (Philesturnus carunculatus rufusater). N. Z. J. Ecol. 2007, 31, 223–231. [Google Scholar]
  62. Thomas, L.; Buckland, S.T.; Rexstad, E.A.; Laake, J.L.; Strindberg, S.; Hedley, S.L.; Bishop, J.R.; Marques, T.A.; Burnham, K.P. Distance Software: Design and Analysis of Distance Sampling Surveys for Estimating Population Size. J. Appl. Ecol. 2010, 47, 5–14. [Google Scholar] [CrossRef] [PubMed]
  63. Gale, G.A.; Round, P.D.; Pierce, A.J.; Nimnuan, S.; Pattanavibool, A.; Brockelman, W.Y. A Field Test of Distance Sampling Methods for a Tropical Forest Bird Community. Auk 2009, 126, 439–448. [Google Scholar] [CrossRef]
  64. Gottschalk, T.K.; Huettmann, F. Comparison of Distance Sampling and Territory Mapping Methods for Birds in Four Different Habitats. J. Ornithol. 2011, 152, 421–429. [Google Scholar] [CrossRef]
  65. Oostra, V.; Gomes, L.G.; Nijman, V. Implications of Deforestation for the Abundance of Restricted-Range Bird Species in a Costa Rican Cloud-Forest. Bird Conserv. Int. 2008, 18, 11–19. [Google Scholar] [CrossRef]
  66. Bibby, C.J.; Hill, D.A.; Burgess, N.D.; Mustoe, S. Bird Census Technique; Academic Press: Cambridge, MA, USA, 2000. [Google Scholar]
  67. Gale, G.A.; Thongaree, S. Density Estimates of Nine Hornbill Species in a Lowland Forest Site in Southern Thailand. Bird Conserv. Int. 2006, 16, 57–69. [Google Scholar] [CrossRef]
  68. Shaw, P.; Shewry, M. Population Density and Habitat Associations of Restricted-Range Bird Species at Ruhija, Bwindi Impenetrable Forest, Uganda. Bird Conserv. Int. 2001, 11, 161–174. [Google Scholar] [CrossRef]
  69. Woog, F.; Renner, S.C.; Fjeldsa, J. Tips for Bird Surveys and Censuses in Countries without Existing Monitoring Schemes. ABC Taxa 2010, 8, 558–586. [Google Scholar]
  70. Marques, T.A.; Thomas, L.; Fancy, S.G.; Buckland, S.T. Improving Estimates of Bird Density Using Multiple-Covariate Distance Sampling. Auk 2007, 124, 1229–1243. [Google Scholar] [CrossRef]
  71. de Gabriel Hernando, M.; Roa, I.; Fernández-Gil, J.; Juan, J.; Fuertes, B.; Reguera, B.; Revilla, E. Trends in Weather Conditions Favor Generalist over Specialist Species in Rear-Edge Alpine Bird Communities. Ecosphere 2022, 13, e3953. [Google Scholar] [CrossRef]
  72. Thiollay, J.-M. Structure, Density and Rarity in an Amazonian Rainforest Bird Community. J. Trop. Ecol. 1994, 10, 449–481. [Google Scholar] [CrossRef]
  73. Terborgh, J.; Robinson, S.K.; Parker III, T.A.; Munn, C.A.; Pierpont, N. Structure and Organization of an Amazonian Forest Bird Community. Ecol. Monogr. 1990, 60, 213–238. [Google Scholar] [CrossRef]
  74. Johnson, E.I.; Stouffer, P.C.; Vargas, C.F. Diversity, Biomass, and Trophic Structure of a Central Amazonian Rainforest Bird Community. Rev. Bras. Ornitol. 2011, 19, 1–16. [Google Scholar]
  75. Robinson, S.K.; Terborgh, J. Bird Community Dynamics along Primary Successional Gradients of an Amazonian Whitewater River. Ornithol. Monogr. 1997, 48, 641–672. [Google Scholar] [CrossRef]
  76. Ribon, R.; Marini, M.Â. Small Territory Sizes and High Densities of Insectivorous Birds in an Atlantic Forest Secondary Fragment, Brazil. Rev. Bras. Ornitol. 2016, 24, 303–313. [Google Scholar] [CrossRef]
  77. Robinson, W.D.; Brawn, J.D. Forest bird community structure in central Panama: Influence of spatial scale and biogeography. Ecol. Monogr. 2000, 70, 209–235. [Google Scholar] [CrossRef]
  78. Miller, B.W.; Miller, C.M. New Information on the Status and Distribution of the Keel-Billed Motmot Electron carinatum in Belize, Central America. Cotinga 1996, 6, 61–64. [Google Scholar]
  79. Renner, S.C. The Blue-Throated Motmot (Aspatha gularis) in the Central Cloud Forests of Guatemala: An Indicator for Primary Forest? Boletín Soc. Antiq. Ornitol. 2005, 15, 16–25. [Google Scholar]
  80. Murphy, P.G.; Lugo, A.E. Ecology of Tropical Dry Forest. Annu. Rev. Ecol. Syst. 1986, 17, 67–88. [Google Scholar] [CrossRef]
  81. Sánchez-Azofeifa, G.A.; Kalacska, M.; do Espírito-Santo, M.M.; Fernandes, G.W.; Schnitzer, S. Tropical Dry Forest Succession and the Contribution of Lianas to Wood Area Index (WAI). For. Ecol. Manag. 2009, 258, 941–948. [Google Scholar] [CrossRef]
  82. Sanchez-Azofeifa, A.; Powers, J.S.; Fernandes, G.W.; Quesada, M. Tropical Dry Forests in the Americas: Ecology, Conservation, and Management; CRC Press: Boca Raton, FL, USA, 2013. [Google Scholar]
  83. Garrigues, R.; Dean, R. The Birds of Costa Rica; Cornell University Press: Ithaca, NY, USA, 2014. [Google Scholar]
  84. Stiles, F.G.; Skutch, A.F. Guide to the Birds of Costa Rica; Cornell University Press: Ithaca, NY, USA, 1989. [Google Scholar]
  85. Visco, D.M.; Michel, N.L.; Boyle, W.A.; Sigel, B.J.; Woltmann, S.; Sherry, T.W. Patterns and Causes of Understory Bird Declines in Human-Disturbed Tropical Forest Landscapes: A Case Study from Central America. Biol. Conserv. 2015, 191, 117–129. [Google Scholar] [CrossRef]
  86. Chapman, C.A.; Chapman, L.J. Density and Growth Rate of Some Tropical Dry Forest Trees: Comparisons between Successional Forest Types. Bull. Torrey Bot. Club 1990, 117, 226–231. [Google Scholar] [CrossRef]
  87. Fagan, M.E.; DeFries, R.S.; Sesnie, S.E.; Arroyo, J.P.; Walker, W.; Soto, C.; Chazdon, R.L.; Sanchun, A. Land Cover Dynamics Following a Deforestation Ban in Northern Costa Rica. Environ. Res. Lett. 2013, 8, 034017. [Google Scholar] [CrossRef]
  88. Gibbs, H.K.; Ruesch, A.S.; Achard, F.; Clayton, M.K.; Holmgren, P.; Ramankutty, N.; Foley, J.A. Tropical Forests Were the Primary Sources of New Agricultural Land in the 1980s and 1990s. Proc. Natl. Acad. Sci. USA 2010, 107, 16732–16737. [Google Scholar] [CrossRef]
  89. La Sorte, F.A.; Jetz, W. Avian Distributions under Climate Change: Towards Improved Projections. J. Exp. Biol. 2010, 213, 862–869. [Google Scholar] [CrossRef] [Green Version]
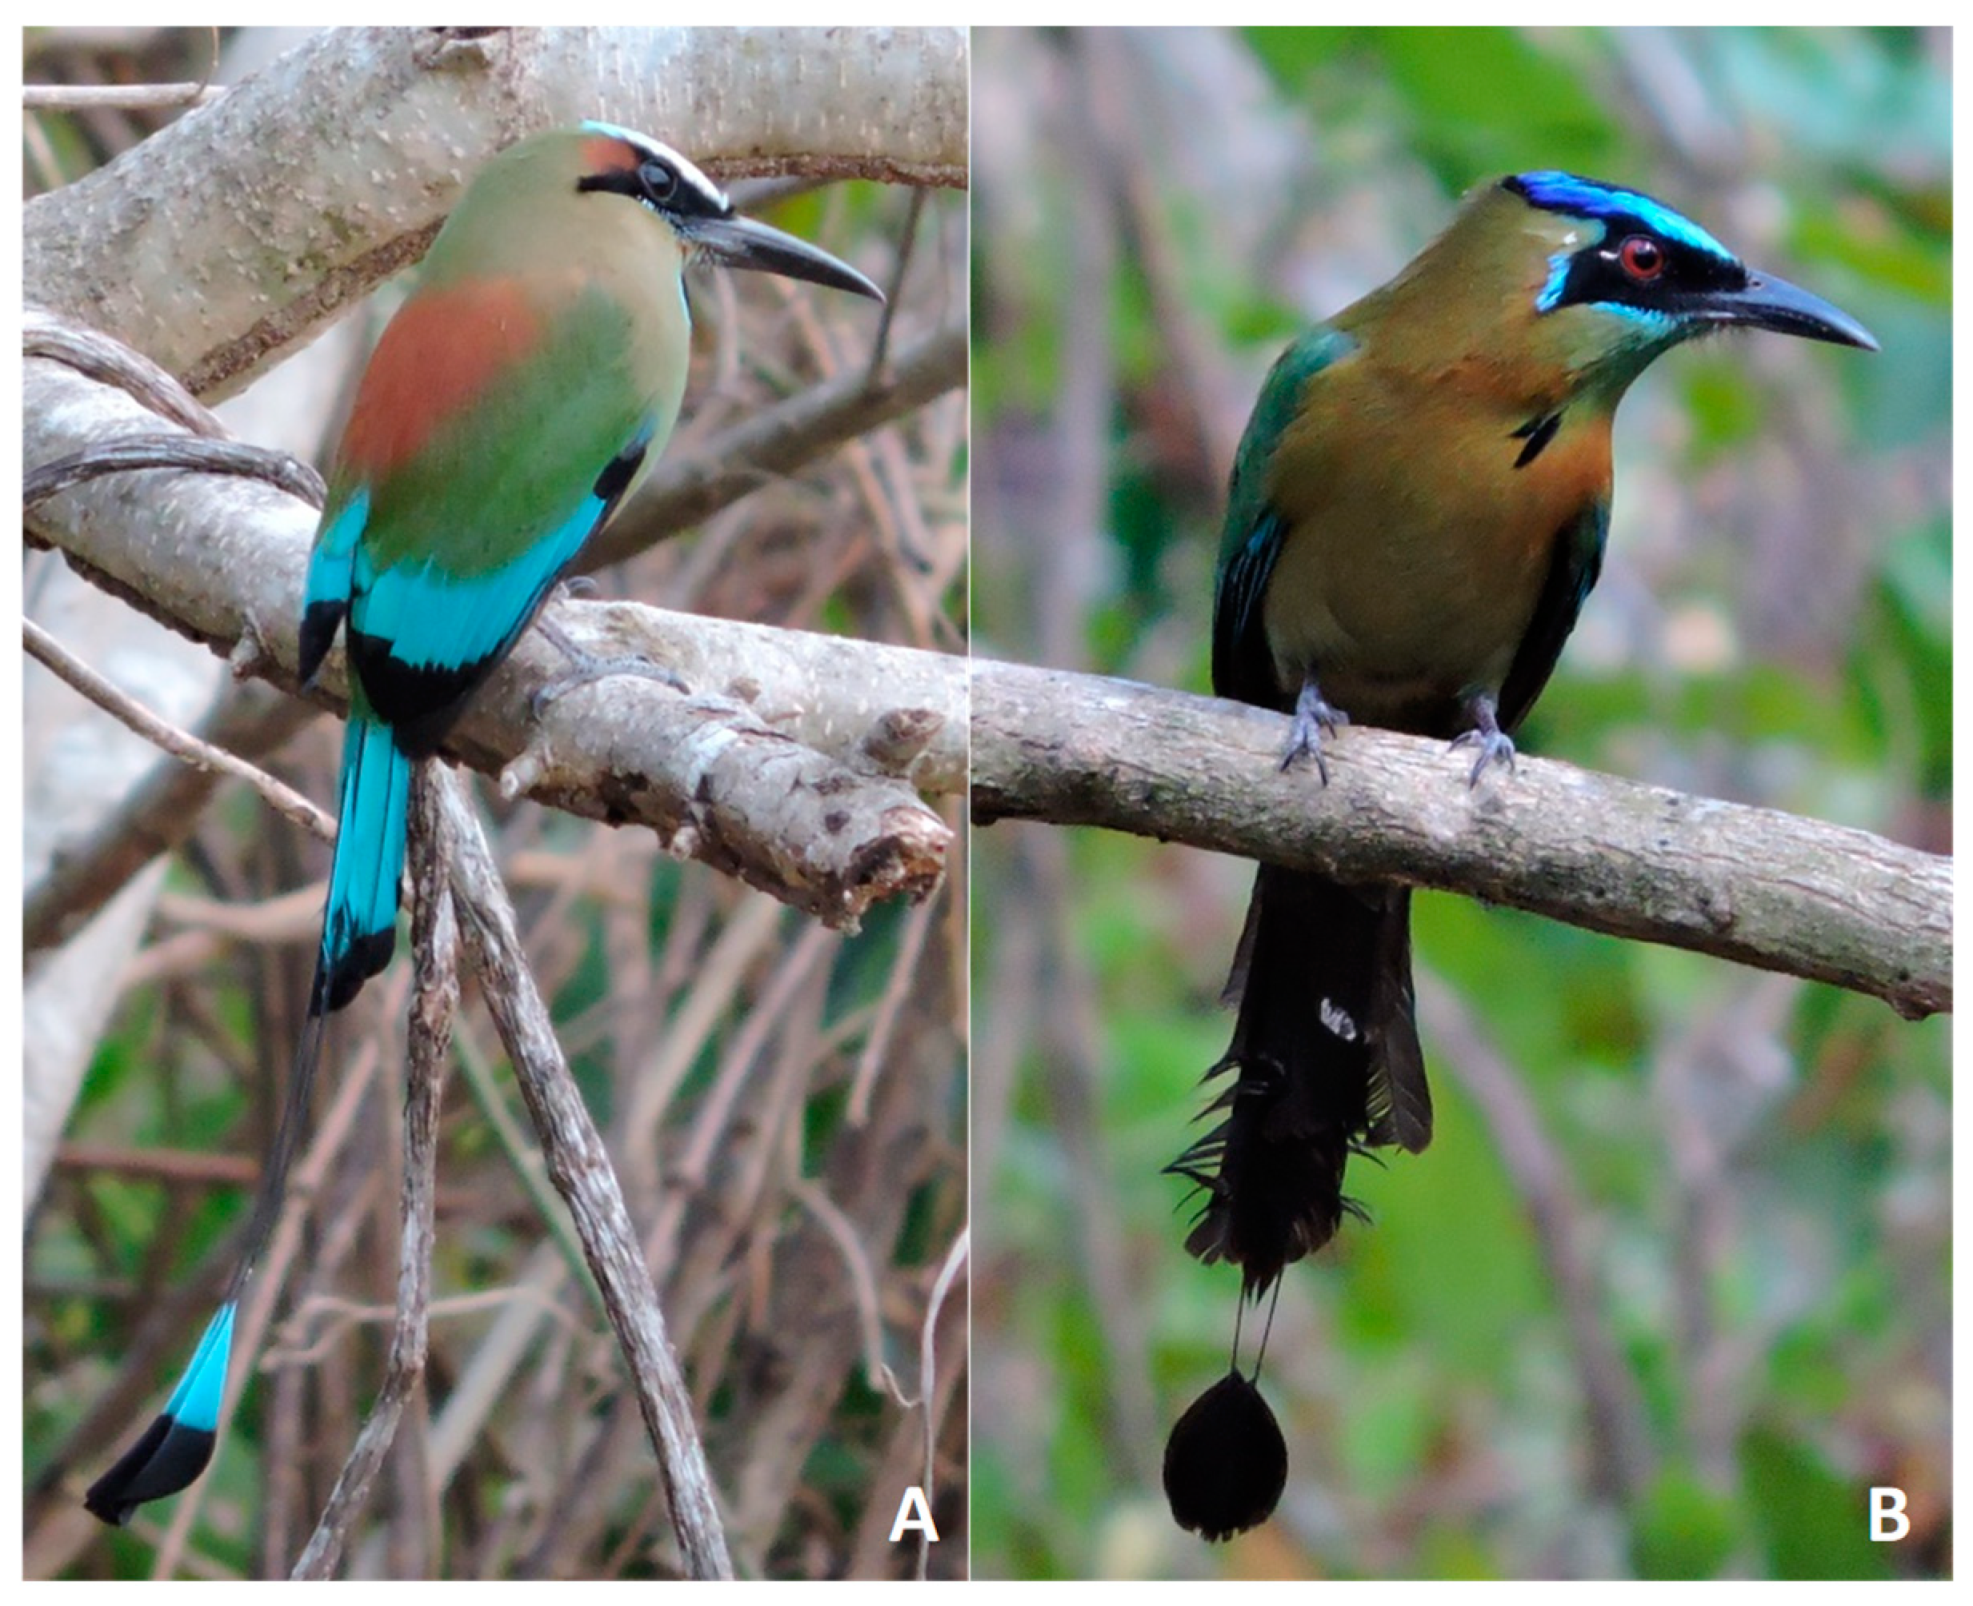
Figure 1. The study’s two target species in the Karen Mogensen Wildlife Refuge, observed at different sites: (A) Eumomota superciliosa; and (B) Momotus lessonii. (Ph: M. Dal Zotto).
Diversity 15 00208 g001
Figure 2. Map of the Karen Mogensen Wildlife Refuge (Costa Rica) with highlighted transects (T1 to T10), watercourses and points of interest. Transects are colored according to the habitat. “Primary transitional moist forest” corresponds to Stratum A (in green), while “Secondary transitional dry forest” corresponds to Stratum B (in orange). “Altered moist forest” transects, which were not considered in the habitat analysis, are shown and correspond to Stratum C (in blue). Map created with software QGIS v. 2.18.
Diversity 15 00208 g002
Figure 3. Map showing all the records of the two species of Momotidae within the Karen Mogensen Wildlife Refuge. Transects covered are coded T1 through T10 and colored differently according to the habitat crossed. Map source: Komoot maps.
Diversity 15 00208 g003
Figure 4. Boxplots of number of detections for the two species (E. superciliosa on the left, M. lessonii on the right) obtained through the Distance Sampling method between February and March 2019. Stratum A (in green): primary transitional moist forest; stratum B (in orange): secondary transitional dry forest. Altered transects (T7 and 78) are reported (stratum C; in grey) although not included in the habitat analysis. For each transect (X-axis), values of the three replicates are shown (black dots).
Diversity 15 00208 g004
Figure 5. Cluster Analysis using the Bray–Curtis similarity measure on the detection of the two target species (E. superciliosa and M. lessonii) in the different strata sampled within the Karen Mogensen Wildlife Refuge. Top: dendrogram including all transects (T1–T10); bottom: dendrogram excluding T7 and T8. Stratum A (in green): primary transitional moist forest; stratum B (in orange): secondary transitional dry forest; stratum C (in grey): altered transects.
Diversity 15 00208 g005
Disclaimer/Publisher’s Note: The statements, opinions and data contained in all publications are solely those of the individual author(s) and contributor(s) and not of MDPI and/or the editor(s). MDPI and/or the editor(s) disclaim responsibility for any injury to people or property resulting from any ideas, methods, instructions or products referred to in the content.