Article

Species Diversity and Soil Interconstraints Exert Significant Influences on Plant Survival during Ecological Restoration in Semi-Arid Mining Areas

1
School of Land Science and Technology, China University of Geosciences, Beijing 100083, China
2
Key Laboratory of Land Consolidation and Rehabilitation, Ministry of Natural Resources, Beijing 100035, China
3
Technology Innovation Center of Ecological Restoration Engineering in Mining Area, Ministry of Natural Resources, Beijing 100083, China
4
College of Environmental and Resource Sciences, Shanxi University, Taiyuan 030006, China
5
College of Resource and Environment, Shanxi Agricultural University, Jinzhong 030801, China
*
Author to whom correspondence should be addressed.
Diversity 2023, 15(10), 1100; https://doi.org/10.3390/d15101100
Submission received: 18 September 2023 / Revised: 21 October 2023 / Accepted: 21 October 2023 / Published: 22 October 2023

Abstract

:
The extensive vegetation destruction in opencast mining regions has led to various environmental problems, including the loss of biodiversity. However, our understanding of biodiversity’s response to survival, as well as its interactions with soil characteristics and climate change, remains limited. To address this gap, we analyzed data from a long-term monitoring site in an opencast coal mine reclamation region, focusing on the effects of species diversity, soil properties, and climate factors on the survival of four key restored species at 17, 22, and 27 years after planting. Our findings indicate that increased plot diversity is associated with decreased overall survival, and significant variations in diversity levels were observed among different plots. We also found that soil properties influenced species’ survival response to diversity, and these responses varied with stand age. In the early stages of succession, soil and diversity primarily affect species survival, with diversity playing a more dominant role as stand age increases. Overall, our findings suggest that the interaction between species diversity and soil composition significantly influences the survival of species. Continuous monitoring is necessary to validate these conclusions, particularly considering the diverse planting patterns in mine reclamation areas that can result in varying feedbacks of biodiversity on species survival.

1. Introduction

Large-scale coal mining has indeed contributed to human prosperity in recent decades. However, the areas that remain after mining, such as waste dump, have also had detrimental effects on the ecological environment. In particular, the extensive eradication and disappearance of vegetation in these areas have led to several environmental issues, including the loss of biodiversity, soil erosion, and desertification. It is worth noting that a significant number of China’s opencast coal mines, including the Pingshuo opencast mine in the Loess Hills [1], are situated in ecologically vulnerable dry and semi-arid northern regions. Given the strong evidence indicating that revegetation promotes biodiversity and enhances ecosystem services [2], it becomes imperative to undertake reforestation efforts in these regions. Furthermore, understanding the long-term effects of revegetation is crucial, as it takes years, or even decades, for plantations to grow and establish themselves. Therefore, regular monitoring of successful plantations is essential to ensure the maturity and survival of the trees [3]. According to certain studies, the assessment of the survival rates of plants provides valuable insights into their adaptation to the surrounding environment [4,5].
The survival rates of plants, including slow-growing or statically developing ones, provide an indication of the number of plants that are still alive and thriving [6]. Decreased survival and growth can lead to instability in plant populations within the forest, ultimately hindering restoration efforts [7]. Survival serves as a crucial link between ecosystem function and community dynamics [8]. Additionally, it has been suggested that species composition can influence survival probabilities, with dominant species in a stand potentially maintaining consistent survival rates over time from an ecological perspective [9]. Other research proposes that factors such as low nutritional status [10], interspecific competition [11], and shifting environmental conditions may contribute to lower survival rates [12]. However, few studies, especially those considering long-term data, have examined the influence of other factors on species survival [13]. Moreover, due to the challenges associated with accurately determining stand ages, particularly in large-scale surveys, stand age variables are not frequently utilized in survival studies [14].
Both abiotic and biotic factors can influence survival. In the abiotic environment, soil nutrients play a vital role in the ecosystem by supporting the survival and development of trees [15]. During the early stages of reclamation, nutrient accumulation in mine soil is particularly important for plant growth, as most plant mortality occurs during the establishment phase, while established plants tend to survive well [16]; although the input of nutrients such as SOC and N in mine soils is relatively low compared to woodland or agricultural land, their availability directly affects plant survival [17]. While the effects of pathogens and soil microorganisms on plant survival have been extensively studied [18,19], research on the impact of soil nutrients on plant survival is limited. Unlike soil nutrients, topographic variables indirectly influence plant distribution and species composition by regulating factors such as soil water availability, light, and climate [20]. Changes in climate, including increased dryness and the density of trees, can have detrimental effects on tree development and ultimately lead to reduced tree survival [21,22]. Historical data from the arid and semi-arid regions of northern China since 1949 indicate that only 15% of newly planted trees have survived, highlighting the positive connection between the survival rate of newly planted trees and temperature and rainfall [23]. Furthermore, this environmental change has had a profound impact on the biodiversity of ecosystems [24].
The diversity of plant species can influence tree survival in biotic environments. The risk of tree mortality due to density-constraining effects decreases as plant species diversity increases, which can promote tree survival [25]. However, it has also been observed that increased species diversity enhances stand productivity while simultaneously intensifying competition for resources among trees, thereby inhibiting tree survival [26]. In restoration sites, tree diversity and richness progressively increase as the stand ages [27]. For instance, researchers have concluded that the biodiversity of planted forests grows over time, indicating that species capable of thriving in diverse mixed stands have a higher likelihood of survival [28]. The reclaimed lands of the Pingshuo mine are undergoing a self-sustaining succession process. For example, it was observed that the abundance of Robinia pseudoacacia (R. pseudoacacia) decreased over time in the forests where it was present, while the number of Ulmus pumila (U. pumila) trees increased. On the other hand, other tree species like Pinus tabuliformis (P. tabuliformis) thrived in many early trials due to their ability to counteract unfavorable environmental factors [29], including the positive effect of interplanting on species survival. Different species exhibit different responses, leading to a “buffer effect” in various forests under environmental disturbances, where few individuals are at risk of dying simultaneously. The higher performance of each species under certain environmental conditions contributes to the “performance-enhancing effect” and leads to higher average community performance [30]. Mixed-species forests may fare better in the absence of environmental disruption, primarily due to lower interspecific rivalry compared to intraspecific competition, known as the “complementarity effect,” which arises from trees occupying complementary niches [31]. However, few studies, particularly in plantations, have investigated the impact of species diversity on species survival.
Long-term monitoring in restoration initiatives has encountered significant challenges and remains inadequately developed in many cases. The lack of clarity in restoration goals further complicates the monitoring process [32]. Similarly, overly simplistic targets can yield information of limited utility, mirroring the findings from monitoring efforts [33]. While there has been a growing focus on studying changes in vegetation survival and mortality via NDVI analysis in recent years [34], the specific causes of vegetation mortality still remain unknown. To address the aforementioned research gap, we conducted an investigation using a long-term dataset from artificially guided plantings in the land reclamation area of the China Coal Pingshuo mine. We examined the survival rates of four major restored tree species across three time series in fixed monitoring sample plots and compared various traits, including diversity, age, and soil characteristics, between two different sites.
Based on the above introduction (Figure 1), we formulated the following hypotheses: (1) species composition can influence survival probabilities; (2) species diversity facilitates tree development; (3) favorable soil nutrients and weather conditions enhance tree survival.

2. Materials and Methods
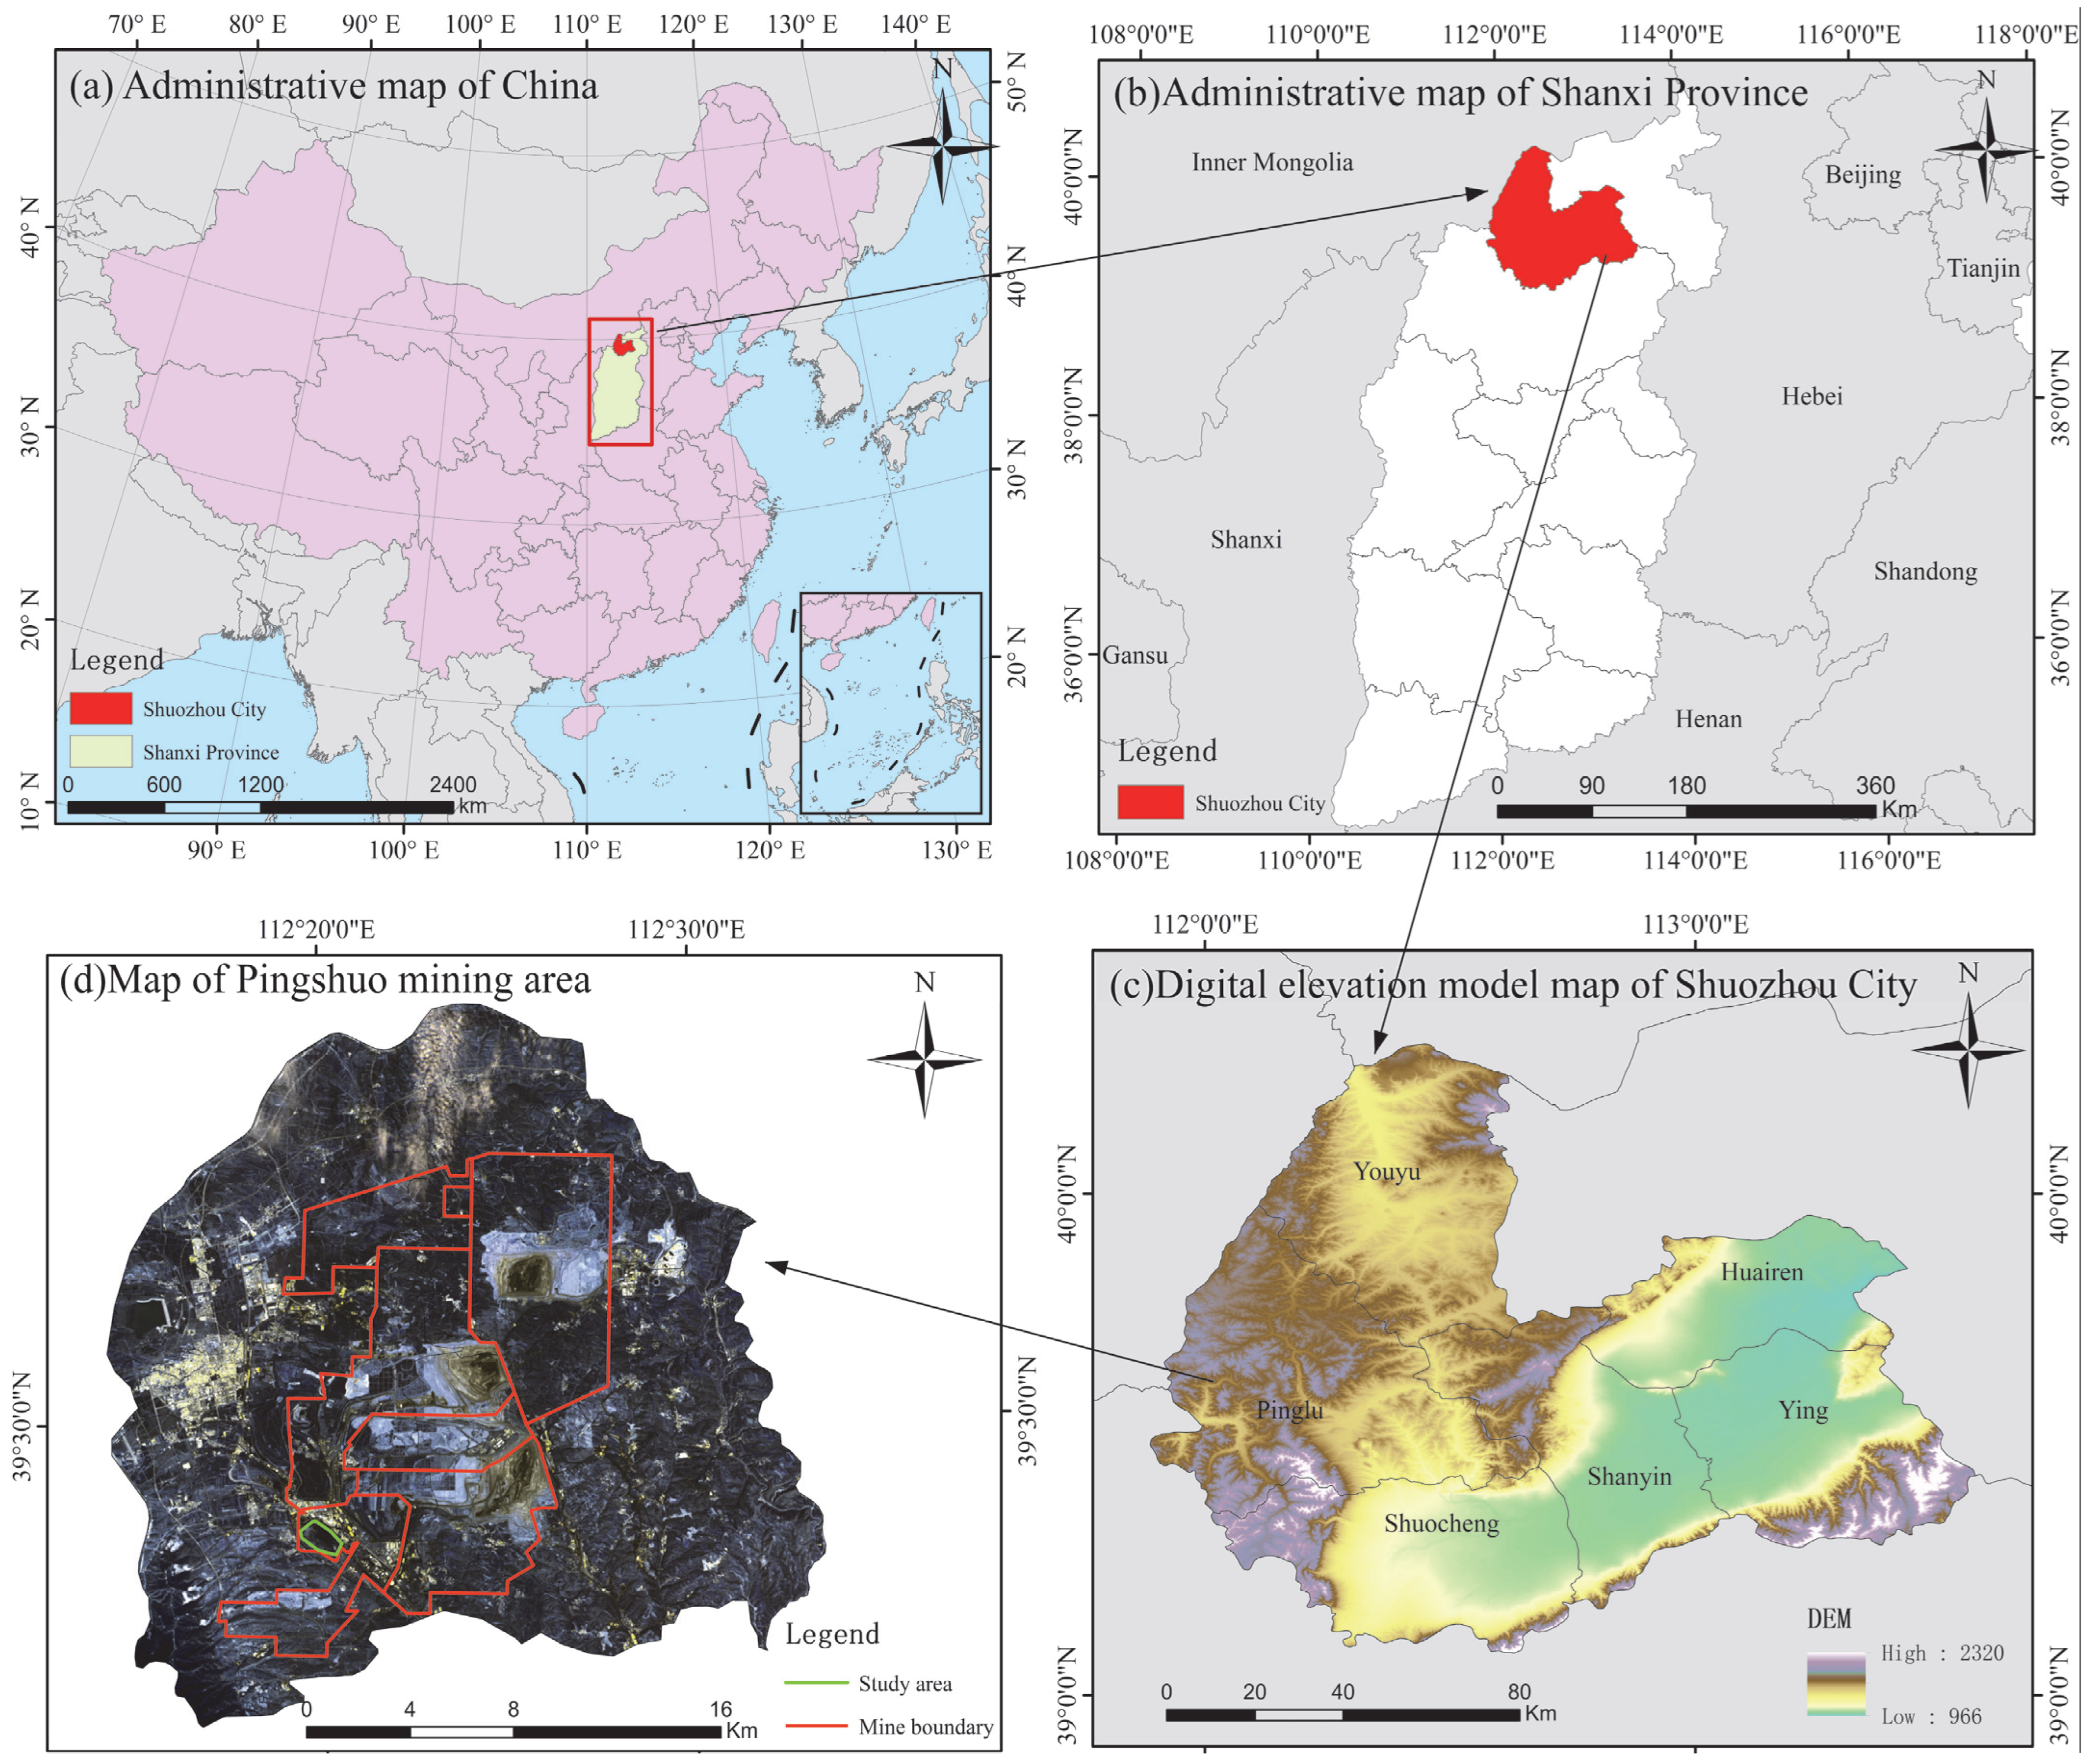
2.1. Study Sites

The study area is located at the fixed monitoring base in the south waste dump of China Coal Pingshuo Antaibao Mine in Pinglu District, Shuozhou City, Shanxi Province (Figure 2). The geographic coordinates of the area are 112°10′–113°30′ E and 39°23′–39°37′ N. The research region has a continental monsoon climate, characterized by dry, chilly, and low temperatures. The average annual temperature ranges from 5.4 to 13.8 °C. The annual precipitation in the area varies greatly, ranging from 345.3 to 682.2 mm. The zonal soils in this region are in the transition zone between chestnut-calcium soils and chestnut-calcium brown soils. Drought-tolerant plants such as Stipa bungcana (Perennial herbaceous plants of the genus Stipa in the Poaceae family), Stipa krylovii (Perennial herbaceous plants of the genus Stipa in the Poaceae family), Agropyron cristatum (Perennial herbaceous plants of the Gramineae family and the Ice Grass genus), Thymus mongolicus (Small semi shrubs of the genus Thyme in the family Labiatae), and Lespedeza davurica (Leguminous shrubs of the genus Lespedeza) are widely distributed in the area. Land reclamation efforts began in 1993, and in 2010, a permanent fixed monitoring base was established; monitoring is conducted every five years [35].

2.2. Sample Plot Setting

The vegetation suffered severe damage following mining activities (Figure S1A,B). We established two plots for our study: a flat plot measuring 1 hm2 (100 × 100 m), where a mixed forest of R. pseudoacacia, U. pumila, and Ailanthus altissima (A. altissima) was planted, and a sloping plot measuring 0.8 hm2 (100 × 80 m), where a mixed forest of R. pseudoacacia and P. tabuliformis was planted (Figure S1C,D). The specific planting patterns for these plots are presented in Table S2. To evaluate species survival, we analyzed three time series: 1993–2010, 1993–2015, and 1993–2020. These periods correspond to 17, 22, and 27 years of vegetation recovery, respectively. We calculated the conditional probability of survival, which represents the number of trees alive at the end of the interval divided by the number of individuals alive at the beginning of the interval. Additionally, each sample plot was further divided into 100 smaller sample squares for the 1 hm2 plots and 80 smaller sample squares for the 0.8 hm2 plots. Our study encompassed a total of 180 plots measuring 10 m × 10 m, and Table S1 provides the number of surviving species for each plot. We assessed the survival rate of the trees within each sample plot and compared the results between the two plots.

2.3. Sample Plot Survey

After mining operations, the soil in the study region experienced significant degradation (Figure S2). The majority of the excavated soil was deposited into a dumpsite. The soil used for paving purposes consisted primarily of loess, occasionally mixed with a small amount of coal gangue and gravel. The soil texture generally ranged from sandy loam to loam. The loess parent material in plots I and II directly covered the ground surface to a thickness of approximately 1 m [36].
To divide the sampled region, nine grids measuring 30 × 30 m were utilized, with each grid node serving as a reference point for sampling. Subsequently, two locations were randomly chosen within each of the eight directions from each reference point, at distances of 2 m, 5 m, or 15 m, for additional sampling. Thus, a total of 84 soil-sampling points were included in this study (Figure S3). The pH, organic carbon (SOC), total nitrogen (TN), available phosphorus (AP), and available potassium (AK) of the soil were analyzed in this study [37]. The 84 soil-sampling data points from the two sample plots were interpolated separately. Using the kriging method, the five soil factors from the 84 points were interpolated into each 10 m × 10 m small sample square. Each small sample square represented a soil-sampling value.
The temperature and precipitation data for the Pinglu District, Shuozhou City, Shanxi Province, were obtained from the China Meteorological Data Service Centre (https://data.cma.cn(accessed on 12 December 2022)) and used in the analysis of this study.

2.4. Statistical Analysis

Three diversity metrics are commonly employed in the extensive body of literature on ecological diversity. While the species richness metric calculates the number of species, it does not consider species frequency. In order to address this limitation, the Shannon Diversity Index was developed as an information theory tool, initially used as an indicator of entropy. Previously, the Simpson Index of Ecological Diversity was used to assess ecological disparity. These three indices belong to the same family of one-parameter diversity indices and exhibit close interconnections (Table 1) [38].
Margalef’s   index   ( M ) :   M = ( S 1 ) / I n N
Simpson’s   index   ( D ) :   D = 1 i = 1 s   p i 2
Shannon - Wiener   index   ( H’ ) :   H = i = 1 s p i   I n p i
In this paper, the Pearson correlation coefficient is used to study whether there is correlation between variables, and the data conforms to normal distribution. Structural equation modeling (SEM) is a statistical approach utilized in ecology to elucidate intricate interactions. It offers a hypothesis-based framework for investigating the structural connections between variables [39]. Within this framework, latent variables are formed by observed variables, leading to a hierarchical model structure and providing a robust means of representing comprehensive hypotheses in ecology [40]. In our study, SEM was implemented using the ‘lavaan’ R package [41].
All analyses were conducted using R 4.2.3 and SPSS 20.0.

3. Results

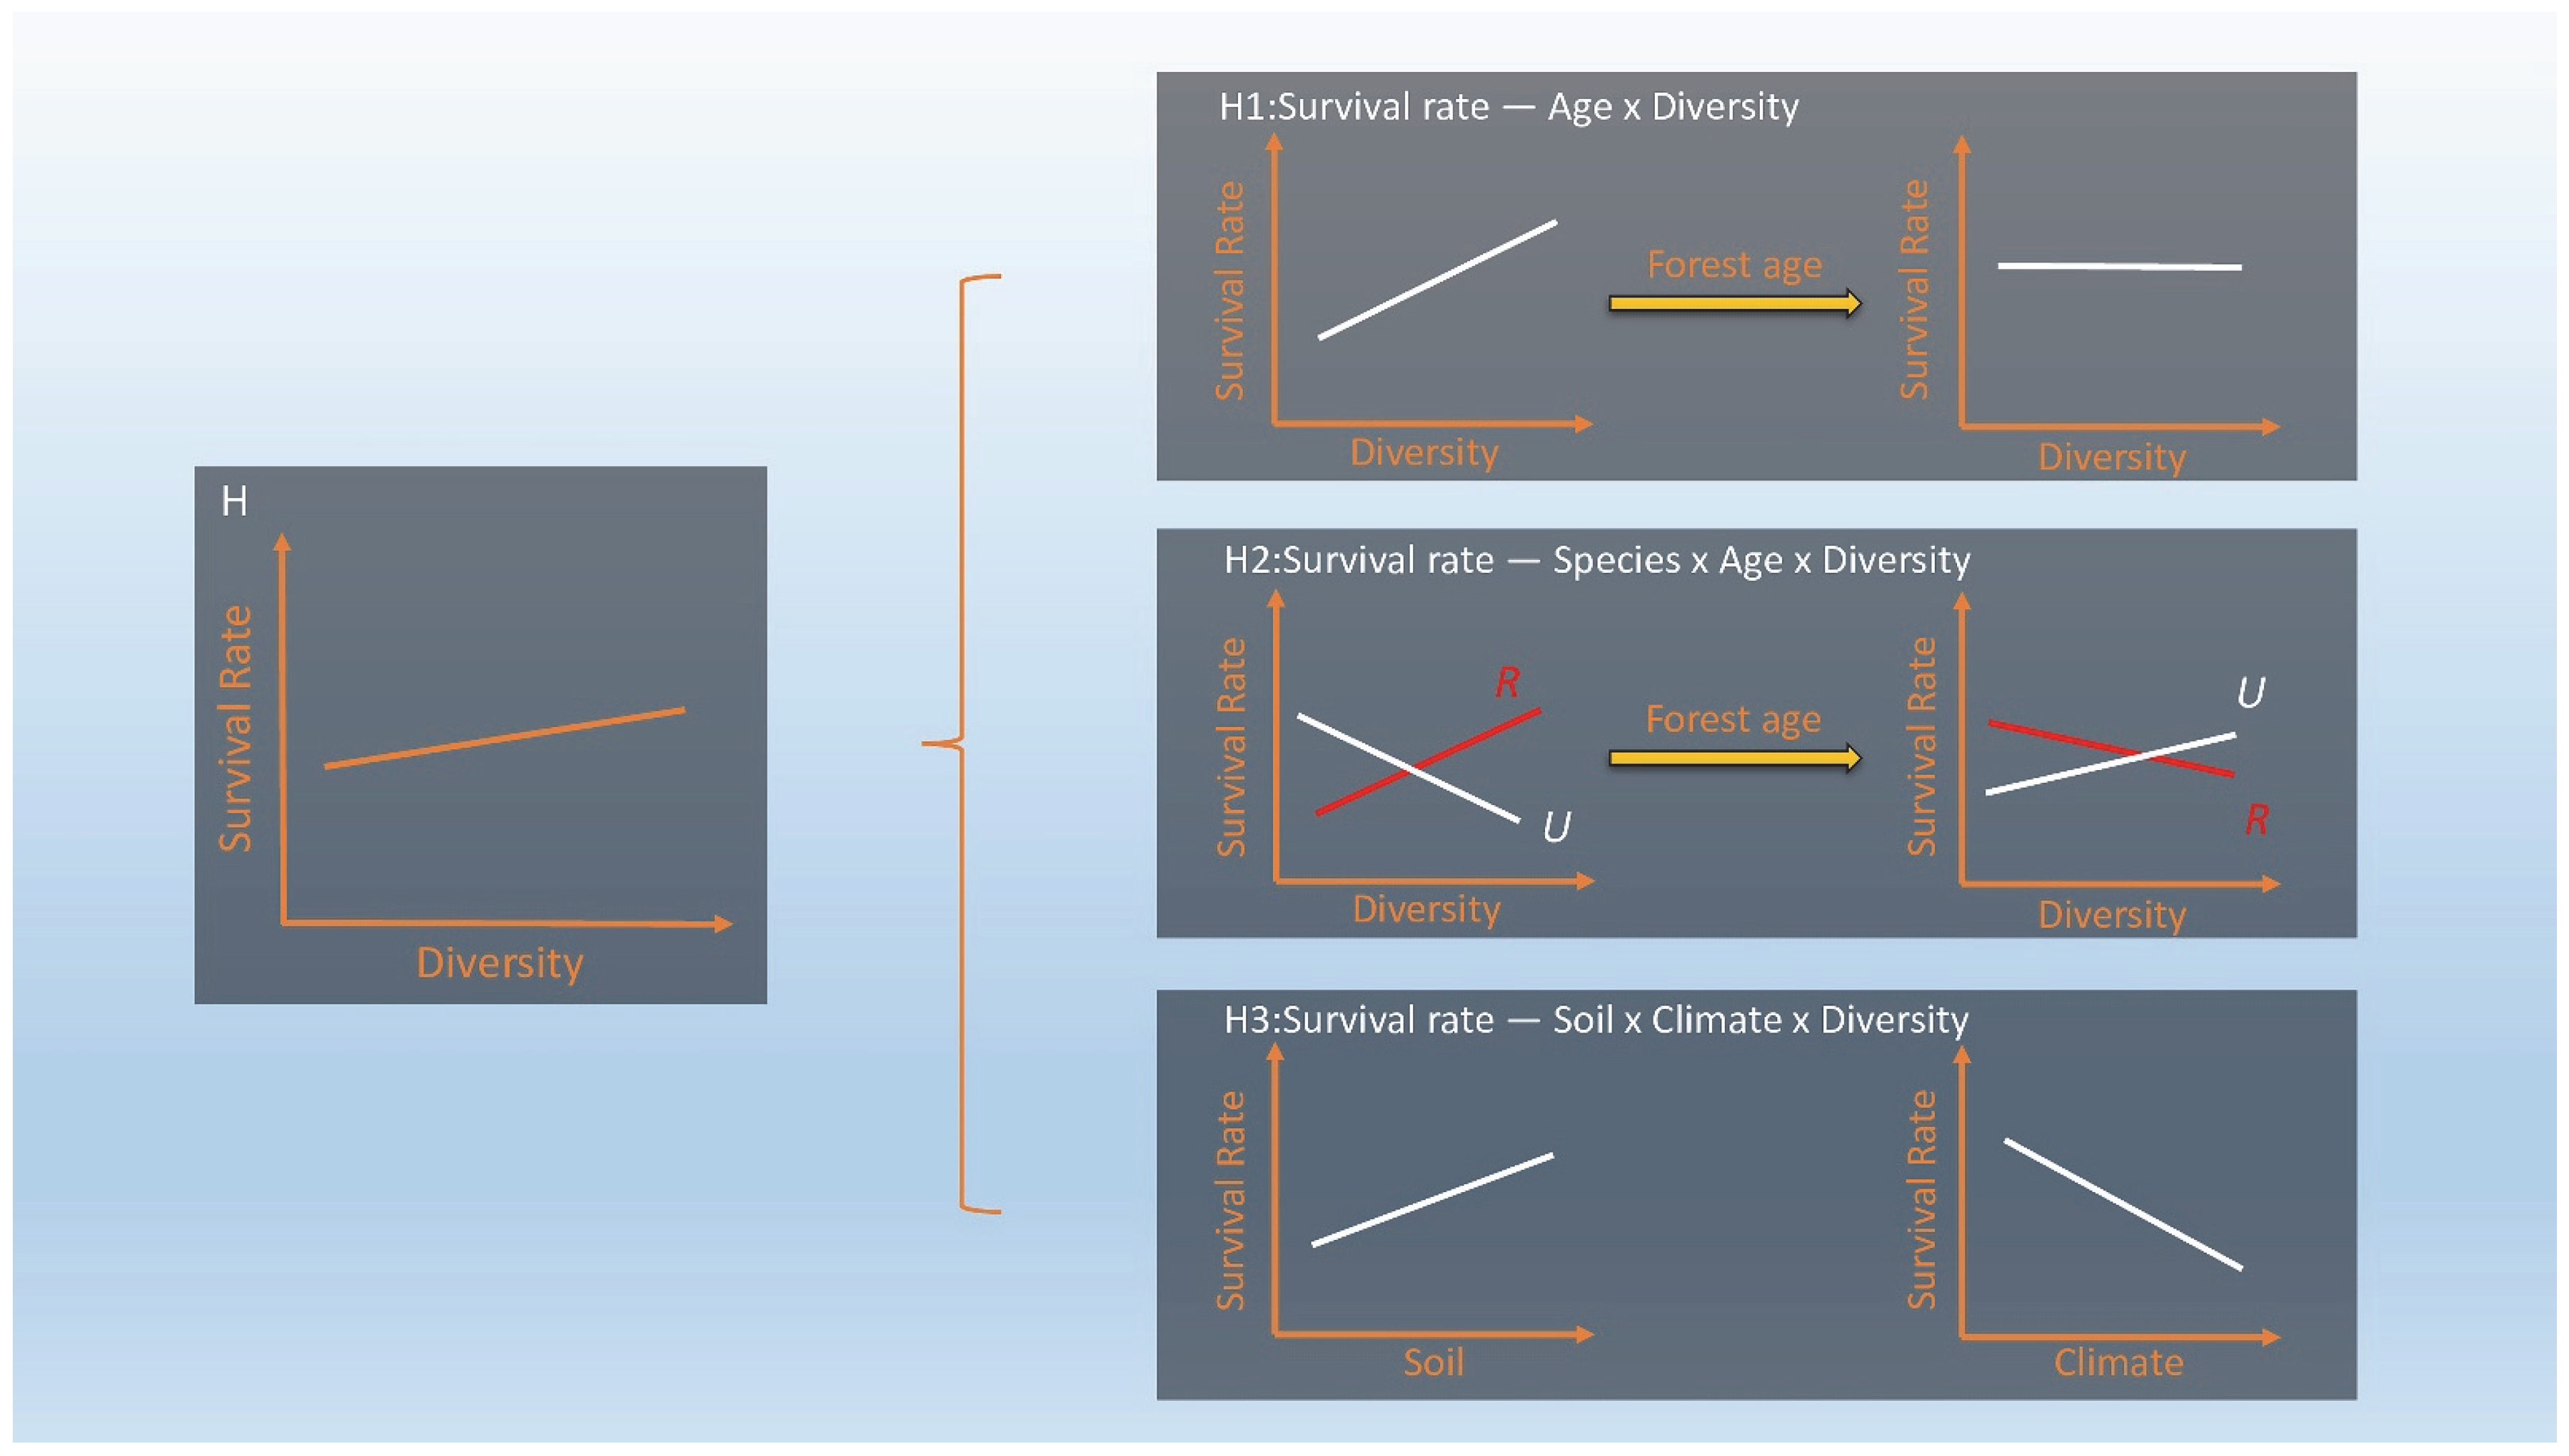
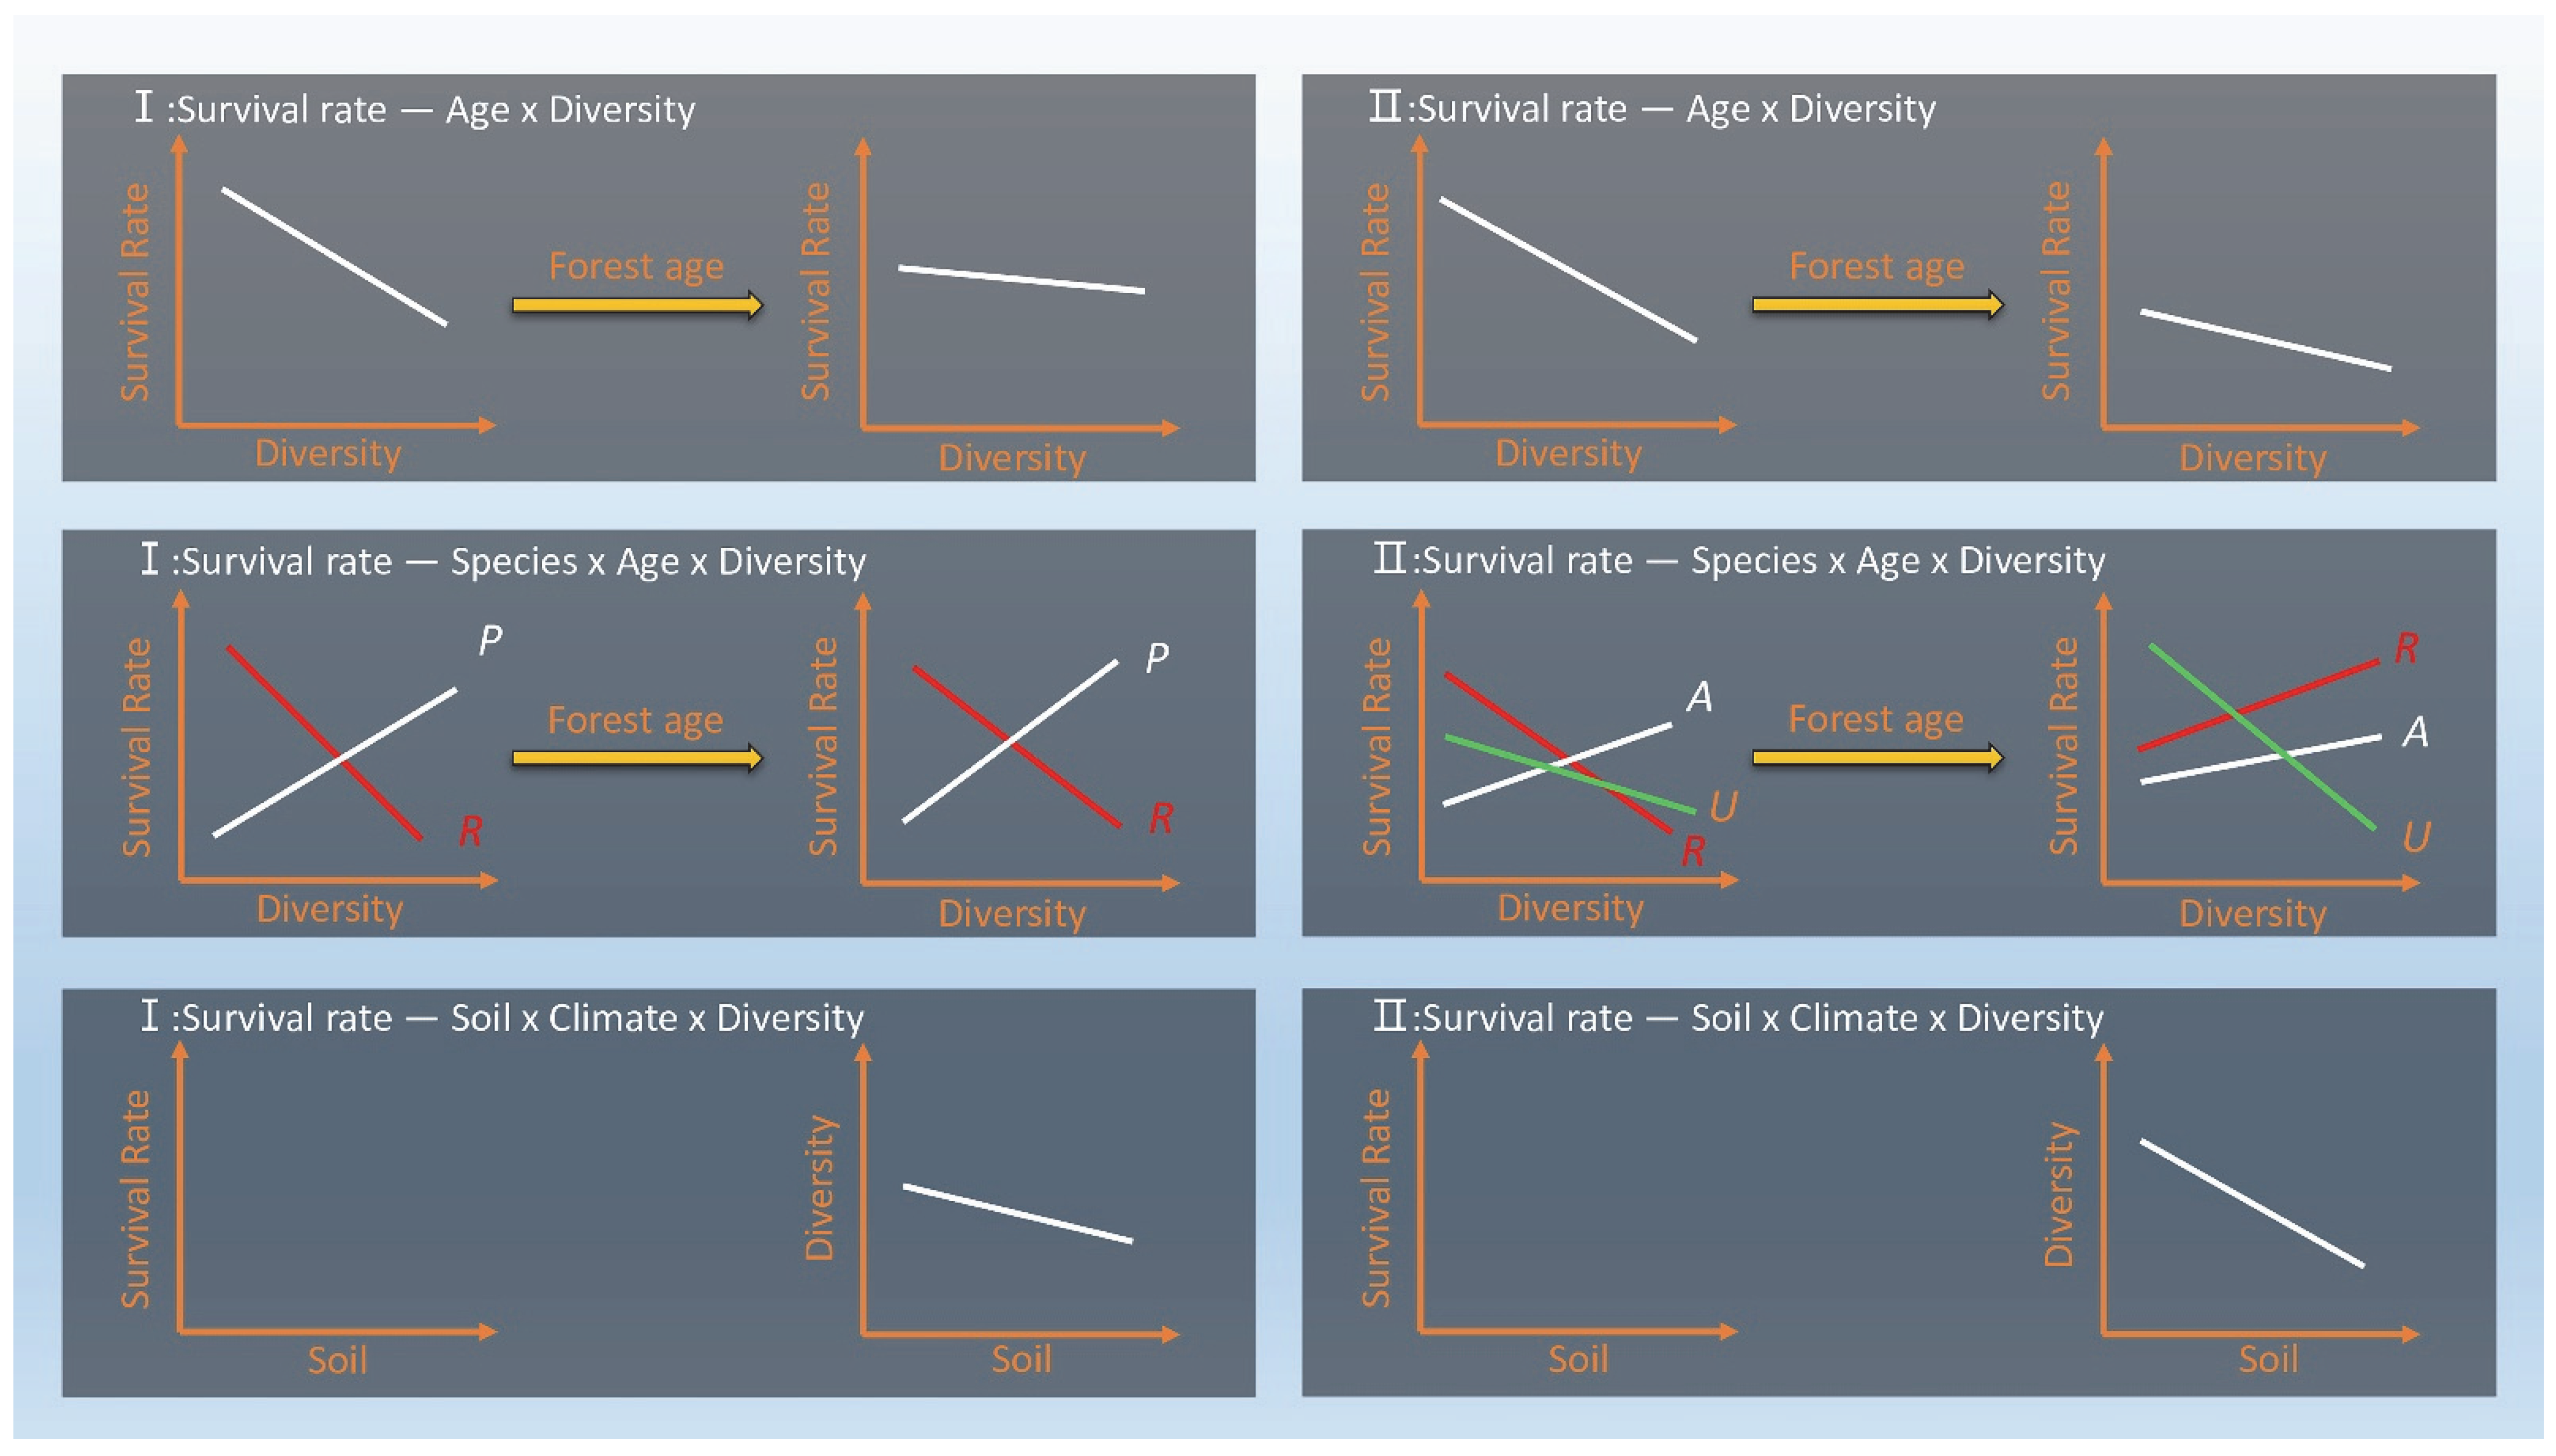
3.1. Survival Tends to Decrease with Stand Age and Diversity (H1)

As can be seen from Table 2, the total species survival rate in Sample Site I (R. pseudoacaciaP. tabuliformis) was 100%, 58.66%, 57.23%, and 57.01%, the total species survival rate decreased with the increase in forest age and diversity, and the species survival rate decreased seriously before the establishment of the fixed monitoring base (before 2010), and then stabilized; the total species survival rate in Sample Site II (R. pseudoacacia–U. pumila–A. altissima) was 100%, 33.02%, 31.73%, and 47%, and the total species survival rate decreased at the 17th and 22nd year, and increased at the 27th year, while the diversity was the opposite of the total survival rate (Table 3).

3.2. Different Species Show Differential Survival Responses to Diversity and with Stand Age (H2)

The survival rates of various species at different stand ages were significantly associated with species diversity at site I (Table 4, Figure S4). However, P. tabuliformis exhibited a positive correlation with diversity, while R. pseudoacacia showed a negative correlation. This indicated that, although species’ survival responses to diversity varied within the group, they remained consistent over time.
The association between acacia survival and species diversity exhibited changes as the stand age increased at Site II (Table 5, Figure S5). U. pumila and A. altissima did not show any significant alterations; U. pumila remained negatively correlated, while A. altissima remained positively correlated. Initially, R. pseudoacacia displayed a negative correlation with species diversity, but this relationship turned positive at year 27.

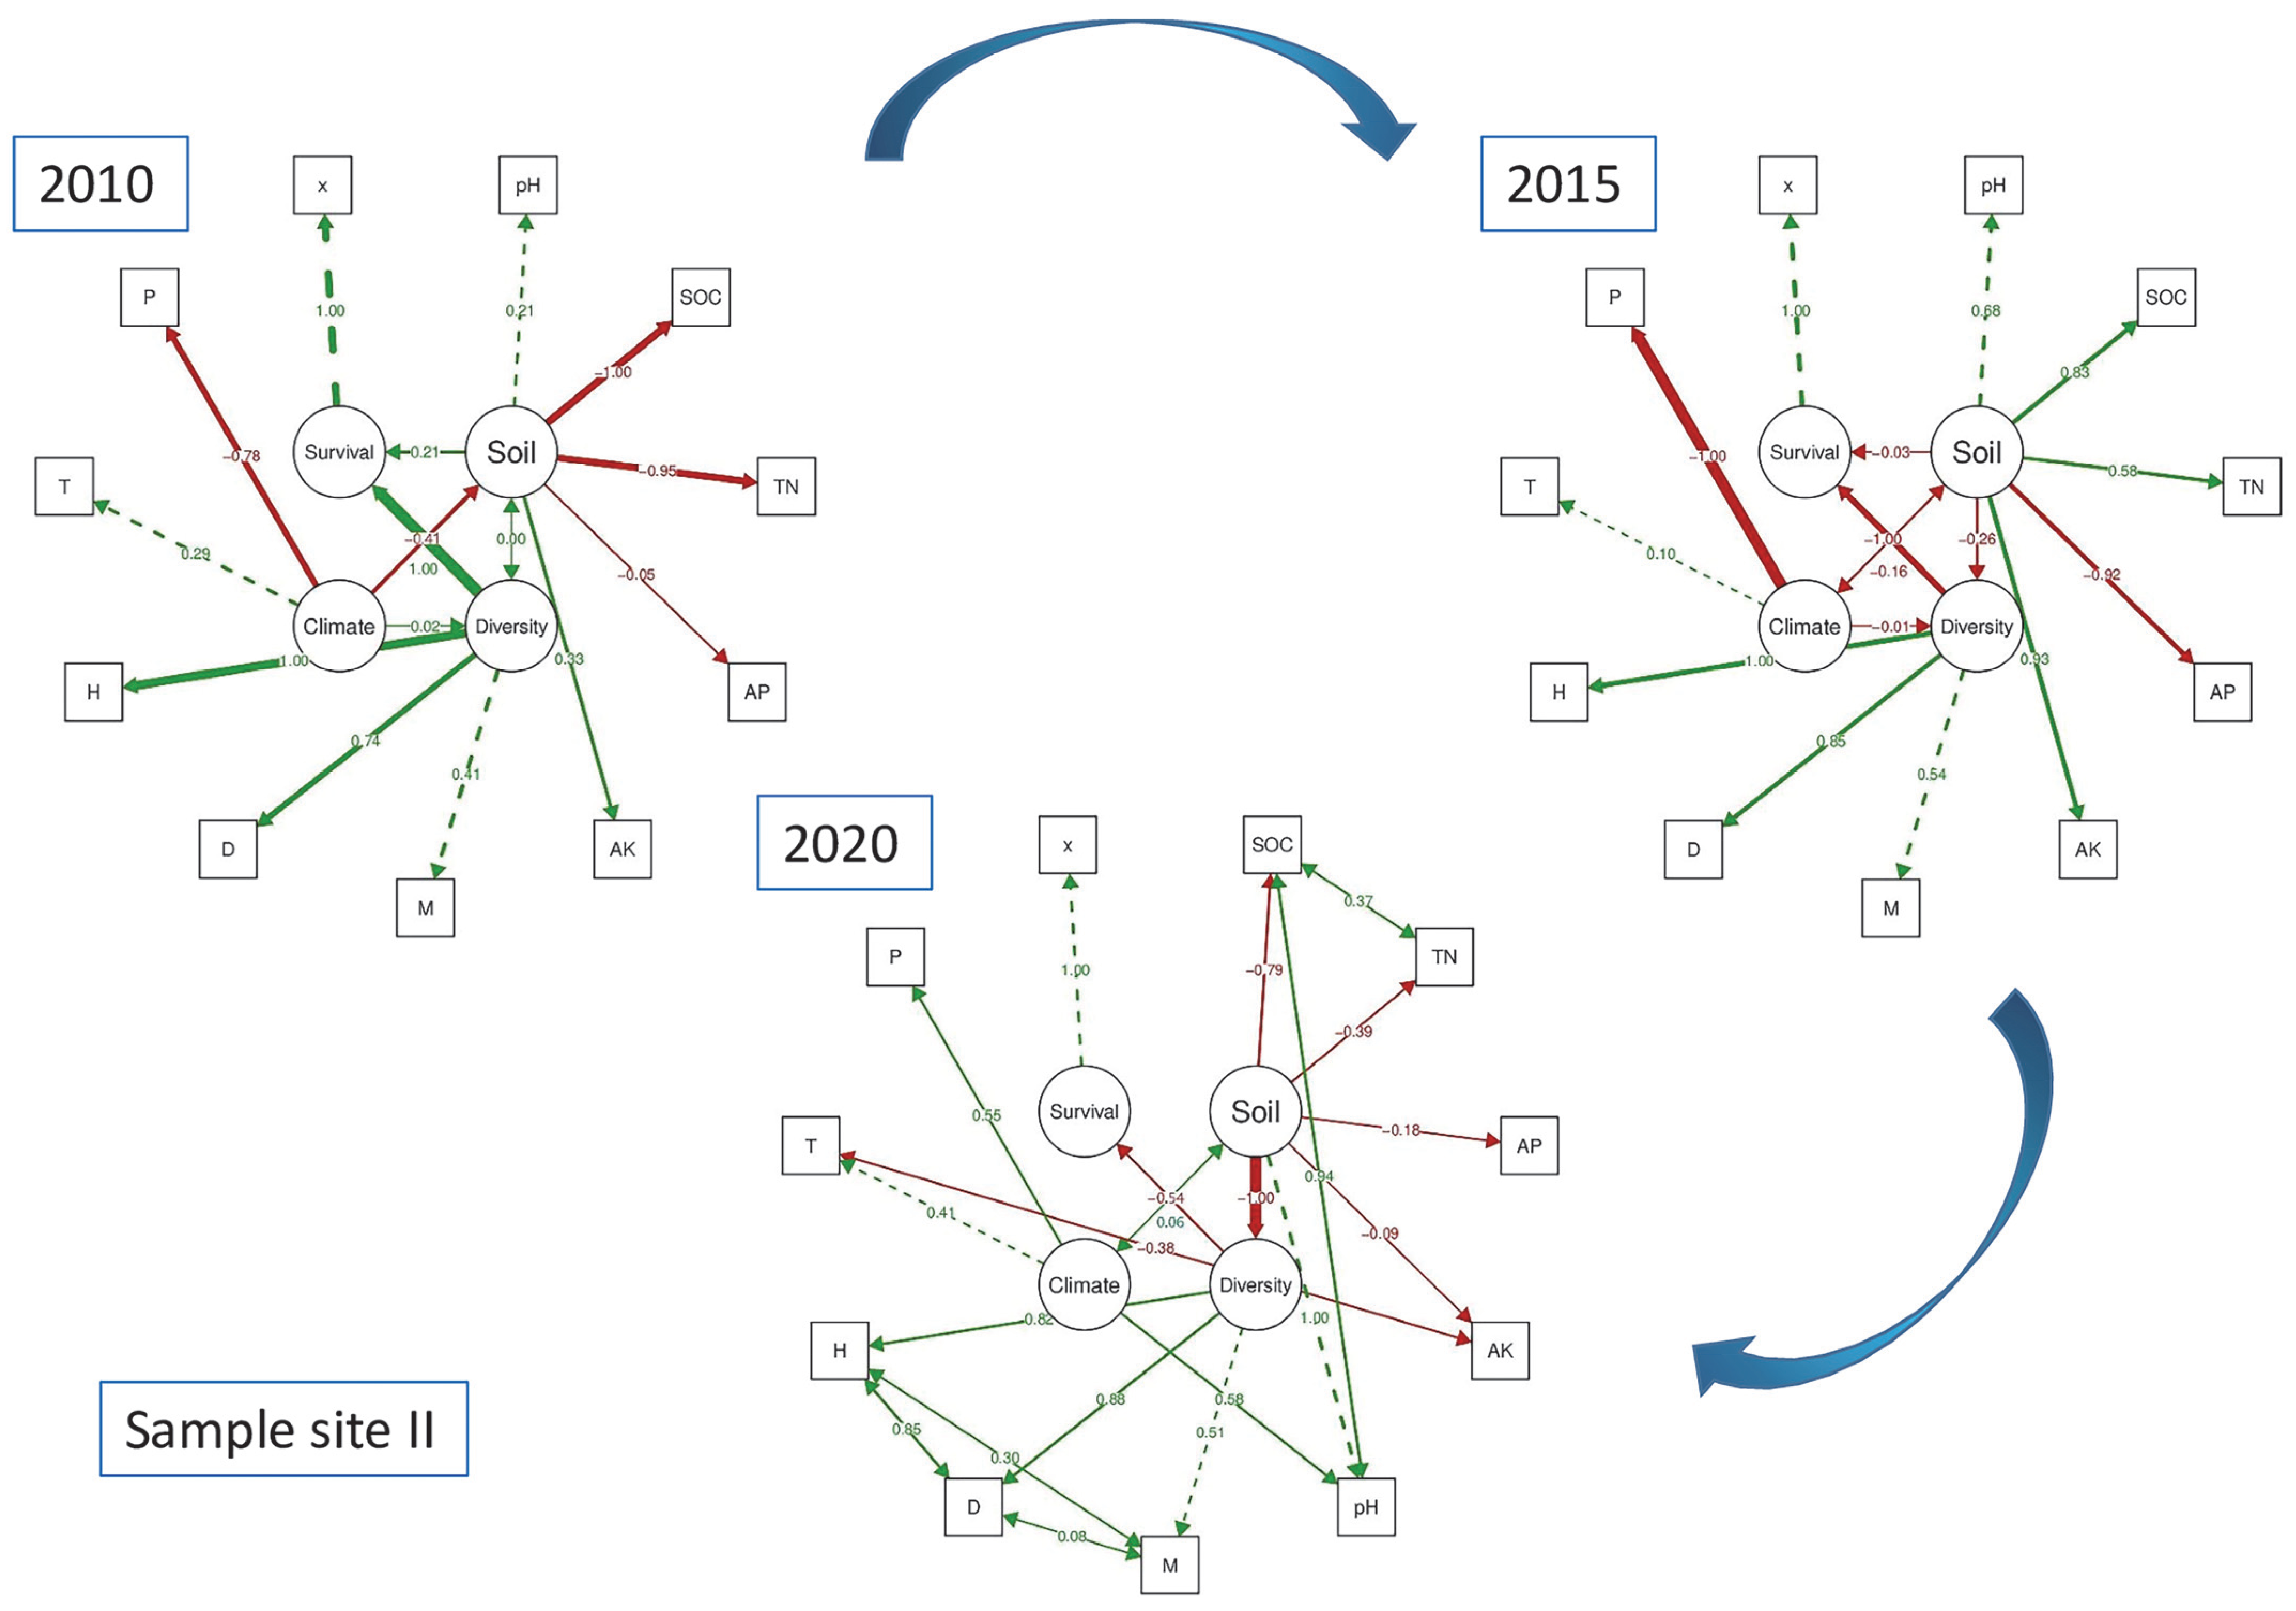
3.3. Different Survival Responses of Species to Diversity Always Depend on the Soil (H3)

We observed that, while there were both positive and negative associations between species of different stand ages and diversity, only negative correlations were detected in terms of overall survival (Table 6 and Table 7, Figures S6 and S7).
The soil indicators did not adequately explain the variation in species survival. The concentration of certain soil indicators in sample I significantly affected survival at years 17 and 22 (Table 6, Figure S6). In sample II, there was only an effect on survival at year 17 (Table 7, Figure S7). Furthermore, there is no correlation between soil indicators and diversity, suggesting that the previous notion of changes in species diversity response being influenced by changes in the nutrient composition of their soils is not valid (Table 7, Figure S7). The analysis of climate variables revealed that neither temperature nor precipitation had any impact on survival.
Based on the correlation analysis results, we found no positive influence of diversity on species survival. To further investigate this, we conducted another analysis using SEM, including all variables from both sample locations in the model, which was validated for the years 2010, 2015, and 2020.
The data regarding the effects of diversity, climate, and soil on species survival have been effectively analyzed using route analysis, as illustrated in the figure. In Figure 3, the path coefficient demonstrates that, between 2010 and 2015, there is an increase in the positive influence of soil on species diversity, as well as a rise in the negative impact of species diversity on survival rate. However, by 2020, the negative impact of species diversity on survival rate decreased, while the negative impact of soil on species diversity increased. This data highlights two key findings: firstly, species diversity consistently has a negative effect on species survival, regardless of changes in the coefficient intensity; and secondly, soil influences the intensity of the impact of species diversity on survival by affecting species diversity. Moving on to Site II (Figure 4), it can be observed that the impact of soil on species diversity also shifted from positive to negative with greater intensity between 2010 and 2015, as indicated by the path coefficient. Similarly, the impact of species diversity on survival rate changed from positive to negative with the same intensity. By 2020, species diversity was found to have a negative impact on species survival, mirroring the findings from Site I. Additionally, soil can change the intensity of the impact of species diversity on survival by influencing species diversity, as evident from the decrease in negative impact of species diversity on survival rate and the increase in negative impact of soil on species diversity.
Overall, the initial analysis indicated that only a small portion of the soil indicator content had an impact on species survival, and over time, neither soil, temperature, nor precipitation had a significant influence on it (Figure 5).

4. Discussion

The levels of diversity in the two sample plots fluctuated over time, indicating variations in species composition and survival rates. Our results support our initial prediction that diversity increases with stand age. However, while the survival rate of sample plot I is stabilizing, the survival rate of sample plot II exhibits fluctuations. This discrepancy may be attributed to the selection of species combinations during the restoration process, which can impact natural regeneration [42]. Another possibility is that the species assemblages in sample plot II have not yet demonstrated steady survival rates, possibly due to the relatively short 27-year time series. The significant reduction in early survival in both sample plots can be attributed to high early mortality resulting from significant density-dependent mortality and self-thinning due to intraspecific competition [43]. The presence of high abundances of the same species drastically reduces the chance of survival, highlighting the stronger influence of intraspecific competition on plant survival compared to interspecific competition [44].
The survival response of different tree species to diversity and stand age exhibited significant variations, contrasting with the negative correlation between diversity and overall survival. While numerous studies have demonstrated the positive effects of species diversity on ecosystem functions in forest ecosystems [45], such as stand productivity and biomass, its effects on survival remain less clear. Initially, the effects are negligible [46], but over time, they may tend to hinder survival [26]. This finding does not support our second hypothesis that the responses to diversity change with stand age. Due to the young age of the previous stands, the inhibitory effect of species diversity on tree survival was not substantial. The detrimental effect of species variety on survival may be attributed to resource competition among trees in the stand. As tree diversity increases, the yearly expansion of the total cross-sectional area of trees in the stand leads to increased competition, limiting their survival [26,45]. Different correlations between interspecific and intraspecific competitive abilities may be related to how different species respond to diversity in terms of their survival chances. R. pseudoacacia is an early successional species and, as a result, it is being replaced by more shade-tolerant and competitive trees such as P. tabuliformis and U. pumila [47,48]. This is why R. pseudoacacia plantations significantly differ from natural forests in Europe in terms of their natural characteristics and cultural context. Additionally, the increase in slope and the decrease in species diversity lead to a negative correlation between topography and species diversity [49]. We also observed that although different species displayed different responses to species diversity, the overall survival rates showed a consistent negative correlation, which can be attributed to the presence of dominant species at various stand ages. Dominant species are numerically abundant species within a community that alter the community’s functioning via their numerical superiority, thereby affecting one or more other species within the community and altering the overall function of the community as a whole [50]. In competition, dominant species typically benefit from mixed stands, while subdominant species may benefit from monoculture [51].
Our third hypothesis posits that the differential survival response to diversity can be attributed to variations in soil nutrients and climate change, as previously discussed. The influence of soil heterogeneity on plant species diversity relies on shifts in soil nutrients or soil pH [52,53,54]; it is generally observed that heterogeneity in soil nutrients does not typically promote plant species diversity [55], while heterogeneity in soil pH usually has a positive effect [56]. One possible explanation for this pattern is that heterogeneity in soil nutrient availability reduces plant species diversity, as species adapted to heterogeneous soils may outcompete other species, leading to a decline in diversity [57]. Another explanation could be that increased soil nutrients create an imbalance in interspecific competitiveness, resulting in a decline in community species diversity. However, the specific type of nutrient limitation in the study area also influences the relationship between nutrient availability and biodiversity [58]. In terrestrial environments, particularly Chinese forests, nitrogen and phosphorus are the primary limiting elements for plant growth [59]. Nitrogen-fixing species tend to have an advantage over other species in the early stages of succession due to their ability to acquire nitrogen from the atmosphere, thereby increasing the availability of both nitrogen and phosphorus. However, during the middle stages of succession, soil phosphorus starts to decline due to rapid plant growth [60,61], suggesting that soil pH and nutrient content have minimal influence on species survival during the later stages of succession. In contrast to the impact of soil on species survival, the response to climate change was found to be predictable. Changes in precipitation and temperature had negligible effects on species survival at both sample sites. This can be attributed to the fact that afforestation in China typically occurs in regions with precipitation levels that are close to the minimum requirement for species survival and expansion [62]. Denser stands may be less susceptible to drought mortality due to facilitative interactions between trees, which buffers against drought stress [63].
The interrelationships between stand age, stand diversity, and soil conditions affecting species survival necessitate a comprehensive investigation into changes in species survival within plantations on mining sites. Such an investigation is both vital and complex, as it contributes to the process of stand succession [64]. Furthermore, in certain stands, the reduction in intraspecific competition relative to interspecific competition may facilitate coexistence over time by yielding complementary effects [64], thereby maintaining the stand’s survival rate in a more stable state. Consequently, studying the impact of stand diversity on species survival presents an intriguing avenue of research.

5. Conclusions

We analyzed the effects of species diversity, soil, and climate factors on the survival of four major restoration species at 17, 22, and 27 years post-planting using a dataset from a long-term monitoring site in an opencast coal mine reclamation region. Our findings indicate that the survival rates of tree species in forests vary, suggesting the presence of synergistic or competitive interactions among different species that influence survival; this finding aligns with our previous research outcomes. Species diversity does not foster tree growth; rather, higher species diversity indexes correspond to lower tree survival rates due to the inhibitory effects of soil on species diversity. Additionally, our research results indicate that temperature and precipitation have no discernible impact on tree survival, possibly due to the limited observation period and the absence of significant climate fluctuations. In future research, longer time series and detailed data will be necessary to quantify the effects of various factors on vegetation survival. Consequently, we will continue to manage restoration areas to enhance their role in biodiversity conservation while optimizing ecological processes. Furthermore, it is important to consider the multitude of biotic and abiotic variables collectively, as our findings from one location may not be applicable to all woodland areas.

Supplementary Materials

The following supporting information can be downloaded at: https://www.mdpi.com/article/10.3390/d15101100/s1, Figure S1 Vegetation types before and after restoration. Table S1. Number of species surviving in the sample site. Table S2. Summary of restoration patterns by sample site. Figure S2 Soil comparison before and after mining. Figure S3 The spatial distribution of soil samples in the site. Figure S4 Correlation between several species’ survival rates and several parameters in various stand ages (Site I). Figure S5 Correlation between several species’ survival rates and several parameters in various stand ages (Site I). Figure S6 Correlation between total survival rate and several parameters in various stand ages (Site II). Figure S7 Correlation between total survival rate and several parameters in various stand ages (Site II).

Author Contributions

Conceptualization, Z.S. and M.C.; methodology, Z.S. and S.L.; validation, Z.S.; formal analysis, Z.S.; investigation, Z.S.; data curation, Z.B. and D.G.; writing—original draft preparation, Z.S.; writing—review and editing, Z.S.; visualization, Z.S.; project administration, Z.B.; funding acquisition, Z.B. All authors have read and agreed to the published version of the manuscript.

Funding

This work was supported by the National Natural Science Foundation of China [No. U1810107, 41701607]; the Shanxi basic research program [No.202103021223129]; and the First class course construction project of Shanxi Agricultural University [No.2022-JXZL-15].

Institutional Review Board Statement

Not applicable.

Informed Consent Statement

Not applicable.

Data Availability Statement

The data presented in this study are available on request from the corresponding author.

Acknowledgments

We thank Zhongke Bai, Donggang Guo, and Shuai Li for their suggestions during the preparation of the manuscript.

Conflicts of Interest

The authors declare no conflict of interest.

References

  1. Yang, Q.; Zhao, B.; Guo, D. A review on vegetation restoration of opencast coal mine areas in northern China. Chin. J. Ecol. 2015, 34, 1152–1157. [Google Scholar] [CrossRef]
  2. Luo, Y.; Lü, Y.; Fu, B.; Zhang, Q.; Li, T.; Hu, W.; Comber, A. Half century change of interactions among ecosystem services driven by ecological restoration: Quantification and policy implications at a watershed scale in the Chinese Loess Plateau. Sci. Total Environ. 2019, 651, 2546–2557. [Google Scholar] [CrossRef]
  3. Rana, P.; Miller, D.C. Predicting the long-term social and ecological impacts of tree-planting programs: Evidence from northern India. World Dev. 2021, 140, 105367. [Google Scholar] [CrossRef]
  4. Brandt, M.; Hiernaux, P.; Rasmussen, K.; Mbow, C.; Kergoat, L.; Tagesson, T.; Ibrahim, Y.Z.; Wélé, A.; Tucker, C.J.; Fensholt, R. Assessing woody vegetation trends in Sahelian drylands using MODIS based seasonal metrics. Remote Sens. Environ. 2016, 183, 215–225. [Google Scholar] [CrossRef]
  5. Shen, Q.; Gao, G.; Han, F.; Xiao, F.; Ma, Y.; Wang, S.; Fu, B. Quantifying the effects of human activities and climate variability on vegetation cover change in a hyper-arid endorheic basin. Land Degrad. Dev. 2018, 29, 3294–3304. [Google Scholar] [CrossRef]
  6. Adman, B.; Wahyu Nugroho, A.; Yassir, I. The Growth of Local Tree Species on Post-Coal Mining Areas in East Kalimantan. Indones. J. For. Res. 2020, 7, 83–97. [Google Scholar] [CrossRef]
  7. Löf, M.; Dey, D.C.; Navarro, R.M.; Jacobs, D.F. Mechanical site preparation for forest restoration. New For. 2012, 43, 825–848. [Google Scholar] [CrossRef]
  8. Leibold, M.A.; Chase, J.M.; Ernest, S.K.M. Community assembly and the functioning of ecosystems: How metacommunity processes alter ecosystems attributes. Ecology 2017, 98, 909–919. [Google Scholar] [CrossRef]
  9. Hiroshima, T. Applying age-based mortality analysis to a natural forest stand in Japan. J. For. Res. 2014, 19, 379–387. [Google Scholar] [CrossRef]
  10. Óskarsson, H.; Sigurgeirsson, A.; Raulund-Rasmussen, K. Survival, growth, and nutrition of tree seedlings fertilized at planting on Andisol soils in Iceland: Six-year results. For. Ecol. Manag. 2006, 229, 88–97. [Google Scholar] [CrossRef]
  11. Osunkoya, O.O.; Othman, F.E.; Kahar, R.S. Growth and competition between seedlings of an invasive plantation tree, Acacia mangium, and those of a native Borneo heath-forest species, Melastoma beccarianum. Ecol. Res. 2005, 20, 205–214. [Google Scholar] [CrossRef]
  12. Hattori, D.; Kenzo, T.; Yamauchi, N.; Irino, K.O.; Kendawang, J.J.; Ninomiya, I.; Sakurai, K. Effects of environmental factors on growth and mortality of Parashorea macrophylla (Dipterocarpaceae) planted on slopes and valleys in a degraded tropical secondary forest in Sarawak, Malaysia. Soil Sci. Plant Nutr. 2013, 59, 218–228. [Google Scholar] [CrossRef]
  13. Van de Peer, T.; Verheyen, K.; Baeten, L.; Ponette, Q.; Muys, B.; Firn, J. Biodiversity as insurance for sapling survival in experimental tree plantations. J. Appl. Ecol. 2016, 53, 1777–1786. [Google Scholar] [CrossRef]
  14. Woodall, C.W.; Grambsch, P.L.; Thomas, W. Applying survival analysis to a large-scale forest inventory for assessment of tree mortality in Minnesota. Ecol. Model. 2005, 189, 199–208. [Google Scholar] [CrossRef]
  15. Bai, X.; Queenborough, S.A.; Wang, X.; Zhang, J.; Li, B.; Yuan, Z.; Xing, D.; Lin, F.; Ye, J.; Hao, Z. Effects of local biotic neighbors and habitat heterogeneity on tree and shrub seedling survival in an old-growth temperate forest. Oecologia 2012, 170, 755–765. [Google Scholar] [CrossRef]
  16. Frouz, J.; Dvorščík, P.; Vávrová, A.; Doušová, O.; Kadochová, Š.; Matějíček, L. Development of canopy cover and woody vegetation biomass on reclaimed and unreclaimed post-mining sites. Ecol. Eng. 2015, 84, 233–239. [Google Scholar] [CrossRef]
  17. Ahirwal, J.; Maiti, S.K.; Satyanarayana Reddy, M. Development of carbon, nitrogen and phosphate stocks of reclaimed coal mine soil within 8 years after forestation with Prosopis juliflora (Sw.) Dc. CATENA 2017, 156, 42–50. [Google Scholar] [CrossRef]
  18. Abebe, G.; Tsunekawa, A.; Haregeweyn, N.; Taniguchi, T.; Wondie, M.; Adgo, E.; Masunaga, T.; Tsubo, M.; Ebabu, k.; Mamedov, A.; et al. Effect of Soil Microbiome from Church Forest in the Northwest Ethiopian Highlands on the Growth of Olea europaea and Albizia gummifera Seedlings under Glasshouse Conditions. Sustainability 2020, 12, 4976. [Google Scholar] [CrossRef]
  19. Maloney, P.E.; Vogler, D.R.; Jensen, C.E.; Mix, A.D. Ecology of whitebark pine populations in relation to white pine blister rust infection in subalpine forests of the Lake Tahoe Basin, USA: Implications for restoration. For. Ecol. Manag. 2012, 280, 166–175. [Google Scholar] [CrossRef]
  20. Comita, L.S.; Engelbrecht, B.M. Seasonal and Spatial Variation in Water Availability Drive Habitat Associations in a Tropical Forest. Ecology 2009, 90, 2755–2765. [Google Scholar] [CrossRef]
  21. Navarro-Cerrillo, R.M.; Rodriguez-Vallejo, C.; Silveiro, E.; Hortal, A.; Palacios-Rodríguez, G.; Duque-Lazo, J.; Camarero, J.J. Cumulative Drought Stress Leads to a Loss of Growth Resilience and Explains Higher Mortality in Planted than in Naturally Regenerated Pinus pinaster Stands. Forests 2018, 9, 358. [Google Scholar] [CrossRef]
  22. Spathelf, P.; van der Maaten, E.; van der Maaten-Theunissen, M.; Campioli, M.; Dobrowolska, D. Climate change impacts in European forests: The expert views of local observers. Ann. For. Sci. 2014, 71, 131–137. [Google Scholar] [CrossRef]
  23. Tong, C.; Wu, J.; Yong, S.; Yang, J.; Yong, W. A landscape-scale assessment of steppe degradation in the Xilin River Basin, Inner Mongolia, China. J. Arid Environ. 2004, 59, 133–149. [Google Scholar] [CrossRef]
  24. Wang, X.; Guo, X.; Du, N.; Guo, W.; Pang, J. Rapid nitrogen fixation contributes to a similar growth and photosynthetic rate of Robinia pseudoacacia supplied with different levels of nitrogen. Tree Physiol. 2021, 41, 177–189. [Google Scholar] [CrossRef] [PubMed]
  25. Song, X.; Lim, J.Y.; Yang, J.; Luskin, M.S. When do Janzen-Connell effects matter? A phylogenetic meta-analysis of conspecific negative distance and density dependence experiments. Ecol. Lett. 2021, 24, 608–620. [Google Scholar] [CrossRef]
  26. Searle, E.B.; Chen, H.Y.; Paquette, A. Higher tree diversity is linked to higher tree mortality. Proc. Natl. Acad. Sci. USA 2022, 119, e2013171119. [Google Scholar] [CrossRef]
  27. Garcia, L.C.; Hobbs, R.J.; Ribeiro, D.B.; Tamashiro, J.Y.; Santos, F.A.M.; Rodrigues, R.R.; Marrs, R. Restoration over time: Is it possible to restore trees and non-trees in high-diversity forests? Appl. Veg. Sci. 2016, 19, 655–666. [Google Scholar] [CrossRef]
  28. Chen, Y.; Cao, Y. Response of tree regeneration and understory plant species diversity to stand density in mature Pinus tabulaeformis plantations in the hilly area of the Loess Plateau, China. Ecol. Eng. 2014, 73, 238–245. [Google Scholar] [CrossRef]
  29. Thijs, K.W.; Aerts, R.; Van de Moortele, P.; Musila, W.; Gulinck, H.; Muys, B. Contrasting Cloud Forest Restoration Potential Between Plantations of Different Exotic Tree Species. Restor. Ecol. 2014, 22, 472–479. [Google Scholar] [CrossRef]
  30. Yachi, S.; Loreau, M. Biodiversity and ecosystem productivity in a fluctuating environment: The insurance hypothesis. Proc. Natl. Acad. Sci. USA 1999, 96, 1463–1468. [Google Scholar] [CrossRef]
  31. Tilman, D.; Isbell, F.; Cowles, J.M. Biodiversity and Ecosystem Functioning. Annu. Rev. Ecol. Evol. Syst. 2014, 45, 471–493. [Google Scholar] [CrossRef]
  32. Benayas, J.M.R.; Newton, A.C.; Diaz, A.; Bullock, J.M. Enhancement of biodiversity and ecosystem services by ecological restoration: A meta-analysis. Science 2009, 325, 1121–1124. [Google Scholar] [CrossRef]
  33. Hutto, R.L.; Belote, R.T. Distinguishing four types of monitoring based on the questions they address. For. Ecol. Manag. 2013, 289, 183–189. [Google Scholar] [CrossRef]
  34. Hao, F.; Zhang, X.; Ouyang, W.; Skidmore, A.K.; Toxopeus, A.G. Vegetation NDVI Linked to Temperature and Precipitation in the Upper Catchments of Yellow River. Environ. Model. Assess. 2011, 17, 389–398. [Google Scholar] [CrossRef]
  35. Zhao, B.; Guo, D.; Bai, Z.; Zhao, Z. Community dynamics of artificial vegetation in a reclaimed spoil from a semi-arid open-cast coal mine in 2010–2015. Chin. J. Ecol. 2018, 37, 1636–1644. [Google Scholar] [CrossRef]
  36. IUSS Working Group WRB. World Reference Base for Soil Resources. International Soil Classification System for Naming Soils and Creating Legends for Soil Maps, 4th ed.; International Union of Soil Sciences (IUSS): Vienna, Austria, 2022; 234p. [Google Scholar]
  37. Shi, Z.; Bai, Z.; Guo, D.; Chen, M. Develop a Soil Quality Index to Study the Results of Black Locust on Soil Quality below Different Allocation Patterns. Land 2021, 10, 785. [Google Scholar] [CrossRef]
  38. Keylock, C.J. Simpson diversity and the Shannon–Wiener index as special cases of a generalized entropy. Oikos 2005, 109, 203–207. [Google Scholar] [CrossRef]
  39. Fan, Y.; Chen, J.; Shirkey, G.; John, R.; Wu, S.R.; Park, H.; Shao, C. Applications of structural equation modeling (SEM) in ecological studies: An updated review. Ecol. Process. 2016, 5, 19. [Google Scholar] [CrossRef]
  40. Grace, J.B.; Irvine, K.M. Scientist’s guide to developing explanatory statistical models using causal analysis principles. Ecology 2019, 101, e02962. [Google Scholar] [CrossRef]
  41. Rosseel, Y. Lavaan: An R package for structural equation modeling. J. Stat. Softw. 2012, 48, 1–36. [Google Scholar] [CrossRef]
  42. Cusack, D.; Montagnini, F. The role of native species plantations in recovery of understory woody diversity in degraded pasturelands of Costa Rica. For. Ecol. Manag. 2004, 188, 1–15. [Google Scholar] [CrossRef]
  43. Collet, C.; Le Moguedec, G. Individual seedling mortality as a function of size, growth and competition in naturally regenerated beech seedlings. Forestry 2007, 80, 359–370. [Google Scholar] [CrossRef]
  44. Laughlin, D.C.; Strahan, R.T.; Adler, P.B.; Moore, M.M. Survival rates indicate that correlations between community-weighted mean traits and environments can be unreliable estimates of the adaptive value of traits. Ecol. Lett. 2018, 21, 411–421. [Google Scholar] [CrossRef] [PubMed]
  45. Huang, Y.; Chen, Y.; Castro-Izaguirre, N.; Baruffol, M.; Brezzi, M.; Lang, A.; Härdtle, W.; von Oheimb, G.; Yang, X.; Liu, X.; et al. Impacts of species richness on productivity in a large-scale subtropical forest experiment. Science 2018, 362, 80–83. [Google Scholar] [CrossRef]
  46. Grossman, J.J.; Vanhellemont, M.; Barsoum, N.; Bauhus, J.; Bruelheide, H.; Castagneyrol, B.; Cavender-Bares, J.; Eisenhauer, N.; Ferlian, O.; Gravel, D.; et al. Synthesis and future research directions linking tree diversity to growth, survival, and damage in a global network of tree diversity experiments. Environ. Exp. Bot. 2018, 152, 68–89. [Google Scholar] [CrossRef]
  47. De Sá, N.C.; Marchante, H.; Marchante, E.; Cabral, J.A.; Honrado, J.P.; Vicente, J.R. Can citizen science data guide the surveillance of invasive plants? A model-based test with Acacia trees in Portugal. Biol. Invasions 2019, 21, 2127–2141. [Google Scholar] [CrossRef]
  48. Shure, D.J.; Phillips, D.L.; Edward Bostick, P. Gap size and succession in cutover southern Appalachian forests: An 18 year study of vegetation dynamics. Plant Ecol. 2006, 185, 299–318. [Google Scholar] [CrossRef]
  49. Zhu, J.; Wu, A.; Zou, S.; Xiong, X.; Liu, S.; Chu, G.; Zhang, Q.; Liu, J.; Tang, X.; Yan, J.; et al. Relationships between tree diversity and biomass/productivity and their influence factors in a lower subtropical evergreen broad-leaved forest. Biodivers. Sci. 2021, 29, 1435–1446. [Google Scholar] [CrossRef]
  50. Huston, M.A. Hidden treatments in ecological experiments: Re-evaluating the ecosystem function of biodiversity. Oecologia 1997, 110, 449–460. [Google Scholar] [CrossRef]
  51. Vogt, D.R.; Murrell, D.J.; Stoll, P. Testing spatial theories of plant coexistence: No consistent differences in intra- and interspecific interaction distances. Am. Nat. 2010, 175, 73–84. [Google Scholar] [CrossRef] [PubMed]
  52. Eilts, J.A.; Mittelbach, G.G.; Reynolds, H.L.; Gross, K.L. Resource heterogeneity, soil fertility, and species diversity: Effects of clonal species on plant communities. Am. Nat. 2011, 177, 574–588. [Google Scholar] [CrossRef]
  53. Gazol, A.; Tamme, R.; Price, J.N.; Hiiesalu, I.; Laanisto, L.; Partel, M. A negative heterogeneity-diversity relationship found in experimental grassland communities. Oecologia 2013, 173, 545–555. [Google Scholar] [CrossRef]
  54. Schoolmaster, D.R. Resource competition and coexistence in heterogeneous metacommunities: Many-species coexistence is unlikely to be facilitated by spatial variation in resources. PeerJ 2013, 1, e136. [Google Scholar] [CrossRef]
  55. Price, J.; Tamme, R.; Gazol, A.; de Bello, F.; Takkis, K.; Uria-Diez, J.; Kasari, L.; Pärtel, M. Within-community environmental variability drives trait variability in species-rich grasslands. J. Veg. Sci. 2017, 28, 303–312. [Google Scholar] [CrossRef]
  56. Williams, B.M.; Houseman, G.R. Experimental evidence that soil heterogeneity enhances plant diversity during community assembly. J. Plant Ecol. 2014, 7, 461–469. [Google Scholar] [CrossRef]
  57. Kraft, N.J.B.; Adler, P.B.; Godoy, O.; James, E.C.; Fuller, S.; Levine, J.M. Community assembly, coexistence and the environmental filtering metaphor. Funct. Ecol. 2015, 29, 592–599. [Google Scholar] [CrossRef]
  58. Aerts, R.; Chapin, F.S. The Mineral Nutrition of Wild Plants Revisited: A Re-evaluation of Processes and Patterns. Adv. Ecol. Res. 1999, 30, 1–67. [Google Scholar]
  59. Tang, Z.; Xu, W.; Zhou, G.; Bai, Y.; Li, J.; Tang, X.; Chen, D.; Liu, Q.; Ma, W.; Xiong, G.; et al. Patterns of plant carbon, nitrogen, and phosphorus concentration in relation to productivity in China’s terrestrial ecosystems. Proc. Natl. Acad. Sci. USA 2018, 115, 4033–4038. [Google Scholar] [CrossRef] [PubMed]
  60. Coomes, D.A.; Bentley, W.A.; Tanentzap, A.J.; Burrows, L.E. Soil drainage and phosphorus depletion contribute to retrogressive succession along a New Zealand chronosequence. Plant Soil 2013, 367, 77–91. [Google Scholar] [CrossRef]
  61. Deng, Q.; McMahon, D.E.; Xiang, Y.; Yu, C.L.; Jackson, R.B.; Hui, D. A global meta-analysis of soil phosphorus dynamics after afforestation. New Phytol. 2017, 213, 181–192. [Google Scholar] [CrossRef]
  62. Cao, S.; Chen, L.; Xu, C.; Liu, Z. Impact of three soil types on afforestation in China’s Loess Plateau: Growth and survival of six tree species and their effects on soil properties. Landsc. Urban Plan 2007, 83, 208–217. [Google Scholar] [CrossRef]
  63. Brooker, R.W.; Maestre, F.T.; Callaway, R.M.; Lortie, C.L.; Cavieres, L.A.; Kunstler, G.; Liancourt, P.; Tielbörger, K.; Travis, J.M.J.; Anthelme, F.; et al. Facilitation in plant communities: The past, the present, and the future. J. Ecol. 2008, 96, 18–34. [Google Scholar] [CrossRef]
  64. Devaney, J.L.; Pullen, J.; Cook-Patton, S.C.; Burghardt, K.T.; Parker, J.D. Tree diversity promotes growth of late successional species despite increasing deer damage in a restored forest. Ecology 2020, 101, e03063. [Google Scholar] [CrossRef] [PubMed]
Figure 1. Conceptual diagram. Survival is calculated as the number surviving at the end of the interval divided by the number surviving at the start of the interval (usually expressed as a percentage and then referred to as survival probability rather than survival rate). H: Overall, stand diversity can improve tree survival. However, H1: The effects of stand diversity on survival vary with stand age. H2: Different species survival may have different responses to diversity and these may change with stand age (R and U are two example species, R indicates R. pseudoacacia, U indicates U. pumila). H3: The different responses of survival to diversity may depend on soil nutrient conditions. In addition, climatic conditions may also influence its variation.
Diversity 15 01100 g001
Figure 2. Location map of the study area. The green line designates the study area, and the red line delineates the mine border.
Diversity 15 01100 g002
Figure 3. Sample site I structural equation model showing latent variables (circles) and observed variables (squares) and their relationships. Path coefficients describe the sign and strength of the links between variables (red represents negative relationships, green represents positive relationships). All path coefficients are statistically significant (p-value < 0.05).
Diversity 15 01100 g003
Figure 4. Sample site II structural equation model showing latent variables (circles) and observed variables (squares) and their relationships. Path coefficients describe the sign and strength of the links between variables (red represents negative relationships, green represents positive relationships). All path coefficients are statistically significant (p-value < 0.05).
Diversity 15 01100 g004
Figure 5. Result diagram. The response of species survival to different impact factors in two sample sites. R indicates R. pseudoacacia, U indicates U. pumila, A indicates A. altissima, P indicates P. tabuliformis.
Diversity 15 01100 g005
Table 1. Formula legend.
IndexParameter Interpretation
Sthe total number of species
Nthe total number of individuals of each species
InNthe natural logarithm of individuals
pithe proportion of individuals of the ith species to all individuals
Table 2. Total Survival and Diversity Index (Site I).
Stand Age/YearTotal Survival Rate/%MDH’
01000.3001.2370.340
1758.660.4121.5840.711
2257.230.5511.8120.794
2757.010.6312.2450.913
M indicates Margalef’s index, D indicates Simpson’s index, H’ indicates Shannon-Wiener index.
Table 3. Total Survival and Diversity Index (Site II).
Stand Age/YearTotal Survival Rate/%MDH’
01000.435 3.000 1.099
1733.020.988 2.393 0.988
2231.730.993 2.673 1.054
27470.592 1.784 0.756
M indicates Margalef’s index, D indicates Simpson’s index, H’ indicates Shannon-Wiener index.
Table 4. Correlation of species survival and diversity (Site I).
Survival RateStand Age/YearMDH’
R17−0.508 **−0.507 **−0.573 **
P0.598 **0.609 **0.701 **
Total−0.349 **−0.345 **−0.385 **
R22−0.421 **−0.473 **−0.517 **
P0.584 **0.729 **0.727 **
Total−0.263 *−0.272 *−0.320 **
R27−0.531 **−0.438 **−0.540 **
P0.786 **0.686 **0.796 **
Total−0.311 **−0.243 *−0.319 **
**, significantly correlated at the 0.01 level. *, significantly correlated at the 0.05 level. R indicates R. pseudoacacia, P indicates P. tabuliformis, M indicates Margalef’s index, D indicates Simpson’s index, H’ indicates Shannon-Wiener index.
Table 5. Correlation of species survival and diversity (Site II).
Survival RateStand Age/YearMDH’
R17−0.333 **−0.504 **−0.427 **
U−0.229 *0.1490.158
A0.1710.621 **0.618 **
Total−0.364 **0.0020.059
R22−0.125−0.1250.009
U−0.298 **−0.317 **−0.311 **
A0.0380.575 **0.584 **
Total−0.355 **−0.214 *−0.133
R27−0.0680.442 **0.433 **
U−0.310 **−0.638 **−0.609 **
A0.258 **0.539 **0.567 **
Total−0.301 **−0.469 **−0.437 **
**, significantly correlated at the 0.01 level. *, significantly correlated at the 0.05 level. R indicates R. pseudoacacia, U indicates U. pumila, A indicates A. altissima. M indicates Margalef’s index, D indicates Simpson’s index, H’ indicates Shannon-Wiener index.
Table 6. Correlation of total survival rate with soil and climate (Site I).
Site IStand Age/YearpHSOC
(g/kg)
TN
(g/kg)
AP
(mg/kg)
AK
(mg/kg)
TP
Total survival17−0.020−0.261 *−0.244 *0.285 *0.278 *−0.143−0.024
Total survival220.372 **−0.235 *−0.1430.022−0.257 *0.034−0.074
Total survival270.0390.1340.117−0.0390.014−0.218−0.217
M170.023−0.087−0.092−0.111−0.0280.0180.044
D0.080−0.097−0.105−0.039−0.0420.0450.006
H’0.053−0.102−0.110−0.112−0.0090.005−0.016
M22−0.0950.109−0.009−0.1770.0920.1690.023
D−0.0950.103−0.065−0.1530.0650.052−0.024
H’−0.0700.105−0.058−0.1420.1050.048−0.047
M270.045−0.191−0.1040.164−0.1360.0210.058
D−0.026−0.0200.0690.181−0.036−0.0110.021
H’−0.020−0.0770.0270.147−0.0800.0140.029
** and * indicate statistically significant correlations at the 0.01 and 0.05 levels, respectively; the absence of * indicates irrelevance. M indicates Margalef’s index, D indicates Simpson’s index, H’ indicates Shannon-Wiener index.
Table 7. Correlation of total survival rate with soil and climate (Site II).
Site IIStand Age/YearpHSOC
(g/kg)
TN
(g/kg)
AP
(mg/kg)
AK
(mg/kg)
TP
Total survival170.212 *−0.246 *−0.230 *0.035−0.0090.246−0.329
Total survival220.1250.057−0.100−0.1300.0810.029−0.277
Total survival270.228 *−0.024−0.033−0.075−0.061−0.2120.224
M17−0.1540.0680.061−0.0190.0230.0560.109
D0.056−0.115−0.124−0.1410.0600.0700.036
H’0.091−0.070−0.074−0.1160.0940.1080.085
M22−0.111−0.152−0.0710.117−0.1590.0520.223 *
D−0.039−0.255 *−0.237 *0.117−0.1740.1210.160
H’−0.019−0.280 **−0.268 **0.104−0.1790.1390.189
M27−0.187−0.0880.1130.056−0.1020.106−0.024
D−0.187−0.048−0.036−0.253*0.0120.0860.168
H’−0.182−0.062−0.019−0.225 *−0.0210.0870.142
** and * indicate statistically significant correlations at the 0.01 and 0.05 levels, respectively; the absence of * indicates irrelevance. M indicates Margalef’s index, D indicates Simpson’s index, H’ indicates Shannon-Wiener index.
Disclaimer/Publisher’s Note: The statements, opinions and data contained in all publications are solely those of the individual author(s) and contributor(s) and not of MDPI and/or the editor(s). MDPI and/or the editor(s) disclaim responsibility for any injury to people or property resulting from any ideas, methods, instructions or products referred to in the content.

