Abstract
Polymorphism has been described in many avian taxa including Ardeidae. This study investigated the spatio-temporal distribution of color polymorphic forms (with regard to the color of the unfeathered parts (legs/lores)) of the Great White Egret Ardea alba alba in internet images from Europe. In total, 140 images of presumed polymorphs from 16 countries (from 2006 to 2021) have been collected and examined. Eight coloration schemes of visible unfeathered parts were distinguished. Since some polymorphs may represent the subspecies Eastern Great Egret Ardea alba modesta, the ratio of beak length to total head length was compared among individuals representing the nominal and Eastern Great Egret subspecies. The ratio distributions were similar in all compared groups; thus, polymorph egrets may represent both of these subspecies. Most polymorph images originate from the Netherlands and the southwestern Norwegian coast. This may have resulted from specific local diets and contact with hormone-disrupting compounds. Nevertheless, some observation biases, such as the presence of local breeding population or high numbers of nature photographers, could have affected our observation pattern. Some analyzed features also followed temporal patterns. Most polymorphs were observed during the breeding season, suggesting disruptions of sex hormones as a possible cause. Studies of spatio-temporal patterns of polymorph occurrence may allow us to obtain insights into the causes of large variation in coloration schemes in polymorphic species.
1. Introduction
Polymorphism is defined as the presence of phenotypes with various coloration schemes in populations [1,2] independent of season or of an individual’s sex or age, which are natural and expected physiological events [1,2,3]. This phenomenon does not include non-genetic causes of differentiation, such as environmentally induced modifications, reversible physiological processes, or ontogenetic changes [4,5]. Morph appearance is visibly different from the expected image of the species [1]. This difference cannot be classified as a phenotypical variation range due to its low occurrence frequency in populations [1]. Only 2% of bird populations exhibit distinct and unexpected coloration schemes [6,7]. These coloration aberrations do not seem to be physiological nor ontogenetical, and thus cannot be considered continuous variation [1,2,5]. This suggests the presence of both disruptive and apostatic selection pressure, favoring and promoting extreme phenotypes, distinct from the rest of the population [5,8,9]. The issue of intraspecific polymorphs attracted the attention of researchers many years ago, but still there is no clear view explaining the presence of this phenomenon.
Selective balance among morphs is widespread and present in various animal groups [4,5,9,10] including birds. Color polymorphism has been described for 3.5% of avian taxa [2,5], including some species of herons and egrets (family Ardeidae) [11,12]. The color dimorphism in this group includes mainly light/dark polymorphism of feathered body parts [3,12,13]. In some species it is adaptive, providing higher foraging success in specific environmental conditions, since the color of feathers may make them less visible to potential prey. Light forms inhabit open habitats with greater brightness, e.g., open and hot coastal habitats, while dark forms can be found in habitats with lower insolation rates, e.g., murky inland waters of closed habitats [5,14]. The differentiation of plumage and inhabited environment are related, with differences in hunting techniques and diets between morphs [9,14].
Besides feather pigmentation polymorphism, some herons and egrets exhibit a wide range of divergence in coloration of the unfeathered body parts, including legs, beak, loral region, and iris [15]. Acquired novel traits may be beneficial and thus lead to the maintenance of this type of polymorphism in avian populations [5]. Bright, red-colored legs may be less visible for prey when submerged in water [16], which consequently may lead to greater feeding success. Intensive coloration might increase reproduction success as it may be perceived as a proxy of the high quality and good condition of the individual [17]. Color polymorphism may be attributed to subspecies phenotype variability and may represent adaptive responses to microclimatic conditions [18]. Nevertheless, studies on avian bare part coloration are scarce and their functions are unknown.
The Great White Egret Ardea alba or Egretta alba is an example of a species exhibiting color polymorphism attributed to subspecies breeding in different geographical regions. The species is divided into four subspecies (worldbirdnames.org, accessed 24 January 2022): the nominative Ardea alba alba breeds in Eurasia, A. a. modesta in Australia and Oceania, A. a. melanorchnychos in Africa, and A. a. egretta in the American continents [19,20]. Differences between these variants are detectable only during the breeding period, when bare part coloration gains novel hue combinations, differing in every egret subspecies [19,20]. Unfeathered regions of A. a. modesta, for example, acquire more intense tones, compared to less toned A. a. alba [20,21]. Visible differences and the still unresolved molecular and taxonomical status [21] of these geographical variants have led to suggestions that these two subspecies be considered instead as two separate species, the Eastern and Western Great Egret, respectively [19,21].
In this study, we investigated a polymorphism of unfeathered parts (legs/lores) of the Great White Egret observed in Europe. A growing number of image-documented observations of Great White Egret individuals with coloration schemes differing from expected has initiated discussion about their status (subspecies, prolonged breeding plumage, color aberration), e.g., [15,21,22]. Thus, we analyzed spatio-temporal patterns of documented observations in Europe of morphs differing in appearance from the nominal subspecies A. a. alba. We focused on particular morph phenotypes of the Great White Egret expressed with a combination of light/pink/red-colored legs. These features were easily recognized in photographs found on the Internet (see examples in Figure 1). We discussed four potential explanations of the polymorphism of the unfeathered parts of these Great White Egrets: (1) These polymorphic variants may represent long-distance vagrants of the Eastern Great Egret A. a. modesta. Given that A. a. modesta possesses a shorter beak, compared to the nominative subspecies A. a. alba [20], one may expect a different beak length to total head length ratio in A. a. modesta individuals. (2) One may expect that different polymorphs may suffer from hormonal imbalances; if the morphs are mainly observed during the breeding period, one may expect that they represent some aberration in the breeding plumage. As sex hormones are engaged in the expression of phenotypic features during breeding season [22,23,24], the strongest noticeable effect of their influence is visible during this phase of the annual cycle. (3) If the morph observation is spatially clustered in a particular area, one may expect some local factors triggering this phenomenon (e.g., contamination affecting hormonal balance and/or pigment synthesis). (4) Polymorphic individuals may have a carotenoid-rich diet, enabling the maintenance of such costly appearance traits [8,25].
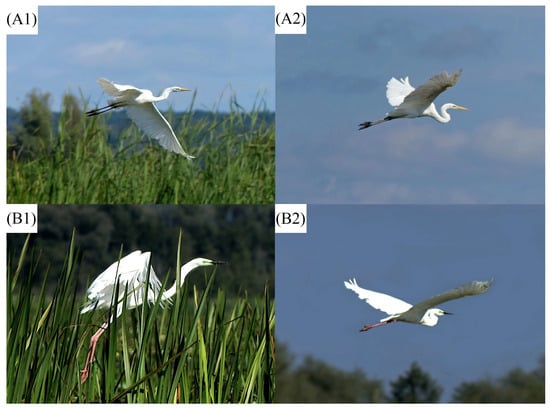
Figure 1.
Great White Egret individuals observed in northern Poland exhibiting various coloration schemes: (A1,A2) individuals with typical coloration schemes for nominal (A. a. alba) subspecies; (B1,B2) individuals with coloration scheme of unfeathered parts, differing from the nominal subspecies. All photographs taken in the Druzno Lake in northern Poland in August 2017 by B.M.-Ś.
2. Materials and Methods
2.1. Study Species
The Great White Egret is considered a highly expansive species [20,26], having an extensive post-breeding dispersal [21,27]. At the end of the 20th century, its breeding range in Europe was restricted to southern parts of the continent and it was considered non-breeding in its northern parts [28]. At the turn of 19th and 20th century, Great White Egrets were killed for their nuptial plumes for use as hat ornaments, which nearly led to this species’ extinction [20,28]. In recent decades, the European populations of the Great White Egret have strikingly increased in both population size and breeding range, expanding to northern parts of the continent [28]. Additionally, European Great White Egrets undoubtedly take advantage of increased temperatures, observed within the continent, due to the impact of climate change [27,28]. This phenomenon enables them to expand to the northern part of the continent [28].
2.2. Image Searching
We searched for Great White Egret images showing a coloration scheme of unfeathered parts differing from the expected pattern, as described in the literature for the nominal subspecies A. a. alba (see details below). We searched for images in global observation databases and internet galleries of birds (the list of used occurrence sources is listed in Supplementary Materials S1). We used the taxonomic and Latin names of the species in search engines, i.e., “Great White Egret”, “Ardea alba”, and ”Egretta alba”. During the image selection phase, we were looking for images of egret individuals, with a combination of the whole leg color distinctly different from black, and a dark beak (as seen in the images in Figure 1). In further analyses, we also included lore coloration, since it varied among birds. We did not perform any analyses of beak color, since this feature was constant among the images we examined. We considered individuals with leg coloration visibly distinct from black (light, pink, and red) as examples of polymorphic forms different from the nominal subspecies. We considered only images taken in Europe. We noted the date of the observation (especially the month) and latitude–longitude coordinates of observation site.
In total, we found 140 photographs of presumably polymorphic forms taken in 2006–2021 and used them in analyses of color schemes of lores and legs. To ensure consistency, one person (KC) analyzed all images. All images examined had been taken during the day under natural lighting conditions.
2.3. Color Schemes of Great White Egrets Described in the Literature
During the non-breeding period, bare parts of the nominal subspecies A. a. alba are characterized by a yellow bill, light green loral region, yellow/light brown tibia, and black tarsus (Figure 1A1,A2). Breeding adults are characterized by a black bill with a variable amount of yellow at its base, bright green lores, light-colored tibia (e.g., brownish, yellow- ish, or pinkish), and a black tarsus (sometimes pink stripes are visible on the sides) [19,20] (see Supplementary Materials S2). During the non-breeding period, the bare parts of the subspecies A. a. modesta are characterized by a yellow bill, pale green/yellow loral region, and all-over black legs and breeding adults are characterized by a greyish/black bill (sometimes the beak is bicolored (black and yellow)), bright green–blue lores, bicolored legs (lighter tibia, e.g., pink, red and darker tarsus), or brightly colored legs [19,20] (see Supplementary Materials S1 and S2). Some authors classify Great White Egrets with brightly colored legs as the Eastern Great Egret subspecies A. a. modesta [19,20,29]. In A. a. alba, bright coloration of the whole legs is uncommon since only the tibiotarsus undergoes gradual and ephemeral coloration changes [20,30]. (For a full description of traits (biometry, phenotype, and behavior) of the four Great White Egret subspecies, see Supplementary Materials S2.)
2.4. Color Schemes of Great White Egrets Used in This Study
In order to classify individuals from internet images, we created a coded color scheme to describe the visible coloration of legs and lores, distinct from the expected phenotype of the nominal subspecies A. a. alba (Table 1). Such an approach enabled us to test whether any code combination describing an individual’s phenotype is region- or time- dependent.

Table 1.
Color codes of typical A. a. alba and polymorphic individuals of the Great White Egret.
We used three types of color codes in our analyses. The first, based on the color of the legs and loral region, was written as a 3-digit alphanumeric code indicating the color of the tibiotarsus (first digit), tarsometatarsus (second digit), and loral region (at the third position). Codes for legs (tibiotarsus and tarsometatarsus) may consist of 5 possible components: 1—black, 2—red, 3—pink, 4—light/yellow, and N—no data. A loral region may be represented by 6 color components: A—yellow; B—pale green; C—bright green; D—turquoise (green—blue); E—blue; and N—no data, when the color of legs/lores is not clearly visible or undistinguishable (Figure 2). We considered individuals coded as 31C or 31D as typical A. a. alba individuals and coded as 22B, 22C, 22D, 33B, 33C, 33D, 44B, or 44C as polymorphic (Table 1). Generally, the examined polymorphic individuals showed more flashy coloration of bare parts during the breeding season.
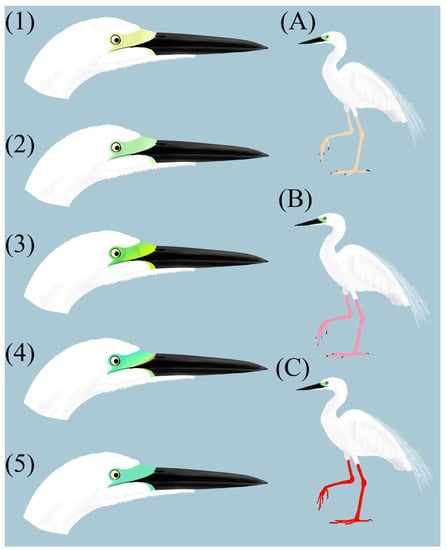
Figure 2.
Example images visualizing color features of particular lore groups ((1) yellow; (2) pale green; (3) bright green; (4) turquoise (green-blue); (5) blue) and leg groups ((A) light legs; (B) pink legs; (C) red legs). Art by KC.
We additionally created groups comprising individuals sharing the same bare part characteristics, i.e., leg and lore color, separately. We did it similarly in the case of color codes; such an approach allowed us to test whether any feature describing particular bare part characteristics may exhibit any spatio-temporal patterns in the frequency of observation.
We distinguished the following groups of individuals sharing same leg color (hereafter leg groups) using the first 2 digits from the 3-digit alphanumeric color codes (Table 1):
Group 1: Birds with light-colored tibiotarsus and tarsometatarus: 44× (n = 15);
Group 2: Birds with pink-colored tibiotarsus and tarsometatarus: 33× (n = 59);
Group 3: Birds with red-colored tibiotarsus and tarsometatarus: 22× (n = 70).
We distinguished the following groups based on the loral region tone (hereafter lore groups) using the last digit (letter) from the eight 3-digit alphanumeric color codes (Table 1):
Group B: Birds with pale green lores (n = 46);
Group C: Birds with bright green lores (n = 85);
Group D: Birds with turquoise lores (n = 13).
We did not consider any individuals with yellow loral color (coded as ‘A’) and black leg parts (coded as ‘1′) as polymorphic, since these traits were not present in the collected image samples. Thus, later in this paper, we analyzed only the cases including egrets of lore types (B–D) and leg coloration (2–4).
2.5. Beak Length to Total Head Length Ratio Image Analysis
To test whether analyzed individuals were distinct in morphological features from the nominal A. a. alba and Eastern Great Egret A. a. modesta, we compared the distribution of the ratio of beak length (BL) to total head length (THL) (hereafter BL/THL ratio) among these groups. For this purpose, we measured BL/THL ratios in 113 images of polymorphic individuals, as well as for 30 pictures of A. a. alba and 30 of A. a. modesta.
To measure BL and THL, we counted pixels in a horizontal line from the tip of the beak to the beak base, precisely at the beak/lore contrasting border (visible as a dark triangular beak base in documented polymorphs), as it is highly visible, even in images with lower quality (BL), and from the tip of the bill to the back of bird’s head (THL) (Figure 3). We defined BL as a vertical line connecting the tip of the bird’s beak to, e.g., the gape, skull or nostril, and THL as a vertical line connecting the tip of the bird’s beak to the rear of the skull [31]. Thus, we defined the BL/THL ratio as the number of BL pixels divided by the number of THL pixels−1.
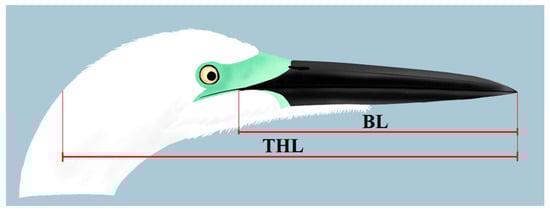
Figure 3.
Scheme of head and bill measurements in the Great White Egret images. BL = bill length, THL = total head length. Art by (KC).
We used Anderson–Darling K tests to compare distributions of THL/BL ratio among polymorph individuals from the images and A. a. alba and A. a. modesta subspecies. Calculations were performed in R software ver. 4.1.3 [32] using the Anderson–Darling K test in the kSamples package [33]. We used PixelZoomer 1.0.2 (M. Schuetz) to measure BL/THL proportion in images, Easy Paint Tool Sai 1.2.5 (SYSTEMAX Inc.) and GIMP 2.10.30 [34] for digital art, and FastStone Image Viewer software 7.5 (FastStone Soft; FastStone Corporation, Alberta, Canada) for image enhancement.
2.6. Analyses of Spatio-Temporal Distribution Patterns
Firstly, we analyzed spatial and temporal variation in the occurrence of all polymorphs. Then, we investigated whether there is any spatio-temporal pattern in the occurrence of particular morph groups.
General spatial patterns. In order to visualize generalized patterns of distribution for all cases and particularly for the selected polymorph groups (regarding leg or lore color) within the European continent, we performed kernel density estimation (KDE) for all polymorph cases. We visualized 95% and 50% kernel density isopleths indicating home and core areas of occurrence, respectively [35], for particular leg–lore, leg (Groups 1–3) and lore (Groups B–D) groups. We estimated utilization distribution with the ad hoc method used for the smoothing parameter (href) and then calculated 95% and 50% isopleths using the adehabitatHR [36] package in R software ver. 4.1.3 [32]. We created maps using ArcGIS Pro software version 2.9.3 (Esri, Redlands, CA, USA). The G test was performed in R software ver. 4.1.3 [32].
General temporal patterns. In order to determine general temporal distribution patterns of all documented cases of documented polymorphs in Europe, we used the G-test of goodness-of-fit, comparing the number of monthly observation events to the expected number, i.e., the sum of all sightings divided by the number of months. In order to find significant differences in documented polymorph abundance between particular seasons (spring, summer, autumn and winter), we conducted a series of post hoc paired G tests. To investigate the annual pattern of observations of documented polymorph individuals (n = 140), we used one sample circular analysis (OSCA) [37]. We visualized the results of OSCA on a rose diagram, exhibiting circular data, i.e., monthly observations of investigated cases. We also calculated a circular kernel density estimate of the data and circular mean with the bootstrapped 95% confidence interval in order to determine the temporal distribution of the occurrence of leg and lore polymorphs. OSCA was visualized in PAST 4.09 [37].
Spatio-temporal patterns of distribution of particular morphs. We used conditional inference trees (CIT) for the analysis of potential spatio-temporal patterns of polymorph distribution. CIT analysis is a non-parametric class of regression tree, which embeds tree-like regression models into possible interference theories [38]. The CIT analysis enabled us to find statistically significant criteria by dividing observations of polymorphic individuals. By taking such an approach, we were able to determine the frequency of occurrence for particular groups. Thus, we investigated whether the frequency of occurrence of particular groups differing in BL/THL ratio values (n = 113), leg–lore groups (3-digit code groups), leg groups (1–3), and lore groups (B-D) is affected by the observation location within Europe (expressed by latitude and longitude) and/or season. We used the following CIT formula: analyzed_component ~ season + longitude + latitude. Season effect consists of 4 levels: winter (December, January, and February), spring (March, April, and May), summer (June, July, and August), and autumn (September, October, and November). We did not use months in the analysis to avoid mixing circular and non-circular variables. We performed CIT analyses in R software ver. 4.1.3 [33] using the partykit package [38].
We further investigated (i.e., visualized utilization densities) only statistically significant results.
3. Results
In the leg–lore groups, the most common color schemes included 22C (28.6%; red legs + bright green lores), 33C (24.3%; pink legs + bright green lores), and 22B (15.7%; red legs + pale green lores).
In the leg groups, Group 3 (red legs) was the most frequently observed from all cases (49.3%). The frequency of observation of Group 2 (pink legs) and Group 1 (light legs) is 40.0% and 10.7%, respectively.
In the lore groups, Group C (bright green) was the most frequently observed from all cases (60.7%). The frequency of observation of Group B (pale green) and Group D (turquoise) is 30.0% and 9.3%, respectively.
3.1. General Spatial Patterns of Distribution
Core areas (50% utilization density) for all polymorphs were concentrated in the Netherlands (both in the Dutch coast of North Sea and inland Netherlands) and the southwestern coast of Norway (of the North Sea and Skagerrak) (Figure 4). Home areas (95% utilization density) for all polymorphs covered a wider area from northeast of the Scandinavian Peninsula in the north to the central Iberian Peninsula and the central Balkan Peninsula in the south, and from the Iberian Peninsula in the west to western Russia in the east (Figure 4).
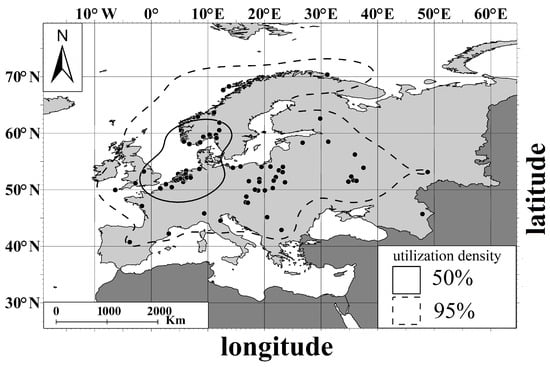
Figure 4.
Core area (50% of KDE) and home range (95% of KDE) of distribution for documented polymorph cases of the Great White Egret. Black points stand for records of morph individuals.
Core areas (50% utilization density) for leg and lore groups were concentrated in the Netherlands (both on the Dutch coast of the North Sea and inland Netherlands) (Figure 5A and Figure 6A). Leg-group 1 (light legs) also had a core area within western Russia, while that of Leg-group 2 (pink legs) was in Central Europe. The core area for Leg-group 3 (red legs) included mainly the Belgian and Dutch coastal zone and did not include Scandinavia (Figure 5A).
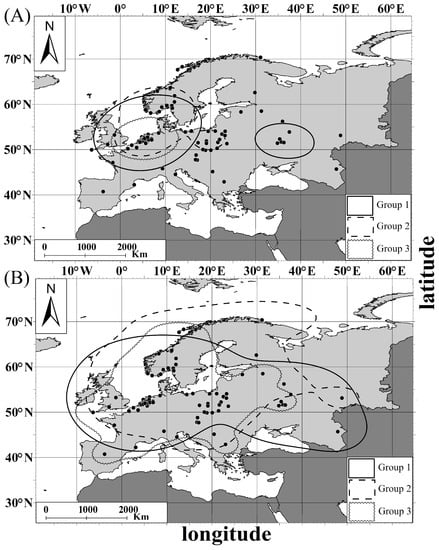
Figure 5.
Distribution of the Great White Egret leg groups (Groups 1–3): (A) core area (50% of KDE) of (B) home range (95% of KDE). Group 1—individuals with light legs; Group 2—individuals with pink legs; Group 3—individuals with red legs. Black points stand for records of morph individuals.
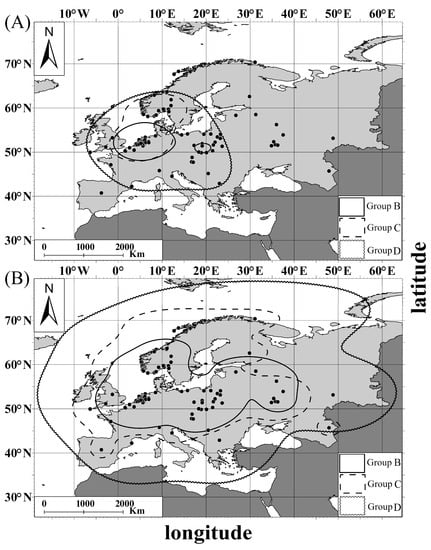
Figure 6.
Distribution of the Great White Egret lore groups: (A) core area (50% of KDE), (B) home range (95% of KDE). Group B—individuals with pale green lores; Group C—individuals with bright green lores; Group D—individuals with turquoise lores. Black points stand for records of morph individuals.
The home range (95% utilization density) for leg and lore groups covered a wider area from the northeast of the Scandinavian Peninsula in the north to the central Iberian Peninsula and the central Balkan Peninsula in the south, and from the Iberian Peninsula in the west to western Russia in the east (Figure 5B and Figure 6B). Lore-Group B (pale green lores) was characterized by the smallest home range area (western Europe, central Europe, and eastern Russia), while Lore-group D (turquoise lores) had the largest one, overlapping with the whole continent area (Figure 6B).
3.2. Temporal Patterns of Distribution of All Polymorphs
Core areas (50% utilization density) for every season were concentrated in the Netherlands (both on the Dutch coast of the North Sea and inland Netherlands). During spring and summer, core areas also reached the southwestern coast of Norway (of the North Sea and Skagerrak), while in autumn an isolated spot overlapping with Poland was indicated (Figure 7).
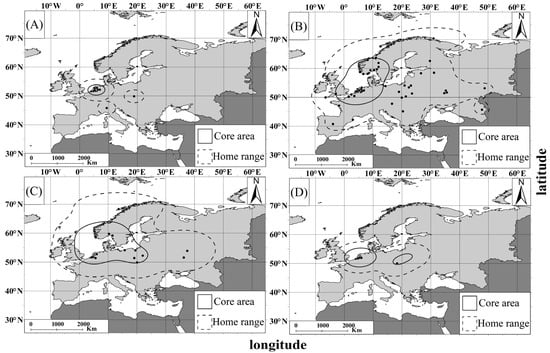
Figure 7.
Seasonal distribution of the Great White Egret morphs documented in internet images from Europe ((A) winter; (B) spring; (C) summer; (D) autumn). Dashed and continuous lines indicate 95% of KDE (home range) and 50% of KDE (core area), respectively. Black points stand for records of morph individuals encountered in every season.
The home range (95% utilization density) for every season covered wide areas of Europe. From spring (the most extensive) to summer, the home range area ranged from the northeastern Scandinavian Peninsula in the north to the central Iberian Peninsula and the central Balkan Peninsula in the south, and from the Iberian Peninsula in the west to western Russia in the east (Figure 7). The home range during autumn and winter overlapped with central and southern Europe (Figure 7).
The number of Great White Egret polymorphs documented in internet images from Europe differed significantly between the seasons (G-test; G = 41.94; df = 3; p < 0.01). The highest number was recorded in spring (March–May) (n = 87). The number of observations was lower in summer (June–August) (n = 23), autumn (September–November) (n = 16) and winter (December–February) (n = 14) (Figure 7). Post hoc analyses revealed that documented polymorphs occurred more frequently in spring than in summer (p = 0.001), autumn (p = 0.001), and winter (p = 0.001); other inter-seasonal differences were not significant (all p > 0.291).
The monthly distribution of observations of all polymorphs was not random (Rao’s U Test; U = 33.10; p = 0.001). Most of them were recorded in May (95% confidence) (n = 41; 29.2%) and April (n = 31; 22.1%). The circular mean indicates May as the month with the most frequent observations of all considered Great White Egret polymorphs (Figure 8).
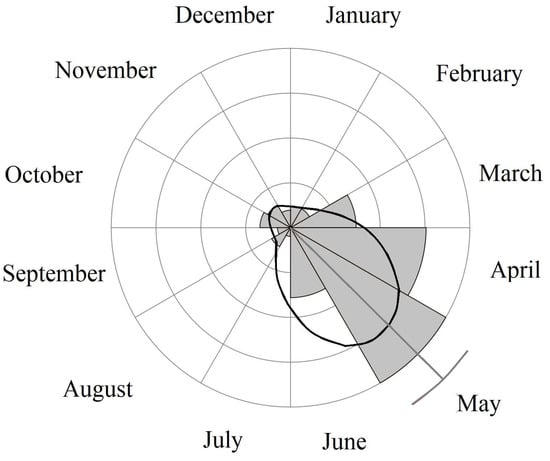
Figure 8.
Monthly distribution of Great White Egret polymorph observations in Europe in 2006–2022 (light-grey bars). Circular mean value with the bootstrapped 95% confidence interval (dark-grey line). Monthly distribution is smoothed via kernel density estimation (black line).
3.3. Spatio-Temporal Patterns of Distribution for Particular Color Groups
A conditional inference tree (CIT) analysis revealed no significant effects of latitude, longitude, or season on the frequency of occurrence of neither lore groups (Groups B–D) nor BL/THL ratios.
CIT analysis revealed a significant effect of latitude on the frequency of occurrence of 3-digit leg–lore groups. The first split divided observed polymorphs into groups according to latitude: Node 5 (>52.797° N) and Node 2 (≤52.797° N). Node 5, located in Northern Europe, was characterized by the highest contribution of morphs 33C (45.6%) and 22C (21.0%) (Figure 9). Node 2 was further split by latitude into groups recorded >47.12°N (Node 4) and ≤47.12°N (Node 3). Southern Europe Node 3 was characterized by the highest contribution of morphs 22D (37.5%) and 22C (25.0%), and Central Europe Node 4 by the prevalence of 22B (25.3%) and 22C (36.0%) forms (Figure 9).
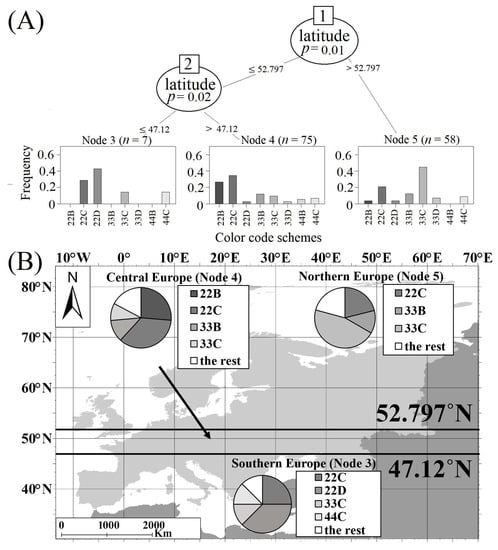
Figure 9.
(A) Conditional inference tree (CIT) characterizing factors affecting the spatio-temporal distribution patterns of observed Great White Egret morph individuals (leg–lore groups). The following factorial predictors were used as initial predictors: season, latitude, and longitude of observation. Encircled variables have the strongest association with the response variable. The p values listed at each encircled node represent the test of independence between the listed variable and the response variable (frequency of morph occurrence). Terminal nodes indicate variable levels characterizing the response variable and N indicates the number of found images. Histograms in terminal nodes indicate the frequency of particular morph occurrence. (B) Nodes recognized by CIT visualized on map (Southern Europe Node 3; Central Europe Node 4; Northern Europe Node 5).
CIT analysis revealed that among the analyzed effects (season, latitude, and longitude), only latitude significantly affected the frequency of occurrence of particular leg color groups (Groups 1–3). The first split divided observed polymorphs into groups according to latitude: Node 3 (>53.111° N) and Node 2 (≤53.111° N). Northern Europe Node 3 was characterized by the highest contribution of pink-legged forms (Group 3; 63%) (Figure 10). Southern Europe Node 2 was characterized by the highest contribution of red-legged forms (Group 2; 61%) (Figure 10).
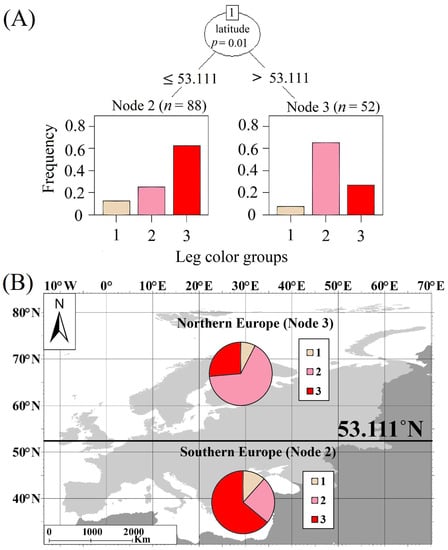
Figure 10.
(A) Conditional inference tree (CIT) characterizing factors affecting the spatio-temporal distribution patterns of observed Great White Egret morph individuals (leg groups). The following factorial predictors were used as initial predictors: season, latitude, and longitude of observation. Encircled variables have the strongest association with the response variable. The p values listed at each encircled node represent the test of independence between the listed variable and the response variable (frequency of morph occurrence). Terminal nodes indicate variable levels characterizing the response variable and N indicates the number of found images. Histograms in terminal nodes indicate frequency of particular morph occurrence. (B) Nodes recognized by CIT visualized on map (Southern Europe Node 2; Northern Europe Node 3). Group 1—individuals with light legs; Group 2—individuals with pink legs; Group 3—individuals with red legs.
3.4. Beak Length to Total Head Length Ratio Image Analysis
The distribution of BL/THL ratios strongly overlaps in two model subspecies, A. a. alba and A. a. modesta, and in polymorph individuals (Anderson–Darling K Test; p = 0.12). The achieved distribution of the analyzed parameter suggests uniformity in this trait ratio among Great White Egret individuals (Figure 11).
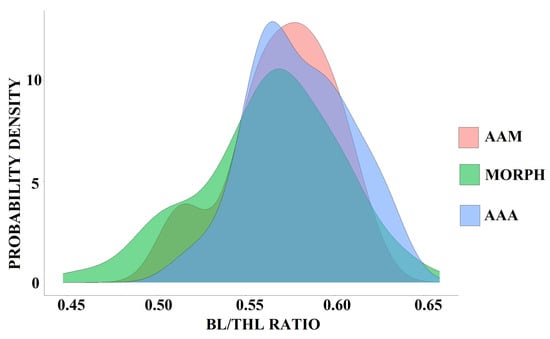
Figure 11.
Distribution of bill length to total head length (BL/THL) ratio values in Ardea alba alba (AAA) and A. a. modesta (AAM) subspecies and polymorphic individuals (MORPH).
4. Discussion
Our analyses revealed that polymorphs of the Great White Egret were observed in Europe during the whole year, with the highest intensity in the spring months, particularly in May. We found that the distribution of particular morphs followed some geographical patterns with core areas located mainly along the coast of the North Sea.
The observed polymorphs, as well as two Great White Egret subspecies, A. a. modesta and A. a. alba, did not differ in BL/THL ratio values, indicating that this feature is constant within the Great White Egret. Given this and the fact that some polymorphs match courtship coloration patterns described for A. a. modesta [19,21,29], a subspecies which has already been observed in Europe [21,26,29,30], thus, it cannot be excluded that these polymorphs may actually represent A. a. modesta long-distance vagrants in terms of breeding plumage. Vagrants from the east observed in Europe may have responded to climate warming in Europe [27]. Fluctuations of the Great White Egret populations observed in Europe [39], combined with poorly known dispersal/migration directions, highly dispersive behavior [19,20,26,40,41], or migratory tendencies in some A. a. modesta populations [19], may suggest long-distance dispersal.
Great White Egret polymorphs were present during the whole year, with the peak of observations in spring, during the breeding season. Nevertheless, we found that season was not an important factor affecting spatio-temporal pattern of distribution for particular polymorph groups, showing that the frequency of observations of particular forms was similar regardless of the season. Additionally, observations of other Ardeidae with bare parts of unexpected intense coloration have been reported mostly from the breeding period [7,15,42]. These observations include, e.g., legs (i.e., Cattle Egret Bubulcus ibis [42], Indian Pond Heron Ardeola grayii [6,7,15]) and lores (i.e., Cattle Egret [15], Indian Pond Heron [6,7,15]). The development of seasonal, nuptial unfeathered ornamentation is endocrine-driven, i.e., via androgen-induced blood flow (nuptial flush) [22,23,24]. Thus, the witnessed prolonged intense hues of egrets’ bare parts may have resulted from endocrine system malfunctions, such as an overproduction of androgens. As observations of less frequent, brightly colored phenotypes have been reported in many Ardeidae species [7,42], colors may be controlled by possible conservative loci in this family, the mutation of which may result in an intensive nuptial-like phenotype for a prolonged period of time (assuming that it is controlled genetically; see details in next sections). To fully understand the mechanisms driving polymorphic coloration, future molecular studies are needed.
We found that latitude was an important predictor of distribution for particular leg groups. Most pink-legged morphs (Group 2) were present in northern Europe, while red-legged ones (Group 3) were present in the southern part of the continent. We also found that some individuals sharing the same coloration schemes followed spatial distribution patterns, i.e., 22C, 33B, and 33C were more frequently observed in northern Europe; 22B, 22C, 33B, and 33C in central Europe; and 22C, 22D, 33C, and 44C in southern Europe. The high frequency of observations of polymorphic individuals in a particular location (northern Europe) may suggest that some local factors may be acting, e.g., compounds disrupting the hormonal balance or specificity of diet items (prey accumulating chemical contaminants or rich in pigment particles). It has been documented that the brightness of unfeathered ornaments intensifies during induced nuptial flush (testosterone propionate injection) in the buccal cavity, beaks, and lores [22]. Thus, it cannot be excluded that contact with or consumption of contaminated prey with chemical substances (e.g., heavy metals, polychlorinated biphenyls (PCBs), polycyclic aromatic hydrocarbons (PAHs) [43]), may lead to the accumulation and sometimes biomagnification of harmful compounds in avian body tissues, especially in the case of top predators [44], resulting in an unexpected bright phenotype. The vivid coloration of plumage and bare parts may also result from a diet rich in carotenoids [25].
We are aware of some limitations of our study (e.g., a limited number of observations in various areas). More complex analysis including genetic testing is required to achieve a full picture of the raised problem. Nevertheless, our study provides one of the first descriptions of spatio-temporal variability in the occurrence of color polymorphs of the Great White Egret in Europe, with discussion of its possible causes.
5. Conclusions
In conclusion, we found that the majority of polymorphs were observed during the breeding season, suggesting possible disruptions in levels of sexual hormones. These putative endocrine disturbances may be linked to hormonal disruptive contaminants, a specific diet rich in carotenoids, or possibly a genetic origin. It cannot be excluded that some of the documented individuals may represent long-distance vagrants of the subspecies A. a. modesta. Studies of spatio-temporal patterns of the occurrence of recorded polymorphs may be helpful for finding the causes of large variation in coloration schemes in polymorphic species.
Supplementary Materials
The following supporting information can be downloaded at: https://www.mdpi.com/article/10.3390/d15101063/s1, S1—Global databases used for finding images of the Great White Egret with a detailed list of used sources with acknowledgements. S2—Table summarizing differences between all Great White Egret subspecies with visualized differences among subspecies Ardea alba alba and A. a. modesta [42,45,46,47,48,49,50,51].
Author Contributions
Conceptualization: all authors; methodology: D.J. and B.M.-Ś.; investigation: B.M.-Ś. and K.C.; formal analysis: K.C. and D.J.; writing—original draft preparation: K.C.; writing—review and editing: all authors; visualization: K.C. All authors have read and agreed to the published version of the manuscript.
Funding
This research received no external funding.
Institutional Review Board Statement
Not applicable.
Informed Consent Statement
Not applicable.
Data Availability Statement
All data generated or analyzed during this study are included in this published article and its Supplementary Information Files.
Acknowledgments
We are thankful to Patryk Fiutek for help in searching for images of polymorphic individuals on Polish websites. We are highly grateful to the birdwatching portals Birdwatching.pl, Clanga.com, Gbif.org, Inaturalist.org, MacaulayLibrary.org (The Macaulay Library at the Cornell Lab of Ornithology), Observation.org, and Ornitho.pl for giving us permission to use photos for the purpose of this study. We appreciate the improvements in English usage made by Peter Lowther through the Association of Field Ornithologists’ program of editorial assistance.
Conflicts of Interest
The authors have no financial or proprietary interests in any material dis-cussed in this article.
References
- Ford, E.B. Polymorphism. Biol. Rev. 1945, 20, 73–88. [Google Scholar] [CrossRef]
- Roulin, A. The evolution, maintenance and adaptive function of genetic color polymorphism in birds. Biol. Rev. 2004, 79, 815–848. [Google Scholar] [CrossRef]
- Butcher, G.S.; Rohwer, S. The Evolution of Conspicuous and Distinctive Coloration for Communication in Birds. In Current Ornithology; Power, M., Ed.; Plenum Press: New York, NY, USA; Springer: Boston, MA, USA, 1989; Volume 6, pp. 51–108. [Google Scholar]
- Huxley, J. Morphism and evolution. Heredity 1955, 9, 1–52. [Google Scholar] [CrossRef]
- Galeotti, P.; Rubolini, D.; Dunn, P.O.; Fasola, M. Color polymorphism in birds causes and functions. J. Evol. Biol. 2003, 16, 635–646. [Google Scholar] [CrossRef]
- Sundar, K.G. Abundance and seasonality of Indian Pond Herons Ardeola grayii with red legs in Uttar Pradesh, India. Forktail 2004, 20, 131–132. [Google Scholar]
- Sundar, K.G. Distribution and extent of Pond Herons Ardeola grayii with red legs in India. Indian Birds 2005, 1, 112–115. [Google Scholar]
- Galeotti, P.; Rubolini, D. The niche variation hypothesis and the evolution of color polymorphism in birds a comparative study of owls, nightjars and raptors. Biol. J. Linn. Soc. 2003, 82, 237–248. [Google Scholar] [CrossRef]
- Al-Ali, A.; Bin Muzaffar, S.; Hamza, W. Does Seasonality, Tidal Cycle, and Plumage Color Influence Feeding Behavior and Efficiency of Western Reef Heron (Egretta gularis). Animals 2020, 10, 373. [Google Scholar] [CrossRef]
- Drucker, J.R.; Bennett, R.E.; Fried, L.K.; Kazour, M.L.; McNeil, D.J. New sightings of melanistic Green Herons (Butorides virescens) in the Caribbean suggest overlooked polymorphism. J. Caribb. Ornithol. 2018, 31, 38–47. [Google Scholar]
- Mayr, E. Is the Great White Heron a good species? Auk 1956, 73, 71–77. [Google Scholar] [CrossRef]
- Murton, R.K. Polymorphism In Ardeidae. Ibis 2008, 113, 97–99. [Google Scholar] [CrossRef]
- Green, M. Plumage Dimorphism in the Reddish Egret: Does Plumage Coloration Influence Foraging Habitat Use and Tactics? Waterbirds 2016, 28, 519–524. [Google Scholar] [CrossRef]
- Recher, H.F. Colour dimorphism and the ecology of herons. Ibis 2008, 114, 552–555. [Google Scholar] [CrossRef]
- Roshnath, R.; Jose, A. Color variation in Indian Pond Heron Ardeola grayii (Sykes, 1832) in Kannur District, Kerala. Mag. Zoo Outreach Organ. 2014, 29, 19–21. [Google Scholar]
- Kinney, J.A.S.; Luria, S.M.; Weitzman, D.O. Visibility of colors underwater. J. Opt. Soc. Am. 1967, 57, 802–809. [Google Scholar] [CrossRef] [PubMed]
- Iverson, E.N.; Karubian, J. The role of bare parts in avian signaling. Auk 2017, 134, 587–611. [Google Scholar] [CrossRef]
- Mayr, E. Of What Use Are Subspecies. Auk 1982, 99, 593–595. [Google Scholar]
- Kushlan, J.A.; Hancock, J.A. The Herons (Ardeidae); Oxford University Press: New York, NY, USA, 2005. [Google Scholar]
- Voisin, C. The Herons of Europe; A and C Black: London, UK, 2010. [Google Scholar]
- Pratt, H.D. Observations on species limits in the Great Egret (Ardea alba) complex. JHBC 2011, 1, 2. [Google Scholar]
- Wesley, H.D. Genetics of the red tarsi and feet in the Pond Heron. Newsl. Birdwatch 1993, 33, 73. [Google Scholar]
- Vogrin, M. Great White Egret Ardea alba, (sub) species modesta observed in NE Slovenia 2005. Biota 2005, 6, 79–80. [Google Scholar]
- Noble, G.K.; Wurm, M. The effect of testosterone propionate on the black-crowned night heron. Endocrinology 1940, 26, 837–850. [Google Scholar] [CrossRef]
- Wydoski, R.S. Seasonal Changes in the Color of Starling Bills. Auk 1964, 81, 542–550. [Google Scholar] [CrossRef]
- Tella, J.L.; Figuerola, J.; Negro, J.J.; Blanco, G.; Rodríguez-Estrella, R.; Forer, M.G.; Blázquez, M.C.; Hiraldo, F. Ecological, morphological and phylogenetic correlates of interspecific variation in plasma carotenoid concentration in birds. J. Evol. Biol. 2004, 17, 156–164. [Google Scholar] [CrossRef] [PubMed]
- Ławicki, Ł. The Great White Egret in Europe population increase and range expansion since 1980. Brit Birds 2014, 107, 8–25. [Google Scholar]
- Ralph, C.L. The control of color in birds. Am. Zool. 1969, 9, 521–530. [Google Scholar] [CrossRef] [PubMed]
- McCrimmon, D.A., Jr.; Ogden, J.C.; Bancroft, G.T.; Martínez-Vilalta, A.; Motis, A.; Kirwan, G.M.; Boesman, P.F.D. Great Egret (Ardea alba), version 1.0. In Birds of the World; Billerman, S.M., Ed.; Cornell Lab of Ornithology: Ithaca, NY, USA, 2020. [Google Scholar] [CrossRef]
- Kjellström, E. Recent and Future Signatures of Climate Change in Europe. AMBIO 2004, 33, 193–198. [Google Scholar] [CrossRef]
- Hancock, J. Field identification of West Palearctic white herons and egrets. Br. Birds 1984, 77, 451–457. [Google Scholar]
- Ouweneel, G. Great White Egrets with red legs and black bills. Br. Birds 1982, 75, 326. [Google Scholar]
- Demongin, L. Identification guide to birds in the hand. Br. Birds, 2016; privately published. [Google Scholar]
- R Core Team 2022. R: A Language and Environment for Statistical Computing; R Foundation for Statistical Computing: Vienna, Austria, 2022; Available online: https://www.r-project.org/ (accessed on 15 August 2022).
- Scholz, F.; Zhu, A.; Scholz, M.F.; SuppDists, D. Package ‘kSamples’. CRAN Ref. Man. 2019, 68. [Google Scholar]
- Kimball, S.; Mattis, P. GIMP 2.10.30. Available online: http://www.gimp.org (accessed on 20 January 2022).
- Okabe, A.; Satoh, T.; Sugihara, K. A kernel density estimation method for networks, its computational method and a GIS-based tool. Int. J. Geogr. Inf. Sci. 2009, 23, 7–32. [Google Scholar] [CrossRef]
- Calenge, C. The package adehabitat for the R software: Tool for the analysis of space and habitat use by animals. Ecol. Modell. 2006, 197, 516–519. [Google Scholar] [CrossRef]
- Hammer, Ø.; Harper, D.A.; Ryan, P.D. PAST: Paleontological statistics software package for education and data analysis. Palaeontol. Electron. 2001, 4, 9. [Google Scholar]
- Hothorn, T.; Hornik, K.; Zeileis, A. CTree: Conditional inference trees. Compr. R Arch. Netw. 2015, 8, 1–34. [Google Scholar]
- Hagemeijer, W.J.; Blair, M.J. The EBCC Atlas of European Breeding Birds; Poyser: London, UK, 1997. [Google Scholar]
- Cramp, S.; Simmons, K.E.L.; Ferguson-Lees, I.J.; Nicholson, E.M.; Ogilvie, M.A.; Olney, P.J.S.; Voous, K.H.; Wattel, J. Handbook of the Birds of Europe, the Middle East and North Africa Ostrich to Ducks; Oxford University: Oxford/London, UK; New York, NY, USA, 1977; Volume 1. [Google Scholar]
- Pratt, T.; Beehler, B. Birds of New Guinea; Princeton University Press: Princeton, NJ, USA, 2014. [Google Scholar] [CrossRef]
- Abdulali, H.; Alexander, H.G. Ardeidae With Red Legs. Ibis 2008, 94, 363. [Google Scholar] [CrossRef]
- Stejneger, L. Review of Japanese Birds. V—Ibises, storks, and herons. Proc. U. S. Natl. Mus. 1987, 10, 271–319. [Google Scholar] [CrossRef]
- Kobayashi, K. Some Observations on Egretta alba modesta in the Kansai District. Jap. J. Ornithol. 1953, 13, 43–48. [Google Scholar] [CrossRef]
- Hindwood, K.A.; Grieves, R.; Holland, L. The colors of the Soft Parts of Australian Egrets. S. Aust. Ornithol. 1969, 25, 95–97. [Google Scholar]
- Neginhal, S.G. The Birds of Ranganathittu. J. Bombay Nat. Hist. Soc. 1982, 79, 581–583. [Google Scholar]
- Del Hoyo, J.; Elliott, A.; Sargatal, J. Handbook of the Birds of the World; Lynx Editions: Barcelona, Spain, 1992; Volume 1. [Google Scholar]
- Ono, T.; Abe, K.; Mori, Y.; Nejima, R.; Iwasaki, T.; Aihara, M.; Miyata, K. Escherichia coli Panophthalmitis after Pecking by a Great Egret (Ardea alba). Case. Rep. Ophthalmol. 2020, 11, 466–472. [Google Scholar] [CrossRef]
- HeronConservation. Available online: https://www.heronconservation.org/ (accessed on 26 November 2021).
Disclaimer/Publisher’s Note: The statements, opinions and data contained in all publications are solely those of the individual author(s) and contributor(s) and not of MDPI and/or the editor(s). MDPI and/or the editor(s) disclaim responsibility for any injury to people or property resulting from any ideas, methods, instructions or products referred to in the content. |
© 2023 by the authors. Licensee MDPI, Basel, Switzerland. This article is an open access article distributed under the terms and conditions of the Creative Commons Attribution (CC BY) license (https://creativecommons.org/licenses/by/4.0/).