Abstract
Knowledge of the health of banana trees is critical for farmers in order to profit from banana cultivation. Fusarium wilt and banana blood disease (BBD), two significant diseases that infect banana trees, are caused by Fusarium oxysporum and Ralstonia syzygii, respectively. They have caused a decline in crop yield, as they destroy trees, starting sequentially from the pseudostem to the fruit. The entire distribution of BBD and fusarium on a plantation can be understood using advanced geospatial information obtained from multispectral aerial photographs taken using unmanned aerial vehicles (UAVs) and a reliable data field for infected trees. Vegetation and soil indices derived from multispectral aerial photographs, such as the normalized difference vegetation index, the modified chlorophyll absorption ratio index, the normalized difference water index (NDWI), and soil pH, may have to be relied upon to explain the precise location of these two diseases. This study used a random forest algorithm to handle a large dataset consisting of multispectral and spectral models. The results show that the soil indices, soil pH, and NDWI are the most important variables for predicting the spatial distribution of these two diseases. Simultaneously, the plantation area affected by BBD is more extensive than that affected by fusarium if variations in planted banana cultivars are not considered.
1. Introduction
The first use of spatial data to observe plant diseases has been well documented in studies, indicating its importance in analysis and the role of plants in supporting human life. Real et al. [1], began studying plant diseases caused by Microbotryum violaceum in Silene latifolia based on its spatial distribution. Of course, they considered using the location attributes of healthy and unhealthy plants as the main parameters. Plant location describes each plant’s connectedness to its neighboring systems, providing an overview of how diseases diffuse over time, increasing the number of affected plants. Plant neighboring systems, also known as plant communities, are believed to be one of the anthropogenic factors introduced by farmers that may have increased the number of plants affected by this disease [2]; this factor is strengthened by other ecological and environmental factors, including air temperature, soil, elevation, insects, and fungus [2,3].
In banana cultivation, many studies explain these factors in many ways. Géoffroy Dato et al. [4] tried to elaborate on the relative risks of banana diseases that vary between geographical areas and landscapes. Considering banana bunchy top disease (BBTD), which is caused by the banana bunchy top virus (BBTV), their study found that there is a spatial cluster of significant high-risk areas of BBTD distribution in banana fields in open and backyard gardens. Bananas growing in a monoculture system in both areas showed the most significant risk of BBTV infection, while implementing a multi-crop system showed lower risk, similar to the day after planting (DAP). Older banana crops with a higher density of stems are associated with the highest risk of BBTD. In contrast, securing clean seeds; implementing field isolation, intercropping, and the border vegetation of different species; and keeping distance between infected and uninfected fields are also significantly associated with a lower risk of BBTD, as these parameters correspond to the number of clusters that exist in highland banana gardens compared with lowland areas for both open and backyard gardens.
Regarding banana blood disease (BBD), we found that practicing field isolation, intercropping, and the border vegetation of different species methods were useless since the causative factors of BBD are more uncontrollable and sophisticated than those of BBTV. BBD is caused by Ralstonia syzygii subsp. celebesensis, a bacterial wilt that is causing significant crop losses in Indonesia and Malaysia and that can spread locally or in short distances through insects and possibly contaminated tools, water, and soil. It also likely spreads by utilizing both cultural and natural factors. This rapid expansion means it can be found in any geographical area; it was recently found in many places in Indonesia and many countries in Southeast Asia [5]. Moreover, two natural substances—water and soil—are easily used by Ralstonia syzygii subsp. celebesensis in order to spread; however, the exact way this occurs is yet to be fully understood. Some major environmental factors that influence disease distribution have been identified in banana fields in Brazil and are affected predominantly by cultivars, soil physical factors, and field management [6].
In the spatial context, the banana’s biodiversity and biogeography in Indonesia have been discussed [7]. In Indonesia, studies on the spread of many banana diseases like BBTV, BBD, and fusarium (which is caused by the fungus Fusarium oxysporum forma (f) speciale (sp.) cubense, which is, in turn, caused by Race 1 or Tropical Race 4 (TR4)) [8] seem more interested in elaborating on banana diseases in the tropics. These studies have described the infection process as occurring on the surface, from the soil to the plant [9,10,11]; therefore, obtaining spatial data on soil characteristics is mandatory.
Previously, observations of fusarium-infected bananas were conducted by Heck et al. [12] to investigate the spatial and temporal dynamics of using the georeferences of observed banana trees in 30 fields. Here, the spatial distribution of infected banana trees was obtained using statistical analysis. Similarly, in Ledesma et al. [13], the improvement was made by adding the spatial climatic data. Both studies successfully showed how fusarium-infected banana trees can be understood spatially. However, many studies that use spatial data, like satellite imagery from satellite observation, can be considered alternative approaches since they can cover a large area and possibly conduct multi-temporal analyses. Additionally, this approach can be combined with various environmental data (e.g., climate, soil, and plant), often using vegetation observations.
The soil index, also known as the normalized difference water index (NDWI), is capable of estimating the water content of soil, and this information is related to drought and soil moisture [14]. This index does not directly explain how healthy or unhealthy vegetation is [15]. However, Chen et al. [16] used NDWI to assess the potential of water content for corn (Zea mays) and soybeans (Glycine max), which they found to be 6 to 1.2 Kg/m2 of water. How about for the banana? Does the water content in the soil and banana plants correlate with the existence of BBD and fusarium? The relationship between fusarium and soil moisture has been explained in many studies. The survival of the fungus decreases with increased soil moisture [17,18,19], and Segura-Mena et al. [20] suggested a correlation between fungus survival and soil pH.
Since the soil is related to vegetation, the actual condition of the soil may influence vegetation growth. Ralstonia syzygii subsp. celebesensis and Fusarium oxysporum f. sp. cubense are too small to be investigated using satellite imagery, especially with a moderate resolution (Landsat and Sentinel 2). Similar to soil, the normalized difference vegetation index (NDVI) can be used to understand the quality of banana plants [21]. Studies have found that the information derived from NDVI allows one to distinguish between healthy and unhealthy plants [22]. Lower NDVI values indicate unhealthy vegetation; expectedly, plants affected by BBD and fusarium will have a lower NDVI value. Therefore, it is reasonable to use both NDVI values to explain the physical relationship between the NDVI values of group banana plantations (plant communities). Banana plants have less ability to conduct photosynthesis and lower chlorophyll in unhealthy vegetation.
The most recent studies on banana diseases using remote sensing data have shown progress in studying bananas. A study by Ye et al. [23] utilized eight vegetation indices (Vis) related to pigment absorption, namely, the NDVI, the normalized difference red-edge index [24], the green chlorophyll index [25], the red-edge chlorophyll index [26], the structural independent pigment index (SIPI) [27], the red-edge SIPI [28], the carotenoid index (CARI) [29], and the anthocyanin reflectance index (ARI) [30], along with plant growth changes, to determine the biophysical and biochemical characteristics of plants. All these VIs were integrated using multivariate analysis methods of calculating banana regions infected or not infected with fusarium wilt disease via binary logistic regression.
Compared with Ye et al. [20], the study by Zhang et al. [31] involved ten additional VIs and one soil index. Three visible-band and five multispectral-band images were processed using four supervised (support vector machine, random forest (RF), back propagation neural networks, and logistic regression) and two unsupervised (hotspot analysis and the iterative self-organizing data analysis technique algorithm) methods to detect the fusarium in banana canopies trees. Here, a renormalized difference vegetation index (RDVI) and wide dynamic range vegetation index (WDRVI) were used to monitor vegetation coverage and water stress due to their sensitivity to healthy vegetation and insensitivity to soil and solar geometry. Both the RDVI and the WDRVI can quantify the biophysical characteristics of crops and enable the dynamic monitoring of crop growth status [32,33]. Moreover, a transformed difference vegetation index is commonly used to monitor vegetation cover since it has a linear relationship with vegetation cover [34], and a modified simple ratio index (SRI) has also been considered since it has increased sensitivity to vegetation’s biophysical parameters. Furthermore, when the SR is incorporated into the RDVI formula, it can be used to estimate leaf area indices [35].
Besides the abovementioned VIs, a non-linear index (NLI) and modified NLI have been used to estimate biophysical information and incorporate the soil-adjusted vegetation index (SAVI) to account for soil background [36], and the green difference vegetation index (GDVI) [37] has an ability, similar to NDVI’s, to strengthen the SAVI to minimize the effects of soil pixels [38]. These two studies mentioned above highlighted the need to optimize the ability of VIs to interpret a tree’s biophysical properties (e.g., canopy). However, the use of a soil-related index has not been considered. As mentioned above, BBD and fusarium have increased their infectivity and spread, both controlled by the soil conditions. This soil bacterium and fungus reach their optimal life cycles when the soil conditions are suitable. Therefore, the novel approaches in this study make it different from any previous similar research. The objectives of the study are to show the precise location of the distribution of two banana diseases, BBD and fusarium, on a plantation using random forest and advanced geospatial information obtained from multispectral aerial photographs, which was derived to normalized difference vegetation index, modified chlorophyll absorption ratio index, normalized difference water index (NDWI), soil pH, and a reliable data field for infected trees.
2. Materials and Methods
2.1. Study Location
For this study, the local plantation—the Tropical Fruit Research Institute, Agricultural Technology Research and Assessment Installation (IP2TP)—was explored by the Ministry of Agriculture of the Republic of Indonesia. This institute is located in the Subang Regency in the northern part of West Java Province. Mainly focusing on fruit research, at least four banana cultivars, including Pisang Kepok (Musa spp., ABB), Pisang Ambon (Musa acuminata, AAA), Pisang Kapas (Musa spp., AAB), and Pisang Raja (Musa spp., AAB) are planted at this small plantation, which covers 40 hectares of land. As many as 5 hectares of this plantation are explicitly used for bananas (Figure 1).
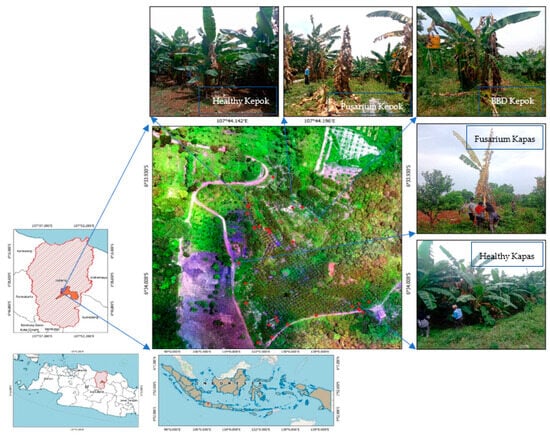
Figure 1.
The location for the study with respect to the distribution pattern of banana blood disease (BBD) and fusarium wilt using a multispectral aerial photograph in Subang, Indonesia. Red dots represent the location of individual banana trees infected with BBD or fusarium.
The Subang Regency spreads from the highlands to the lowlands, from south to north. It ranges from approximately 2.084 m above sea level (asl) to 0 m (asl) near the coastline of the Java Sea. The Indonesia Meteorological Agency (BMKG) documented that annual precipitation in the entire area of Subang ranges from 5167 millimeters (mm) in January to 4044 mm in December 2022 [39], with decadal variability. There has been a change in rainfall distribution in each period compared to the previous one, including changes in the rainfall pattern in the dry and rainy seasons; this change occurred from 1987 to 1996 and 1995 to 2004 [40].
Fusarium- and BBD-infected banana trees are similar, but in detail, both plant diseases can still be distinguished so that field investigations for data collection can be appropriately managed. The following visualization can be used as the foundation to differentiate both diseases in banana trees, as modified by [41,42].
- Fusarium wilt disease causes pseudostem cracking (yellow arrow in Figure 2b), while a BBD attack does not cause pseudostem cracking (Figure 2a).
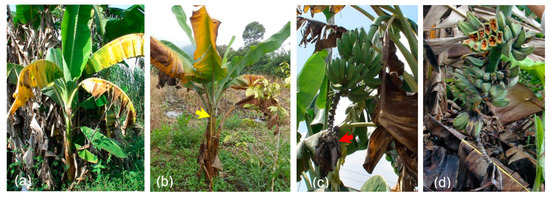 Figure 2. Comparison of individual trees of banana affected by BBD (a,c,d) and fusarium (b,d).
 - The symptoms appear on the inflorescences of plants attacked by BBD even though the fruits are still green, but the flowers (male buds) dry out (red arrow in Figure 2c). Plants attacked by fusarium wilt generally fail to produce flowers/fruit.
- BBD attacks on fruit cause fruit flesh to rot (Figure 2d), while fusarium wilt attacks on mature plants do not cause fruit rot. Fusarium wilt attacks on young plants cause plants to die before fruiting.
2.2. Data
2.2.1. Multispectral Aerial Photo Taken via UAV
Obtaining a multispectral aerial photograph of individual banana trees infected with BBD and fusarium is mandatory to understand the spatial distribution of BBD and fusarium wilt in a plantation. For this study, a Dji Matrice equipped with a Micasense camera was used to take 250 aerial photos that captured the entire area using six different bands, including blue, green, red, near-infrared (NIR), red-edge, and thermal bands (Table 1), from 150 m above the surface (Figure 3). It produced approximately 1500 photos covering the entire area where banana trees were planted. The orthophoto comes with un-calibrated pixel values and needs to be processed to obtain reflectance values using other satellite imagery. The process of generating an orthophoto and the calibration process run concurrently [43].

Table 1.
The specification of spectral bands obtained by the Micasense camera used for taking aerial photos of banana trees affected by banana blood disease (BBD) and fusarium wilt in Subang-Indonesia.
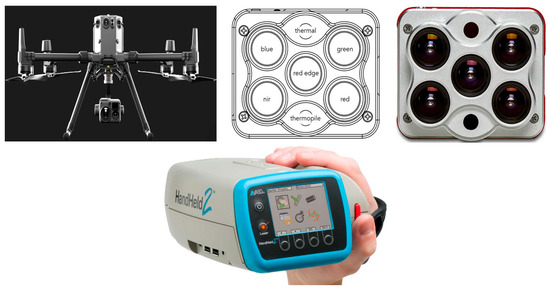
Figure 3.
A Dji Matrice (left) equipped with a Micasense camera (right) used to obtain the aerial photos and an ASD Fieldspec II Handheld spectrometer (below) used to acquire the spectral reflectance of banana trees affected by banana blood disease (BBD) and fusarium wilt in Subang, Indonesia. Source: https://enterprise.dji.com/matrice-300 (accessed on 22 May 2023), https://aeromao.com/product/micasense-altum/ (accessed on 22 May 2023), and [44].
2.2.2. Banana Leaf Spectral Reflectance
The banana leaves’ spectral reflectance values were obtained using an ASD Handheld spectrometer, which is a portable hyperspectral measurement tool that captures leaf reflectance in a portion of wavelength. It can record spectra ranging from 350 to 2429 nm and operate from 10.00 to 02.00 pm (Figure 3).
2.3. Methods
The entire workflow implemented in this study consisted of two parts: the retrieval of the UAV-derived spectral indices (Soil pH, NDVI, NDWI, and MCARI) and banana leaf spectral indices (implementing the RF algorithm to visualize the distribution of banana trees affected by BBD and fusarium) and comparing the RF result with the banana leaf spectral indices. Details of this research workflow are displayed in the diagram below (Figure 4).
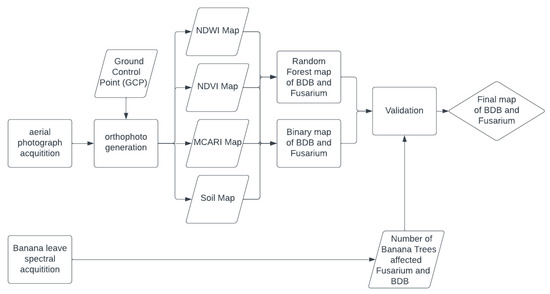
Figure 4.
Study workflow for banana blood disease (BBD) and fusarium wilt distribution patterns using multispectral aerial photographs and spectral reflectance in Subang, Indonesia.
The spectral bands available on the Micasense camera produced several vegetation and soil indices derived from the multispectral aerial photographs, including the NDVI, the MCARI, the NDWI, and soil pH. The NDVI distinguishes the health levels of banana trees. Stamaford et al. [45] explained that it is one of the spectral indices most frequently used in research and agriculture to rapidly and efficiently detect vegetation and assess overall plant health. It was introduced by Rouse et al. [21] and recently used in many studies in the agricultural field as the main parameter to understand the biophysical characteristics of vegetation, such as chlorophyll [46], the leaf area index [47], and nitrogen [48]. The NDVI is calculated based on the visible (red) and NIR light reflected by vegetation. Healthy vegetation (left) absorbs most of the red that hits it and reflects a large portion of NIR light. Unhealthy or sparse vegetation (right) reflects more visible and less NIR light. The formula used to estimate the banana trees’ health includes the NDVI, as shown in Equation (1).
Like the NDVI, the modified chlorophyll absorption in reflectance index (MCARI) can also be used to assess BBD and fusarium’s existence in banana trees. Ghazali et al. [45] also used these indices and their derivatives to determine the chlorophyll content in a paddy field, especially the MCARI. Both BBD and fusarium can make banana leaves dry—the leaves change from green to yellow and, finally, brown; indirectly, this decreases the ability of the remaining leaves to perform photosynthesis. To obtain the chlorophyll content of a leaf using the MCARI, at least three spectral bands are required: red edge, red, and green. The formula for estimating the chlorophyll content of banana trees is shown in Equation (2).
The NDWI was selected as the third spectral index for measuring the water content of banana leaves. Similar to the NDVI, the NDWI values derived were unitless and ranged from −1 to 1, representing the drought and wetness levels, respectively. NDWI was calculated from the green and NIR light reflected by vegetation [15]. Leaves on healthy vegetation can absorb adequate water as part of photosynthesis, while unhealthy leaves are less able or unable to absorb enough water. To calculate the NDWI, visible light (green) and NIR light are required. The formula for estimating the banana trees’ health includes NDWI, as shown in Equation (3).
A study on soil pH estimation and its relationship with the agricultural field was conducted using a modified soil pH index (SpHI) formula, as proposed by Ghazali et al. [49]. This study used a combination of blue, green, red, and shortwave infrared (SWIR) spectral bands from Landsat as a multiple regression equation. Because the Micasense camera had no SWIR bands available, the new formula for calculating the SpHI only comprises three visible bands: blue, green, and red (Equation (4)).
The spectral reflectance obtained corresponded to healthy Kepok banana trees and those infected with BBD and fusarium. These data also include the NDVI, MCARI, and NDWI, as proposed by Gao [15], unlike the formula proposed by McFeeters [14]. The results were similar to those of the multispectral aerial photos, but the formula differed and used the same band number as the wavelength center of the bands in the aerial photos. For instance, the and are equal to NIR and red band (Equations (5)), and are the same with red edge and green band (Equation (6)), and the SWIR band (Equation (7)).
3. Results
3.1. Status of Banana Trees Based on Aerial-Photo-Derived Spectral Indices
The NDVI map showed values ranging from −0.17 to 0.80. Although these values are unitless, the negative values indicate that water bodies exist around the plantation. In contrast, values ranging from 0 to 0.75 indicate bare soil and sparse and dense vegetation (Figure 3). NDVI values for Ambon, Kapas, and Kepok bananas ranged from 0.21 to 0.80, 0.42 to 0.73, and 0.05 to 0.74, respectively (Table 2). Additionally, the NDVI values seemed to be able to distinguish the type of disease that infected the bananas. The range of NDVI values for fusarium was smaller than those for BBD in Kepok and Ambon bananas. However, the highest (maximum) NDVI values did not always correspond to healthy bananas. All cultivars also had a good maximum NDVI value, whether they were infected with fusarium or BBD (Table 2). Therefore, we concluded that the NDVI has limitations when determining the type of disease affecting a banana tree.

Table 2.
Summary of the status of banana trees infected with banana blood disease (BBD) and fusarium wilt based on the derived NDVI, NDWI, MCARI, and soil pH values.
Unlike the NDVI map, the NDWI map showed that the level of soil moisture or available water content in the soil ranged from −0.32 to 0.02. This range explains the near-real-time soil conditions below the canopy; bare soil areas are the driest (Figure 5). In an ideal situation, the NDWI will show values ranging from −1 (driest) to 1 (wettest). Fusarium and BBD affecting Ambon and Kapas bananas had higher NDWI values than those affecting Kepok bananas. BBD was also found in the driest soil (Table 2). Similar to NDVI, MCARI values are also unitless, and their uncertainty in investigating banana diseases becomes the principal issue. However, the lowest MCARI value indicates the lowest photosynthesis ability. The MCARI values ranged from −33.352 to 26.083 and describe the variation in photosynthesis for all plants that appear in the aerial photos (Figure 5). This is likely only suitable for studying fusarium and BBD in Ambon and Kepok bananas with the lowest MCARI values (Table 2). A better interpretation was obtained using soil pH for all infected bananas. Fusarium and BBD are primarily found in soil with a pH lower than 6.00 (Table 2).
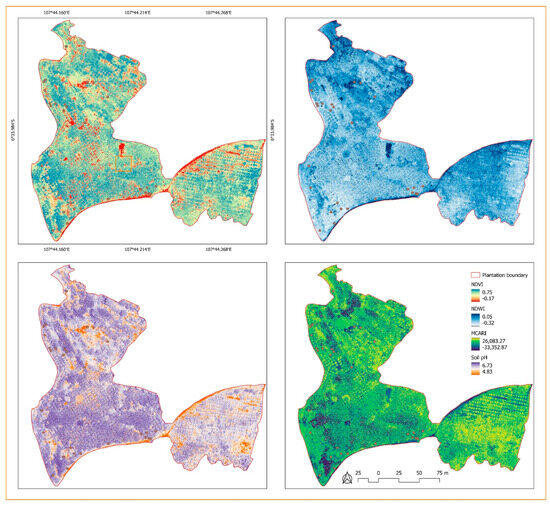
Figure 5.
Distribution of healthy and infected banana trees corresponding to aerial-photo-derived vegetation and soil indices: NDVI, NDWI, MCARI, and soil pH.
All of the derived vegetation index maps and their estimated values created uncertainties. However, we thought a different perspective might potentially provide new insight. Each banana cultivar observed in the field was supported by longitude and latitude, which also correspond to the vegetation–soil index values shown in Table 2. Therefore, once we sorted it from lowest to highest, we understood how the relative spatial distribution of fusarium and BBD can be related to environmental conditions based on vegetation- and soil-derived indices (Figure 5).
This explanation concerns the dynamic range of NDVI values rather than the sample size. Next, we considered using the extracted NDVI values to determine the number of banana trees infected with BBD and fusarium and healthy bananas. Once the median NDVI value was set to 0.50, the number of healthy bananas increased along with the NDVI values. In contrast, when the NDVI values decreased, the number of infected trees increased. However, the affected banana trees still had high NDVI values. This is better than many affected banana trees, which had decreased NDVI values (Figure 6a).

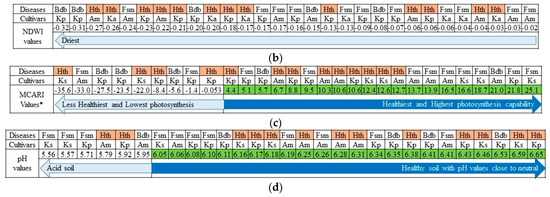
Figure 6.
Distribution of healthy and infected banana trees corresponding to the following aerial-photo-derived vegetation and soil indices: NDVI, NDWI, MCARI, and Soil pH. Fsm = fusarium, BBD = banana blood disease, Kp = Kepok, Ks = Kapas, Am = Ambon, and Hth = health. The number of healthy bananas increased along with the NDVI values (a), while observing affected banana trees seems ineffective when using NDWI since the soil environment is driest (b). The lower MCARI will follow by in-creasing affected trees (c), and in some areas, plantations had lower soil pH have the potential to increase the affected banana trees (d).
Unfortunately, the same procedure failed when applied to the NDWI values. Since the soil conditions during this study were the driest, even though it was not drought season, we found that, when the NDWI values decreased, the number of affected trees exceeded that of healthy trees. However, soil moisture is not our focus. We assumed that BBD and fusarium had already affected the banana trees a day or more before our observation. However, Clayton, Oritsejafor, and Yan and Nelson were confident in explaining that the survival of the fungus may decrease with increased soil moisture [17,18,19]. According to the present study’s findings, banana trees affected by BBD and fusarium increased when soil moisture (expressed by the NDWI) decreased (Figure 6b). Moreover, the NDWI explains how remote sensing can measure the actual water content absorbed by the soil in any condition [15,50].
Similar to the NDVI, the MCARI values ranged from −35 to 26, and we divided them into positive and negative groups. This helps explain why more healthy banana trees had positive (highest) values than negative (lowest) ones. Once the NDVI rises, it is likely to be followed by increasing MCARI values. Furthermore, lower NDVI values mean banana trees may become unhealthy and thus have decreased photosynthetic abilities (Figure 6c). For instance, a banana tree may have dried leaves due to drought. A study found that when a plant absorbs limited water, its leaves will slowly decolor and dry [51]. At this stage, hopefully, there is a possibility of making a connection between the NDVI, the MCARI, the NDWI, and soil pH, as well as the critical values used to identify the banana trees affected by BBD and Fusarium.
The soil pH map showed pH values ranging from 4.83 to 6.73 (Figure 5). The soil in the study area was situated in the acidic-to-almost-neutral range. The optimum soil pH for banana growth ranges from 5.8 to 6.5 [52,53]. Within this range, banana trees can grow well without worrying that they may not receive adequate soil minerals. With a low soil pH value (<5), there are often low associated concentrations of base cations and nutrients such as Ca2+ and Mg2+ or high aluminum and manganese contents [54,55,56]. In this study, some areas of the banana plantation had lower soil pH (<5), which means the soil there has increased the amounts of aluminum and manganese. However, the soil samples were infected, and the healthy banana trees that grew had a soil pH ranging from 5.56 to 6.65. According to Orr and Nelson [57], fusarium generally has an inversely proportional relationship with soil pH and will only grow well when the soil pH is lower. This explains our situation regarding the banana plantation (Figure 6d). The number of healthy banana trees was higher in places with high soil pH. Unfortunately, fusarium can still be found whether the soil pH is high or close to neutral [20].
All the results were satisfactory since the UAV-derived spectral indices (soil pH, NDVI, NDWI, and MCARI) all showed a moderate relationship (Figure 7), and the relationship between these spectral indices and the number of banana trees affected by BBD and fusarium was qualitative (Figure 6a–d). Regardless of this result, more attention needs to be paid to the unknown characteristics of the number of unhealthy and healthy banana trees in any condition, as explained by all derived spectral indices (soil pH, NDVI, NDWI, and MCARI). This might create an overlap and lead to difficulties in simultaneously determining where the clustered area of healthy banana trees is and where those affected by BBD and fusarium are. The overlapping situation shown in the paired scatterplot adequately explains how these difficulties arise.
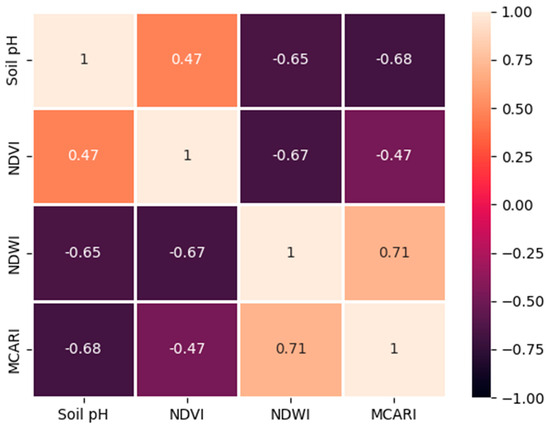
Figure 7.
Coefficient of determination (R2) for UAV-derived NDVI, NDWI, MCARI, and soil pH values in the banana plantation.
The scatterplot in Figure 8 shows the pairing of soil pH with the MCARI, the NDWI, and the NDVI in the first column. Here, the scatterplot of soil pH values and the NDVI, corresponding to disease types of the group of banana trees affected by fusarium, has a probability in the soil pH values below 6.0, while a BBD value below 6.50 is the same as with the healthy groups of bananas. These values correspond to NDVI values lower than 0.6 and are likely to yield unhealthy banana trees because of infection with BBD and fusarium. The intersection area between these three groups of bananas is slightly challenging to classify. Unfortunately, other scatterplots of soil pH against the MCARI and the NDWI showed a similar pattern (Figure 8). This situation needed to be handled in a sophisticated manner. Therefore, the distribution of BBD-infected, fusarium-infected, and healthy banana trees was appropriately mapped. Similar to the first column, the scatterplot in the second through fourth columns had random patterns, while the one between the NDWI and the MCARI did not and showed that healthy banana trees are likely separated from unhealthy banana trees.
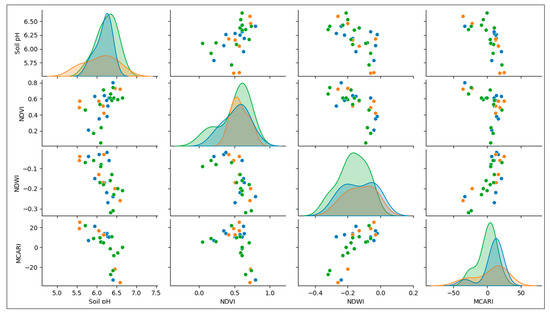
Figure 8.
Relationship between the NDVI, the NDWI, the MCARI, and soil pH and its potential for distinguishing the types of diseases affecting banana trees.
The UAV-derived soil information, represented by the NDWI and soil pH, and the vegetation information, represented by the MCARI and the NDWI, were linked together as the main parameters to explain the existence of BBD and fusarium at a plantation scale (Figure 7). It is surprising that all the parameters mostly had a moderate relationship. First was the lowest-to-highest coefficient of determination (R2), 0.47, −0.65, and −0.68 for soil pH against the NDVI, the NDWI, and the MCARI, respectively. Soil pH can explain the condition of banana trees at a 47% accuracy. A moderate positive correlation was observed and showed that the number of healthy bananas increased as the NDVI values also increased (Figure 6a). Soil pH showed a moderate negative relationship (65%) with the NDWI in terms of describing banana diseases. This relationship is consistent with the finding that an increase will follow a decrease in NDWI values in the number of affected trees. A slightly higher negative correlation was observed between soil pH and the MCARI. It reached 68% when using the relationship between soil pH and MCARI while explaining BBD and fusarium. For more detail on all the possible relationships between the indices, please see the pairwise correlation matrices in Figure 8.
3.2. The Distribution of BBD and Fusarium Wilt Based on Aerial-Photo-Derived Spectral Indices
A distribution map of affected and healthy banana trees derived using the RF algorithm showed a dominance of fusarium, followed by BBD; healthy banana trees were the least dominant (Figure 9). From this map, it is hard to say whether the entire banana plantation is affected. However, since banana trees are not entirely planted in this area and these two diseases are significant factors causing a decline in banana production, mitigating and limiting BBD and fusarium distribution must be a priority.
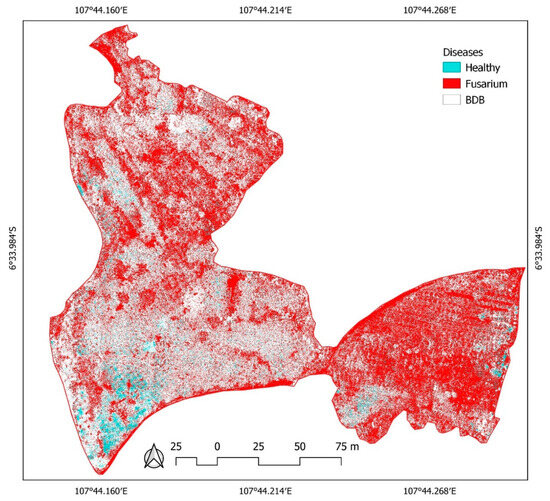
Figure 9.
Distribution of healthy banana trees and those affected by BBD and fusarium based on UAV-derived NDVI, NDWI, MCARI, and soil pH values in the banana plantation, generated using a random forest algorithm.
Unfortunately, this study’s RF and available dataset can neither determine when BBD and fusarium first attacked the banana trees nor can it detect the level of infection with BBD and fusarium. These two diseases affected all the mature banana trees. Using UAV-derived spectral indices—the NDVI, the MCRI, the NDWI, and soil pH—we satisfactorily determined the distribution of BBD and fusarium. As the study by Zhang et al. [31] stated, derived red-edge band spectral indices can yield similar information. Here, MCARI is critical in determining whether the banana trees are healthy or infected. The Gini index values had the highest score at about 0.35 (35%), while the NDWI, NDVI, and soil pH scores were 0.28, 0.22, and 0.15, respectively (Table 3). Along with this result, the overall accuracy for distribution classification reached 100% based on the RF and spectral indices used for 5 hectares of the plantation (Table 4).

Table 3.
A summary of the importance of UAV-derived NDVIs, NDWIs, MCARIs, and soil pH for the classification of the distribution of healthy banana trees and those affected by BBD and Fusarium.

Table 4.
Comparison matrices of classification results for healthy and affected banana trees based on the random forest algorithm.
4. Discussion
Achieving a perfect classification accuracy at 100% using an RF algorithm is rare. Studies use large training sample sizes while, at the same time, considering their critical and optimal sizes [58]. Of course, the critical size must be lower than the optimal. Since this study only depends on 29 samples, it was certainly limited. However, in some cases, as explained by Luan et al. [59], the predictive performance of the RF model can be substantially improved when the sample size increases from 10 to 30 sites, but less improvement is evident with larger datasets. We ensured that, when the sample size used to run the RF decreased to the smallest size (e.g., 5, 10, 15, or 20) and this sample size’s class attribute corresponds to all plant diseases, the classification accuracy will be lower compared with the maximum collected samples size [60]. It will not continuously improve the accuracy once it uses the largest sample size. On the one hand, the increasing sample size can improve the predictive power of the RF models, but the effects are constrained. On the other hand, implementing the RF algorithm is still possible. Although the sample size is limited, the RF model may benefit from improving predictive performance by using an ensemble of basic tree learners from small datasets [61].
In the real world, Pisang Kepok, Pisang Ambon, and Pisang Kapas bananas have different genome configurations, but they are classified as plantains (Kepok and Kapas) and bananas (Ambon). However, this comparison does not explain how to identify whether the banana has the potential to be affected by BBD and fusarium. We started with sensing technology using the spectral wavelength range using a handheld spectroradiometer. Through the collection of spectral reflectance from 350 to 2425 nm, an observer can determine what occurred during the BBD and fusarium infection process. Physically, the leaves on the affected banana trees turn from green to yellow and, finally, to dark brown.
BBD and fusarium not only cause leaf decolorization but also cause a decrease in a tree’s ability to absorb water from the air and soil. An increase in the reflectance values from 1000 to 2500 nm indicates decreasing water absorption by the plant. Since the amount of water absorbed by the leaves and soil corresponds to the leaf and soil moisture, the reflectance values will be lower. This is similar to the change that occurs when the reflectance values range between 350 and 1000 nm. This spectral range corresponds to chlorophyll, xanthophyll, and other leaf pigments that play a role in biophysical and chemical processes, including the rate of photosynthesis. As the reflectance value increases, the plant’s photosynthetic ability decreases, and the rate of regeneration of leaf pigments also decreases. Once this happens, the banana trees might die, whatever their name or genome configuration.
Furthermore, the spectral pattern in Figure 10 above explains how the spectral reflectance of healthy, mature banana leaves and those affected by BBD and fusarium can be used to distinguish the type of disease affecting a tree. First, the fusarium-infected trees’ spectral patterns had lower reflectance ranging from 1000 to 2500 nm compared with those of the healthy banana trees. This implies that the banana trees infected with fusarium have a lot of water in their soil and leaves. In contrast, the BBD-infected trees had less water in their soil and leaves. Since it is impossible to observe the presence of BBD in Kapas and Ambon bananas because of unavailable spectral data for both cultivars, this explanation is only relevant for Kepok bananas (Figure 10b,c).
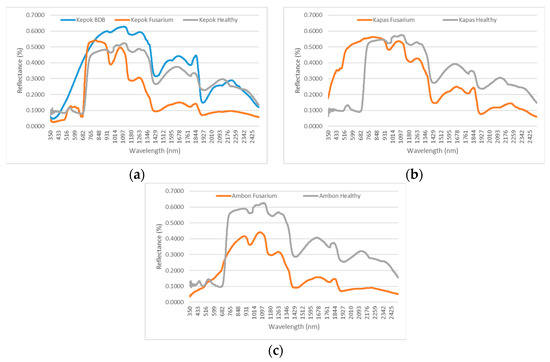
Figure 10.
Spectral pattern comparison for three cultivars of banana trees affected by BBD and fusarium, observed based on spectral measurements.
With a spectral reflectance ranging between 350 and 1000 nm, it is safe to say that the Kepok and Kapas bananas have the highest reflectance values for BBD and fusarium in this region compared with healthy banana trees of the same cultivars. Both cultivars experience abnormalities in the function of chlorophyll, xanthophyll, and other leaf pigments related to their biophysical and chemical processes (Figure 10a,b). However, a different pattern is shown by Ambon cultivars. In the red region at 600 to 700 nm, Ambon banana trees affected by fusarium have the highest reflectance compared with the healthy banana trees. However, the spectral reflectance value between 350 and 599 nm shows a standard pattern (Figure 10c). At the same time, when observing the Kapas affected by Fusarium and their healthy counterparts, we found a significant difference in their spectral reflectance. An in-depth investigation should be conducted in the future.
The R2 is another parameter critical to ensuring that BBD and fusarium are detected and that a promising result can be produced using spectral reflectance. It successfully enhanced the ability of the UAVs and their multispectral sensors to map disease distribution and that of the spectroradiometer to deeply explore the leaves’ and trees’ biophysical and chemical processes.
Since the soil spectral reflectance is absent, utilizing data from the spectroradiometer can only characterize the relationship between the NDVI, the MCARI, and the NDWI. In this study, we obtained three types of correlation between these spectral indices: a moderately positive relationship between the NDVI and the MCARI, with an R2 of 0.66; a low negative correlation between the NDWI and the MCARI, with an R2 of −0.37; and a highly negative correlation between the NDVI and the NDWI, with an R2 of −0.85. Compared with the similar spectral indices derived using UAVs, the correlation between the NDVI and the MCARI was negative, with an R2 of −0.47; between the NDWI and the MCARI, it was moderately positive, with an R2 of 0.71; and between NDVI and NDWI, it was negative, with an R2 of −0.67 (Figure 11).
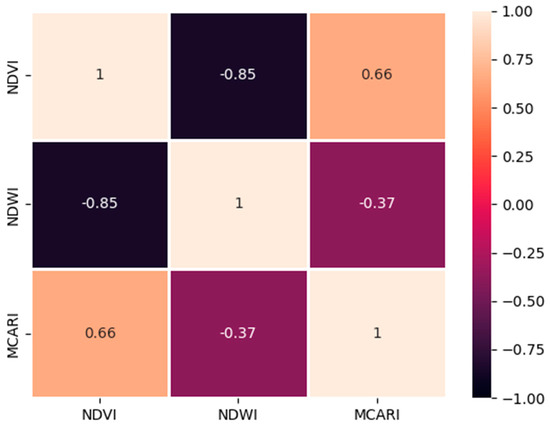
Figure 11.
Coefficient of determination (R2) for spectroradiometer-derived NDVI, NDWI, and MCARI values in the banana plantation.
The correlations between the UAV and spectroradiometer-derived NDWI and MCARI showed a decrease in R2 values from 0.71 to 0.66 (Figure 11). Although both values indicate a moderate correlation strength, this does not explain the different performances of the two sensors. This situation occurred because the band combination used for the UAV-derived NDWI differed from that used for the spectroradiometer-derived NDWI. Since the UAVs derived the NDWI by using the green and NIR bands, they can detect the soil’s water content but not the leaves. As the soil moisture decreases, both reflectance band values increase. This pattern means that the reflectance fluctuates once the amount of soil–water absorbed changes. The same NIR band, in a spectroradiometer, always shows a higher reflectance for healthy leaves and corresponds with the amount of chlorophyll and the photosynthetic and water absorbance abilities.
At this point, the NIR bands show similar behavior. The green bands of the healthy leaves have lower reflectance values (about three or six times smaller) than the NIR bands. This reflectance value is lowest when the level of healthy leaves increases; however, the reflectance cannot penetrate past the leaves and reach the soil surface. This is why the correlation values for the NDWI in the UAVs decrease when monitored using a spectroradiometer (Table 5). However, similar changes with an increasing R2 value also occurred for NDVI–NDWI and NDVI–MCARI comparisons. These two comparisons indicate two different analyses, along with spectral and spatial resolution differences. Even if a UAV’s aerial photographs can observe objects in centimeters (cm), the spectroradiometers can observe smaller objects. Even though both measurements (using UAVs and spectroradiometers) were conducted using the same spectral wavelength range, in general, both R2 values obtained from the UAV- and spectroradiometer-derived spectral indices enhanced each other. For details, see Table 5.

Table 5.
Comparison of the correlation strength indicated by the coefficient of determination (R2) change for UAV- and spectroradiometer-derived spectral indices.
Furthermore, we can learn from what Segura et al. [62] found by taking Gros Michel bananas (Musa AAA) as samples. Their study found that, with an increase in soil pH, a reduction in the incidence of fusarium wilt occurred in almost all cases. This is why the number of healthy bananas increased and the number of infected bananas reduced with high soil pH. As suggested by Thi et al. [63] fusarium wilt not only impacts the overall yield during the time of infection but also affects the land used for banana cultivation for the next 20 years. In addition, all affected banana trees may have to be removed to solve the problem [64,65]. However, fusarium spores will remain in the soil, and as a result, reinfection of new banana accessions in the same area is very likely in the absence of complete soil disinfection [66].
5. Conclusions
Banana trees affected by BBD and fusarium were successfully detected on a small plantation scale. The methods used have the potential to be applied to a large plantation. They are advantageous for sustainable banana cultivation and bridging the gap between remote sensing technology-based photogrammetry and biological and plant disease observations. Based on the spectral reflectance measurement, the banana leaves’ biophysical and chemical characteristics provided new insight into how BBD and fusarium can be explained by fluctuating reflectance values in a specific wavelength range. Both observations have different standards of procedure but still strengthen each other. Therefore, the findings of this study are promising and interconnected. Both methods could be considered for use in an integrated mode for future investigations. This will help map out the disease distribution and reveal the level of infection in banana trees with BBD and fusarium, as well as the time taken for infection to occur. Furthermore, the process of determining the infection rate, based on the exact calculation of how much banana fruit production can be estimated during the spread of banana diseases, can occur in the plantation, allowing stakeholders to develop future policies.
Author Contributions
This research article was arranged according to the individual contributions of the authors. Conceptualization, K.W. and F.M.D.; methodology, K.W. and M.F.G.; software and validation, M.F.G. and T.M.S.; formal analysis and investigation, M.F.G., L.F.Y., D.S., T.M.S. and A.S.; resources and data curation, T.M.S.; writing—original draft preparation, K.W., F.M.D. and M.F.G.; writing—review and editing, L.F.Y.; visualization, M.F.G.; supervision, K.W. and F.M.D.; project administration, L.F.Y.; funding acquisition, K.W. All authors have read and agreed to the published version of the manuscript.
Funding
This research received funding from Lembaga Pengembangan Ilmu dan Teknologi, Institut Teknologi Bandung in 2022.
Institutional Review Board Statement
Not applicable.
Data Availability Statement
Not applicable.
Conflicts of Interest
The authors declare no conflict of interest.
References
- Real, L.A.; McElhany, P. Spatial Pattern and Process in Plant-Pathogen Interactions. Ecology 1996, 77, 1011–1025. [Google Scholar] [CrossRef]
- Halliday, F.W.; Jalo, M.; Laine, A.L. The Effect of Host Community Functional Traits on Plant Disease Risk Varies along an Elevational Gradient. eLife 2021, 10, e67340. [Google Scholar] [CrossRef] [PubMed]
- Ampt, E.A.; van Ruijven, J.; Zwart, M.P.; Raaijmakers, J.M.; Termorshuizen, A.J.; Mommer, L. Plant Neighbours Can Make or Break the Disease Transmission Chain of a Fungal Root Pathogen. New Phytol. 2022, 233, 1303–1316. [Google Scholar] [CrossRef] [PubMed]
- Géoffroy Dato, K.M.; Dégbègni, M.R.; Atchadé, M.N.; Tachin, M.Z.; Hounkonnou, M.N.; Omondi, B.A. Spatial Parameters Associated with the Risk of Banana Bunchy Top Disease in Smallholder Systems. PLoS ONE 2021, 16, e0260976. [Google Scholar] [CrossRef]
- Ray, J.D.; Subandiyah, S.; Rincon-Florez, V.A.; Prakoso, A.B.; Mudita, I.W.; Carvalhais, L.C.; Markus, J.E.R.; O’Dwyer, C.A.; Drenth, A. Geographic Expansion of Banana Blood Disease in Southeast Asia. Plant Dis. 2021, 105, 2792–2800. [Google Scholar] [CrossRef]
- Heck, D.W. Factors Affecting the Spatio-Temporal Dynamics of Fusarium Wilt of Bananas in Brazil; Federal University of Vicosa: Vicosa, Brazil, 2019. [Google Scholar]
- Wikantika, K.; Ghazali, M.F.; Dwivany, F.M.; Novianti, C.; Yayusman, L.F.; Sutanto, A. Integrated Studies of Banana on Remote Sensing, Biogeography, and Biodiversity: An Indonesian Perspective. Diversity 2022, 14, 277. [Google Scholar] [CrossRef]
- Soesanto, L.; Mugiastuti, E.; Ahmad, F. Diagnosis Lima Penyakit Utama Karena Jamur Pada 100 Kultivar Bibit Pisang. J. Hama Dan Penyakit Tumbuh. Trop. 2013, 12, 36–45. [Google Scholar] [CrossRef]
- Pegg, K.G.; Coates, L.M.; O’Neill, W.T.; Turner, D.W. The Epidemiology of Fusarium Wilt of Banana. Front. Plant Sci. 2019, 10, 1395. [Google Scholar] [CrossRef]
- Wibowo, A.; Alboneh, A.R.; Somala, M.; Subandiyah, S.; Pattison, T.; Molina, A. Increasing Soil Suppressivity to Fusarium Wilt of Banana through Banana Intercropping with Allium spp. J. Perlindungan Tanam. Indones. 2015, 19, 33–39. [Google Scholar] [CrossRef][Green Version]
- Saremi, H.; Burgess, L.W. Effect of Soil Temperature on Distribution and Population Dynamics of Fusarium Species. J. Agric. Sci. Technol. 2006, 2, 119–125. [Google Scholar]
- Heck, D.W.; Dita, M.; Del Ponte, E.M.; Mizubuti, E.S.G. Incidence, Spatial Pattern and Temporal Progress of Fusarium Wilt of Bananas. J. Fungi 2021, 7, 646. [Google Scholar] [CrossRef] [PubMed]
- Fernández-ledesma, C.M.; Garcés-fiallos, F.R.; Rosso, F.; Cordero, N.; Ferraz, S.; Durigon, A.; Portalanza, D. Assessing the Risk of Fusarium oxysporum f. sp. Cubense Tropical Race 4 Outbreaks in Ecuadorian Banana Crops Using Spatial Climatic Data. Sci. Agropecu. 2023, 14, 301–312. [Google Scholar] [CrossRef]
- McFeeters, S.K. The Use of The Normalized Difference Water Index (NDWI) in the Delineation of Water Feature. Int. J. Remote Sens. 1996, 17, 425–1432. [Google Scholar] [CrossRef]
- Gao, B.C. NDWI-A Normalized Difference Water Index for Remote Sensing of Vegetation Liquid Water from Space. Remote Sens. Environ. 1996, 58, 257–266. [Google Scholar] [CrossRef]
- Chen, D.; Huang, J.; Jackson, T.J. Vegetation Water Content Estimation for Corn and Soybeans Using Spectral Indices Derived from MODIS Near- and Short-Wave Infrared Bands. Remote Sens. Environ. 2005, 98, 225–236. [Google Scholar] [CrossRef]
- Clayton, E.E. The Relation of Soil Moisture to the Fusarium Wilt of the Tomato. Am. J. Bot. 1923, 10, 133–147. [Google Scholar] [CrossRef]
- Oritsejafor, J.J. Influence of Moisture and PH on Growth and Survival of Fusarium oxysporum f. sp. Elaeidis in Soil. Trans. Br. Mycol. Soc. 1986, 87, 511–517. [Google Scholar] [CrossRef]
- Yan, H.; Nelson, B.J. Effects of Soil Type, Temperature, and Moisture on Development of Fusarium Root Rot of Soybean by Fusarium solani (FSSC 11) and Fusarium Tricinctum. Plant Dis. 2022, 106, 2974–2983. [Google Scholar] [CrossRef]
- Segura-Mena, R.A.; Stoorvogel, J.J.; García-Bastidas, F.; Salacinas-Niez, M.; Kema, G.H.J.; Sandoval, J.A. Evaluating the Potential of Soil Management to Reduce the Effect of Fusarium oxysporum f. sp. Cubense in Banana (Musa AAA). Eur. J. Plant Pathol. 2021, 160, 441–455. [Google Scholar] [CrossRef]
- Rouse, J.W.; Haas, R.H.; Scheel, J.A.; Deering, D.W. Monitoring Vegetation Systems in the Great Plains with ERTS. In Proceedings of the 3rd Earth Resource Technology Satellite Symposium, Washington, DC, USA, 10–14 December 1974; Volume 1, pp. 309–317. [Google Scholar]
- Razali, S.M.; Nuruddin, A.A.; Lion, M. Mangrove Vegetation Health Assessment Based on Remote Sensing Indices for Tanjung Piai, Malay Peninsular. J. Landsc. Ecol. 2019, 12, 26–40. [Google Scholar] [CrossRef]
- Ye, H.; Huang, W.; Huang, S.; Cui, B.; Dong, Y.; Guo, A.; Ren, Y.; Jin, Y. Recognition of Banana Fusarium Wilt Based on UAV Remote Sensing. Remote Sens. 2020, 12, 938. [Google Scholar] [CrossRef]
- Gitelson, A.; Merzlyak, M.N. Spectral Reflectance Changes Associated with Autumn Senescence of Aesculus hippocastanum L. and Acer platanoides L. Leaves. Spectral Features and Relation to Chlorophyll Estimation. J. Plant Physiol. 1994, 143, 286–292. [Google Scholar] [CrossRef]
- Gitelson, A.A.; Gritz, Y.; Merzlyak, M.N. Relationships between Leaf Chlorophyll Content and Spectral Reflectance and Algorithms for Non-Destructive Chlorophyll Assessment in Higher Plant Leaves. J. Plant Physiol. 2003, 160, 271–282. [Google Scholar] [CrossRef]
- Gitelson, A.A.; Viña, A.; Ciganda, V.; Rundquist, D.C.; Arkebauer, T.J. Remote Estimation of Canopy Chlorophyll Content in Crops. Geophys. Res. Lett. 2005, 32, 1–4. [Google Scholar] [CrossRef]
- Penuelas, J.; Inoue, Y. Reflectance Indices Indicative of Changes in Water and Pigment Contents of Peanut and Wheat Leaves. Photosynthetica 1999, 36, 355–360. [Google Scholar] [CrossRef]
- Ramoelo, A.; Skidmore, A.K.; Cho, M.A.; Schlerf, M.; Mathieu, R.; Heitkönig, I.M.A. Regional Estimation of Savanna Grass Nitrogen Using the Red-Edge Band of the Spaceborne RapidEye Sensor. Int. J. Appl. Earth Obs. Geoinf. 2012, 19, 151–162. [Google Scholar] [CrossRef]
- Zhou, X.; Huang, W.; Zhang, J.; Kong, W.; Casa, R.; Huang, Y. A Novel Combined Spectral Index for Estimating the Ratio of Carotenoid to Chlorophyll Content to Monitor Crop Physiological and Phenological Status. Int. J. Appl. Earth Obs. Geoinf. 2019, 76, 128–142. [Google Scholar] [CrossRef]
- Gitelson, A.A.; Merzlyak, M.N.; Chivkunova, O.B. Optical Properties and Nondestructive Estimation of Anthocyanin Content in Plant Leaves. Photochem. Photobiol. 2001, 74, 38. [Google Scholar] [CrossRef]
- Zhang, S.; Li, X.; Ba, Y.; Lyu, X.; Zhang, M.; Li, M. Banana Fusarium Wilt Disease Detection by Supervised and Unsupervised Methods from UAV-Based Multispectral Imagery. Remote Sens. 2022, 14, 27. [Google Scholar] [CrossRef]
- Roujean, J.L.; Breon, F.M. Estimating PAR Absorbed by Vegetation from Bidirectional Reflectance Measurements. Remote Sens. Environ. 1995, 51, 375–384. [Google Scholar] [CrossRef]
- Gitelson, A.A. Wide Dynamic Range Vegetation Index for Remote Quantification of Biophysical Characteristics of Vegetation. J. Plant Physiol. 2004, 161, 165–173. [Google Scholar] [CrossRef] [PubMed]
- Bannari, A.; Asalhi, H.; Teillet, P.M. Transformed Difference Vegetation Index (TDVI) for Vegetation Cover Mapping. Int. Geosci. Remote Sens. Symp. 2002, 5, 3053–3055. [Google Scholar] [CrossRef]
- Chen, J.M. Evaluation of Vegetation Indices and a Modified Simple Ratio for Boreal Applications. Can. J. Remote Sens. 1996, 22, 229–242. [Google Scholar] [CrossRef]
- Yang, Z.; Willis, P.; Mueller, R. Impact of Band-Ratio Enhanced AWiFS Image to Crop Classification Accuracy. Proceeding Pecora 17 2008, 17, 1–11. [Google Scholar]
- Tucker, C.J. Red and Photographic Infrared Linear Combinations for Monitoring Vegetation. Remote Sens. Environ. 1979, 8, 127–150. [Google Scholar] [CrossRef]
- Huete, A.R. A Soil-Adjusted Vegetation Index (SAVI). Remote Sens. Environ. 1988, 25, 295–309. [Google Scholar] [CrossRef]
- BPS Kabupaten Subang. Subang Dalam Angka Tahun 2021; BPS: Subang, Indonesia, 2022; ISBN 0215.4285. [Google Scholar]
- Susilokarti, D.; Supadmo Arif, S.; Susanto, S.; Sutiarso, L. Identification of Climate Change Based on Rainfall Data in Southern Part of Jatiluhur, Subang District, West Jawa. Agritech 2015, 35, 98–105. [Google Scholar] [CrossRef][Green Version]
- Blomme, G.; Dita, M.; Jacobsen, K.S.; Vicente, L.P.; Molina, A.; Ocimati, W.; Poussier, S.; Prior, P. Bacterial Diseases of Bananas and Enset: Current State of Knowledge and Integrated Approaches toward Sustainable Management. Front. Plant Sci. 2017, 8, 1290. [Google Scholar] [CrossRef]
- Walduck, G.; Daly, A. Fusarium Wilt of Bananas (Panana Disease). Agnote 2006, 151, 7–11. [Google Scholar]
- Agisoft LLC. MicaSense RedEdge MX Processing Workflow (Including Reflectance Calibration). Available online: https://agisoft.freshdesk.com/support/solutions/articles/31000148780-micasense-rededge-mx-processing-workflow-including-reflectance-calibration-in-agisoft-metashape-pro (accessed on 22 May 2023).
- ASD. FieldSpec ® HandHeld 2 TM Spectroradiometer User Manual; ASD Inc.: Boulder, CO, USA, 2010. [Google Scholar]
- Stamford, J.D.; Vialet-Chabrand, S.; Cameron, I.; Lawson, T. Development of an Accurate Low Cost NDVI Imaging System for Assessing Plant Health. Plant Methods 2023, 19, 9. [Google Scholar] [CrossRef]
- Chen, J.J.; Zhen, S.; Sun, Y. Estimating Leaf Chlorophyll Content of Buffaloberry Using Normalized Difference Vegetation Index Sensors. Horttechnology 2021, 31, 297–303. [Google Scholar] [CrossRef]
- Tanaka, M.; Hama, A.; Tsurusaki, Y.; Shibato, Y. Methods of Aerial Photography Using Drone and Image Analyses for Evaluation of Cabbage Growth at Individual Level. J. Remote Sens. Soc. Jpn. 2021, 41, 375–385. [Google Scholar] [CrossRef]
- Yang, H.; Yang, X.; Heskel, M.; Sun, S.; Tang, J. Seasonal Variations of Leaf and Canopy Properties Tracked by Ground-Based NDVI Imagery in a Temperate Forest. Sci. Rep. 2017, 7, 1267. [Google Scholar] [CrossRef] [PubMed]
- Ghazali, M.F.; Wikantika, K.; Harto, A.B.; Kondoh, A. Generating Soil Salinity, Soil Moisture, Soil PH from Satellite Imagery and Its Analysis. Inf. Process. Agric. 2019, 11, 294–306. [Google Scholar] [CrossRef]
- JRC. European Commission NDWI (Normalized Difference Water Index). Prod. Fact Sheet 2011, 5, 6–7. [Google Scholar]
- Thomas, D.S.; Turner, D.W. Banana (Musa sp.) Leaf Gas Exchange and Chlorophyll Fluorescence in Response to Soil Drought, Shading and Lamina Folding. Sci. Hortic. 2001, 90, 93–108. [Google Scholar] [CrossRef]
- Zhang, J.; Bei, S.; Li, B.; Zhang, J.; Christie, P.; Li, X. Organic Fertilizer, but Not Heavy Liming, Enhances Banana Biomass, Increases Soil Organic Carbon and Modifies Soil Microbiota. Appl. Soil Ecol. 2019, 136, 67–79. [Google Scholar] [CrossRef]
- Robinson, J.C.; Sauco, V.G. Site Selection, Soil Requirement, and Soil Preparation. In Bananas and Plantains; Hulbert, S., Chippendale, F., Eds.; CABI: Wallingford, UK, 2010; p. 299. ISBN 978-1-84593-658-7. [Google Scholar]
- Jones, J.B. Soil PH, Liming, and Liming Materials. In Agronomic Handbook Management of Crops, Soils and Their Fertility; CRC Press: Washington, DC, USA, 2002; pp. 237–251. ISBN 0-8493-0897-6. [Google Scholar]
- Von Uexküll, H.R.; Mutert, E. Global Extent, Development and Economic Impact of Acid Soils. Plant Soil 1995, 171, 1–15. [Google Scholar] [CrossRef]
- Crusciol, C.A.C.; Artigiani, A.C.C.A.; Arf, O.; Carmeis Filho, A.C.A.; Soratto, R.P.; Nascente, A.S.; Alvarez, R.C.F. Soil Fertility, Plant Nutrition, and Grain Yield of Upland Rice Affected by Surface Application of Lime, Silicate, and Phosphogypsum in a Tropical No-till System. Catena 2016, 137, 87–99. [Google Scholar] [CrossRef]
- Orr, R.; Nelson, P.N. Impacts of Soil Abiotic Attributes on Fusarium Wilt, Focusing on Bananas. Appl. Soil Ecol. 2018, 132, 20–33. [Google Scholar] [CrossRef]
- Mellor, A.; Boukir, S.; Haywood, A.; Jones, S. Exploring Issues of Training Data Imbalance and Mislabelling on Random Forest Performance for Large Area Land Cover Classification Using the Ensemble Margin. ISPRS J. Photogramm. Remote Sens. 2015, 105, 155–168. [Google Scholar] [CrossRef]
- Luan, J.; Zhang, C.; Xu, B.; Xue, Y.; Ren, Y. The Predictive Performances of Random Forest Models with Limited Sample Size and Different Species Traits. Fish. Res. 2020, 227, 105534. [Google Scholar] [CrossRef]
- Millard, K.; Richardson, M. On the Importance of Training Data Sample Selection in Random Forest Image Classification: A Case Study in Peatland Ecosystem Mapping. Remote Sens. 2015, 7, 8489–8515. [Google Scholar] [CrossRef]
- Breiman, L. Random Forests. Mach. Learn. 2001, 45, 5–32. [Google Scholar] [CrossRef]
- Segura, R.A.; Stoorvogel, J.J.; Sandoval, J.A. The Effect of Soil Properties on the Relation between Soil Management and Fusarium Wilt Expression in Gros Michel Bananas. Plant Soil 2022, 471, 89–100. [Google Scholar] [CrossRef]
- Le Thi, L.; Mertens, A.; Vu, D.T.; Vu, T.D.; Minh, P.L.A.; Duc, H.N.; de Backer, S.; Swennen, R.; Vandelook, F.; Panis, B.; et al. Diversity of Fusarium Associated Banana Wilt in Northern Viet Nam. MycoKeys 2022, 87, 53–76. [Google Scholar] [CrossRef]
- Buddenhagen, I. Understanding Strain Diversity in Fusarium oxysporum f. sp. Cubense and History of Introduction of ‘Tropical Race 4’ to Better Manage Banana Production. Acta Hortic. 2009, 1, 193–204. [Google Scholar] [CrossRef]
- Dita, M.; Barquero, M.; Heck, D.; Mizubuti, E.S.G.; Staver, C.P. Fusarium Wilt of Banana: Current Knowledge on Epidemiology and Research Needs toward Sustainable Disease Management. Front. Plant Sci. 2018, 871, 1468. [Google Scholar] [CrossRef]
- Huang, Y.H.; Wang, R.C.; Li, C.H.; Zuo, C.W.; Wei, Y.R.; Zhang, L.; Yi, G.J. Control of Fusarium Wilt in Banana with Chinese Leek. Eur. J. Plant Pathol. 2012, 134, 87–95. [Google Scholar] [CrossRef]
Disclaimer/Publisher’s Note: The statements, opinions and data contained in all publications are solely those of the individual author(s) and contributor(s) and not of MDPI and/or the editor(s). MDPI and/or the editor(s) disclaim responsibility for any injury to people or property resulting from any ideas, methods, instructions or products referred to in the content. |
© 2023 by the authors. Licensee MDPI, Basel, Switzerland. This article is an open access article distributed under the terms and conditions of the Creative Commons Attribution (CC BY) license (https://creativecommons.org/licenses/by/4.0/).