Article

Potential Spread of Desert Locust Schistocerca gregagia (Orthoptera: Acrididae) under Climate Change Scenarios

1
College of Agriculture and Biological Science, Co-Innovation Center for Cangshan Mountain and Erhai Lake Integrated Protection and Green Development of Yunnan Province, Dali University, Dali 671003, China
2
Department of Geosciences and Natural Resource Management, University of Copenhagen, 1958 Copenhagen, Denmark
*
Author to whom correspondence should be addressed.
Diversity 2023, 15(10), 1038; https://doi.org/10.3390/d15101038
Submission received: 29 August 2023 / Revised: 19 September 2023 / Accepted: 26 September 2023 / Published: 27 September 2023

Abstract

:
The desert locust Schistocerca gregagia (Forskål, 1775) is one of the most harmful migratory pests in the world, posing a major threat to agricultural production, livelihoods, and food security. Climate, land use, and topography influence the distribution of desert locusts, but few studies have integrated all the factors on a global scale to explore the suitable areas for desert locusts and the paths through which this species could potentially spread. In this study, we established ensemble distribution models to investigate the distribution patterns and driving factors of desert locusts under baseline and future scenarios; we used ensembled niche dynamic models to evaluate their niche conservation during outbreaks. The results showed that the most important factor influencing desert locust distribution is climate, especially the minimum temperature of the coldest month, the annual precipitation, and the mean temperature of the driest quarter. Some areas with little or no desert locust distribution at present will be suitable for desert locusts in the future, and highly suitable contiguous areas may become the dispersal paths. The results also showed that the climatic niche of the desert locust is still conservative, which might explain why desert locusts tend to retreat after intermittent outbreaks rather than settle at the site of invasion. Therefore, more attention should be paid to the areas that are highly suitable for desert locusts, the key factors driving their outbreaks, and the shifting of their climatic niche in order to prevent desert locusts from settling in invasion areas and affecting local ecosystems and food security.

1. Introduction

Food security is increasingly becoming a concern because of population explosion and global climate change [1], and the frequent occurrence of various disasters is also posing a major challenge to food security [2]. With the large-scale outbreak of desert locusts Schistocerca gregaria (Forskål, 1775) in May 2019, the serious impact of desert locusts on agricultural production again attracted people’s attention [3]. The desert locust is the most destructive migratory pest in the world. In response to environmental stimuli, dense and highly mobile desert locust swarms can form. The number of desert locusts per square kilometer can reach 80 million, and they consume the same amount of food in one day as 35,000 people [4], so their outbreaks seriously threaten agricultural production and food security. The desert locust mainly resides in the desert and scrub areas of North Africa, the Arabian Peninsula, and Southwest Asia [5,6]. However, as an insect of the Acrididae family originating from the African continent, its strong adaptive capacity and long-range flight ability allow it to migrate over large distances during its gregarious phase [7]. As the migration of desert locusts is limited by a number of factors, large outbreaks have not been observed in many places, such as the densely populated East Asia, the agricultural Americas, and Australia, which is also large, dry, and has low precipitation. However, as the global biological invasion problem is becoming increasingly serious [8], these areas are potentially threatened by the desert locust. Therefore, the potential invasion of desert locusts is posing a challenge to the security of people’s future livelihoods.
Given the potential for desert locust outbreaks, some researchers have analyzed the potential areas that are suitable for desert locust distribution by applying species distribution models (SDM) [6,9]. However, researchers have only focused on specific regions [3,10], whereas others examined the potential desert locust distribution areas on a global scale with limited environmental considerations [6,11]. In these studies, some researchers only considered climate factors [6], whereas others included soil conditions or land cover in addition to climate factors [11]. Since the migration of desert locusts is affected by food acquisition and habitat selection, land use (including arable land, forest land, etc.) is the key factor affecting the process of migration. Topography also directly limits the migration paths of desert locusts. The presence of desert locusts was observed along the western side of the Himalayas, indicating that the mountains might be a natural barrier to desert locust migration [12]. Therefore, identifying suitable routes for desert locust migration and carefully monitoring these routes is essential for the preventive control of desert locusts. The invasion risk posed by desert locusts can be more comprehensively understood by adding topography and land use into the modeling analysis.
The extreme weather caused by climate change may increase the frequency of natural disasters, consequently increasing the probability that species will establish viable populations in new areas [13]. Outbreaks of insect pests have often been accompanied by climate change [14,15]. However, the results of studies on the effects of climate change on species distribution are not yet entirely consistent, i.e., climate change may promote or inhibit species invasion [16]. Understanding the impact of climate change on desert locust invasion probability is the key to preventively controlling its outbreaks and the related global food security in the future. As described above, in current studies on the potential distribution of desert locusts, researchers have not considered all the potential influencing factors. Therefore, potentially suitable areas for desert locusts both currently and in the future must be identified based on the abovementioned factors to ensure global food security.
Desert locusts have strong expansion and invasion ability, as demonstrated by repeated outbreaks, which reflect their special biogeographical and ecological patterns [17]. Species range and niche play key roles in understanding these patterns, especially under global climate change scenarios [18]. As a key concept linking ecology and biogeography, niche helps in understanding the mechanisms affecting spatial and temporal species distribution patterns [19]. Niche space and its dynamics have attracted considerable attention in the prediction of the distribution patterns of species under global change scenarios through the application of ecological niche models (ENMs), which have been widely used to examine shifts in species’ niches [20]. However, no evidence has shown whether the strong spread and invasion ability of desert locusts during outbreaks are accompanied by shifts in their niche. As such, the examination of their changes in niche would help us to understand their invasion mechanisms.
In this study, based on the desert locust occurrences recorded by the Food and Agriculture Organization of the United Nations (FAO, www.fao.org (accessed on 30 September 2021)) and Global Biodiversity Information Facility (GBIF, www.gbif.org (accessed on 13 September 2021)), we incorporated climate factors, land use, and topographical factors, and then integrated them into an ensemble niche model platform to build niche-based species distribution models (SDMs) to predict the desert locust distribution, its trend for the global change scenarios, and the driving factors and the underlying mechanisms its distribution to achieve the following aims: (1) to study the current and future global distribution patterns of desert locusts; (2) to determine the potential factors of driving desert locust distribution; and (3) to identify the potential invasion routes and areas at high risk of outbreak of desert locusts currently and in the future. Our findings provide a scientific basis for preventing desert locust outbreaks in high-risk areas, which can help reduce the serious impact of desert locusts on food security under future climate change scenarios.

2. Materials and Methods

2.1. Global Occurrence Records of Desert Locust

We collected the global occurrence records of desert locusts from two sources: (1) the Food and Agriculture Organization of the United Nations (FAO) (www.fao.org (accessed on 30 September 2021)) and (2) the Global Biodiversity Information Facility (GBIF) database (www.gbif.org (accessed on 13 September 2021)). From these sources, we obtained 121,778 distinct occurrence records with clear geographical coordinate information, deleted data with uncertainty of >3 km, and retrieved all occurrence data with all entries checked for nomenclature and taxonomical identity. Ultimately, we retrieved 107,270 distinct occurrence records of desert locust (Figure 1A). We spatially rarefied occurrence records with a radius of 100 km using the species distribution model (SDM) toolbox to reduce spatial autocorrelations [21]. Finally, we obtained a total of 699 spatially rarefied occurrence records (Figure 1B), which we reprojected into equal-area projections using world equal-area cylindrical projection to consider the latitudinal background selection biases.

2.2. Climate, Land Use, and Topographical Factors

We grouped the predictors in this study into climate, land use (including vegetation conditions), and topographical factors. We used a 2.5 arc-minute (approximately 5 × 5 km) grid for both the baseline period and future projections using bioclimatic variables as the climatic layer input of the species distribution models. We retrieved 19 bioclimatic factors for the baseline (1960~1990) and future (2070, average of 2061~2080) periods from WorldClim (www.worldclim.com (accessed on 25 August 2021)) [22]. For the future bioclimatic factors, we chose two scenarios (RCP2.6 and RCP8.5) that represent the most optimistic and most pessimistic climate change scenarios, respectively (RCP2.6 represents a peak in radiative forcing at 3 W m−2, about 490 ppm CO2 eq; RCP8.5 represents rising of the radiative forcing pathway leading to 8.5 W m−2, about 1370 ppm CO2 eq). The averages of three general circulation models (GCMs) were used to demonstrate the high accuracy in projecting climate change information for future bioclimatic factors [23]. The models include the Community Climate System Model Version 4 (CCSM4), NOAA Geophysical Fluid Dynamics Laboratory Coupled Model 3 (GFDL-CM3), and the New Earth System Model of the Max Planck Institute for Meteorology (MPI-ESM-LR).
In this study, the eight land use variables were retrieved from the land use harmonization strategy website (luh.umd.edu/index.shtml), including potentially forested secondary land (Secdf), forested primary land (Primf), nonforested primary land (Primn), potentially nonforested secondary land (Secdn), rangeland (Range), managed pasture (Pastr), crop land (Crop), and urban land (Urban). The land use variables in the future were also adopted under the two scenarios (RCP2.6 and RCP8.5) from the land use harmonization strategy website. The spatial resolution of all variables was 2.5 arc-minutes (approximately 5 × 5 km) or was resampled to a 2.5 arc-minute grid. We chose elevation, slope, and aspect as the topographical factors in this study. Elevation was determined via a digital elevation model (DEM) from WorldClim (www.worldclim.com (accessed on 25 August 2021)) at a spatial resolution of 30″ (approximately 1 × 1 km). We derived the slope and aspect from the DEM. Moreover, to ensure the spatial resolution of the climatic predictors matched, we resampled the topographical factors to a 2.5 arc-minute (approximately 5 × 5 km) grid.
The species distribution model was constructed using the biomod2 package in R, which comprised seven models, including a generalized linear model (GLM), classification tree analysis (CTA), generalized boosting model (GBM), flexible discriminant analysis (FDA), artificial neural network (ANN), random forest (RF), and MaxEnt [24]. To meet the model requirements, the number of pseudo absences was set to 1000. We established a preliminary species distribution model and obtained the important values of all variables (the importance value represents the impact of each variable on the construction of the species distribution model, and hence its impact on the distribution of species). Strong collinearity between variables may lead to overprediction of a model, so variables with a Pearson correlation coefficient greater than 0.7 were considered as having a strong correlation. Then, the less important factors (those with a low important value) need to be deleted [25], and the Pearson correlation coefficients and the important value of each variable are shown in Tables S1 and S2, respectively. We repeated the abovementioned process to obtain the remaining factors that did not have strong collinearity.

2.3. Species Distribution Model

We built the species distribution model with the remaining factors based on the biomod2 package. To ensure the reliability of the model, the model with true skill statistics (TSS) greater than 0.7 and an area under the ROC curve (AUC) of greater than 0.8 was retained. We used 70% of the data to calibrate the model and the remaining 30% for model evaluation. Three different model evaluation indicators were calculated to evaluate the baseline model: TSS, ROC, and the kappa coefficient. Generally, TSS > 0.7, AUC > 0.8, and kappa > 0.6 are considered to indicate good reliability [16]. The mean values of the three evaluation indexes of our model are 0.740, 0.907, and 0.723, respectively. We used a maximum training sensitivity plus specificity (MSS) logistic threshold to distinguish the suitable and unsuitable habitats in the model. We used the average values of the three GCMs to predict the future desert locust distribution under the two scenarios (RCP2.6 and RCP8.5).

2.4. Niche Model

The climate factors, after removing those with strong collinearity to independent variables, were selected to study whether the climate niche of desert locusts is conservative (method as described in Section 2.2). We used the “ecospat” package in R to analyze the climactic niche of desert locusts [26]. Because the results of this study showed that climate factors are the most important components affecting the distribution of desert locusts, we considered only the conservation of climate niche to reduce the interference produced by other factors to analyze the climactic niche of desert locusts (not involving land use and topographical factors). According to the time and location of the desert locust records in FAO, we defined the occurrence records of the locations where the desert locust outbreaks began as the native occurrence record and defined the other occurrence records as the invasion occurrence records. Based on the R-package “ecospat”, we conducted niche equivalence and niche similarity tests, and finally obtained the values representing niche overlap, niche expansion (E), niche stability (S), and niche unfilling (U). We used the E, S, and U values to judge whether the desert locust niche is conservative [18].

3. Results

3.1. Factors Shaping Desert Locust Distribution and Response Curves of Three Main Predictors

We found that the three most important predictors influencing the desert locust distribution pattern were the minimum temperature of the coldest month, annual precipitation, and the mean temperature of the driest quarter, which had importance values of 0.285, 0.237, and 0.113, respectively (Table 1). The three predictors that least impacted desert locusts were aspect, precipitation of coldest quarter, and slope, with importance values of 0.008, 0.009, and 0.011, respectively (Table 1). Among the three types of predictors, the category that most influenced the distribution pattern of desert locusts was climatic predictors, followed by land use and then topographical predictors (Table 1).
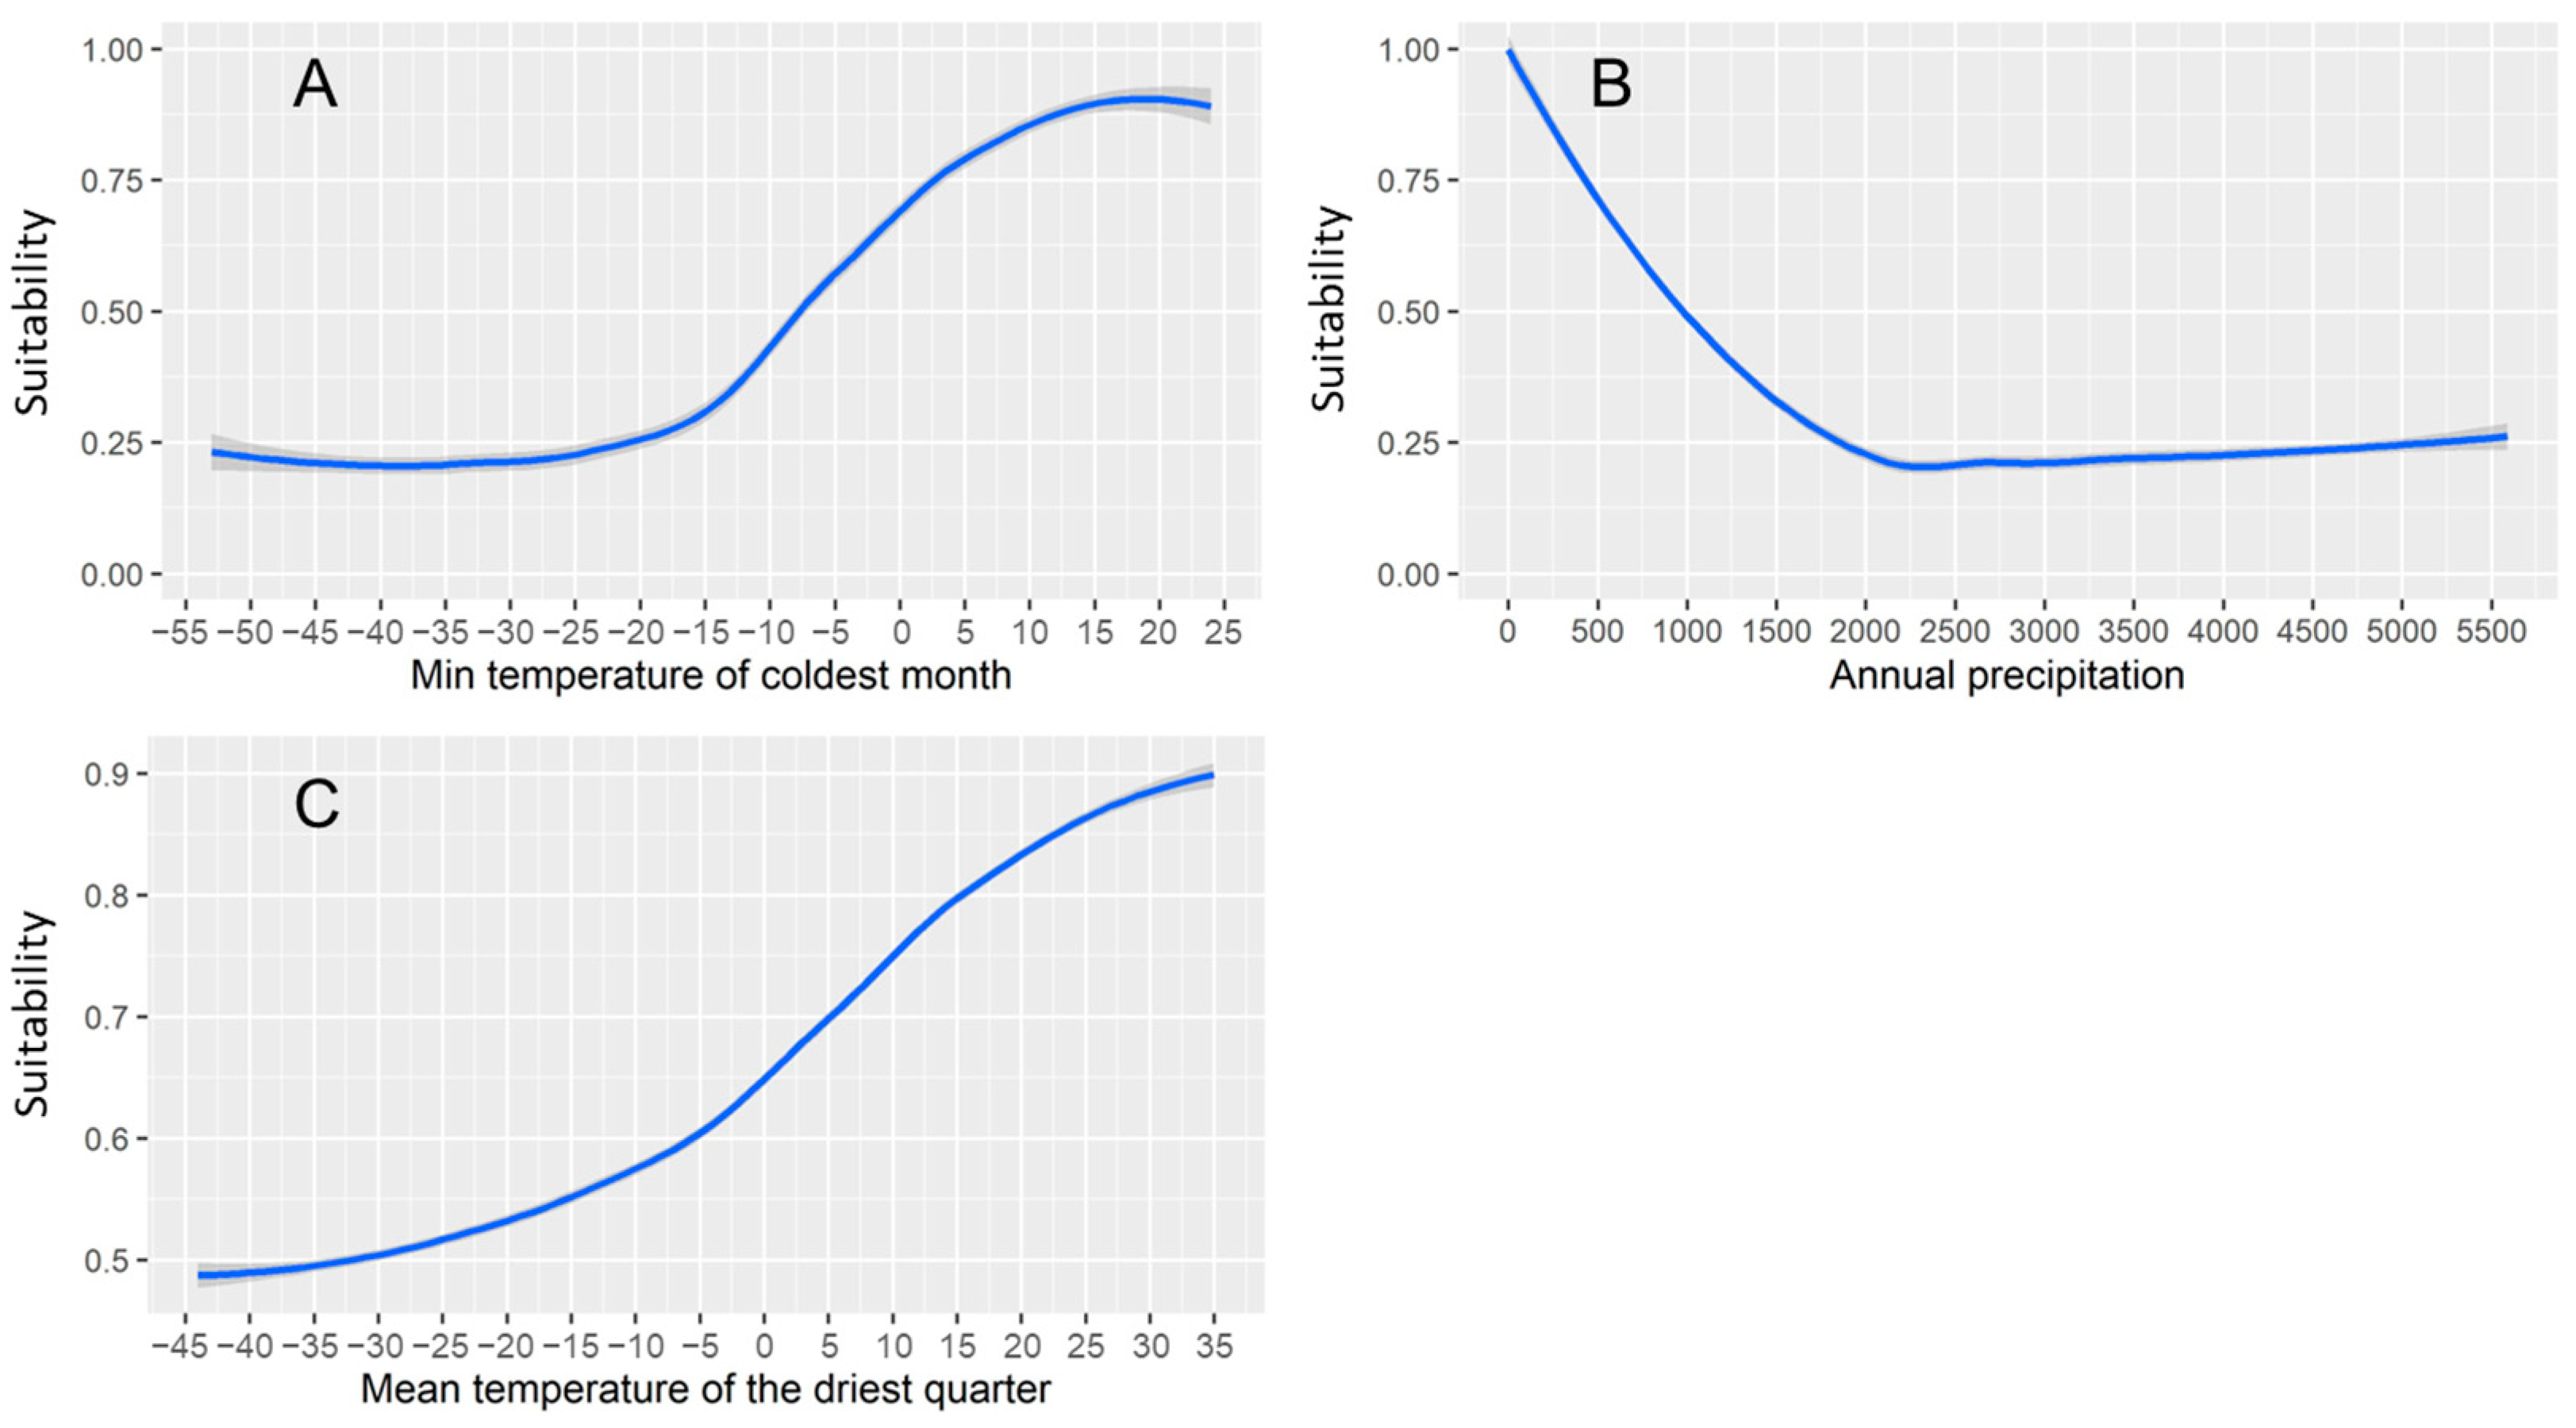
The minimum temperature of the coldest month, which most strongly impacted the desert locust habitat suitability, gradually increased the suitability throughout the whole temperature range, showing an S-shaped curve. Above −15 °C, its habitat suitability rapidly increased until it reached a peak at 15 °C, and then tended to be stable (Figure 2A). The response curve of desert locusts to annual precipitation was L-shaped. Below an annual precipitation of 2200 mm, the habitat suitability of desert locusts increased rapidly with the decrease in precipitation (Figure 2B). For the mean temperature of the driest quarter, the habitat suitable for desert locusts was gradually raised across the whole range, and the rising speed was fastest in the range of 0 to 15 °C (Figure 2C).

3.2. Suitable Distribution Desert Locust Area and Future Trend under Global Climate Change Scenarios

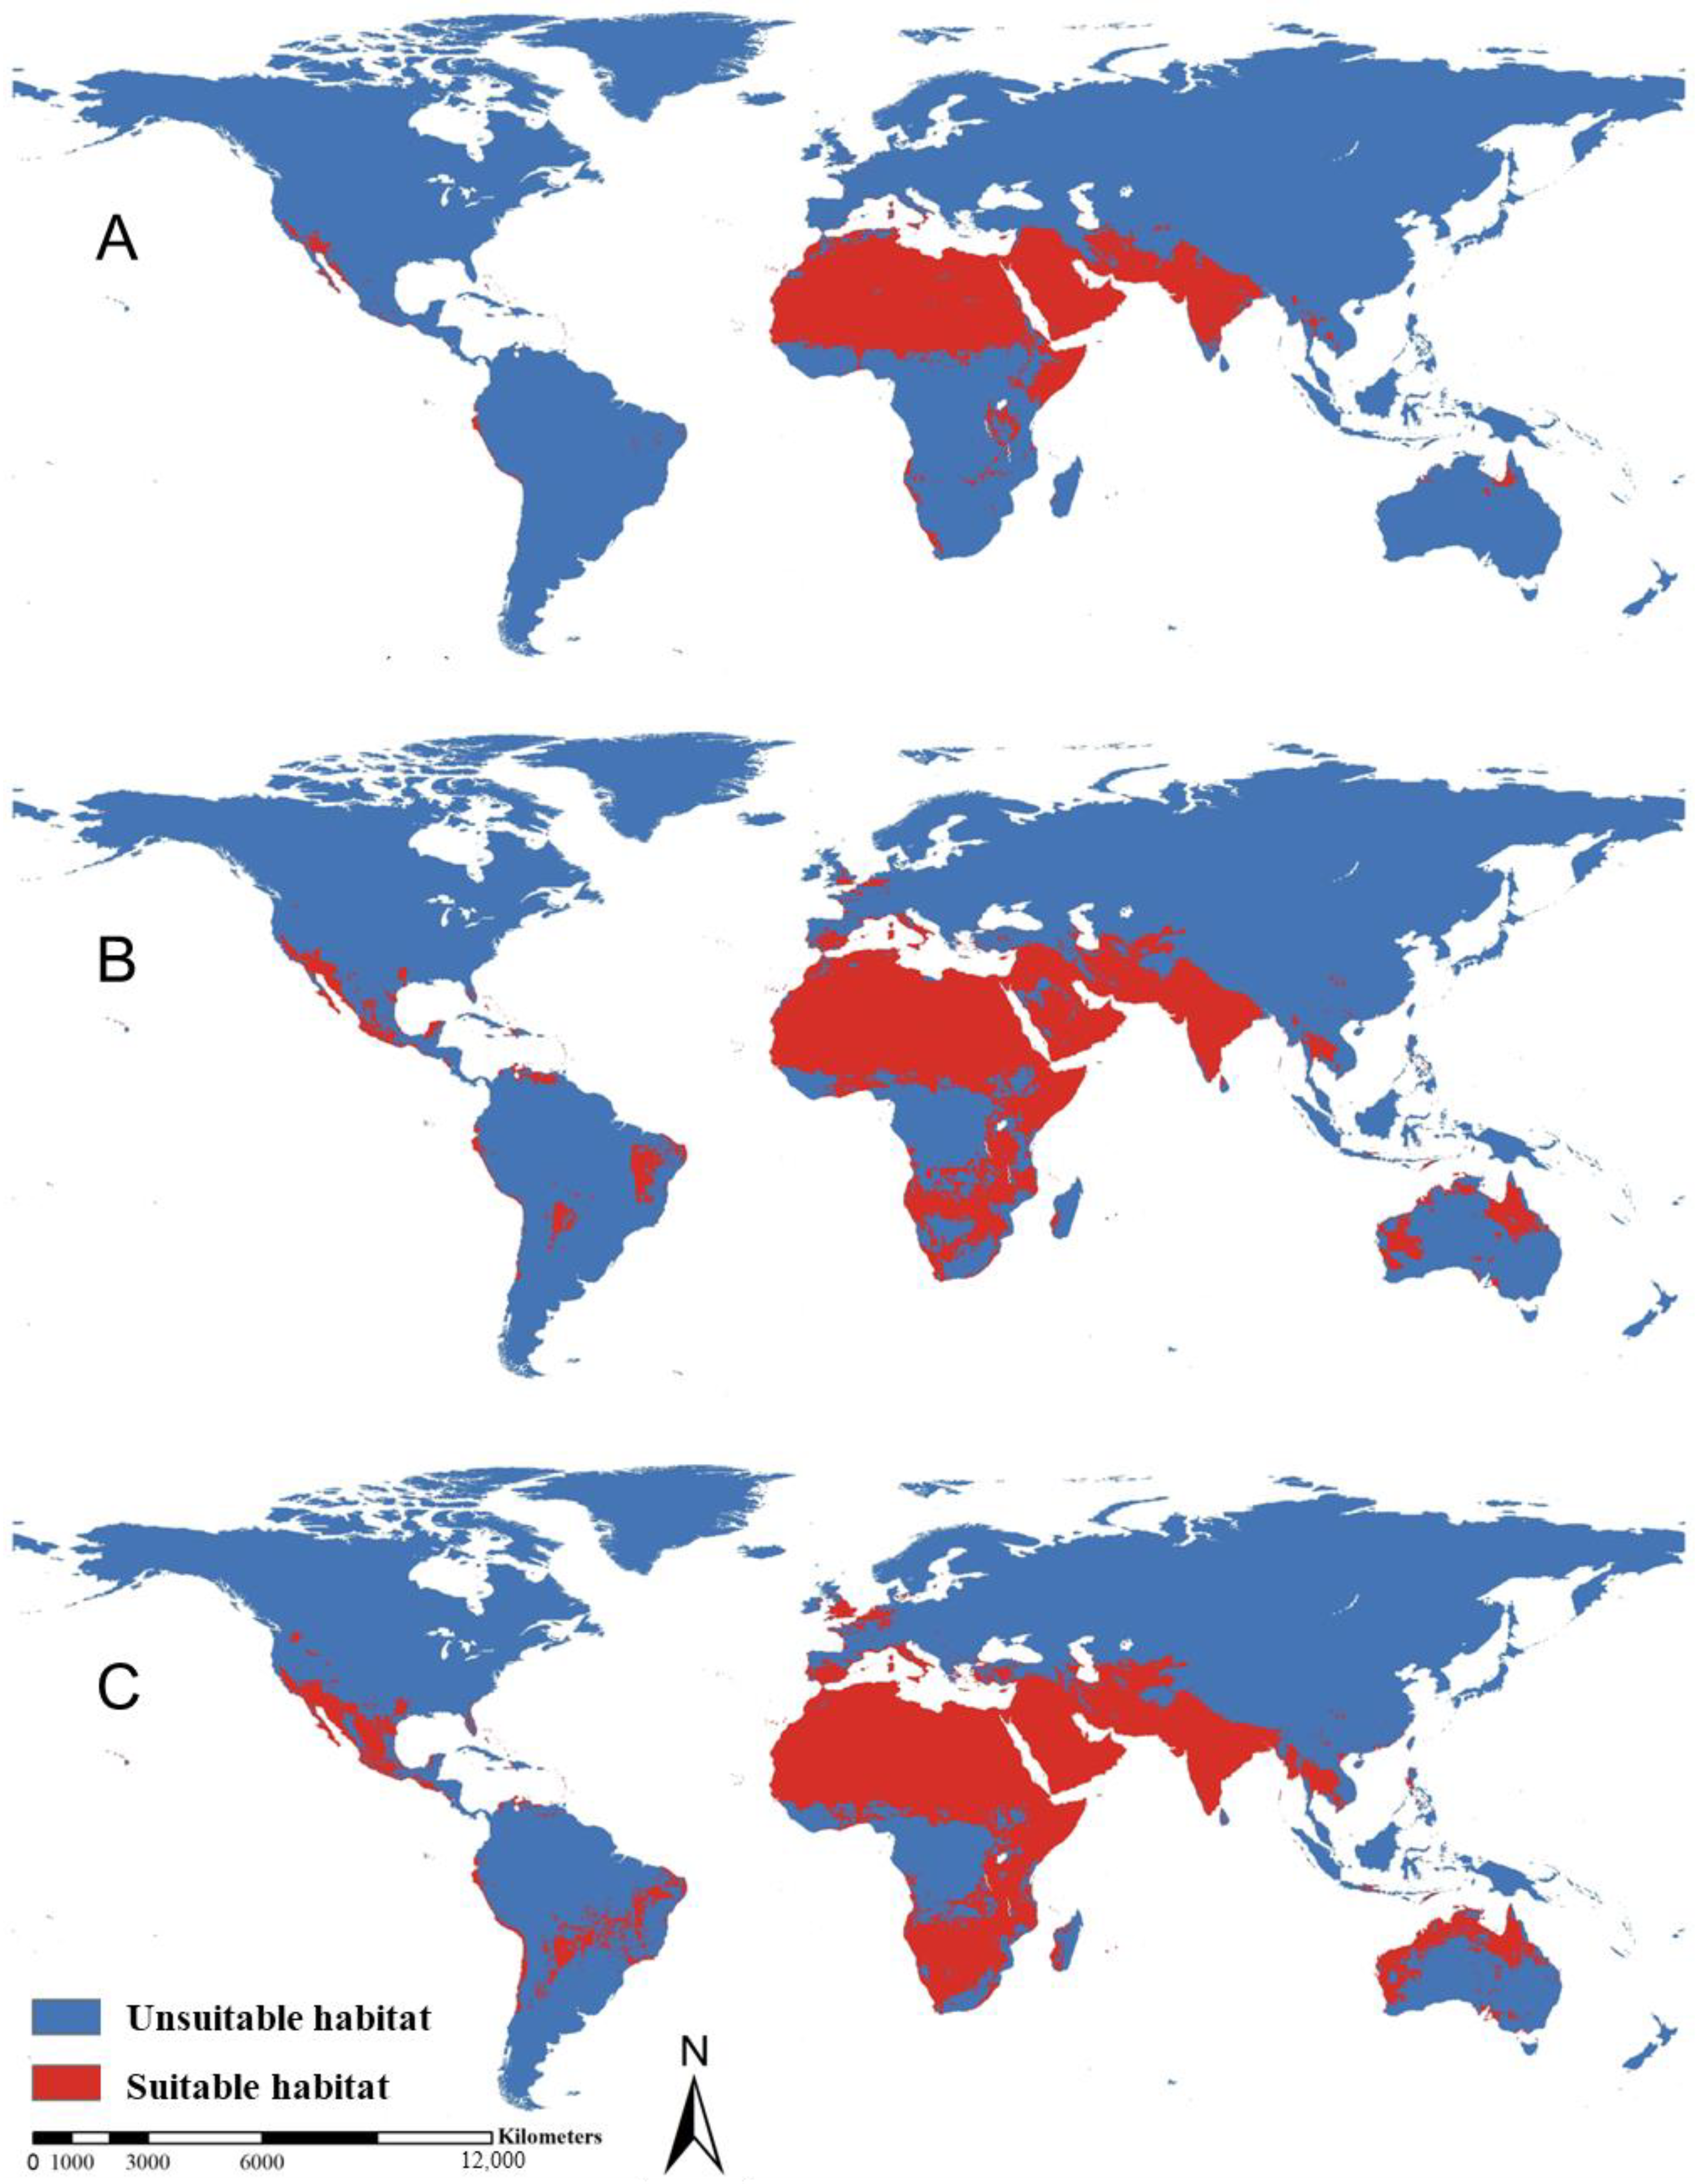
We used the maximum training sensitivity plus specificity (MSS) logistic threshold (0.54) obtained from biomod2 to divide the desert locust distribution area into suitable (>0.54) and unsuitable habitats (<0.54). Under the present scenario, the habitat area suitable for desert locusts is 20.88 M km2 (Table 2). Under RCP8.5, the habitat area suitable for desert locusts will be the largest (36.59 M km2); under RCP2.6, the suitable habitat area will be 31.08 M km2. Under both scenarios, Africa will have the largest habitat area suitable for desert locusts, followed by Asia. The smallest areas will be in Europe and South America (Table 2).
Under the current situation, the habitat suitable for desert locusts is mainly located near the Sahara, Saudi Arabia, India, and Iran deserts, and less in other areas. For other continents, desert locusts are found in only a few areas, such as the United States, the west coast of Mexico, and parts of Northern Australia (Figure 3A). Under the RCP2.6 scenario, Southern Africa is the region that will experience the largest increase in the habitat suitable for desert locusts; other continents will experience a partial increase (Figure 3B). Compared with RCP2.6, under the RCP8.5 scenario, the habitat area suitable for desert locusts in all major continents will substantially increase (Figure 3C).
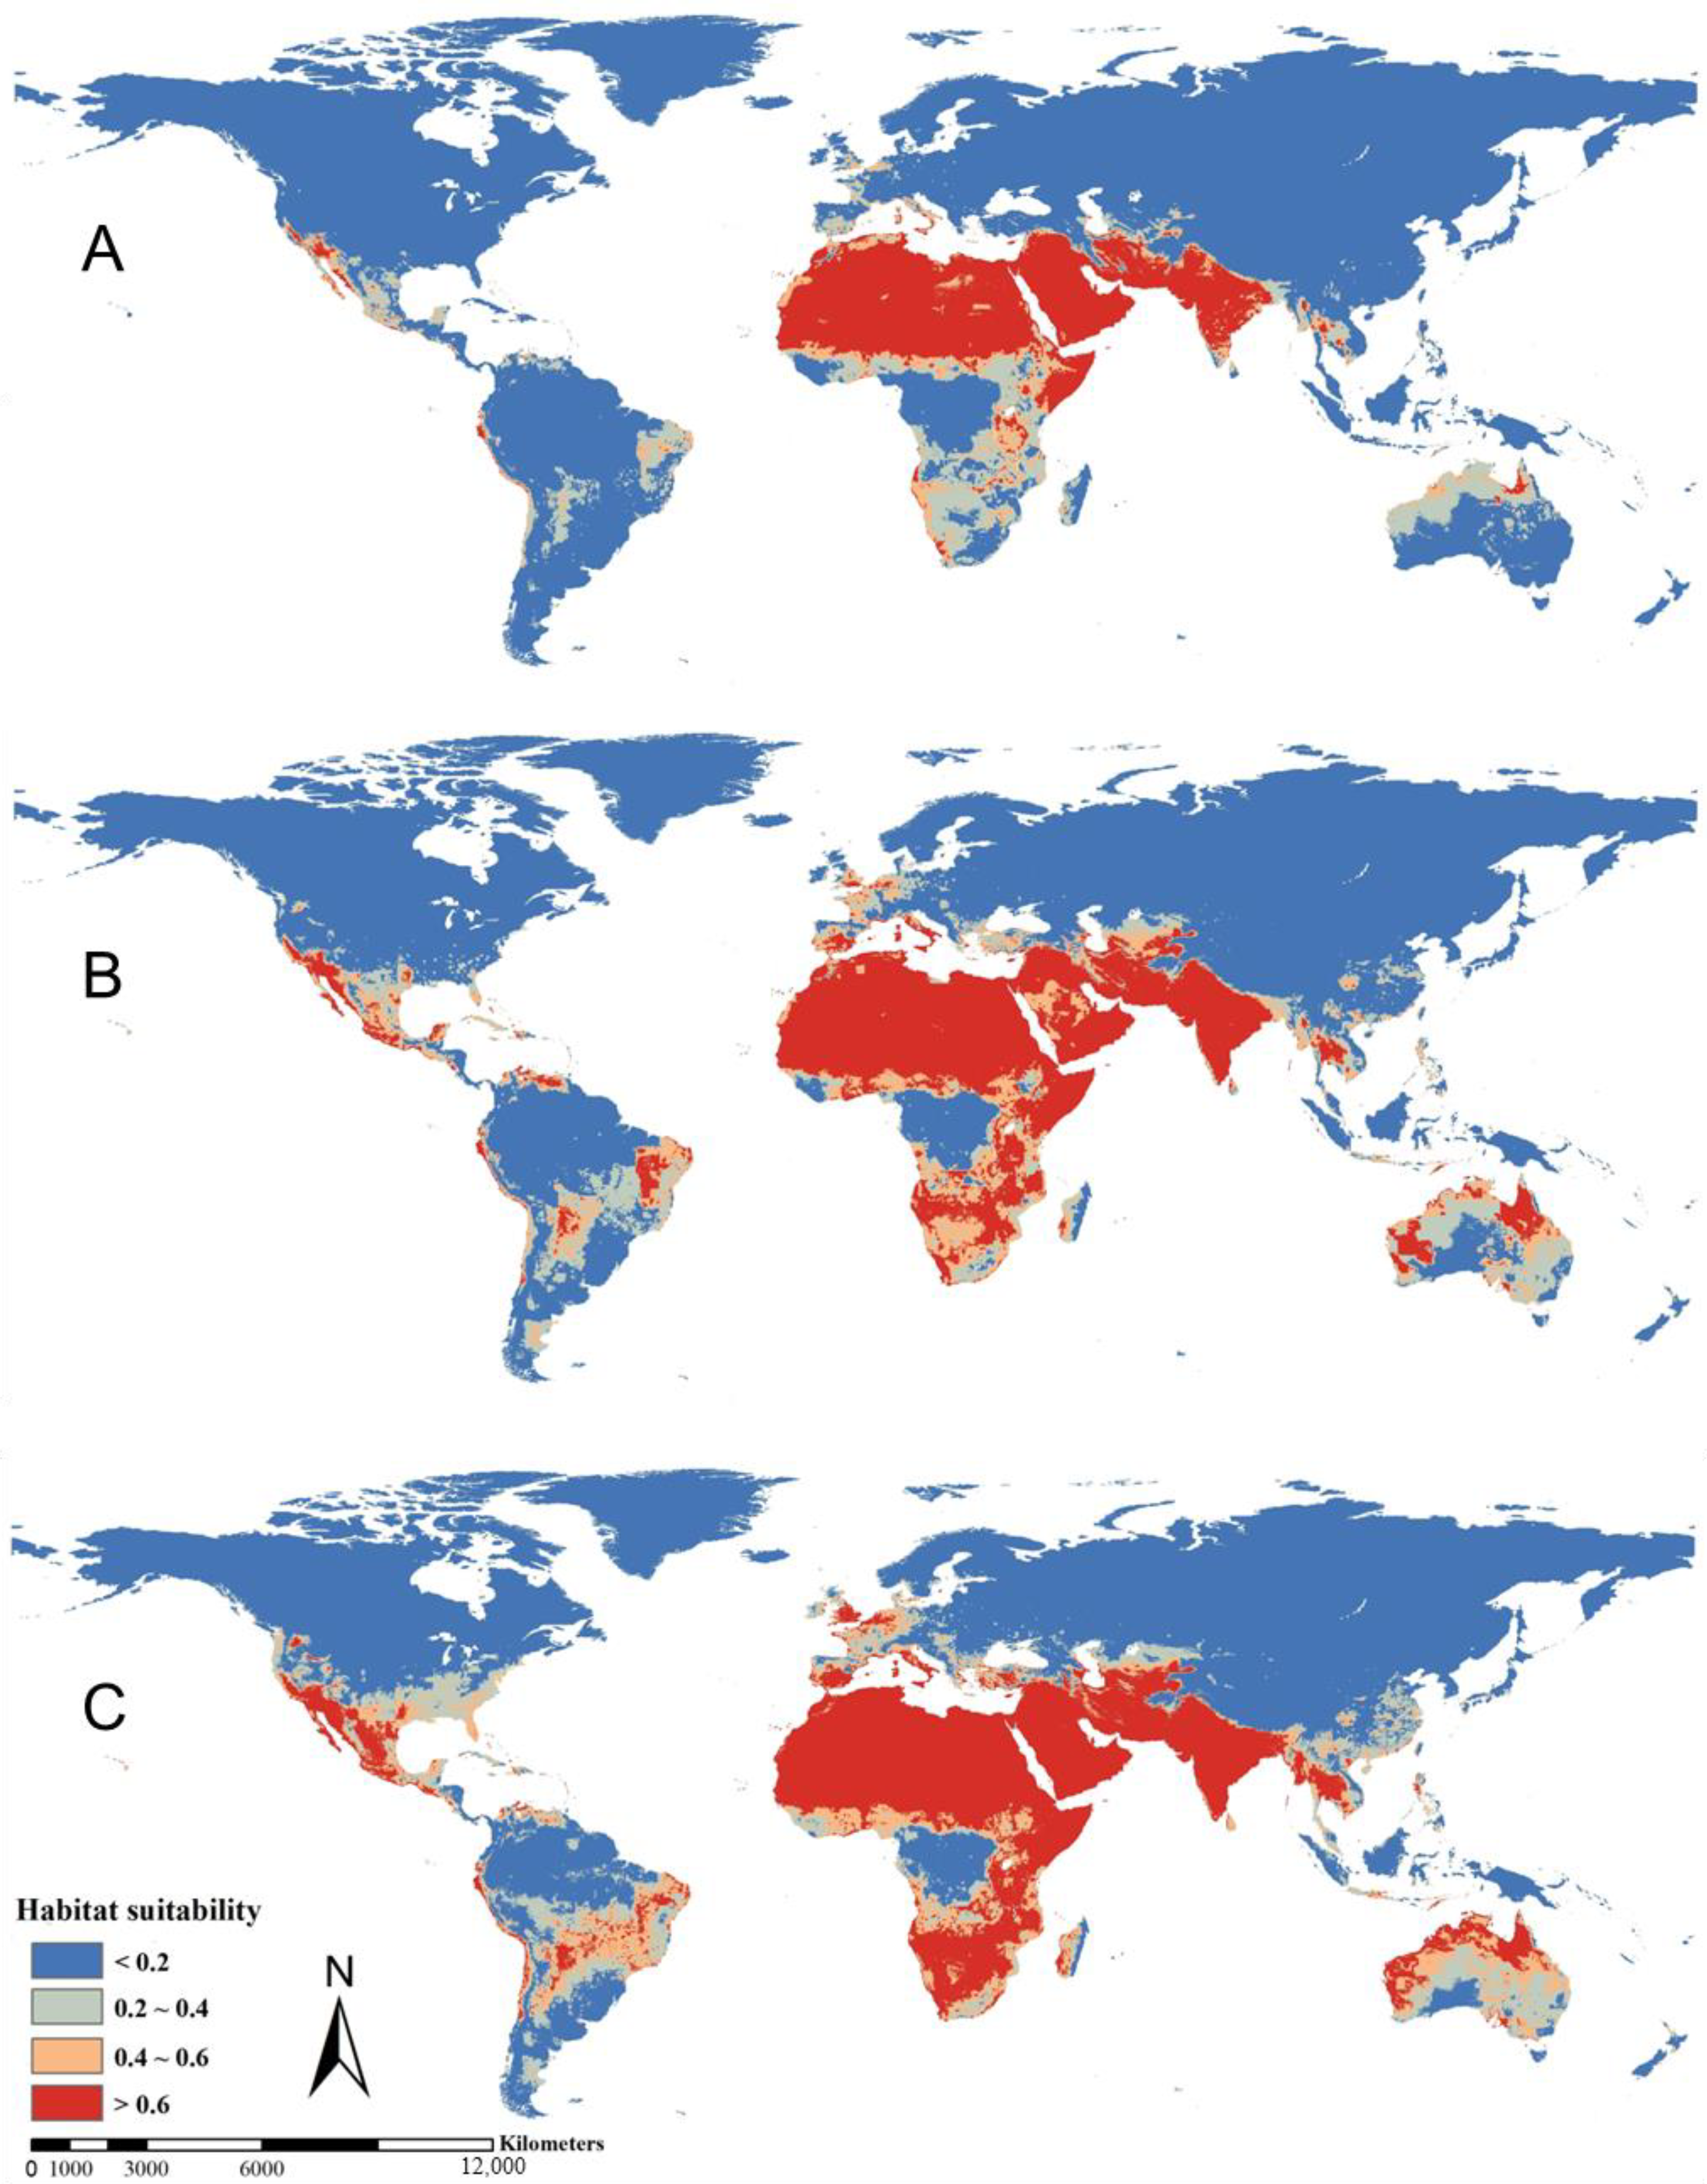
In the current scenario, the high-suitability habitat area (>0.6) is mainly distributed in North and Northeast Africa and West and South Asia (Figure 4A). The moderate-suitability habitat area (0.4~0.6) is small and distributed on all continents. Low-suitability habitats (0.2~0.4) are mainly distributed in Central and South Africa, North Australia, Southern North America, and Central and Eastern South America, with a small distribution area in Europe and Asia (Figure 4A). Under the RCP2.6 scenario, highly suitable habitats for desert locusts will substantially increase, mainly in Southern Africa and Australia. Moderately suitable areas will also be concentrated in Africa and low-suitability habitats will be found in Australia, South America, and parts of other continents (Figure 4B). Under the RCP8.5 scenario, the distribution of habitat suitable for desert locusts are nearly similar to that under RCP2.6, but there are also some differences; the high-, moderate-, and low-suitability habitat areas for desert locust will increase, especially in Africa, Asia, and Australia (Figure 4C).
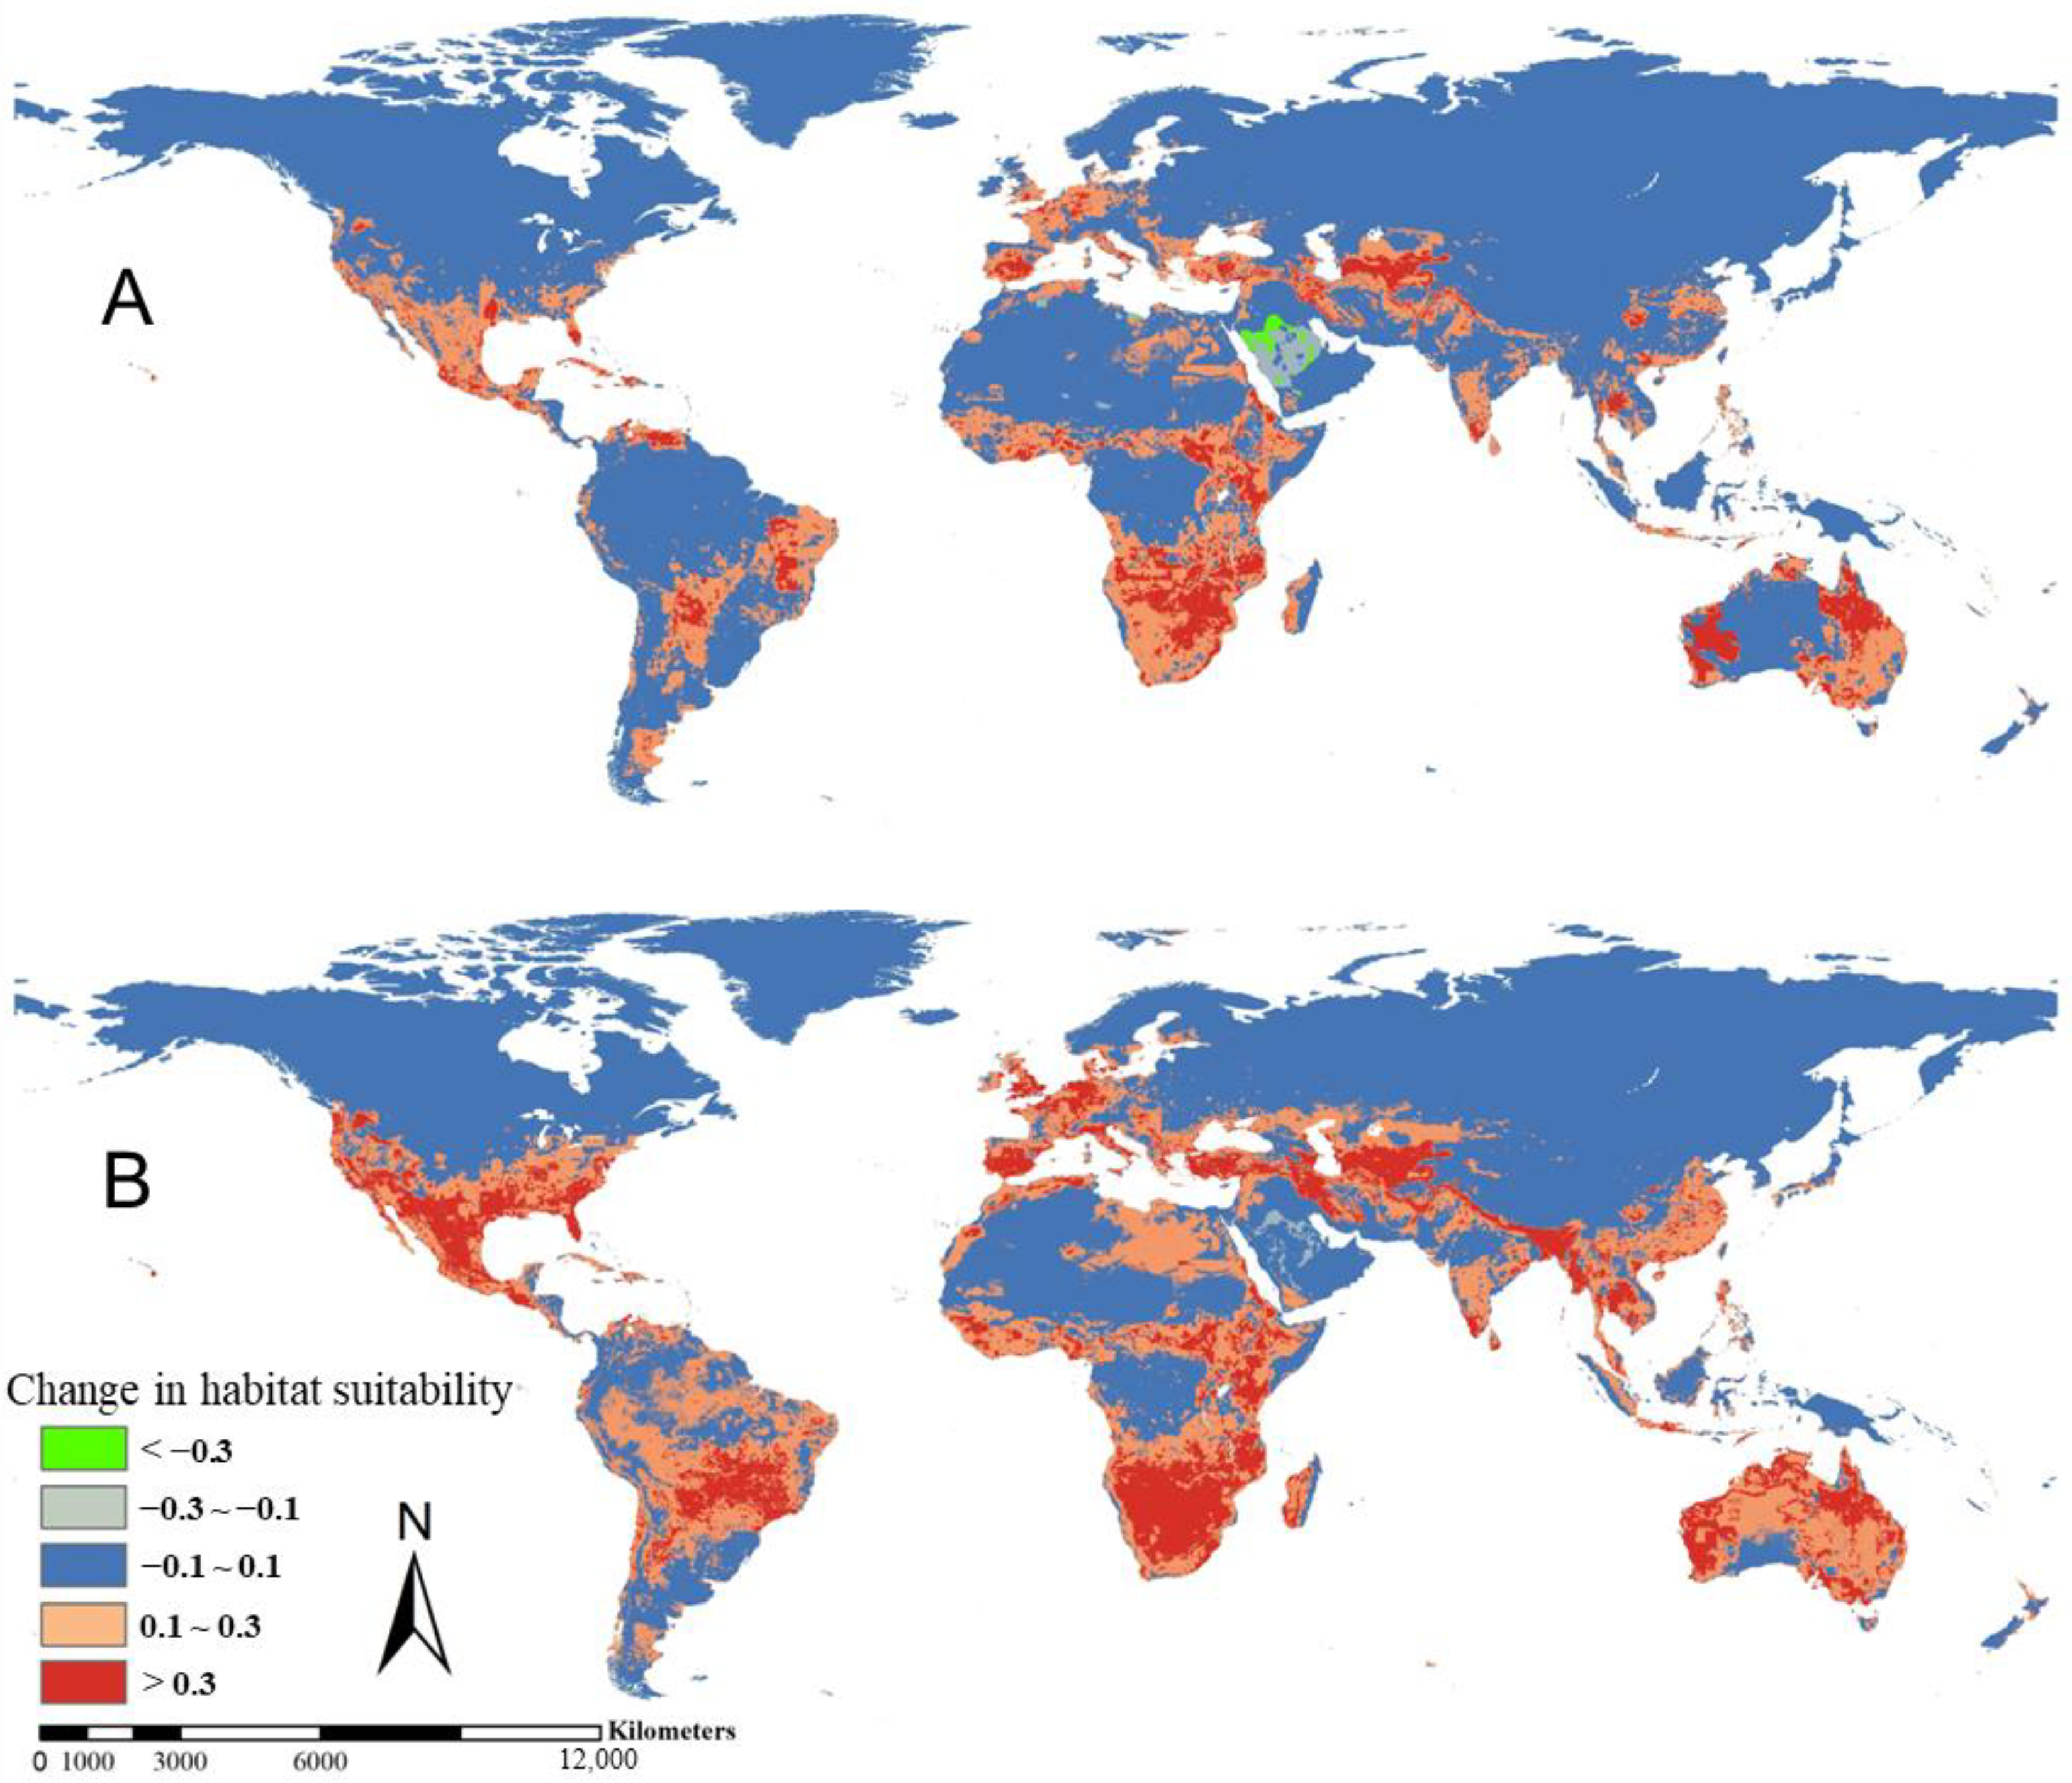
The difference between the current and RCP2.6 (DifferenceCurrent-RCP2.6) scenarios shows that the area suitable for desert locusts will considerably increase (>0.3), mainly in parts of South and East Africa and Australia. (Figure 5A). The difference between the current and RCP8.5 (DifferenceCurrent-RCP8.5) scenarios shows that the areas where the distribution of habitat suitable for desert locusts will remarkably increase are similar to those in the DifferenceCurrent-RCP2.6 scenario, but the total area will be more than double (17.17 vs. 7.57 M km2; Figure 5B). The DifferenceCurrent-RCP2.6 showed that the habitat suitability of desert locusts will moderately increase (0.1~0.3) mainly in Africa (Figure 5A). The DifferenceCurrent-RCP8.5 results are similar to those of DifferenceCurrent-RCP8.5, but the habitat suitability area is larger in the DifferenceCurrent-RCP8.5 scenario (Figure 5B).

3.3. Desert Locust Niche under Climate Change

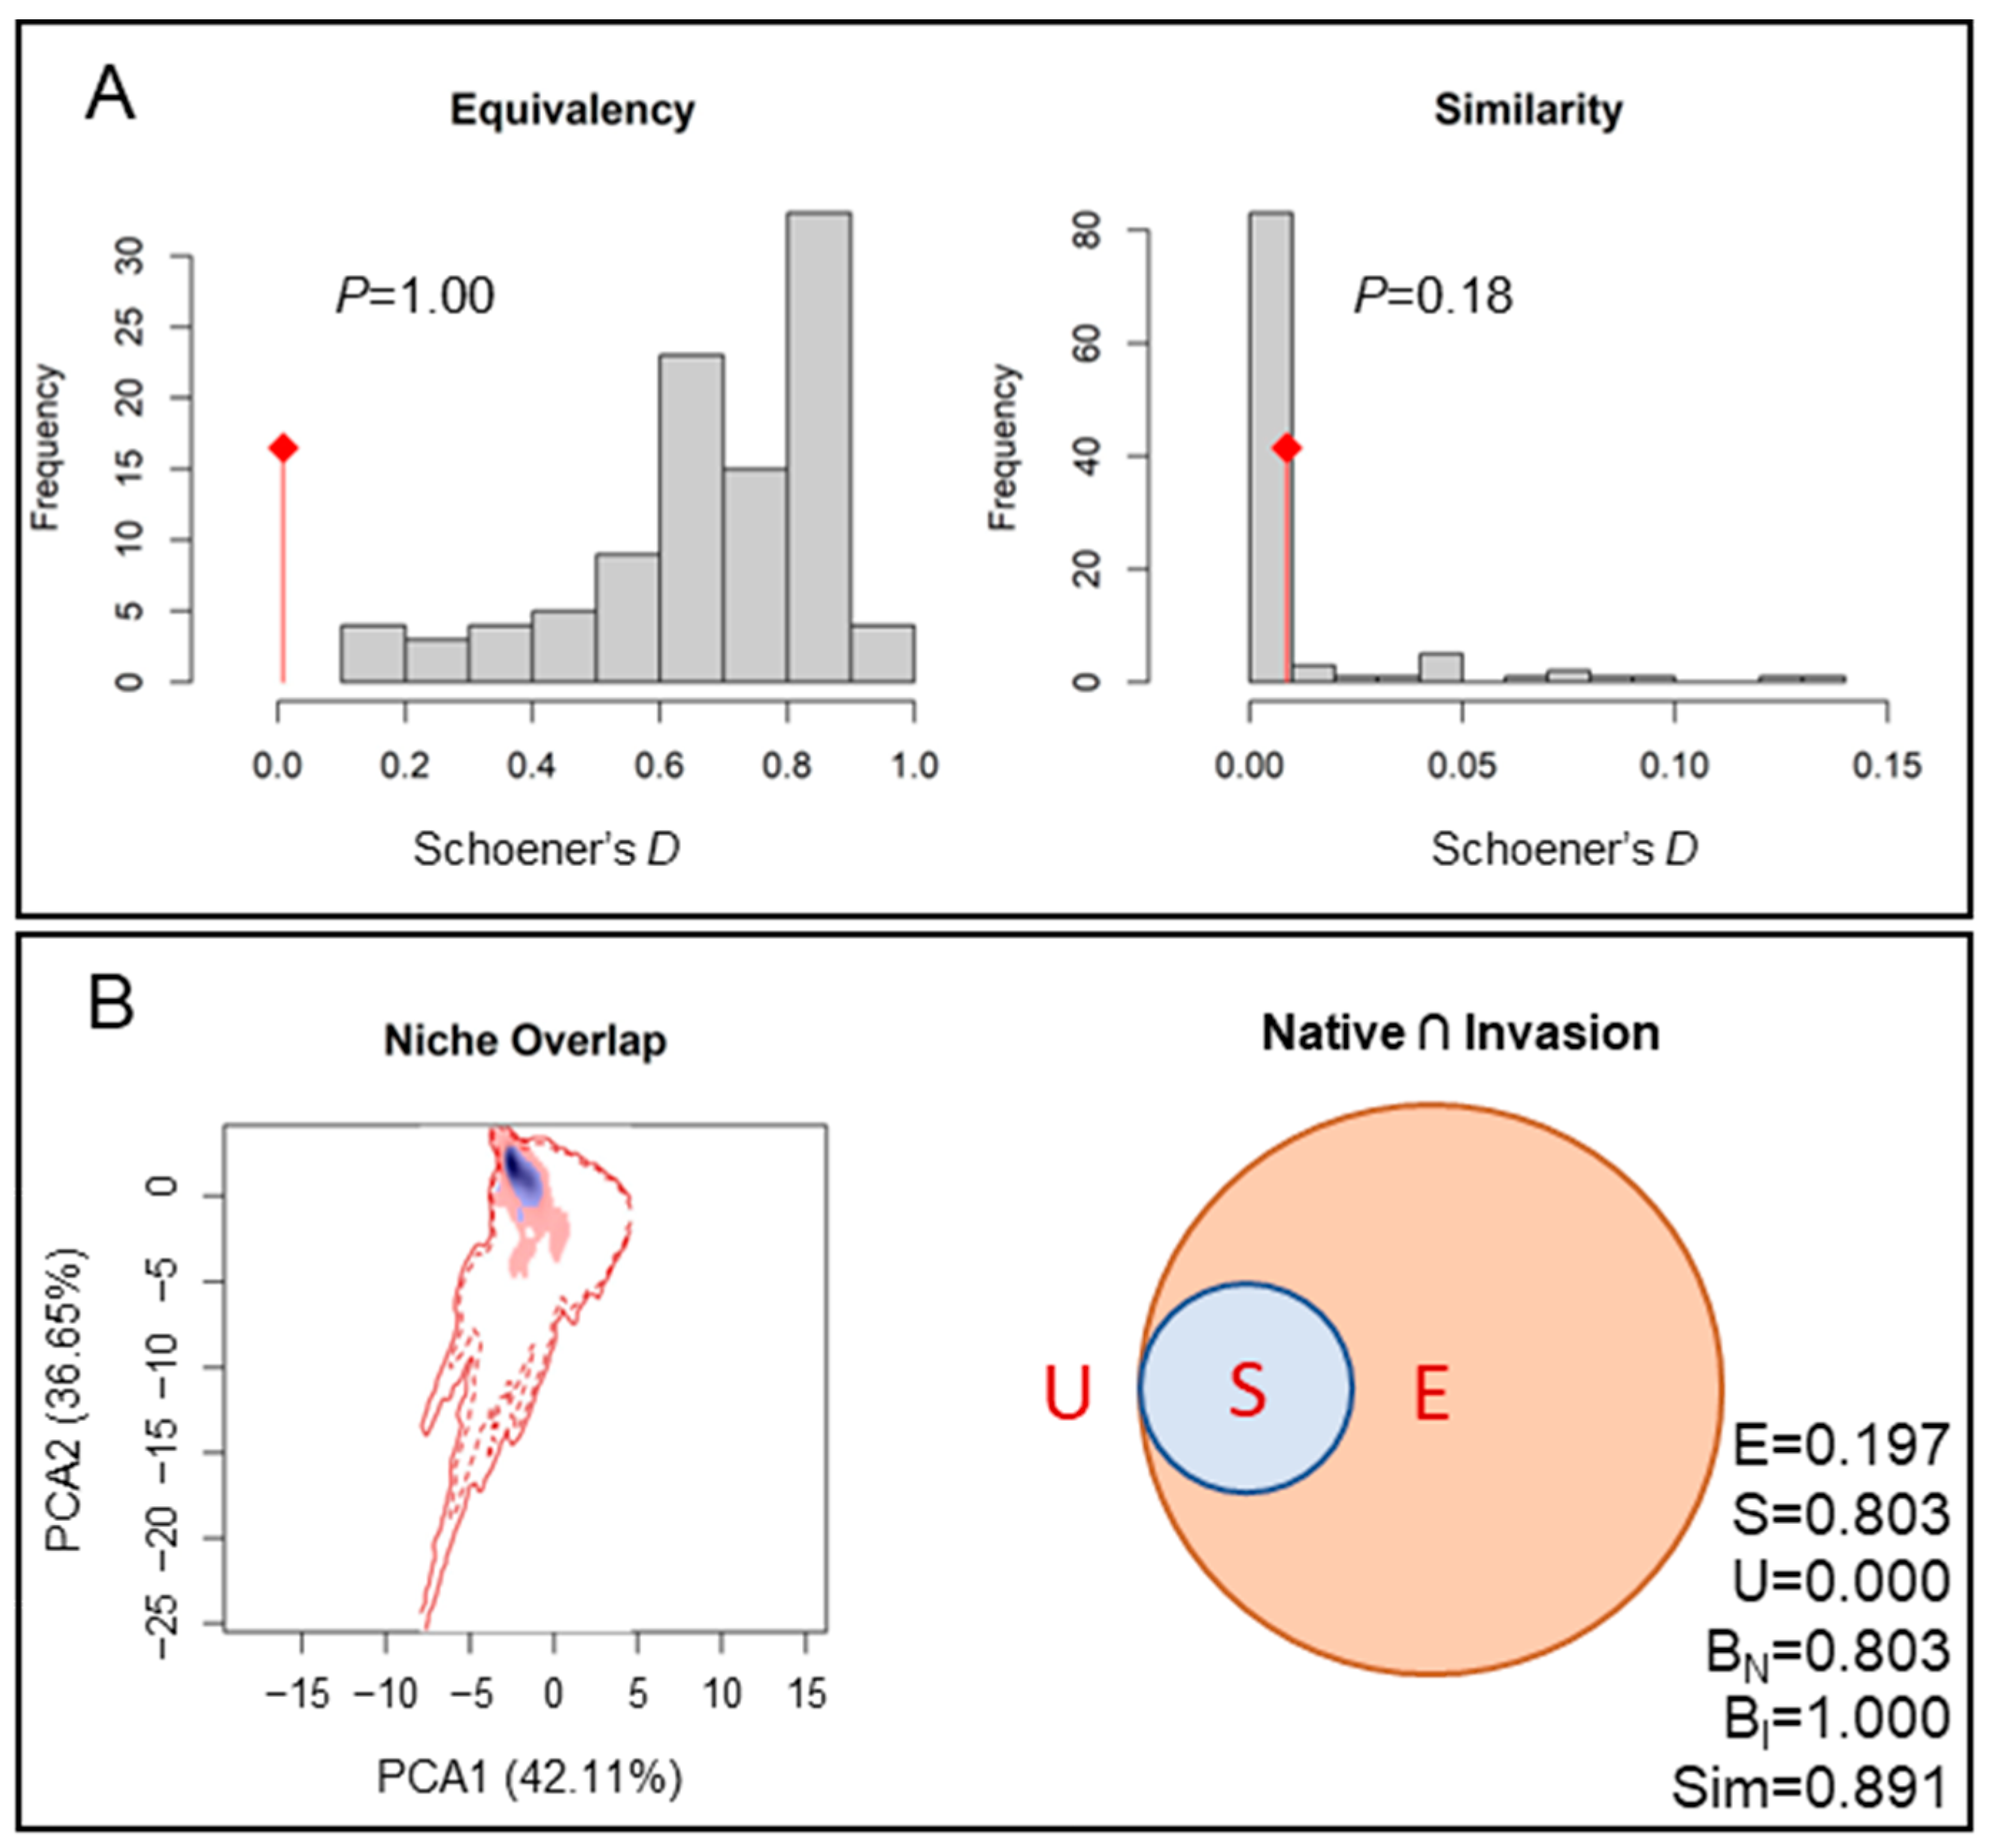
To determine whether the increasingly widespread distribution of desert locusts will depend on the rapid transformation of their niche, we determined the niche conservation of desert locusts in this study. We conducted niche overlap testing (niche equivalence and niche similarity test). The niche equivalence and similarity test results had p values of 1.00 and 0.18, respectively (Figure 6A). The niche expansion (E) was 0.197, niche stability (S) was 0.803, and niche unfilling (U) was 0.000. The large overlap between the native and invasive niches indicated that the niche is showing an expansion trend, but it has not shifted (Figure 6B). The native niche breadth (BN) of 0.803 was less than the invasive niche breadth 1.000 (BI), indicating that the invasive niche includes the native niche. The niche similarity index (Sim) was 0.891, which is greater than 0.5, indicating that the two niches occupy similar positions, showing that the niche is conservative (Figure 6B).
The three most important climatic predictors of desert locust distribution that we obtained from the predicted niche occupancy (PNO) profiles showed that the invasion niche of the minimum temperature of coldest month decreases at the peak, but expands on both sides compared with the native niche (Figure 7A). The invasion niche of annual precipitation considerably expanded, showing that the suitability for desert locusts in invasive areas is wider (Figure 7B). However, the invasion niche of the mean temperature of the driest quarter is narrower than the native niche (Figure 7C). In general, most parts of the niche remain unchanged (Figure 7, blue part). The niche expansion (Figure 7, red part) is substantial for the minimum temperature of the coldest month (Figure 7A) and annual precipitation (Figure 7B), being smaller for the mean temperature of the driest quarter (Figure 7C). Finally, unfilled niches (Figure 7, green part) are extremely small for the annual precipitation (Figure 7B), relatively small for the minimum temperature of the coldest month (Figure 7A), and relatively large for the mean temperature of the driest quarter (Figure 7C).

4. Discussion

The desert locust is one of the most harmful migratory pests in the world since its irregular outbreaks often negatively impact human food security. In response to environmental influences, desert locusts can form dense and fast-moving populations, which cover from less than one to several hundred square kilometers [7]. Climate, soil conditions, and land use that may influence the distribution and outbreaks of desert locusts have been considered in many studies [14,15,27], but few researchers have considered all factors when determining the current and future threats posed by desert locusts on a global scale. The currently known occurrences of desert locusts also showed that topographic factors may also be important factors affecting the migration of desert locusts, and mountains may be a major obstacle in preventing desert locust invasion [12]. In this study, we found that climate factors most strongly impact the distribution of desert locusts, and the climate factor with the strongest impact is the minimum temperature of the coldest month. We attribute this finding to a negative effect of low temperatures on the mating ability and fertilization probability of male locusts, thus affecting the oviposition probability of female locusts [28]. In addition to the minimum temperature of the coldest month, annual precipitation (0.237) and the mean temperature of the driest quarter (0.113) were the second and third most influential climatic factors affecting the spread of desert locusts, respectively (Table 1). Precipitation showed a strong impact on desert locusts, being mainly reflected in their reproductive stage. Desert locusts mainly live in semiarid environments, but they lay eggs in moist sand, so suitable rainfall is conducive to their survival and reproduction [29]. The response curves of the three abovementioned factors also showed that a higher temperature and drier environment are more favorable to the success of desert locusts (Figure 2), as these conditions are similar to those of its original habitat in East Africa.
The influential factors that ranked behind the three abovementioned factors were the fraction of potentially nonforested secondary land (0.070), the fraction of nonforested primary land (0.048), and the fraction of rangeland (0.036) (Table 1). These three land use factors are all characterized by the lack of forest cover, and forest cover is usually associated with humidity and low temperature, which are not conducive to the reproduction and survival of desert locusts, and so are key factors limiting the distribution of desert locusts. Although the known occurrences of desert locusts showed that high-altitude mountains are key barriers limiting the distribution of desert locusts [12], and the elevation importance value was only 0.022 (Table 1). The factors that had a stronger impact on its global distribution were climate factors, rather than relatively isolated high-altitude mountains and their elevation. For deserts and semiarid deserts where the habitat suitability of desert locusts will be high in the future (Figure 3), efforts should be directed to prevent the invasion of desert locusts.
The frequency of the occurrence of natural disasters caused by global climate change is increasing [13], as well as of various disasters caused by insect pests. Given the irregular outbreaks of desert locusts, knowing if the invasion of desert locusts is accompanied by a shift in ecological niche is the key for obtaining evidence of future large-scale outbreaks. The results also showed that the distribution of the area suitable for desert locusts would increase under both RCP2.6 and RCP8.5 scenarios (Figure 3, Figure 4 and Figure 5). However, whether the desert locust niche is shifting remains uncertain. The effects of climate change on invasive species have been found to be double-edged [16]. In this study, our results showed that the niche of desert locusts is conservative (Figure 6 and Figure 7). This shows that although desert locusts often have strong migratory and adaptive abilities [7], with occasional large-scale outbreaks [30,31], their distribution shrinks after each outbreak to their original place, rather than becoming a stable species in the invaded area. Moreover, the numerous native species of Schistocerca are known from America, which may limit the successful naturalization of desert locusts because of the potential similarity of niches. However, if the ecological niche of desert locusts changes in the future, and they settle in invaded areas (especially high-suitability areas that are still unaffected), global food security will be more seriously affected.
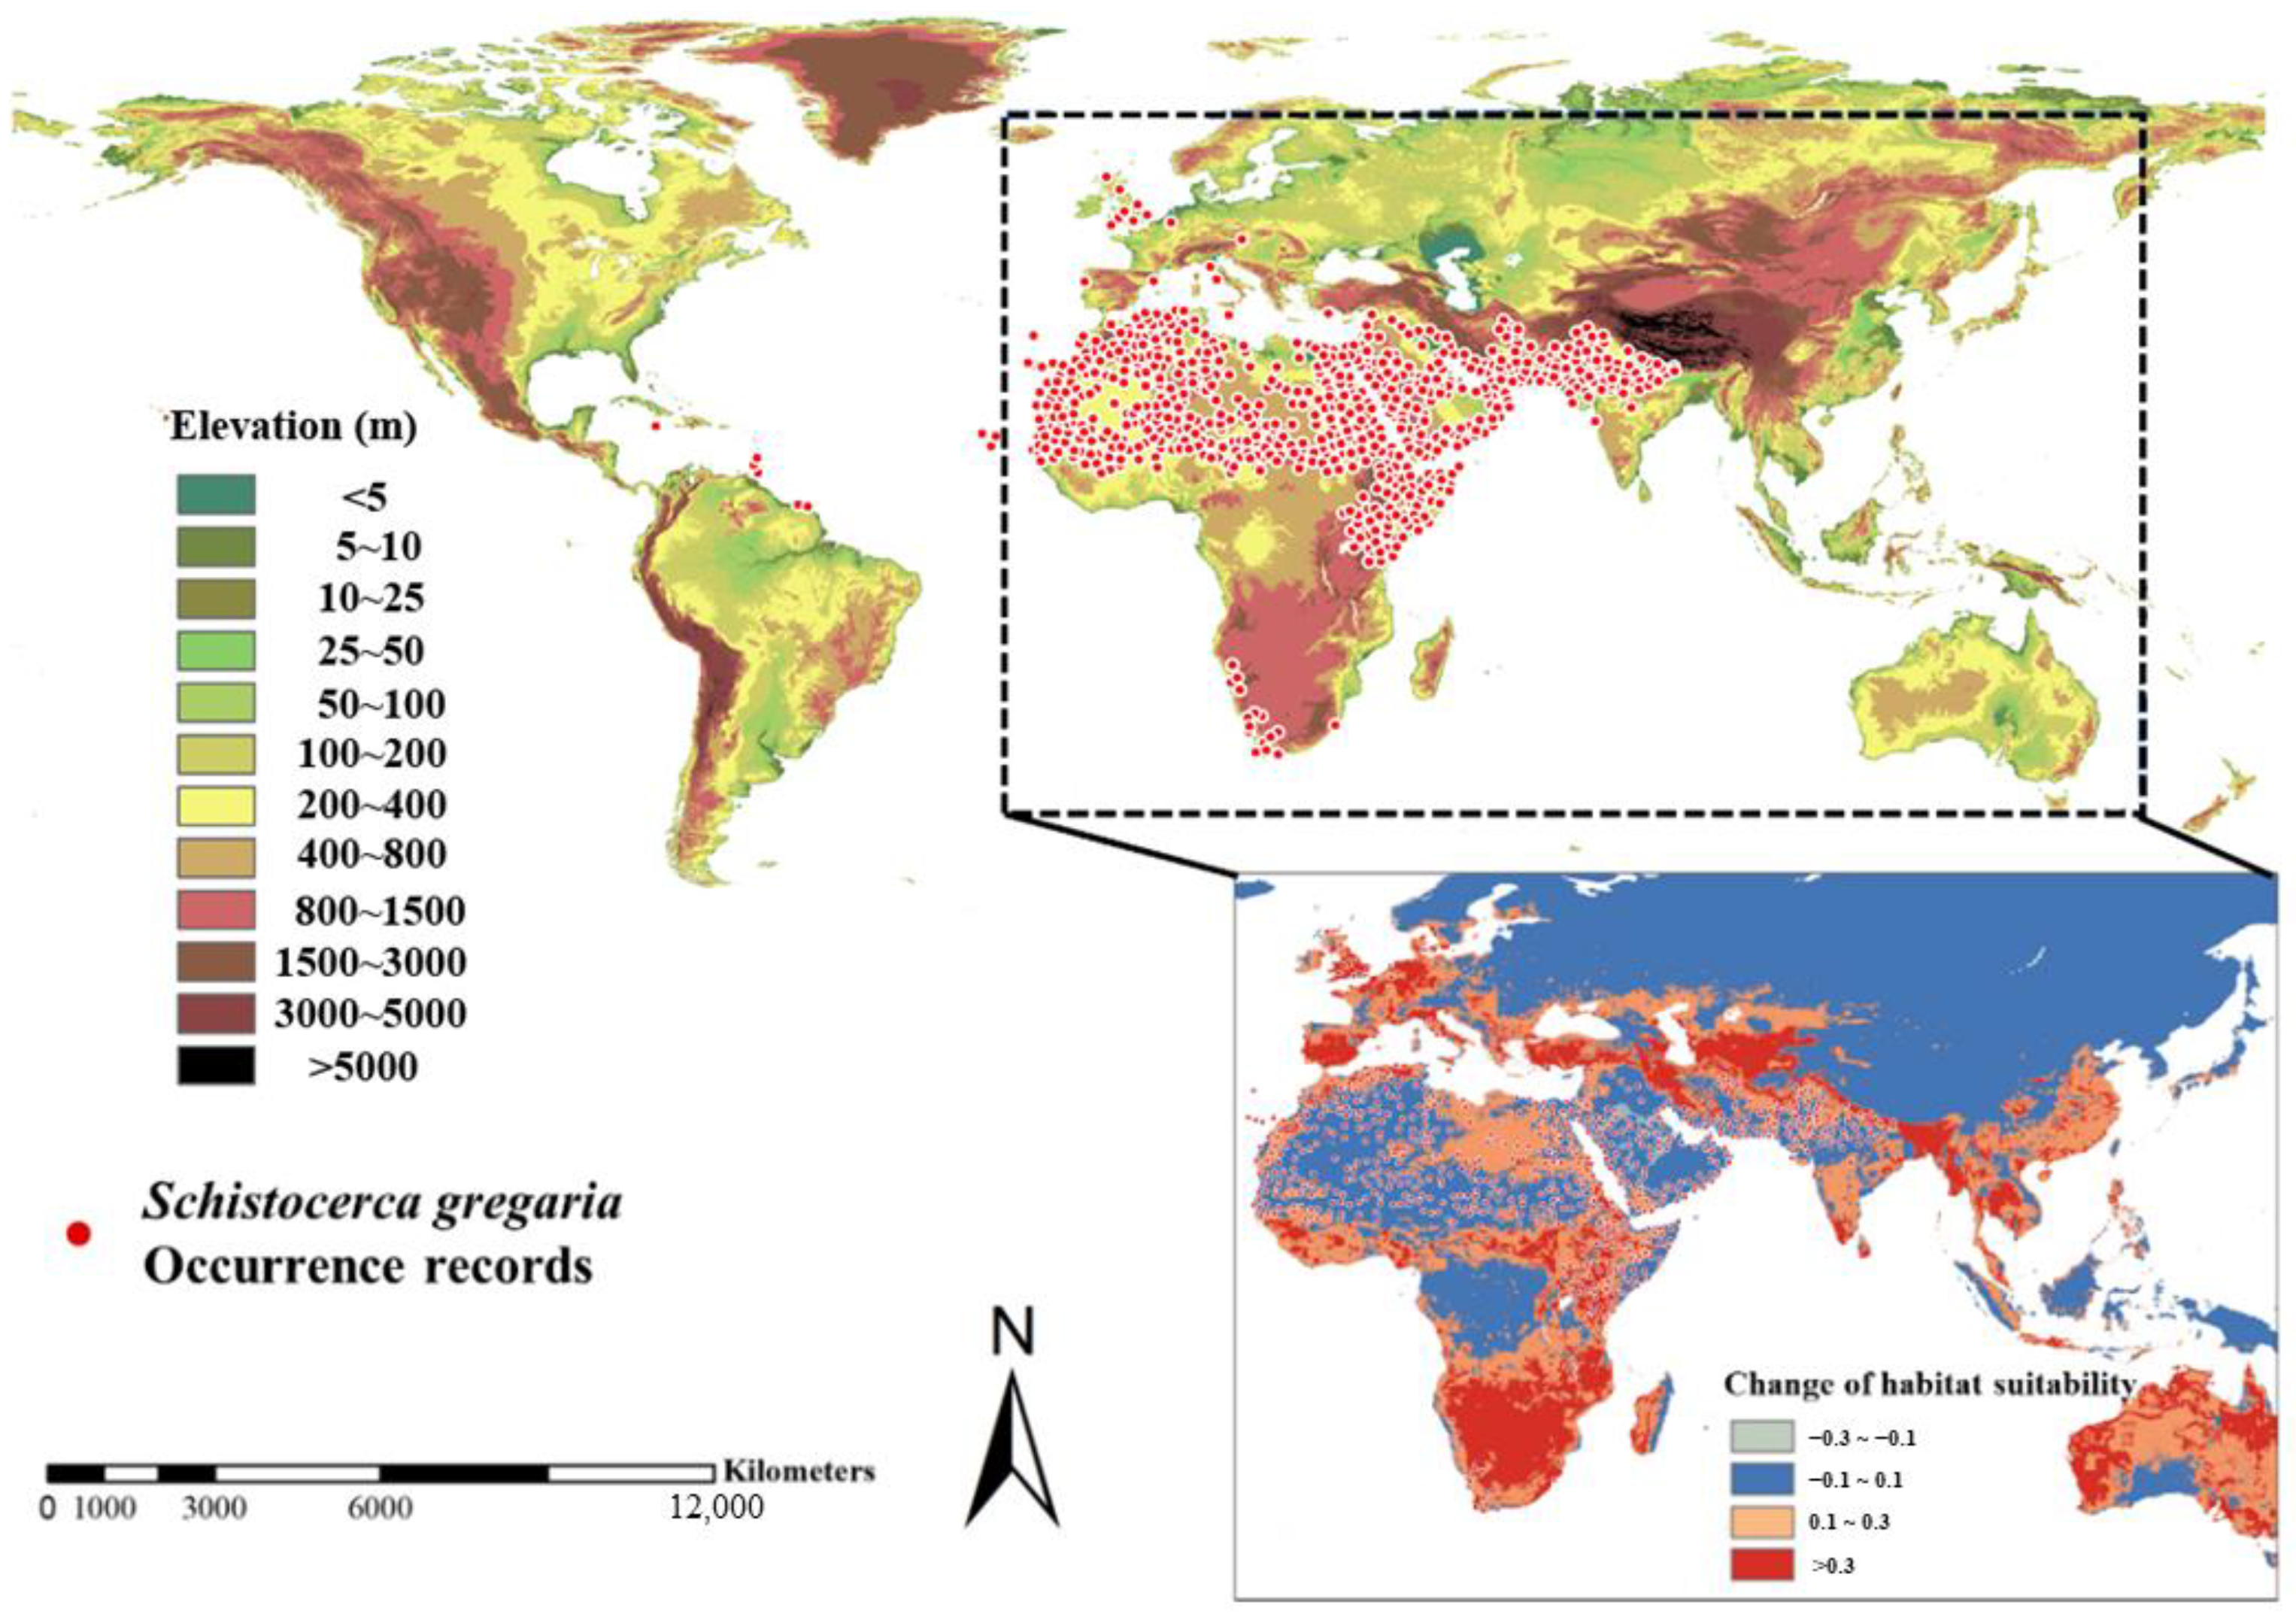
The desert locust occurrence records, combined with the possible future habitats, can help to identify the invasion routes. The results showed that many areas worldwide are highly suitable for desert locusts, despite currently showing no or minimal distribution (Figure 1 and Figure 3). Although these areas are far from the main range of desert locusts, some spectacular and very long-distance swarm migrations have occurred. For example, desert locusts once migrated about 5000 km in 1988 from Africa to the Caribbean and neighboring parts of South America [32]. Therefore, although the desert locust is not currently distributed in Australia, the country is highly suitable for its inhabitation, so once the desert locust enters Australia from Southeast Asia through human-facilitated or occasional migration, it will seriously harm local agricultural production in Australia (Figure 8). The same risk exists in North America and South America, despite their distance from Eurasia (Figure 5). As densely populated regions in the world, the east and southeast of Asia are also seriously threatened by desert locusts. The potential invasion route of desert locusts into East Asia may be along the south side of the Himalayas, where their spread to Asia is blocked by high-altitude areas of the Himalayas (Figure 8). Although mountains may hinder desert locust migration, the global altitude map shows that no similar barriers exist in most other areas (Figure 8), so the key factor affecting the distribution of desert locusts is still probably climate. Desert locusts may spread to Europe along the north of the Mediterranean (Figure 8). Therefore, all continents should strengthen their desert locust invasion prevention measures.

5. Conclusions

In this study, we used the biomod2 model to investigate the effects of climate, land use, and topographic factors on desert locust distribution to predict the changes in its future distribution so as to determine the areas at risk and the drivers of desert locust spread. The three most important factors influencing the desert locust distribution are related to climate and include the minimum temperature of the coldest month, the annual precipitation, and the mean temperature of the driest quarter. In all future scenarios, Africa is at the highest risk of desert locust outbreak, followed by Asia. In the RCP2.6 and RCP8.5 scenarios, South America, North America, and Australia would provide many highly and moderately suitable habitats for desert locusts. Although few desert locust occurrences have been recorded at present, their potential invasion of the above areas in the future should be noted. Despite repeated outbreaks of desert locusts worldwide, their climatic niche is still conservative, which might explain the periodicity of the outbreaks rather than their persistence in one area. As such, more attention must be paid to the possible niche changes and the formation of stable desert locust populations in high-risk areas in the future. However, the modern habitat of desert locusts has developed historically and depends not only on the climate, but also on the type of vegetation and human economic activity; complex factors make their invasion possibilities diverse, but the probable migration of desert locusts through the vast expanses of the Atlantic and Pacific Oceans, which have potentially suitable areas, is very problematic, especially considering that they are phytophages and lay eggs in the soil. Therefore, we need to prevent areas that are highly suitable but not yet invaded, but also maintain an optimistic attitude.

Supplementary Materials

The following supporting information can be downloaded at: https://www.mdpi.com/article/10.3390/d15101038/s1, Table S1: Importance values of all variables affecting desert locust distribution from the first model construction; Table S2: Correlation analysis of the climate, land use, and topographical factors.

Author Contributions

Conceptualization, T.W.; methodology, Q.T. and J.F.; investigation, Q.T., D.Z. and J.Z.; writing—original draft preparation, Q.T. and T.W.; writing—review and editing, T.W., B.W. and X.H. All authors have read and agreed to the published version of the manuscript.

Funding

This research was funded by National Natural Science Foundation of China, grant number 32201280, and Basic Research Joint Special Project of Local Under-graduate University in Yunnan Province, grant number 2019FH001(-105).

Institutional Review Board Statement

Not applicable.

Data Availability Statement

All data are presented in the manuscript and Supplementary Materials.

Conflicts of Interest

The authors declare no conflict of interest.

References

  1. Molotoks, A.; Smith, P.; Dawson, T.P. Impacts of land use, population, and climate change on global food security. Food Energy Secur. 2021, 10, e261. [Google Scholar] [CrossRef]
  2. Wheeler, T.; Von Braun, J. Climate change impacts on global food security. Science 2013, 341, 508–513. [Google Scholar] [CrossRef] [PubMed]
  3. Pandey, M.; Suwal, B.; Kayastha, P.; Suwal, G.; Khanal, D. Desert locust invasion in Nepal and possible management strategies: A review. J. Agric. Food Res. 2021, 5, 100166. [Google Scholar] [CrossRef]
  4. FAO. Desert Locust. Available online: https://www.fao.org/locusts/en/ (accessed on 20 April 2022).
  5. Meynard, C.N.; Lecoq, M.; Chapuis, M.P.; Piou, C. On the relative role of climate change and management in the current desert locust outbreak in East Africa. Glob. Chang. Biol. 2020, 26, 3753–3755. [Google Scholar] [CrossRef]
  6. Saha, A.; Rahman, S.; Alam, S. Modeling current and future potential distributions of desert locust Schistocerca gregaria (Forskål) under climate change scenarios using MaxEnt. J. Asia Pac. Biodivers. 2021, 14, 399–409. [Google Scholar] [CrossRef]
  7. Harrison, J.F. Gregarious locusts down-regulate muscular catabolic capacities yet fly far. Proc. Natl. Acad. Sci. USA 2022, 119, e2122086119. [Google Scholar] [CrossRef] [PubMed]
  8. Cornelissen, B.; Neumann, P.; Schweiger, O. Global warming promotes biological invasion of a honey bee pest. Glob. Chang. Biol. 2019, 25, 3642–3655. [Google Scholar] [CrossRef]
  9. Gómez, D.; Salvador, P.; Sanz, J.; Casanova, J.L. Modelling desert locust presences using 32-year soil moisture data on a large-scale. Ecol. Indic. 2020, 117, 106655. [Google Scholar] [CrossRef]
  10. Kimathi, E.; Tonnang, H.E.; Subramanian, S.; Cressman, K.; Abdel-Rahman, E.M.; Tesfayohannes, M.; Niassy, S.; Torto, B.; Dubois, T.; Tanga, C.M.; et al. Prediction of breeding regions for the desert locust Schistocerca gregaria in East Africa. Sci. Rep. 2020, 10, 11937. [Google Scholar] [CrossRef]
  11. Guan, J.; Li, M.; Ju, X.; Lin, J.; Wu, J.; Zheng, J. The potential habitat of desert locusts is contracting: Predictions under climate change scenarios. PeerJ 2021, 9, e12311. [Google Scholar] [CrossRef]
  12. Liu, J.; Lecoq, M.; Zhang, L. Desert Locust Stopped by Tibetan Highlands during the 2020 Upsurge. Agronomy 2021, 11, 2287. [Google Scholar] [CrossRef]
  13. Christina, M.; Limbada, F.; Atlan, A. Climatic niche shift of an invasive shrub (Ulex europaeus): A global scale comparison in native and introduced regions. J. Plant Ecol. 2020, 13, 42–50. [Google Scholar] [CrossRef]
  14. Meynard, C.N.; Gay, P.E.; Lecoq, M.; Foucart, A.; Piou, C.; Chapuis, M.P. Climate-driven geographic distribution of the desert locust during recession periods: Subspecies’ niche differentiation and relative risks under scenarios of climate change. Glob. Chang. Biol. 2017, 23, 4739–4749. [Google Scholar] [CrossRef] [PubMed]
  15. Salih, A.A.; Baraibar, M.; Mwangi, K.K.; Artan, G. Climate change and locust outbreak in East Africa. Nat. Clim. Chang. 2020, 10, 584–585. [Google Scholar] [CrossRef]
  16. Gong, X.; Chen, Y.J.; Wang, T.; Jiang, X.F.; Hu, X.K.; Feng, J.M. Double-edged effects of climate change on plant invasions: Ecological niche modeling global distributions of two invasive alien plants. Sci. Total Environ. 2020, 740, 139933. [Google Scholar] [CrossRef] [PubMed]
  17. Piou, C.; Bacar, M.E.H.J.; Ebbe, M.A.O.B.; Chihrane, J.; Ghaout, S.; Cisse, S.; Lecoq, M.; Halima, T.B. Mapping the spatiotemporal distributions of the desert locust in Mauritania and Morocco to improve preventive management. Basic Appl. Ecol. 2017, 25, 37–47. [Google Scholar] [CrossRef]
  18. Yang, R.J.; Gong, X.; Hu, X.K.; Hu, Y.W.; Feng, J.M. Global cultivation of wheat crops induces considerable shifts in the range and niche of species relative to their wild progenitors. Environ. Res. Commun. 2021, 3, 115012. [Google Scholar] [CrossRef]
  19. Rolland, J.; Silvestro, D.; Schluter, D.; Guisan, A.; Broennimann, O.; Salamin, N. The impact of endothermy on the climatic niche evolution and the distribution of vertebrate diversity. Nat. Ecol. Evol. 2018, 2, 459–464. [Google Scholar] [CrossRef]
  20. Polaina, E.; Soultan, A.; Part, T.; Recio, M.R. The future of invasive terrestrial vertebrates in Europe under climate and land-use change. Environ. Res. Lett. 2021, 16, 044004. [Google Scholar] [CrossRef]
  21. Brown, J.L.; Bennett, J.R.; French, C.M. SDMtoolbox 2.0: The next generation Python-based GIS toolkit for landscape genetic, biogeographic and species distribution model analyses. PeerJ 2017, 5, e4095. [Google Scholar] [CrossRef]
  22. Hijmans, R.J.; Cameron, S.E.; Parra, J.L.; Jones, P.G.; Jarvis, A. Very high resolution interpolated climate surfaces for global land areas. Int. J. Climatol. 2005, 25, 1965–1978. [Google Scholar] [CrossRef]
  23. McSweeney, C.F.; Jones, R.G.; Lee, R.W.; Rowell, D.P. Selecting CMIP5 GCMs for downscaling over multiple regions. Clim. Dynam. 2015, 44, 3237–3260. [Google Scholar] [CrossRef]
  24. Thuiller, W.; Lafourcade, B.; Engler, R.; Araujo, M.B. BIOMOD—A platform for ensemble forecasting of species distributions. Ecography 2009, 32, 369–373. [Google Scholar] [CrossRef]
  25. Liu, T.M.; Wang, J.M.; Hu, X.K.; Feng, J.M. Land-use change drives present and future distributions of Fall armyworm, Spodoptera frugiperda (J.E. Smith) (Lepidoptera: Noctuidae). Sci. Total Environ. 2020, 706, 135872. [Google Scholar] [CrossRef]
  26. Di Cola, V.; Broennimann, O.; Petitpierre, B.; Breiner, F.T.; D’Amen, M.; Randin, C.; Engler, R.; Pottier, J.; Pio, D.; Dubuis, A.; et al. ecospat: An R package to support spatial analyses and modeling of species niches and distributions. Ecography 2017, 40, 774–787. [Google Scholar] [CrossRef]
  27. Peng, W.X.; Ma, N.L.; Zhang, D.Q.; Zhou, Q.; Yue, X.C.; Khoo, S.C.; Yang, H.; Guan, R.R.; Chen, H.L.; Zhang, X.F.; et al. A review of historical and recent locust outbreaks: Links to global warming, food security and mitigation strategies. Environ. Res. 2020, 191, 110046. [Google Scholar] [CrossRef] [PubMed]
  28. Nishide, Y.; Suzuki, T.; Tanaka, S. Synchrony in the hatching of eggs in the desert locust Schistocerca gregaria (Orthoptera: Acrididae): Egg condition influences hatching time in the laboratory and under simulated field temperatures. Appl. Entomol. Zool. 2017, 52, 599–604. [Google Scholar] [CrossRef]
  29. Waldner, F.; Ebbe, M.A.B.; Cressman, K.; Defourny, P. Operational Monitoring of the Desert Locust Habitat with Earth Ob-servation: An Assessment. ISPRS Int. J. Geo-Inf. 2015, 4, 2379–2400. [Google Scholar] [CrossRef]
  30. Lazar, M.; Piou, C.; Doumandji-Mitiche, B.; Lecoq, M. Importance of solitarious desert locust population dynamics: Lessons from historical survey data in Algeria. Entomol. Exp. Appl. 2016, 161, 168–180. [Google Scholar] [CrossRef]
  31. Matthews, G.A. New Technology for Desert Locust Control. Agronomy 2021, 11, 1052. [Google Scholar] [CrossRef]
  32. Rosenberg, J.; Burt, P. Windborne displacements of desert locusts from Africa to the Caribbean and south America. Aerobiologia 1999, 15, 167–175. [Google Scholar] [CrossRef]
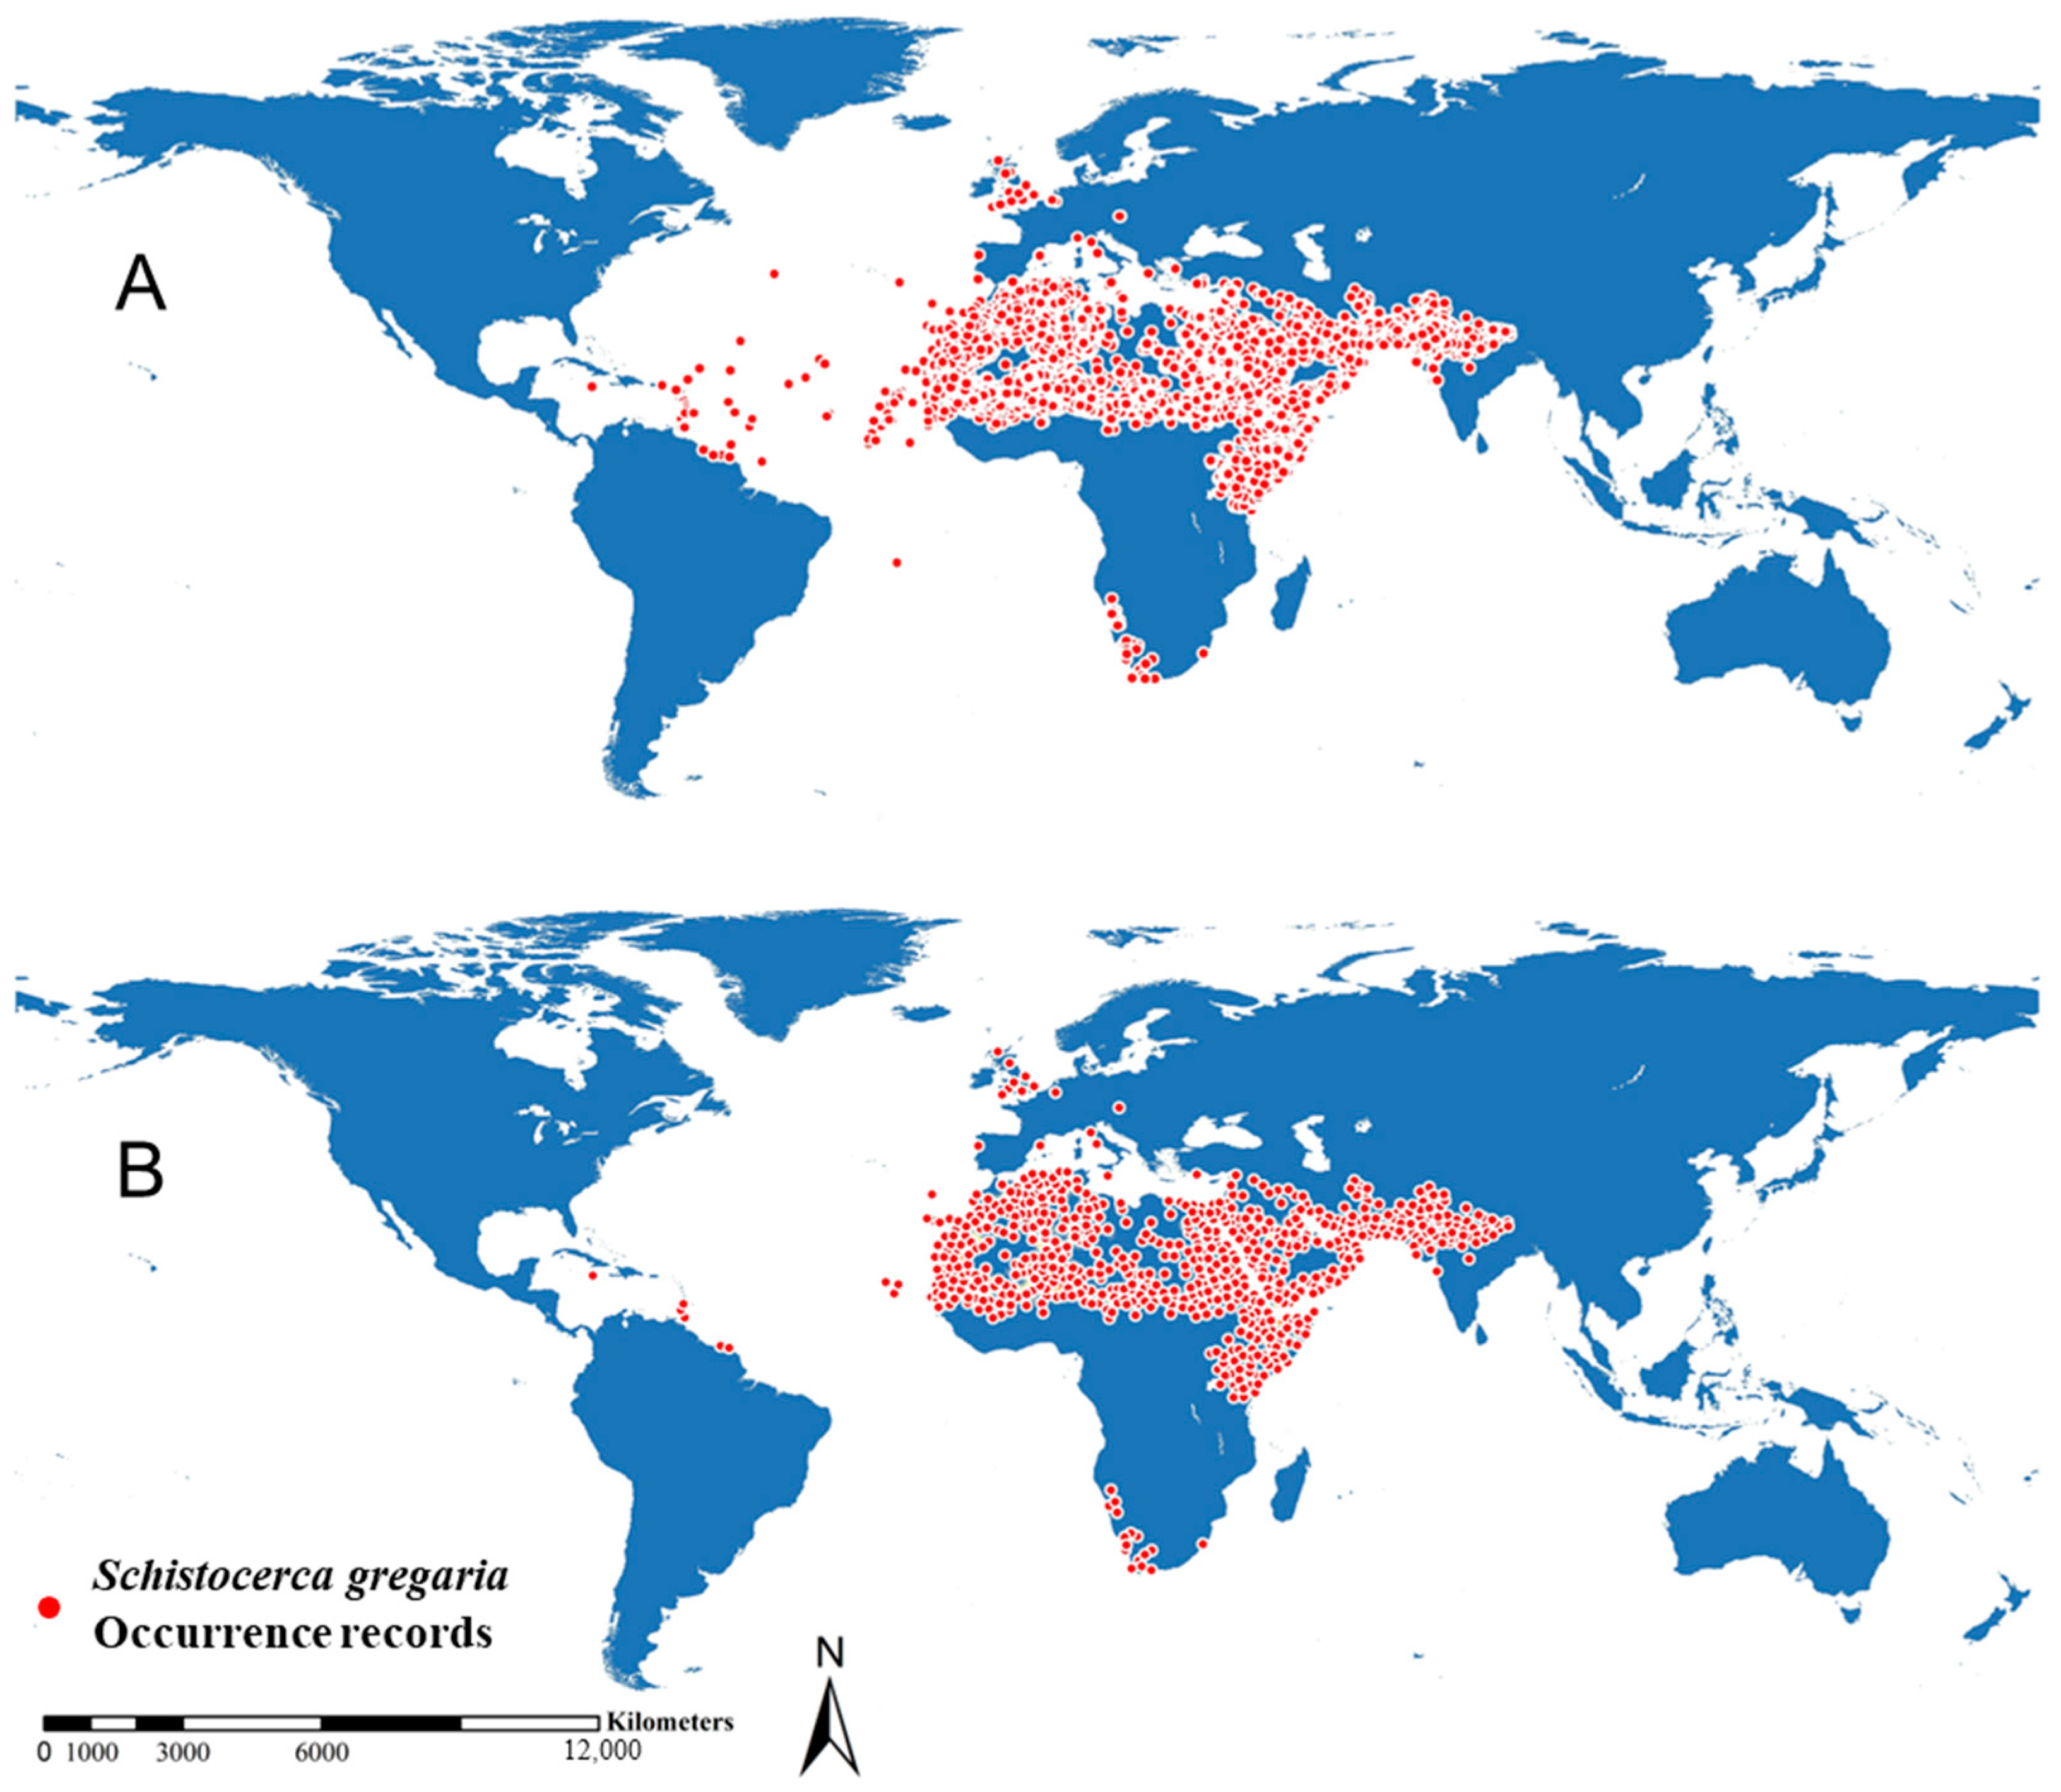
Figure 1. (A) Records of desert locusts from the FAO and GBIF (107,270 occurrence records) and (B) the occurrence records of desert locusts were reduced after spatial autocorrelation analysis (699 occurrence records).
Diversity 15 01038 g001
Figure 2. The response curve of desert locusts to the three predictors with the largest importance values: (A) minimum temperature of coldest month; (B) annual precipitation; and (C) mean temperature of driest quarter.
Diversity 15 01038 g002
Figure 3. (A) Current and future: (B) RCP2.6 and (C) RCP8.5 distribution of habitats suitable and unsuitable for desert locusts.
Diversity 15 01038 g003
Figure 4. Classification of potential habitats of desert locusts into four levels: high potential (>0.6), moderate potential (0.4–0.6), low potential (0.2–0.4), and no potential (<0.2): (A) current, (B) RCP2.6, and (C) the RCP8.5 scenarios.
Diversity 15 01038 g004
Figure 5. Changes in the area of habitat suitable for desert locust, classified into five rankings: substantial decrease (<−0.3), moderate decrease (−0.3 to −0.1), stable (−0.1~0.1), moderate increase (0.1~0.3), and substantial increase (>0.3): (A) the differences between the current and RCP2.6 (DifferenceCurrent-RCP2.6) scenarios and (B) the differences between the current and RCP8.5 (DifferenceCurrent-RCP8.5) scenarios. The values of changes in habitat suitability were calculated by directly subtracting the current habitat suitability (Figure 4A) from the future habitat suitability (Figure 4B,C).
Diversity 15 01038 g005
Figure 6. Climatic niche of desert locust: (A) niche equivalence test and niche similarity test frequency distribution histograms; the Schoener D value represents the degree of niche overlap, and frequency represents the frequencies of niche overlaps; and (B) native and invasive niche overlap. In the PCA analysis, blue indicates niche overlap and pink represents expansion, and solid and dotted contour lines indicate environmental space in invasion and native areas of desert locusts, respectively. In the overlap graph, the orange circle represents the native niche; the blue circle represents the invasive niche. E, niche expansion; S, niche stability; U, niche unfilling; BN, native niche breadth; BI, invasive niche breadth; and Sim, niche similarity index.
Diversity 15 01038 g006
Figure 7. Niche overlap maps of the three climatic factors most strongly influencing desert locust distribution: (A) minimum temperature of coldest month, (B) annual precipitation, and (C) mean temperature of the driest quarter. Red, niche expansion; blue, niche overlap; and green, unfilled niche.
Diversity 15 01038 g007
Figure 8. Elevation distribution map, and high-altitude mountains may be the key in preventing the spread of desert locusts, but, as a whole, only the Himalayas are capable of this. The insert is the change map of the habitat suitable for desert locusts under the RCP8.5 scenario.
Diversity 15 01038 g008
Table 1. Importance values of the residual variables affecting desert locust spatial distribution.
CategoryPredictorImportance
Climatic predictorsMinimum temperature of coldest month0.285
Annual precipitation0.237
Mean temperature of driest quarter0.113
Maximum temperature of warmest month0.038
Precipitation of driest quarter0.029
Precipitation seasonality0.028
Mean diurnal range0.011
Precipitation of coldest quarter0.009
Land use predictorsFraction of potentially nonforested secondary land0.070
Fraction of nonforested primary land0.048
Fraction of rangeland0.036
Fraction of forested primary land0.027
Fraction of urban land0.026
Fraction of managed pasture0.016
Fraction of cropland0.014
Fraction of potentially forested secondary land0.011
Topographical predictorsElevation0.022
Slope0.011
Aspect0.008
Table 2. Changes in the habitat suitability area (M km2) for different continents.
ContinentsCurrentRCP2.6RCP8.5Difference between Current and RCP2.6Difference between Current and RCP8.5
Africa12.9817.9919.375.016.39
Asia7.138.4110.121.282.99
North America0.351.151.960.801.61
Australia0.161.602.241.442.08
South America0.131.251.771.121.64
Europe0.130.681.130.551.00
Total20.8831.0836.5910.215.71
Disclaimer/Publisher’s Note: The statements, opinions and data contained in all publications are solely those of the individual author(s) and contributor(s) and not of MDPI and/or the editor(s). MDPI and/or the editor(s) disclaim responsibility for any injury to people or property resulting from any ideas, methods, instructions or products referred to in the content.