
Metabolomics Unravels Grazing Interactions under Nutrient Enrichment from Aquaculture

 , , , , ,

Abstract
1. Introduction
2. Materials and Methods
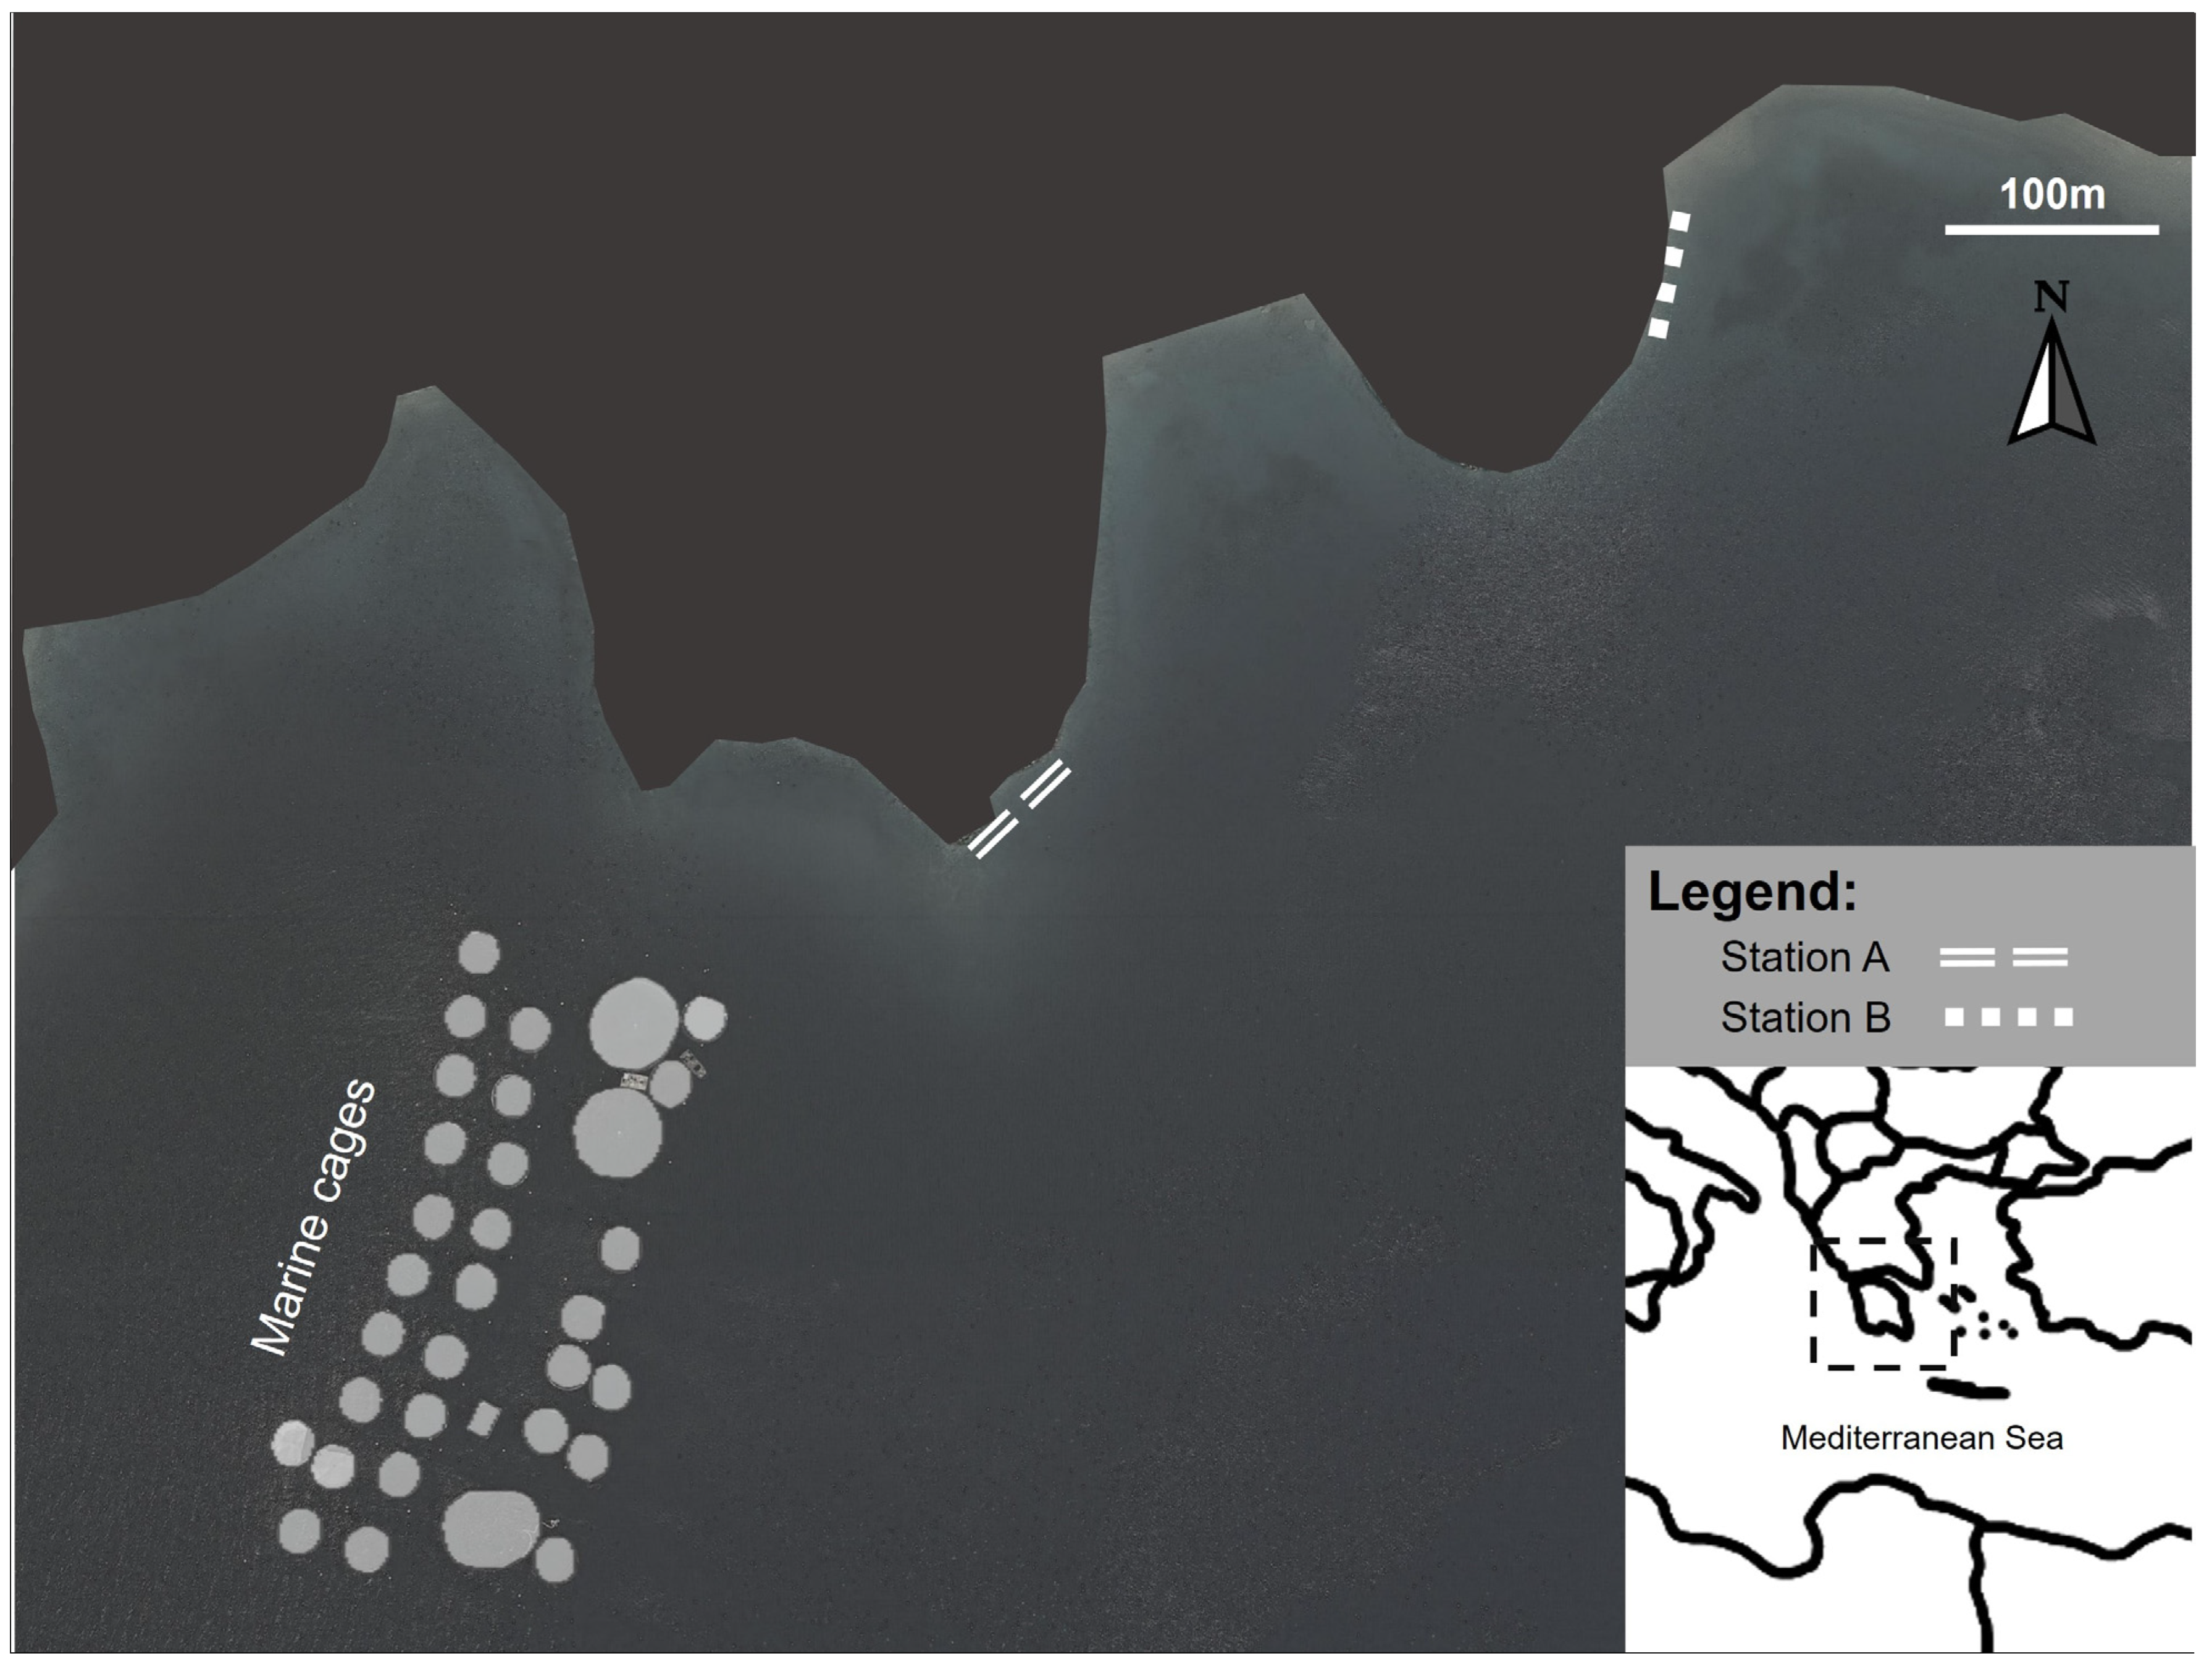
2.1. Sampling Strategy
2.2. Laboratory Analysis
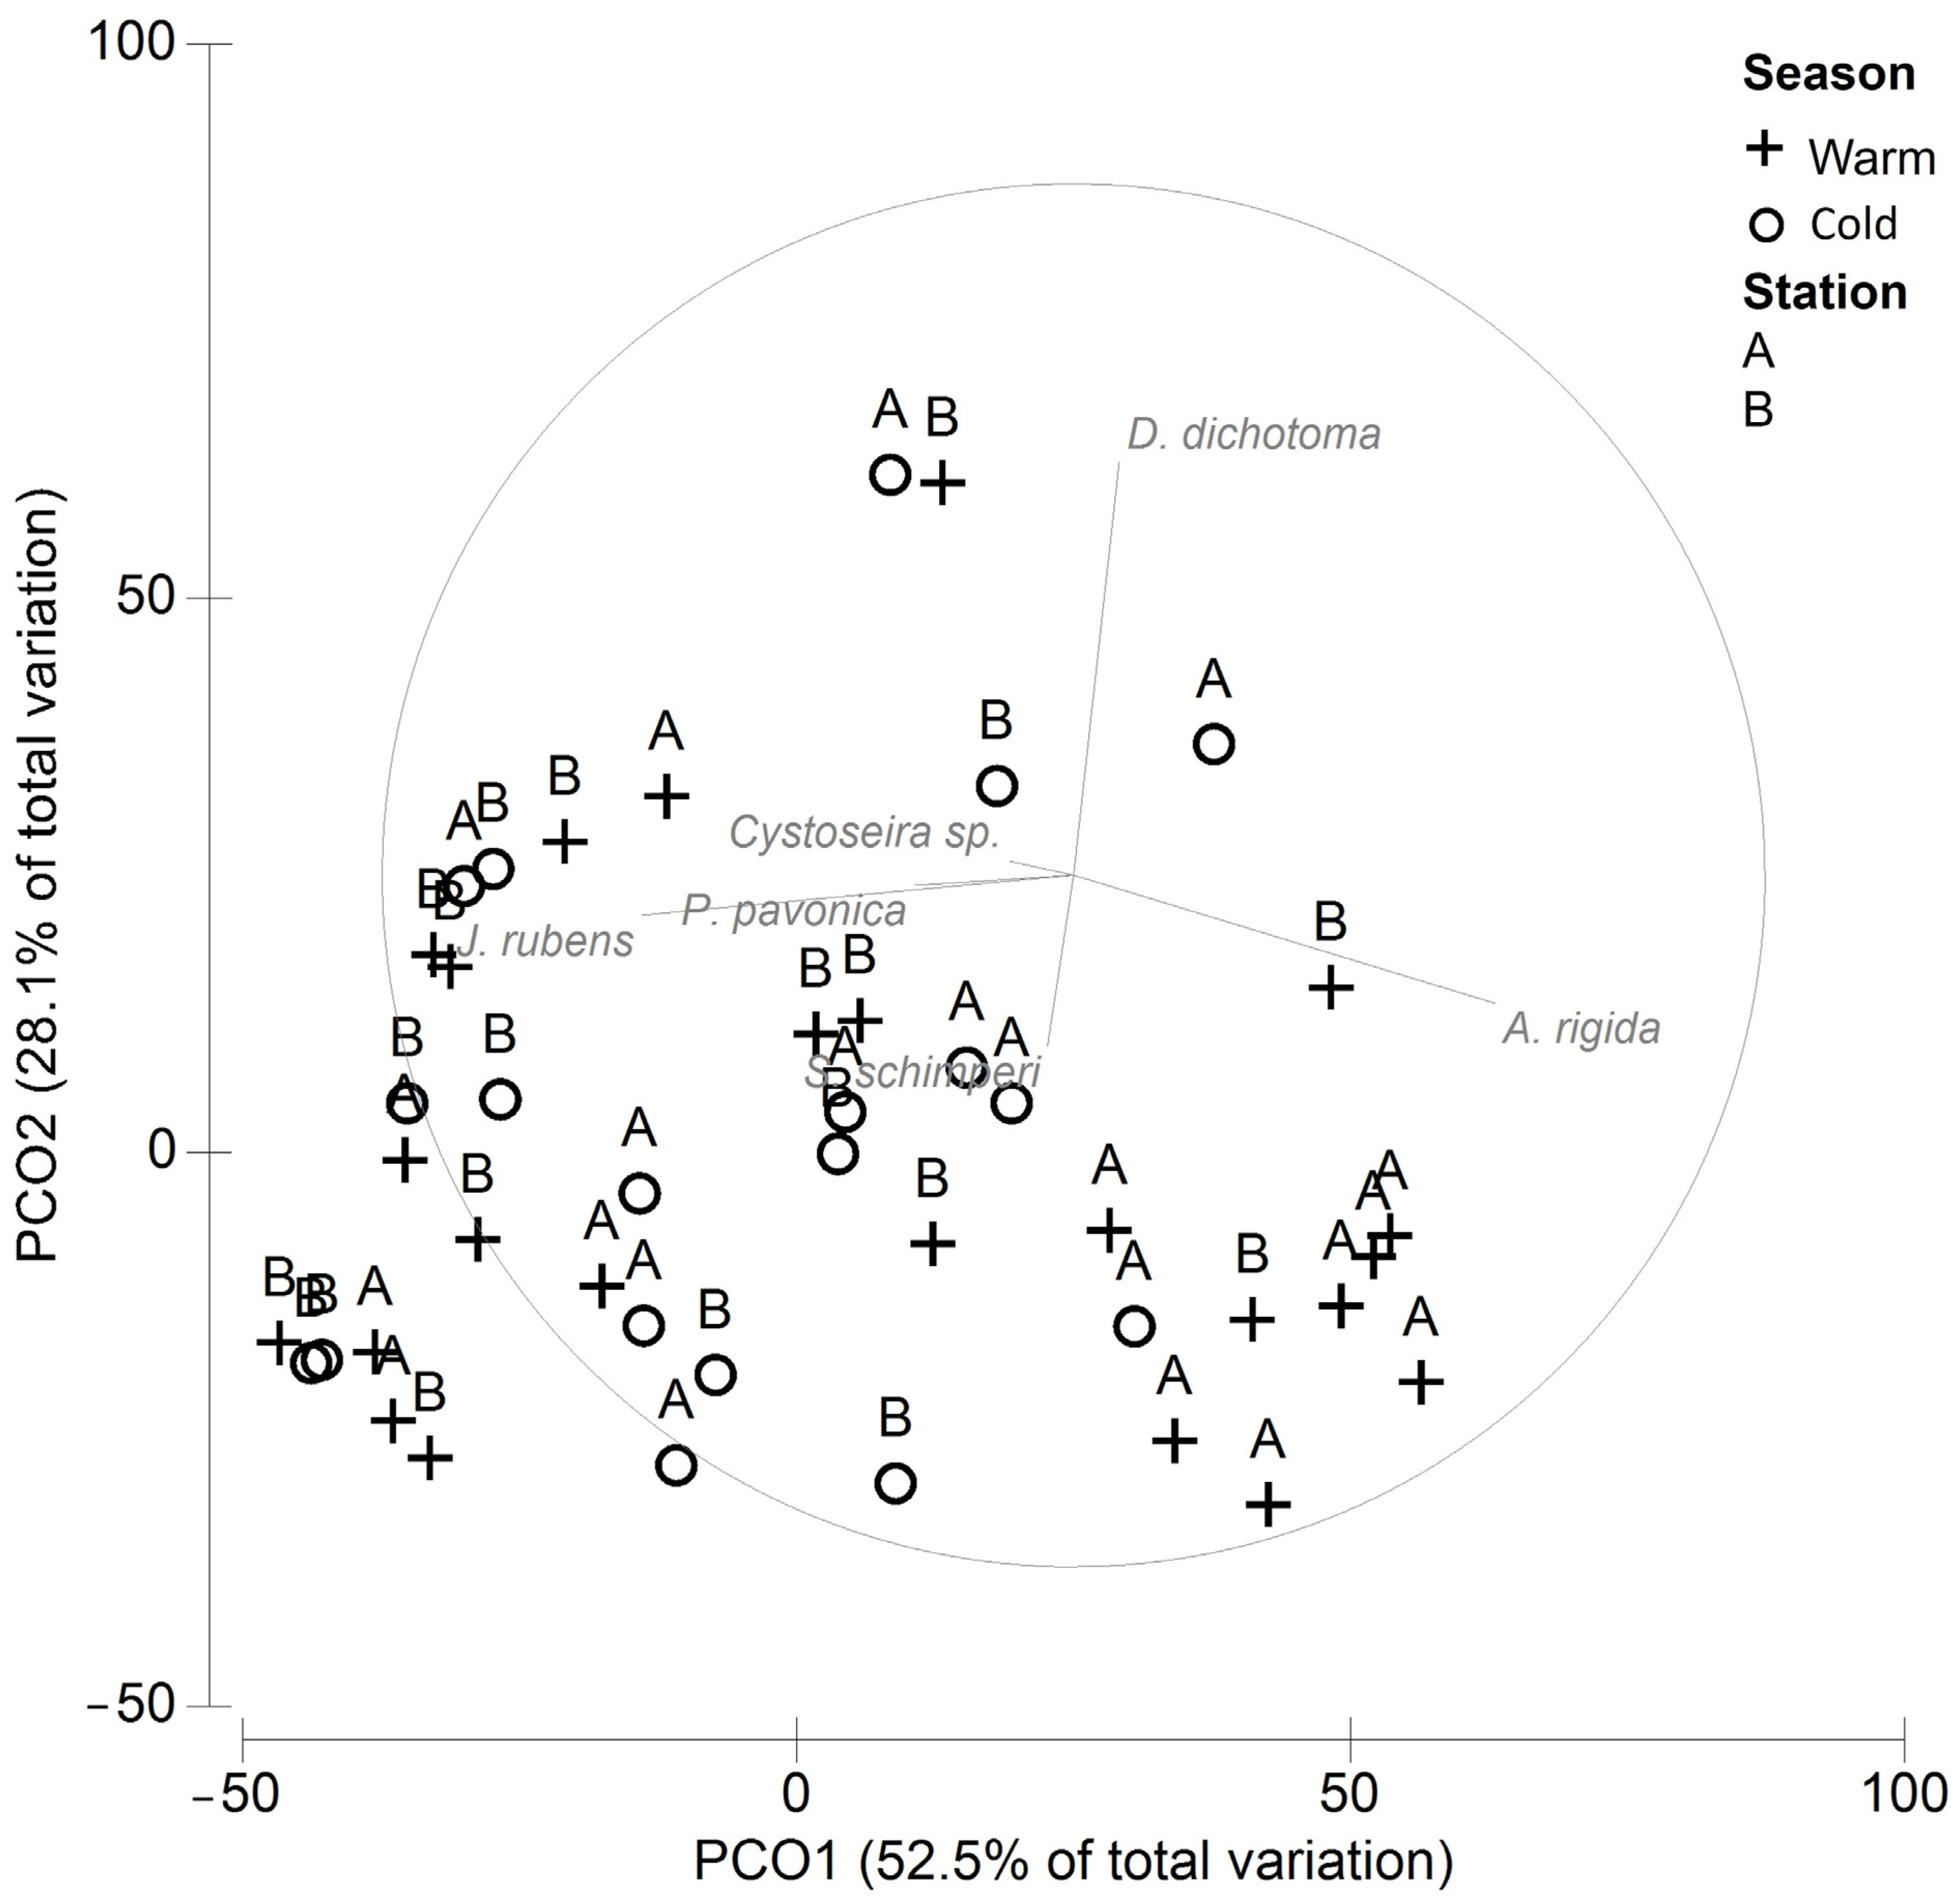
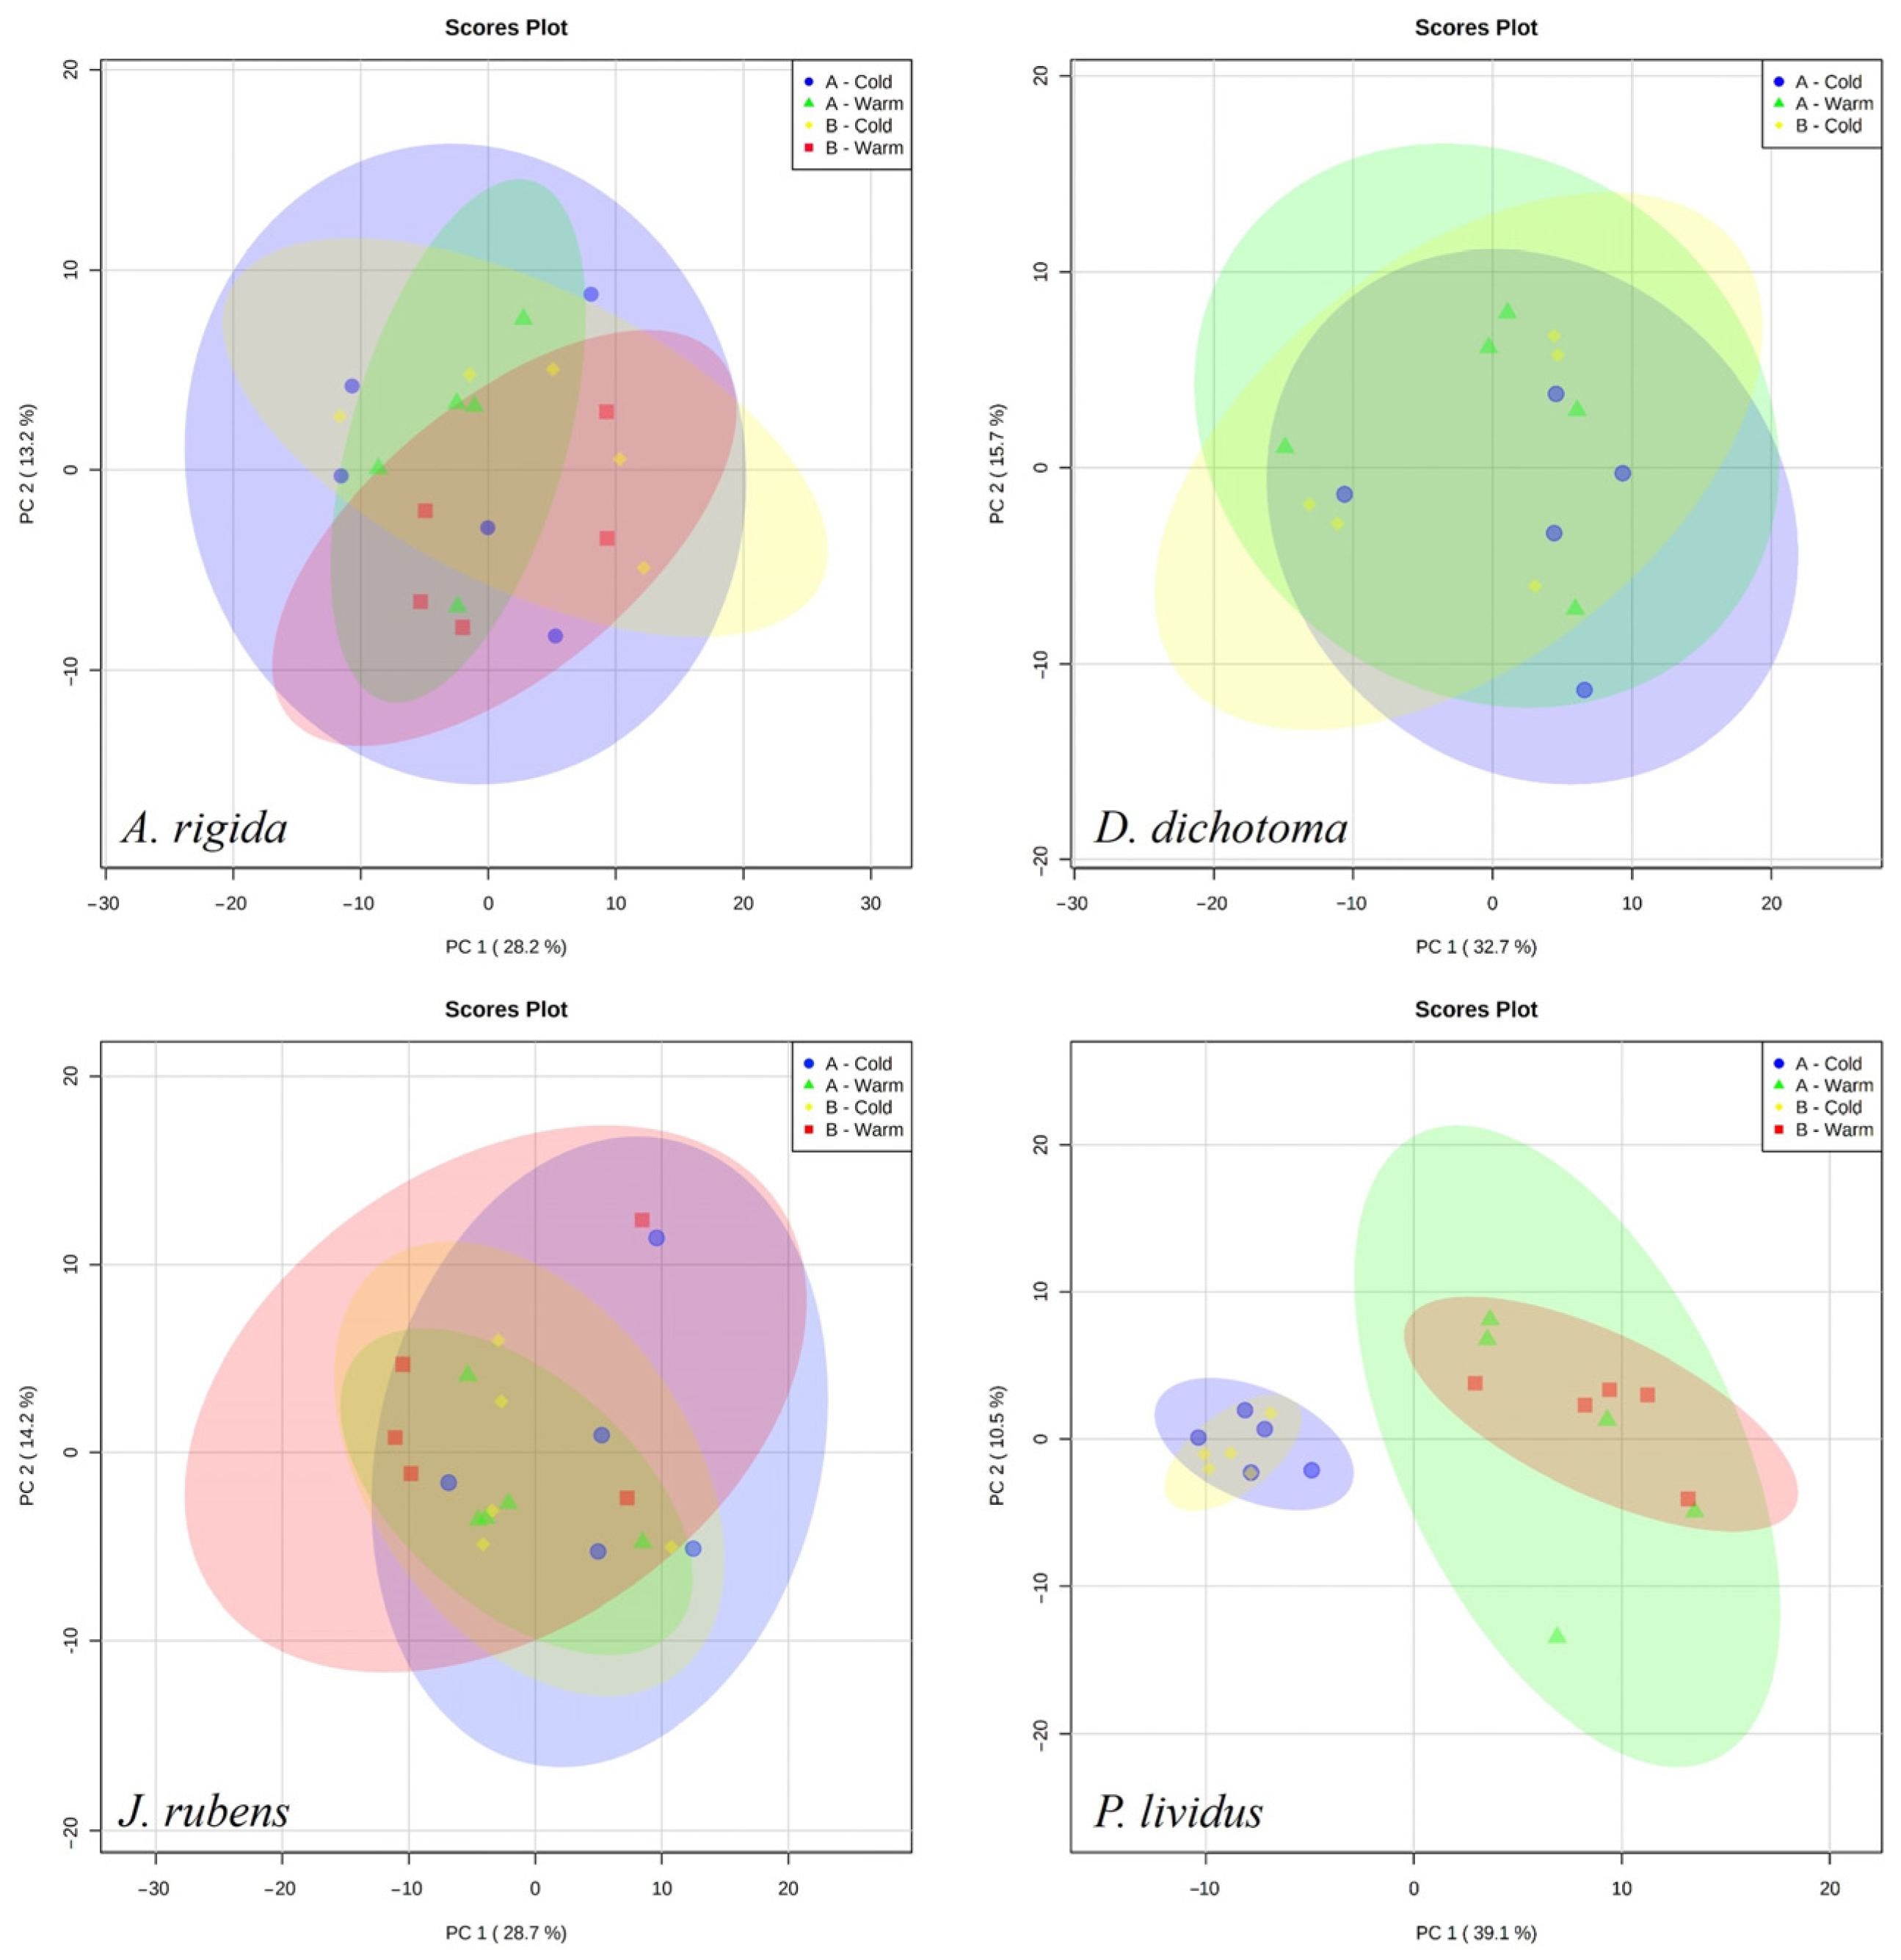
2.3. Statistical Analysis
3. Results
4. Discussion
Supplementary Materials
Author Contributions
Funding
Institutional Review Board Statement
Informed Consent Statement
Data Availability Statement
Acknowledgments
Conflicts of Interest
References
- Barrett, L.T.; Swearer, S.; Dempster, T. Impacts of marine and freshwater aquaculture on wildlife: A global meta-analysis. Rev. Aquac. 2019, 11, 1022–1044. [Google Scholar] [CrossRef]
- Tičina, V.; Katavić, I.; Grubišić, L. Marine Aquaculture Impacts on Marine Biota in Oligotrophic Environments of the Mediterranean Sea—A Review. Front. Mar. Sci. 2020, 7, 217. [Google Scholar] [CrossRef]
- Karakassis, I.; Tsapakis, M.; Hatziyanni, E.; Papadopoulou, K.-N.; Plaiti, W. Impact of cage farming of fish on the seabed in three Mediterranean coastal areas. ICES J. Mar. Sci. 2000, 57, 1462–1471. [Google Scholar] [CrossRef]
- Hargrave, B. Empirical relationships describing benthic impacts of salmon aquaculture. Aquac. Environ. Interact. 2010, 1, 33–46. [Google Scholar] [CrossRef]
- Grigorakis, K.; Rigos, G. Aquaculture effects on environmental and public welfare—The case of Mediterranean mariculture. Chemosphere 2011, 85, 899–919. [Google Scholar] [CrossRef]
- Sarà, G.; Martire, M.L.; Sanfilippo, M.; Pulicanò, G.; Cortese, G.; Mazzola, A.; Manganaro, A.; Pusceddu, A. Impacts of marine aquaculture at large spatial scales: Evidences from N and P catchment loading and phytoplankton biomass. Mar. Environ. Res. 2011, 71, 317–324. [Google Scholar] [CrossRef]
- Tsagaraki, T.; Pitta, P.; Frangoulis, C.; Petihakis, G.; Karakassis, I. Plankton response to nutrient enrichment is maximized at intermediate distances from fish farms. Mar. Ecol. Prog. Ser. 2013, 493, 31–42. [Google Scholar] [CrossRef][Green Version]
- Jansen, H.; Broch, O.; Bannister, R.; Cranford, P.; Handå, A.; Husa, V.; Jiang, Z.; Strohmeier, T.; Strand, Ø. Spatio-temporal dynamics in the dissolved nutrient waste plume from Norwegian salmon cage aquaculture. Aquac. Environ. Interact. 2018, 10, 385–399. [Google Scholar] [CrossRef]
- Pitta, P.; Apostolaki, E.; Giannoulaki, M.; Karakassis, I. Mesoscale changes in the water column in response to fish farming zones in three coastal areas in the Eastern Mediterranean Sea. Estuar. Coast. Shelf Sci. 2005, 65, 501–512. [Google Scholar] [CrossRef]
- Pitta, P.; Apostolaki, E.; Tsagaraki, T.; Tsapakis, M.; Karakassis, I. Fish Farming Effects on Chemical and Microbial Variables of the Water Column: A Spatio-temporal Study Along the Mediterranean Sea. Hydrobiologia 2006, 563, 99–108. [Google Scholar] [CrossRef]
- Machias, A.; Karakassis, I.; Giannoulaki, M.; Papadopoulou, K.; Smith, C.; Somarakis, S. Response of demersal fish communities to the presence of fish farms. Mar. Ecol. Prog. Ser. 2005, 288, 241–250. [Google Scholar] [CrossRef]
- Machias, A.; Karakassis, I.; Labropoulou, M.; Somarakis, S.; Papadopoulou, K.; Papaconstantinou, C. Changes in wild fish assemblages after the establishment of a fish farming zone in an oligotrophic marine ecosystem. Estuar. Coast. Shelf Sci. 2004, 60, 771–779. [Google Scholar] [CrossRef]
- Pitta, P.; Tsapakis, M.; Apostolaki, E.; Tsagaraki, T.; Holmer, M.; Karakassis, I. ‘Ghost nutrients’ from fish farms are transferred up the food web by phytoplankton grazers. Mar. Ecol. Prog. Ser. 2009, 374, 1–6. [Google Scholar] [CrossRef]
- Boudouresque, C.-F.; Blanfuné, A.; Pergent, G.; Pergent-Martini, C.; Perret-Boudouresque, M.; Thibaut, T. Impacts of Marine and Lagoon Aquaculture on Macrophytes in Mediterranean Benthic Ecosystems. Front. Mar. Sci. 2020, 7, 218. [Google Scholar] [CrossRef]
- Holling, C.S. Resilience and Stability of Ecological Systems. Annu. Rev. Ecol. Syst. 1973, 4, 1–23. [Google Scholar] [CrossRef]
- May, R.M. Thresholds and breakpoints in ecosystems with a multiplicity of stable states. Nature 1977, 269, 471–477. [Google Scholar] [CrossRef]
- Piazzi, L.; Bulleri, F.; Ceccherelli, G. Limpets compensate sea urchin decline and enhance the stability of rocky subtidal barrens. Mar. Environ. Res. 2016, 115, 49–55. [Google Scholar] [CrossRef]
- Terlizzi, A.; Fraschetti, S.; Guidetti, P.; Boero, F. The effects of sewage discharge on shallow hard substrate sessile assemblages. Mar. Pollut. Bull. 2002, 44, 544–550. [Google Scholar] [CrossRef]
- Worm, B.; Lotze, H.K. Effects of eutrophication, grazing, and algal blooms on rocky shores. Limnol. Oceanogr. 2006, 51, 569–579. [Google Scholar] [CrossRef]
- Worm, B.; Lotze, H.K.; Boström, C.; Engkvist, R.; Labanauskas, V.; Sommer, U. Marine diversity shift linked to interactions among grazers, nutrients and propagule banks. Mar. Ecol. Prog. Ser. 1999, 185, 309–314. [Google Scholar] [CrossRef]
- Vadas, R.L.; Beal, B.F.; Wright, W.A.; Nickl, S.; Emerson, S. Biomass and productivity of red and green algae in Cobscook Bay, Maine. Northeast. Nat. 2004, 11, 163–196. [Google Scholar] [CrossRef]
- Hemmi, A.; Mäkinen, A.; Jormalainen, V.; Honkanen, T. Responses of growth and phlorotannins in Fucus vesiculosus to nutrient enrichment and herbivory. Aquat. Ecol. 2005, 39, 201–211. [Google Scholar] [CrossRef]
- Oh, E.; Edgar, G.; Kirkpatrick, J.; Stuart-Smith, R.; Barrett, N. Broad-scale impacts of salmon farms on temperate macroalgal assemblages on rocky reefs. Mar. Pollut. Bull. 2015, 98, 201–209. [Google Scholar] [CrossRef] [PubMed]
- Fowles, A.E.; Stuart-Smith, R.D.; Hill, N.A.; Thomson, R.J.; Strain, E.M.; Alexander, T.J.; Kirkpatrick, J.; Edgar, G.J. Interactive responses of primary producers and grazers to pollution on temperate rocky reefs. Environ. Pollut. 2018, 237, 388–395. [Google Scholar] [CrossRef] [PubMed]
- Karakassis, I.; Tsapakis, M.; Hatziyanni, E. Seasonal variability in sediment profiles beneath fish farm cages in the Mediterranean. Mar. Ecol. Prog. Ser. 1998, 162, 243–252. [Google Scholar] [CrossRef]
- Pinna, S.; Piazzi, L.; Ceccherelli, G.; Castelli, A.; Costa, G.; Curini-Galletti, M.; Gianguzza, P.; Langeneck, J.; Manconi, R.; Montefalcone, M.; et al. Macroalgal forest vs sea urchin barren: Patterns of macro-zoobenthic diversity in a large-scale Mediterranean study. Mar. Environ. Res. 2020, 159, 104955. [Google Scholar] [CrossRef] [PubMed]
- Pinnegar, J.; Polunin, N.; Francour, P.; Badalamenti, F.; Chemello, R.; Harmelin-Vivien, M.-L.; Hereu, B.; Milazzo, M.; Zabala, M.; D’Anna, G.; et al. Trophic cascades in benthic marine ecosystems: Lessons for fisheries and protected-area management. Environ. Conserv. 2000, 27, 179–200. [Google Scholar] [CrossRef]
- Filbee-Dexter, K.; Scheibling, R. Sea urchin barrens as alternative stable states of collapsed kelp ecosystems. Mar. Ecol. Prog. Ser. 2014, 495, 1–25. [Google Scholar] [CrossRef]
- Ruiz, J.; Romero, J. Effects of in situ experimental shading on the Mediterranean seagrass Posidonia oceanica. Mar. Ecol. Prog. Ser. 2001, 215, 107–120. [Google Scholar] [CrossRef]
- Prado, P.; Alcoverro, T.; Romero, J. Seasonal response of Posidonia oceanica epiphyte assemblages to nutrient increase. Mar. Ecol. Prog. Ser. 2008, 359, 89–98. [Google Scholar] [CrossRef]
- Balata, D.; Piazzi, L.; Nesti, U.; Bulleri, F.; Bertocci, I. Effects of enhanced loads of nutrients on epiphytes on leaves and rhizomes of Posidonia oceanica. J. Sea Res. 2010, 63, 173–179. [Google Scholar] [CrossRef]
- Rountos, K.J.; Peterson, B.J.; Karakassis, I. Indirect effects of fish cage aquaculture on shallow Posidonia oceanica seagrass patches in coastal Greek waters. Aquac. Environ. Interact. 2012, 2, 105–115. [Google Scholar] [CrossRef]
- Kušpilić, G.; Tičina, V.; Matijević, S.; Skejić, S.; Antolić, B.; Grubelić, I.; Tudor, M. Impact of fish farming on marine ecosystems-Croatian experiences. In Impact of Mariculture on Coastal Ecosystems: CIESM Workshop Monographs; CIESM: Lisboa, Portugal, 2007; Volume 32, pp. 29–34. [Google Scholar]
- Ballesteros, E.; Torras, X.; Pinedo, S.; García, M.; Mangialajo, L.; de Torres, M. A new methodology based on littoral community cartography dominated by macroalgae for the implementation of the European Water Framework Directive. Mar. Pollut. Bull. 2007, 55, 172–180. [Google Scholar] [CrossRef] [PubMed]
- Panayotidis, P.; Montesanto, B.; Orfanidis, S. Use of low-budget monitoring of macroalgae to implement the European Water Framework Directive. J. Appl. Phycol. 2004, 16, 49–59. [Google Scholar] [CrossRef]
- Arévalo, R.; Pinedo, S.; Ballesteros, E. Changes in the composition and structure of Mediterranean rocky-shore communities following a gradient of nutrient enrichment: Descriptive study and test of proposed methods to assess water quality regarding macroalgae. Mar. Pollut. Bull. 2007, 55, 104–113. [Google Scholar] [CrossRef] [PubMed]
- Pinedo, S.; Arévalo, R.; Ballesteros, E. Seasonal dynamics of upper sublittoral assemblages on Mediterranean rocky shores along a eutrophication gradient. Estuar. Coast. Shelf Sci. 2015, 161, 93–101. [Google Scholar] [CrossRef]
- Eklöf, J.; de la Torre-Castro, M.; Gullström, M.; Uku, J.; Muthiga, N.; Lyimo, T.; Bandeira, S. Sea urchin overgrazing of seagrasses: A review of current knowledge on causes, consequences, and management. Estuar. Coast. Shelf Sci. 2008, 79, 569–580. [Google Scholar] [CrossRef]
- Suskiewicz, T.S.; Johnson, L.E. Consumption rates of a key marine herbivore: A review of the extrinsic and intrinsic control of feeding in the green sea urchin. Mar. Biol. 2017, 164, 131. [Google Scholar] [CrossRef]
- Romero, L. Physiological stress in ecology: Lessons from biomedical research. Trends Ecol. Evol. 2004, 19, 249–255. [Google Scholar] [CrossRef]
- Nylund, G.M.; Weinberger, F.; Rempt, M.; Pohnert, G. Metabolomic Assessment of Induced and Activated Chemical Defence in the Invasive Red Alga Gracilaria vermiculophylla. PLoS ONE 2011, 6, e29359. [Google Scholar] [CrossRef]
- Rempt, M.; Weinberger, F.; Grosser, K.; Pohnert, G. Conserved and species-specific oxylipin pathways in the wound-activated chemical defense of the noninvasive red alga Gracilaria chilensis and the invasive Gracilaria vermiculophylla. Beilstein J. Org. Chem. 2012, 8, 283–289. [Google Scholar] [CrossRef] [PubMed]
- Greff, S.; Aires, T.; Serrão, E.A.; Engelen, A.H.; Thomas, O.P.; Pérez, T. The interaction between the proliferating macroalga Asparagopsis taxiformis and the coral Astroides calycularis induces changes in microbiome and metabolomic fingerprints. Sci. Rep. 2017, 7, srep42625. [Google Scholar] [CrossRef] [PubMed]
- Hasler-Sheetal, H.; Castorani, M.C.N.; Glud, R.N.; Canfield, D.E.; Holmer, M. Metabolomics Reveals Cryptic Interactive Effects of Species Interactions and Environmental Stress on Nitrogen and Sulfur Metabolism in Seagrass. Environ. Sci. Technol. 2016, 50, 11602–11609. [Google Scholar] [CrossRef] [PubMed]
- de Kock, W.; Hasler-Sheetal, H.; Holmer, M.; Tsapakis, M.; Apostolaki, E.T. Metabolomics and traditional indicators unveil stress of a seagrass (Cymodocea nodosa) meadow at intermediate distance from a fish farm. Ecol. Indic. 2020, 109, 105765. [Google Scholar] [CrossRef]
- Neofitou, N.; Klaoudatos, S. Effect of fish farming on the water column nutrient concentration in a semi-enclosed gulf of the Eastern Mediterranean. Aquac. Res. 2008, 39, 482–490. [Google Scholar] [CrossRef]
- Tomassetti, P.; Gennaro, P.; Lattanzi, L.; Mercatali, I.; Persia, E.; Vani, D.; Porrello, S. Benthic community response to sediment organic enrichment by Mediterranean fish farms: Case studies. Aquaculture 2016, 450, 262–272. [Google Scholar] [CrossRef]
- Tsiaras, K.; Tsapakis, M.; Gkanassos, A.; Kalantzi, I.; Petihakis, G.; Triantafyllou, G. Modelling the impact of finfish aquaculture waste on the environmental status in an Eastern Mediterranean Allocated Ζone for Aquaculture. Cont. Shelf Res. 2022, 234, 104647. [Google Scholar] [CrossRef]
- Chatzigeorgiou, G.; Dailianis, T.; Faulwetter, S.; Pettas, M.; Arvanitidis, C. MANOSS—A manually operated suction sampler for hard bottom benthos. Transit. Waters Bull. 2013, 6, 42–49. [Google Scholar]
- Duran, S.; Palacín, C.; Becerro, M.A.; Turon, X.; Giribet, G. Genetic diversity and population structure of the commercially harvested sea urchin Paracentrotus lividus (Echinodermata, Echinoidea). Mol. Ecol. 2004, 13, 3317–3328. [Google Scholar] [CrossRef]
- Calderon, I.L.; Pita, L.; Brusciotti, S.; Palacín, C.; Turon, X. Time and space: Genetic structure of the cohorts of the common sea urchin Paracentrotus lividus in Western Mediterranean. Mar. Biol. 2012, 159, 187–197. [Google Scholar] [CrossRef]
- Trygonis, V.; Sini, M. photoQuad: A dedicated seabed image processing software, and a comparative error analysis of four photoquadrat methods. J. Exp. Mar. Biol. Ecol. 2012, 424–425, 99–108. [Google Scholar] [CrossRef]
- Clarke, K.; Green, R. Statistical design and analysis for a ‘biological effects’ study. Mar. Ecol. Prog. Ser. 1988, 46, 213–226. [Google Scholar] [CrossRef]
- Clarke, K.R. Non-parametric multivariate analyses of changes in community structure. Aust. J. Ecol. 1993, 18, 117–143. [Google Scholar] [CrossRef]
- Clarke, K.R.; Gorley, R.N. PRIMER v6: User Manual/Tutorial (Plymouth Routines in Multivariate Ecological Research); PRIMER-E, Plymouth Marine Laboratory: Plymouth, UK, 2006. [Google Scholar]
- Hammer, Ø.; Harper, D.A.T.; Ryan, P.D. PAST-Palaeontological Statistics; University of Oslo: Oslo, Norway, 2001; Available online: https://www.nhm.uio.no/english/research/resources/past/ (accessed on 26 December 2022).
- Chong, J.; Soufan, O.; Li, C.; Caraus, I.; Li, S.; Bourque, G.; Wishart, D.S.; Xia, J. MetaboAnalyst 4.0: Towards more transparent and integrative metabolomics analysis. Nucleic Acids Res. 2018, 46, W486–W494. [Google Scholar] [CrossRef] [PubMed]
- Pavlidis, P.; Noble, W.S. Analysis of strain and regional variation in gene expression in mouse brain. Genome Biol. 2001, 2, RESEARCH0042. [Google Scholar] [CrossRef] [PubMed]
- Verges, A.; Alcoverro, T.; Ballesteros, E. Role of fish herbivory in structuring the vertical distribution of canopy algae Cystoseira spp. in the Mediterranean Sea. Mar. Ecol. Prog. Ser. 2009, 375, 1–11. [Google Scholar] [CrossRef]
- Gianni, F.; Bartolini, F.; Airoldi, L.; Ballesteros, E.; Francour, P.; Guidetti, P.; Meinesz, A.; Thibaut, T.; Mangialajo, L. Conservation and restoration of marine forests in the Mediterranean Sea and the potential role of Marine Protected Areas. Adv. Oceanogr. Limnol. 2013, 4, 83–101. [Google Scholar] [CrossRef]
- Shears, N.T.; Babcock, R. Marine reserves demonstrate top-down control of community structure on temperate reefs. Oecologia 2002, 132, 131–142. [Google Scholar] [CrossRef]
- Estes, J.A.; Terborgh, J.; Brashares, J.S.; Power, M.E.; Berger, J.; Bond, W.J.; Carpenter, S.R.; Essington, T.E.; Holt, R.D.; Jackson, J.B.C.; et al. Trophic Downgrading of Planet Earth. Science 2011, 333, 301–306. [Google Scholar] [CrossRef]
- Agnetta, D.; Badalamenti, F.; Ceccherelli, G.; Di Trapani, F.; Bonaviri, C.; Gianguzza, P. Role of two co-occurring Mediterranean sea urchins in the formation of barren from Cystoseira canopy. Estuar. Coast. Shelf Sci. 2015, 152, 73–77. [Google Scholar] [CrossRef]
- Tsirintanis, K.; Sini, M.; Doumas, O.; Trygonis, V.; Katsanevakis, S. Assessment of grazing effects on phytobenthic community structure at shallow rocky reefs: An experimental field study in the North Aegean Sea. J. Exp. Mar. Biol. Ecol. 2018, 503, 31–40. [Google Scholar] [CrossRef]
- Airoldi, L.; Virgilio, M. Responses of turf-forming algae to spatial variations in the deposition of sediments. Mar. Ecol. Prog. Ser. 1998, 165, 271–282. [Google Scholar] [CrossRef]
- Balata, D.; Piazzi, L.; Bulleri, F. Sediment deposition dampens positive effects of substratum complexity on the diversity of macroalgal assemblages. J. Exp. Mar. Biol. Ecol. 2015, 467, 45–51. [Google Scholar] [CrossRef]
- Piazzi, L.; Ceccherelli, G. Concomitance of oligotrophy and low grazing pressure is essential for the resilience of Mediterranean subtidal forests. Mar. Pollut. Bull. 2017, 123, 197–204. [Google Scholar] [CrossRef] [PubMed]
- Jiménez-Ramos, R.; Egea, L.G.; Vergara, J.J.; Brun, F.G. Nutrient load and epiphytes are drivers of increased herbivory in seagrass communities. Mar. Ecol. Prog. Ser. 2018, 599, 49–64. [Google Scholar] [CrossRef]
- Camps-Castellà, J.; Romero, J.; Prado, P. Trophic plasticity in the sea urchin Paracentrotus lividus, as a function of resource availability and habitat features. Mar. Ecol. Prog. Ser. 2020, 637, 71–85. [Google Scholar] [CrossRef]
- Galil, B.; Marchini, A.; Occhipinti-Ambrogi, A.; Ojaveer, H. The enlargement of the Suez Canal—Erythraean introductions and management challenges. Manag. Biol. Invasions 2017, 8, 141–152. [Google Scholar] [CrossRef]
- Boudouresque, C.F.; Verlaque, M. Biological pollution in the Mediterranean Sea: Invasive versus introduced macrophytes. Mar. Pollut. Bull. 2002, 44, 32–38. [Google Scholar] [CrossRef]
- Rilov, G.; Peleg, O.; Yeruham, E.; Garval, T.V.; Vichik, A.; Raveh, O. Alien turf: Overfishing, overgrazing and invader domination in south-eastern Levant reef ecosystems. Aquat. Conserv. Mar. Freshw. Ecosyst. 2018, 28, 351–369. [Google Scholar] [CrossRef]
- Evagelopoulos, A.; Poursanidis, D.; Papazisi, E.; Gerovasileiou, V.; Katsiaras, N.; Koutsoubas, D. Records of alien marine species of Indo-Pacific origin at Sigri Bay (Lesvos Island, north-eastern Aegean Sea). Mar. Biodivers. Rec. 2015, 8, E35. [Google Scholar] [CrossRef]
- Bianchi, C.N.; Corsini-Foka, M.; Morri, C.; Zenetos, A. Thirty years after—Dramatic change in the coastal marine habitats of Kos Island (Greece), 1981–2013. Mediterr. Mar. Sci. 2014, 15, 482. [Google Scholar] [CrossRef]
- Jauni, M.; Gripenberg, S.; Ramula, S. Non-native plant species benefit from disturbance: A meta-analysis. Oikos 2015, 124, 122–129. [Google Scholar] [CrossRef]
- Tomas, F.; Box, A.; Terrados, J. Effects of invasive seaweeds on feeding preference and performance of a keystone Mediterranean herbivore. Biol. Invasions 2011, 13, 1559–1570. [Google Scholar] [CrossRef]
- Green, A.J. Mass/length residuals: Measures of body condition or generators of spurious results? Ecology 2001, 82, 1473–1483. [Google Scholar] [CrossRef]
- Harrold, C.; Reed, D.C. Food Availability, Sea Urchin Grazing, and Kelp Forest Community Structure. Ecology 1985, 66, 1160–1169. [Google Scholar] [CrossRef]
- Vadas, R.; Beal, B.; Dowling, T.; Fegley, J. Experimental field tests of natural algal diets on gonad index and quality in the green sea urchin, Strongylocentrotus droebachiensis: A case for rapid summer production in post-spawned animals. Aquaculture 2000, 182, 115–135. [Google Scholar] [CrossRef]
- Liu, D.; Keesing, J.K.; Xing, Q.; Shi, P. World’s largest macroalgal bloom caused by expansion of seaweed aquaculture in China. Mar. Pollut. Bull. 2009, 58, 888–895. [Google Scholar] [CrossRef]
- Powley, H.R.; Krom, M.D.; Van Cappellen, P. Understanding the unique biogeochemistry of the Mediterranean Sea: Insights from a coupled phosphorus and nitrogen model. Glob. Biogeochem. Cycles 2017, 31, 1010–1031. [Google Scholar] [CrossRef]
- Dalsgaard, T.; Krause-Jensen, D. Monitoring nutrient release from fish farms with macroalgal and phytoplankton bioassays. Aquaculture 2006, 256, 302–310. [Google Scholar] [CrossRef]
- Ruíz, J.M.; Pérez, M.; Romero, J.; Tomas, F. The importance of herbivory in the decline of a seagrass (Posidonia oceanica) meadow near a fish farm: An experimental approach. Bot. Mar. 2009, 52, 449–458. [Google Scholar] [CrossRef]
- Boada, J.; Arthur, R.; Alonso, D.; Pagès, J.F.; Pessarrodona, A.; Oliva, S.; Ceccherelli, G.; Piazzi, L.; Romero, J.; Alcoverro, T. Immanent conditions determine imminent collapses: Nutrient regimes define the resilience of macroalgal communities. Proc. R. Soc. B Boil. Sci. 2017, 284, 20162814. [Google Scholar] [CrossRef]
- Wang, X.; Broch, O.J.; Forbord, S.; Handå, A.; Skjermo, J.; Reitan, K.I.; Vadstein, O.; Olsen, Y. Assimilation of inorganic nutrients from salmon (Salmo salar) farming by the macroalgae (Saccharina latissima) in an exposed coastal environment: Implications for integrated multi-trophic aquaculture. J. Appl. Phycol. 2014, 26, 1869–1878. [Google Scholar] [CrossRef]
- Vizzini, S.; Savona, B.; Caruso, M.; Savona, A.; Mazzola, A. Analysis of stable carbon and nitrogen isotopes as a tool for assessing the environmental impact of aquaculture: A case study from the western Mediterranean. Aquac. Int. 2005, 13, 157–165. [Google Scholar] [CrossRef]
- García-Sanz, T.; Ruiz, J.; Pérez, M.; Ruiz, M. Assessment of dissolved nutrients dispersal derived from offshore fish-farm using nitrogen stable isotope ratios (δ15N) in macroalgal bioassays. Estuar. Coast. Shelf Sci. 2011, 91, 361–370. [Google Scholar] [CrossRef]
- Gartner, A.; Lavery, P.; Smit, A. Use of d15N signatures of different functional forms of macroalgae and filter-feeders to reveal temporal and spatial patterns in sewage dispersal. Mar. Ecol. Prog. Ser. 2002, 235, 63–73. [Google Scholar] [CrossRef]
- Deutsch, B.; Voss, M. Anthropogenic nitrogen input traced by means of δ15N values in macroalgae: Results from in-situ incubation experiments. Sci. Total Environ. 2006, 366, 799–808. [Google Scholar] [CrossRef]
- Bajhaiya, A.K.; Dean, A.P.; Driver, T.; Trivedi, D.K.; Rattray, N.J.W.; Allwood, J.W.; Goodacre, R.; Pittman, J.K. High-throughput metabolic screening of microalgae genetic variation in response to nutrient limitation. Metabolomics 2016, 12, 9. [Google Scholar] [CrossRef]
- Kokabi, K.; Gorelova, O.; Ismagulova, T.; Itkin, M.; Malitsky, S.; Boussiba, S.; Solovchenko, A.; Khozin-Goldberg, I. Metabolomic foundation for differential responses of lipid metabolism to nitrogen and phosphorus deprivation in an arachidonic acid-producing green microalga. Plant Sci. 2019, 283, 95–115. [Google Scholar] [CrossRef]
- Agregán, R.; Munekata, P.E.; Franco, D.; Dominguez, R.; Carballo, J.; Lorenzo, J.M. Phenolic compounds from three brown seaweed species using LC-DAD–ESI-MS/MS. Food Res. Int. 2017, 99, 979–985. [Google Scholar] [CrossRef]
- Ibrahim, A.M.; Abdel-Tawab, H. Cystoseira barbata marine algae have a molluscicidal activity against Biomphalaria alexandrina snails supported by scanning electron microscopy, hematological and histopathological alterations, and larvicidal activity against the infective stages of Schistosoma mansoni. Biologia 2020, 75, 1945–1954. [Google Scholar] [CrossRef]
- Dela, G.; Or, E.; Ovadia, R.; Nissim-Levi, A.; Weiss, D.; Oren-Shamir, M. Changes in anthocyanin concentration and composition in ‘Jaguar’ rose flowers due to transient high-temperature conditions. Plant Sci. 2003, 164, 333–340. [Google Scholar] [CrossRef]
- Robles, C.; Greff, S.; Pasqualini, V.; Garzino, S.; Bousquet-Mélou, A.; Fernandez, C.; Korboulewsky, N.; Bonin, G. Phenols and Flavonoids in Aleppo Pine Needles as Bioindicators of Air Pollution. J. Environ. Qual. 2003, 32, 2265–2271. [Google Scholar] [CrossRef]
- Cannac, M.; Ferrat, L.; Pergent-Martini, C.; Pergent, G.; Pasqualini, V. Effects of fish farming on flavonoids in Posidonia oceanica. Sci. Total Environ. 2006, 370, 91–98. [Google Scholar] [CrossRef]
- Yan, J.; Wang, B.; Zhong, Y.; Yao, L.; Cheng, L.; Wu, T. The soybean R2R3 MYB transcription factor GmMYB100 negatively regulates plant flavonoid biosynthesis. Plant Mol. Biol. 2015, 89, 35–48. [Google Scholar] [CrossRef]
- Steinberg, P.D. Effects of quantitative and qualitative variation in phenolic compounds on feeding in three species of marine invertebrate herbivores. J. Exp. Mar. Biol. Ecol. 1988, 120, 221–237. [Google Scholar] [CrossRef]
- Hay, M.E.; Fenical, W. MARINE PLANT-HERBIVORE INTERACTIONS: The Ecology of Chemical Defense. Annu. Rev. Ecol. Syst. 1988, 19, 111–145. [Google Scholar] [CrossRef]
- Van Alstyne, K.L.; Whitman, S.L.; Ehlig, J.M. Differences in herbivore preferences, phlorotannin production, and nutritional quality between juvenile and adult tissues from marine brown algae. Mar. Biol. 2001, 139, 201–210. [Google Scholar] [CrossRef]
- Steele, L.; Valentine, J. Idiosyncratic responses of seagrass phenolic production following sea urchin grazing. Mar. Ecol. Prog. Ser. 2012, 466, 81–92. [Google Scholar] [CrossRef]
- Riaz, U.; Kharal, M.A.; Murtaza, G.; Zaman, Q.U.; Javaid, S.; Malik, H.A.; Aziz, H.; Abbas, Z. Prospective Roles and Mechanisms of Caffeic Acid in Counter Plant Stress: A Mini Review. Pak. J. Agric. Res. 2019, 32, 8–19. [Google Scholar] [CrossRef]
- Tomás-Barberán, F.A.; Clifford, M.N. Dietary hydroxybenzoic acid derivatives: Nature, occurrence and dietary burden. J. Sci. Food Agric. 2000, 8, 1024–1032. [Google Scholar] [CrossRef]
- Kamaya, Y.; Tsuboi, S.; Takada, T.; Suzuki, K. Growth Stimulation and Inhibition Effects of 4-Hydroxybenzoic Acid and Some Related Compounds on the Freshwater Green Alga Pseudokirchneriella subcapitata. Arch. Environ. Contam. Toxicol. 2006, 51, 537–541. [Google Scholar] [CrossRef]
- Picone, P.; Nuzzo, D.; Di Carlo, M. Ferulic Acid: A Natural Antioxidant Against Oxidative Stress Induced by Oligomeric A-beta on Sea Urchin Embryo. Biol. Bull. 2013, 224, 18–28. [Google Scholar] [CrossRef]
- Smith, J.L.; Boyer, G.L.; Zimba, P.V. A review of cyanobacterial odorous and bioactive metabolites: Impacts and management alternatives in aquaculture. Aquaculture 2008, 280, 5–20. [Google Scholar] [CrossRef]
- Erb, M.; Kliebenstein, D.J. Plant Secondary Metabolites as Defenses, Regulators, and Primary Metabolites: The Blurred Functional Trichotomy. Plant Physiol. 2020, 184, 39–52. [Google Scholar] [CrossRef]
- Arafa, S.; Chouaibi, M.; Sadok, S.; El Abed, A. The Influence of Season on the Gonad Index and Biochemical Composition of the Sea Urchin Paracentrotus lividus from the Golf of Tunis. Sci. World J. 2012, 2012, 815935. [Google Scholar] [CrossRef]
- Siliani, S.; Melis, R.; Loi, B.; Guala, I.; Baroli, M.; Sanna, R.; Uzzau, S.; Roggio, T.; Addis, M.F.; Anedda, R. Influence of seasonal and environmental patterns on the lipid content and fatty acid profiles in gonads of the edible sea urchin Paracentrotus lividus from Sardinia. Mar. Environ. Res. 2016, 113, 124–133. [Google Scholar] [CrossRef]
- Goel, M.; Mushegian, A. Intermediary metabolism in sea urchin: The first inferences from the genome sequence. Dev. Biol. 2006, 300, 282–292. [Google Scholar] [CrossRef]
- Mol, S.; Baygar, T.; Varlik, C.; Tosun, Ş.Y. Seasonal variations in yield, fatty acids, amino acids and proximate compositions of sea urchin (Paracentrotus lividus) Roe. J. Food Drug Anal. 2008, 16, 5. [Google Scholar] [CrossRef]
- De Quirós, A.R.-B.; López-Hernández, J.; González-Castro, M.; de la Cruz-García, C.; Simal-Lozano, J. Comparison of volatile components in fresh and canned sea urchin ( Paracentrotus lividus, Lamarck ) gonads by GC-MS using dynamic headspace sampling and microwave desorption. Eur. Food Res. Technol. 2001, 212, 643–647. [Google Scholar] [CrossRef]
- Dayananda, C.; Sarada, R.; Kumar, V.; Ravishankar, G.A. Isolation and characterization of hydrocarbon producing green alga Botryococcus braunii from Indian freshwater bodies. Electron. J. Biotechnol. 2007, 10, 78–91. [Google Scholar] [CrossRef]
- Dufourc, E.J. The role of phytosterols in plant adaptation to temperature. Plant Signal. Behav. 2008, 3, 133–134. [Google Scholar] [CrossRef] [PubMed]
- Rani, A.; Kumar Vats, S.; Sharma, M.; Kumar, S. Catechin promotes growth of Arabidopsis thaliana with con-comitant changes in vascular system, photosynthesis and hormone content. Biol. Plant. 2011, 55, 779–782. [Google Scholar] [CrossRef]
- Jishma, P.; Hussain, N.; Chellappan, R.; Rajendran, R.; Mathew, J.; Radhakrishnan, E.K. Strain-specific variation in plant growth promoting volatile organic compounds production by five different Pseudomonas spp. as confirmed by response of Vigna radiata seedlings. J. Appl. Microbiol. 2017, 123, 204–216. [Google Scholar] [CrossRef] [PubMed]


| Species | Station | Period | Cover (%) |
|---|---|---|---|
| D. dichotoma | A | Warm | 8.67 ± 6.65 |
| Cold | 15.54 ± 12.95 | ||
| B | Warm | 11.01 ± 3.20 | |
| Cold | 17.84 ± 8.23 | ||
| J. rubens | A | Warm | 29.68 ± 14.37 |
| Cold | 16.49 ± 10.51 | ||
| B | Warm | 31.89 ± 16.72 | |
| Cold | 20.67 ± 8.81 | ||
| A. rigida | A | Warm | 21.89 ± 15.17 |
| Cold | 25.66 ± 23.28 | ||
| B | Warm | 11.95 ± 8.04 | |
| Cold | 9.13 ± 4.34 | ||
| Cystoseira sp. | A | Warm | 0.00 ± 0.00 |
| Cold | 0.40 ± 0.00 | ||
| B | Warm | 14.97 ± 9.89 | |
| Cold | 0.00 ± 0.00 | ||
| S. schimperi | A | Warm | 10.49 ± 4.81 |
| Cold | 20.49 ± 16.51 | ||
| B | Warm | 8.23 ± 7.52 | |
| Cold | 0.00 ± 0.00 | ||
| P. pavonica | A | Warm | 1.26 ± 0.62 |
| Cold | 0.68 ± 0.19 | ||
| B | Warm | 1.09 ± 1.49 | |
| Cold | 0.00 ± 0.00 |
| Station A | Station B | |||||
|---|---|---|---|---|---|---|
| Species | Av.Cover | Av.Cover | Av.Diss | Diss/SD | Contrib% | Cum.% |
| Amphiroa rigida | 38.51 | 16.72 | 19.87 | 1.25 | 33.01 | 33.01 |
| Jania rubens | 32.67 | 39.16 | 19.27 | 1.26 | 32.01 | 65.02 |
| Dictyota dichotoma | 19.16 | 20.89 | 13.11 | 1.30 | 21.78 | 86.8 |
| Stypopodium schimperi | 10.33 | 1.71 | 5.83 | 0.79 | 9.68 | 96.48 |
| Species | Station | Period | Density (ind. m−2) | Biomass (g m−2) | Condition Index |
|---|---|---|---|---|---|
| P. lividus | A | Warm | 0.88 ± 0.30 Aa | 5.52 ± 2.73 Aa | 0.21 ± 0.09 Aa |
| Cold | 0.42 ± 0.22 Ab | 2.89 ± 2.02 Ab | 0.22 ± 0.15 Aa | ||
| B | Warm | 1.04 ± 0.55 Aa | 5.62 ± 3.44 Aa | 0.18 ± 0.09 Ba | |
| Cold | 0.45 ± 0.22 Ab | 1.96 ± 1.09 Ab | 0.15 ± 0.07 Ba |
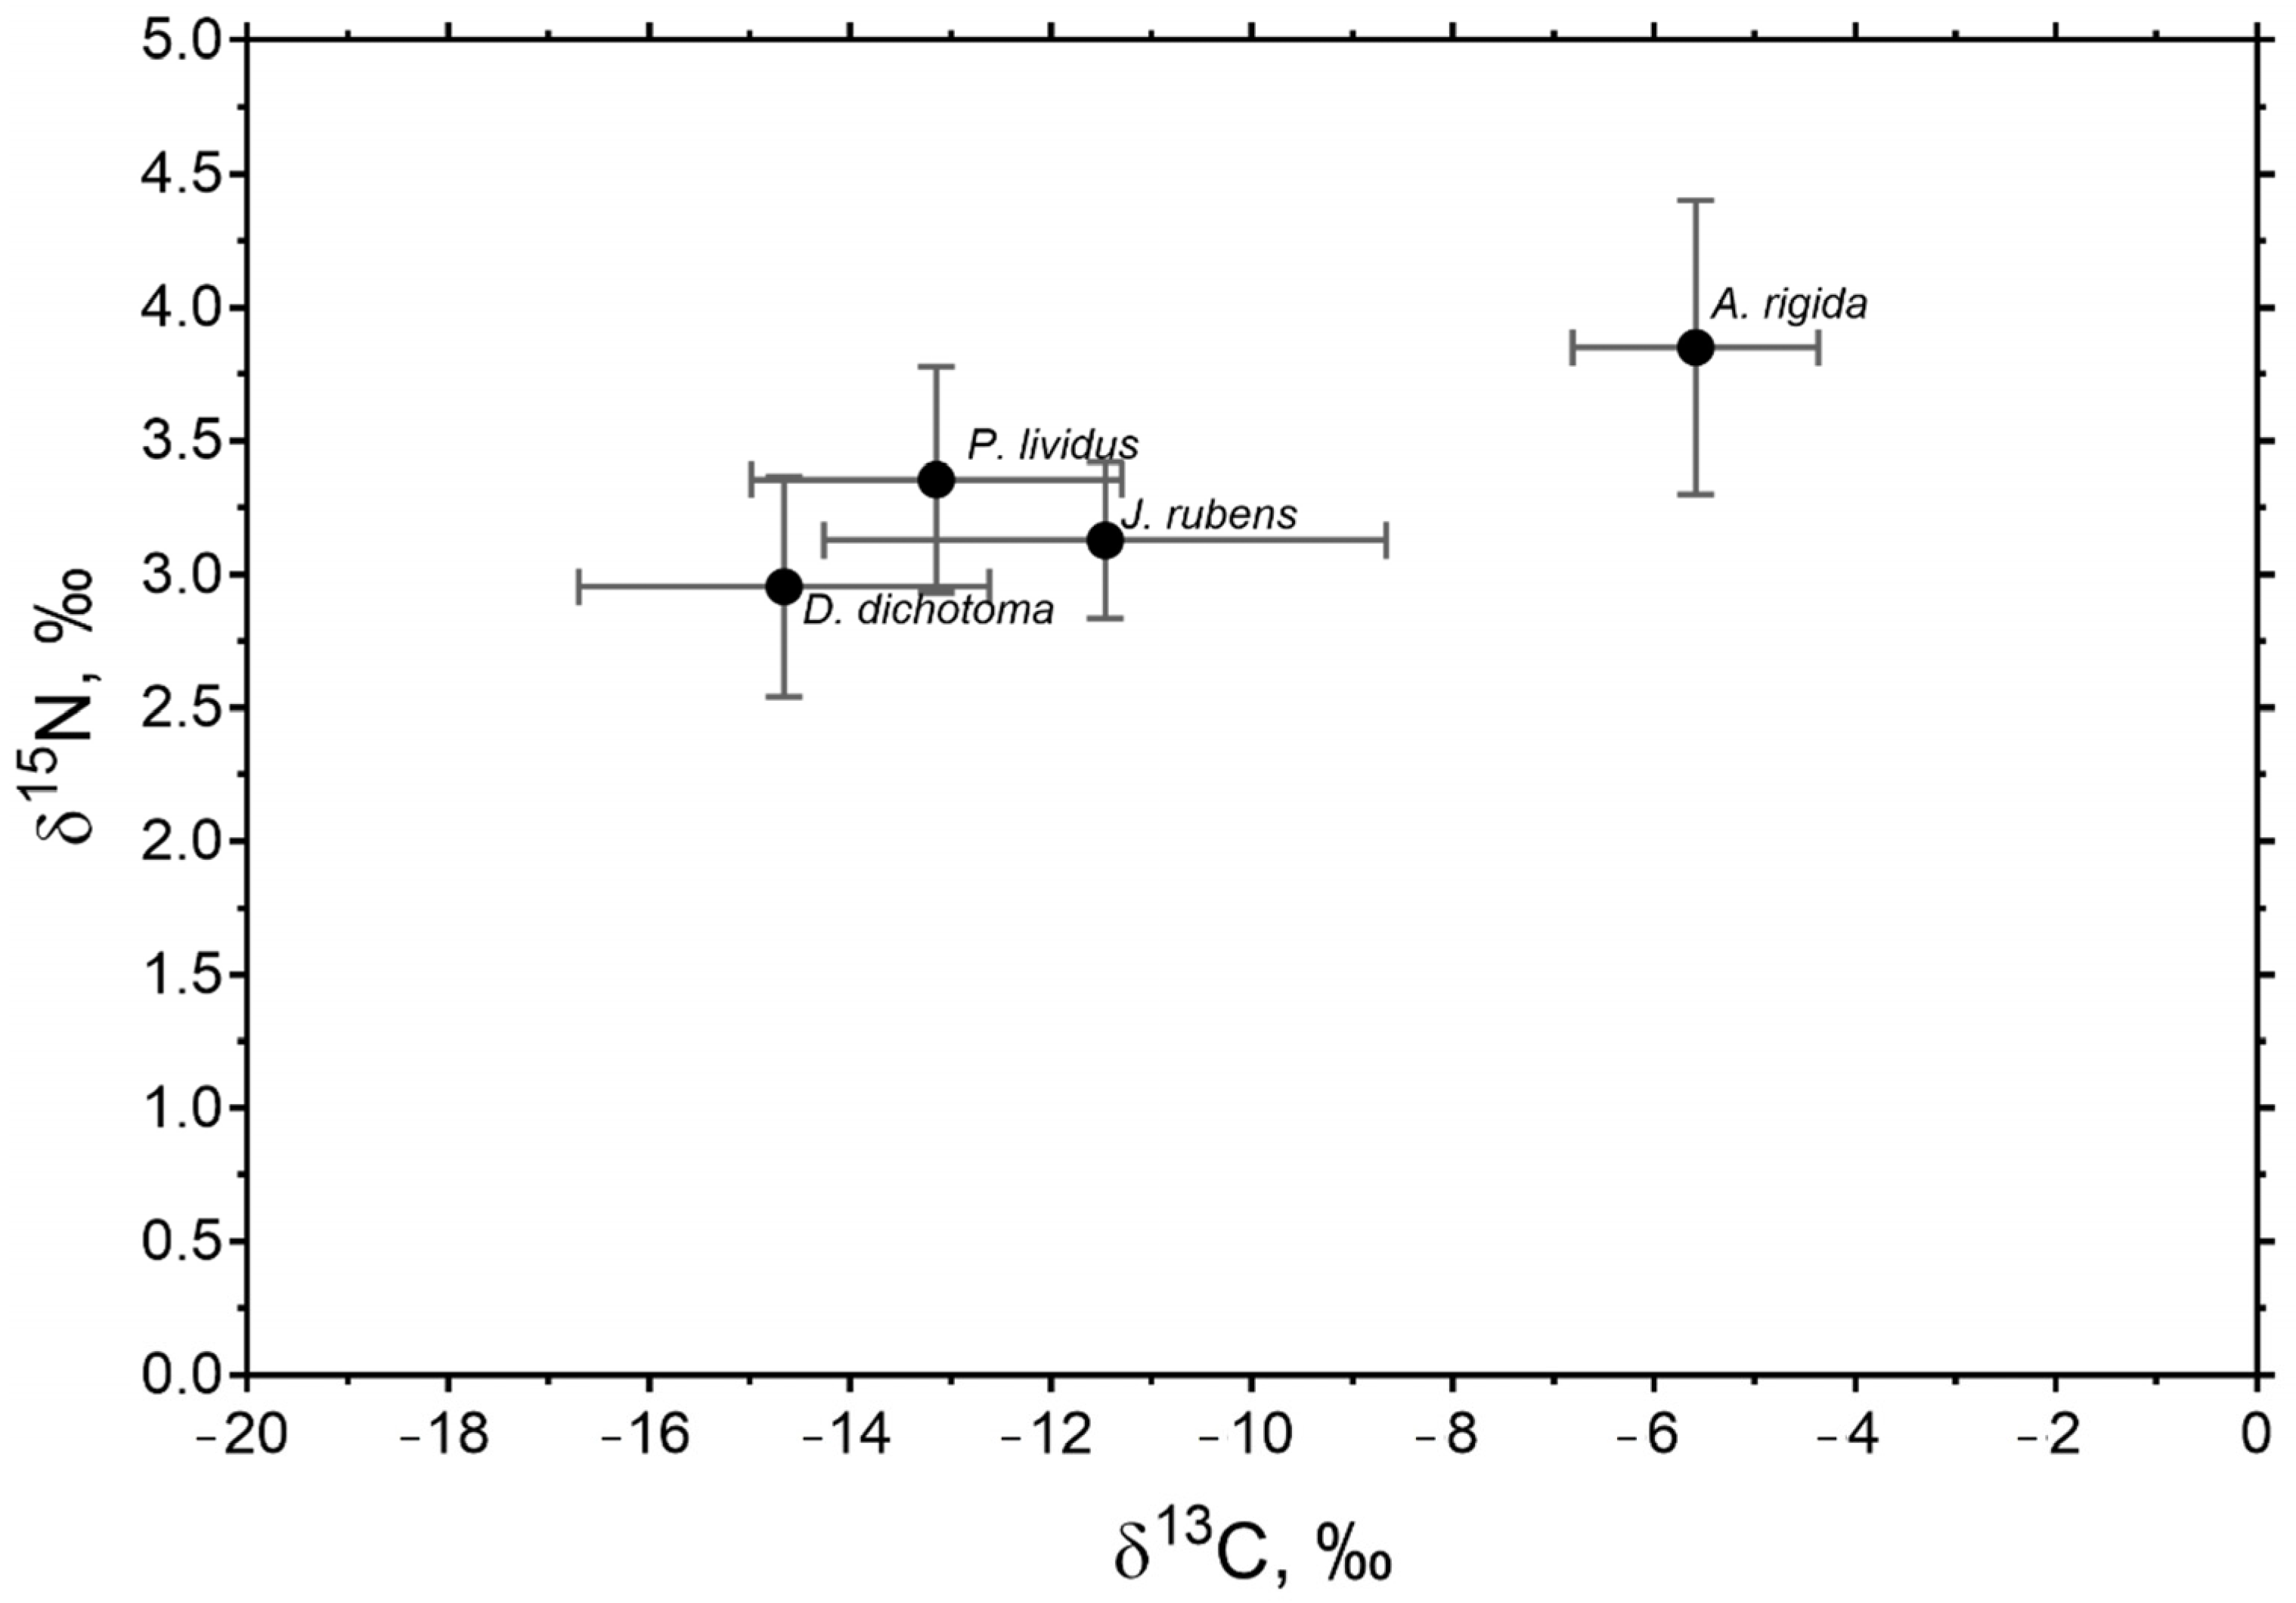
| Species | Station | Period | TC (%) | TN (%) | δ13C (‰) | δ15N (‰) |
|---|---|---|---|---|---|---|
| D. dichotoma | A | Warm | 40.63 ± 1.37 Aa | 2.20 ± 0.13 Aa | −16.33 ± 0.16 Aa | 2.65 ± 0.11 Aa |
| Cold | 32.22 ± 2.05 Ab | 2.03 ± 0.24 Ab | −15.61 ± 1.01 Ab | 2.74 ± 0.16 Ab | ||
| B | Warm | |||||
| Cold | 18.80 ± 0.19 Ba | 1.04 ± 0.06 Ba | −12.02 ± 0.41 Ba | 3.48 ± 0.20 Ba | ||
| J. rubens | A | Warm | 17.01 ± 0.32 Aa * | 0.75 ± 0.12 Aa * | −9.12 ± 0.74 Aa * | 3.19 ± 0.21 Aa |
| Cold | 18.68 ± 0.46 Ab * | 0.86 ± 0.15 Ab * | −11.65 ± 0.58 Ab * | 3.39 ± 0.30 Aa | ||
| B | Warm | 16.92 ± 0.34 Ba * | 0.71 ± 0.07 Ba * | −9.31 ± 0.30 Ba * | 2.98 ± 0.31 Ba | |
| Cold | 32.06 ± 1.30 Bb * | 1.85 ± 0.17 Bb * | −15.76 ± 0.68 Bb * | 2.94 ± 0.15 Ba | ||
| A. rigida | A | Warm | 15.24 ± 0.45 Aa * | 0.48 ± 0.10 Aa * | −4.76 ± 0.84 Aa * | 3.75 ± 0.10 Aa |
| Cold | 16.11 ± 0.54 Aa * | 0.40 ± 0.06 Ab * | −6.97 ± 0.41 Ab * | 3.77 ± 0.17 Aa | ||
| B | Warm | 15.85 ± 0.64 Aa * | 0.54 ± 0.07 Ba * | −5.51 ± 1.57 Aa * | 3.61 ± 0.99 Aa | |
| Cold | 15.28 ± 0.33 Aa * | 0.18 ± 0.07 Bb * | −5.11 ± 0.48 Ab * | 4.26 ± 0.34 Aa | ||
| P. lividus | A | Warm | 46.49 ± 3.90 Aa | 7.96 ± 0.83 Aa | −14.20 ± 0.37 Aa | 3.55 ± 0.30 Aa |
| Cold | 46.39 ± 0.59 Aa | 8.40 ± 0.34 Aa | −12.87 ± 2.70 Ab | 3.59 ± 0.42 Aa | ||
| B | Warm | 46.32 ± 1.55 Aa | 8.89 ± 1.28 Aa | −14.23 ±0.96 Aa | 3.40 ± 0.32 Ba | |
| Cold | 44.11 ± 2.08 Aa | 8.89 ± 0.67 Aa | −11.26 ± 0.64 Ab | 2.87 ± 0.26 Ba |
Disclaimer/Publisher’s Note: The statements, opinions and data contained in all publications are solely those of the individual author(s) and contributor(s) and not of MDPI and/or the editor(s). MDPI and/or the editor(s) disclaim responsibility for any injury to people or property resulting from any ideas, methods, instructions or products referred to in the content. |
© 2022 by the authors. Licensee MDPI, Basel, Switzerland. This article is an open access article distributed under the terms and conditions of the Creative Commons Attribution (CC BY) license (https://creativecommons.org/licenses/by/4.0/).
Share and Cite
Escobar-Sierra, C.; de Kock, W.; Hasler-Sheetal, H.; Holmer, M.; Chatzigeorgiou, G.; Tsapakis, M.; Apostolaki, E.T. Metabolomics Unravels Grazing Interactions under Nutrient Enrichment from Aquaculture. Diversity 2023, 15, 31. https://doi.org/10.3390/d15010031
Escobar-Sierra C, de Kock W, Hasler-Sheetal H, Holmer M, Chatzigeorgiou G, Tsapakis M, Apostolaki ET. Metabolomics Unravels Grazing Interactions under Nutrient Enrichment from Aquaculture. Diversity. 2023; 15(1):31. https://doi.org/10.3390/d15010031
Chicago/Turabian StyleEscobar-Sierra, Camilo, Willemien de Kock, Harald Hasler-Sheetal, Marianne Holmer, Giorgos Chatzigeorgiou, Manolis Tsapakis, and Eugenia T. Apostolaki. 2023. "Metabolomics Unravels Grazing Interactions under Nutrient Enrichment from Aquaculture" Diversity 15, no. 1: 31. https://doi.org/10.3390/d15010031
APA StyleEscobar-Sierra, C., de Kock, W., Hasler-Sheetal, H., Holmer, M., Chatzigeorgiou, G., Tsapakis, M., & Apostolaki, E. T. (2023). Metabolomics Unravels Grazing Interactions under Nutrient Enrichment from Aquaculture. Diversity, 15(1), 31. https://doi.org/10.3390/d15010031