Review

Global Overview of Modern Research Based on Ellenberg Indicator Values

by
Ekaterina Zolotova
1,
Natalya Ivanova
2,* and
Svetlana Ivanova
3
1
Zavaritsky Institute of Geology and Geochemistry, Ural Branch of Russian Academy of Sciences, 15 Akademika Vonsovsky Street, 620010 Yekaterinburg, Russia
2
Institute Botanic Garden, Ural Branch of Russian Academy of Sciences, 202a 8 Marta Street, 620144 Yekaterinburg, Russia
3
Institute of Natural Sciences and Mathematics, Ural Federal University, 19 Mira Street, 620002 Yekaterinburg, Russia
*
Author to whom correspondence should be addressed.
Diversity 2023, 15(1), 14; https://doi.org/10.3390/d15010014
Submission received: 2 November 2022 / Revised: 15 December 2022 / Accepted: 19 December 2022 / Published: 21 December 2022
(This article belongs to the Section Biodiversity Loss & Dynamics)

Abstract

:
The ecological indicator values are the most common and sufficiently effective method of habitat assessment. The aim of our research review is to analyze current studies from 2020 to 2022 in which researchers have used Ellenberg indicator values to address a variety of problems. We limited the study to papers that are published in journals indexed by Scopus and Web of Science. The total number of records examined was 358. The number of records selected was 98. Visualization of the distribution of studies by country is based on the GeoCharts library. The results revealed that about half of the studies were conducted in Germany and Poland, and the most common objects were forests and grasslands. Almost half of the studies were devoted to ecological niches, habitat analysis, assessment of vegetation dynamics, and influence of various factors on plants. The analyzed articles are actively cited. In general, our research analysis revealed the effectiveness of Ellenberg indicator values for solving a wide range of urgent problems for a variety of plant communities, and different climate zones. The results of our research confirmed the advisability of actively using this approach.

1. Introduction

Environmental factors have an impact on the structures and dynamics of plant communities and the geographical distribution of plants [1,2,3]. In most cases, measuring most environmental factors is very difficult and is an impossible task in large-scale studies. Therefore, the habitat assessment based on ecological indicator values is of great interest to researchers [4,5,6]. The use of ecological indicator values can help solve the problem of biodiversity conservation, which continues to decline despite the ongoing efforts to minimize these processes [7].
Indicator values represent the ecological characteristics of plant species and allow direct ordination of floristic composition with environmental factors. Currently, dozens of different ecological indicator values exist. The indicator values developed by H. Ellenberg [8] and E. Landolt [9] are often used in Europe, while the indicator values developed by L.G. Ramensky [10] and D.N. Tsyganov [11] are more used in Russia and the CIS countries. The conventional unit of ecological indicator values is the score, which is calculated for each floristic composition.
The application range of indicator values is wide. It includes analysis of growing conditions and the position of plant communities on the axes of environmental factors; identification of ecological groups of species and ordination of plant communities; analysis of the dynamics of plants, including anthropogenic; predicting habitat conditions in plant communities, etc. [12,13,14,15]. Research on improving existing ecological indicator values and creating regional indicator values on their basis is ongoing [16,17].
The Ellenberg indicator values are one of the most widely used ecological indicators. Heinz Ellenberg developed these indicator values based on field observations of implemented niches of plant taxa and partly on evidence from ecological experiments and measurements of environmental variables [8,18,19]. The studies were carried out mainly in Germany and the Alps. Briefly, 2494 species and intraspecific taxa of plants were characterized in relation to light availability (L), temperature (T), continentality (C), soil moisture (M), soil reaction (R), soil fertility (N) and salinity (S). The relationship of species to moisture is described at 12 scores, the remaining parameters include 9 scores. Separately, the relationship of plants to the variability of moisture and flooding is noted. The final score of the plant community is based on scores of all plant species. There are different methods for calculating the final score [20,21]. One method is to average the scores of all species by factors, weighted by the species abundance. The point of location of the species on the factor scale is considered to be the ecological optimum of this species by factor. Some researchers consider that the score of the species is the median of the realized niche of the species and may be quite different from the optimum. A variety of software exists for editing, classifying, and analyzing large phytosociological databases. They also provided the Ellenberg indicator values [22,23,24].
The popularity of Ellenberg indicator values is due to the following positive qualities: numerous plant species are described, constant updating and refinement of values, and the availability of software for calculation. There are main negative qualities to using this ecological indicator. First, the Ellenberg indicator values should be adapted for new regions where the flora is very different from the European one. Secondly, a small number of environmental parameters are included in the Ellenberg indicator values.
The Ellenberg indicator values are constantly discussed. Researchers investigated the sensitivity of Ellenberg indicator values to the completeness of vegetation relevés [25,26] and to sample plot size [27]. The indicator values have also been calibrated and improved [28]. It is established that the use of indicator values is a reliable method in a wide range of the size of the studied area [27]. The use of Ellenberg indicator values for the “nitrogen content of the soil” factor (N) primarily reflects the richness of the habitat with elements of mineral nutrition or the productivity of the habitat, rather than the direct nitrogen content in the soil. Therefore, the indicator values for the N-factor are proposed to be called indicator values for the productivity factor [18,29].
Many researchers note the importance of adapting and calibrating indicator values for use in new regions. Several approaches are highlighted for the regionalization of ecological indicator values. These are observation of individual species, calibration using floral databases, and assessment based on field measurements of environmental factors. Currently, Ellenberg indicator values have been successfully adapted for use in Northern and Central Europe [30,31], the UK [32], the Mediterranean region [33,34], the Faroe Islands [35], and others.
Our research was aimed at finding answers to the following questions: How often are Ellenberg indicator values used in modern research? What issues are Ellenberg indicator values used for? What is the geography of research? Which studies are of the greatest interest (citation)? The answers to these questions will show how Ellenberg indicator values have developed, will highlight new research directions, and indicate their relevance in the scientific community.

2. Materials and Methods

2.1. Data Collection

Data collection was carried out for the period from 2020 to 2022. We have selected only the last 3 years to identify the latest scientific achievements that relate to the use of the Ellenberg indicator values. An overview of earlier studies can be found in numerous publications [12,20,36,37]. We used the PRISMA guidelines [38] and guidelines for environmental science studies [39]. “Ellenberg indicator value” was the search term. ScienceDirect, Mendeley, SciProfiles, and Google Scholar were selected to search for information. This research stage was conducted in the period from September to October 2022. The total number of records examined was 358. We limited ourselves to this narrow search query because the aim of the research review (in this first stage) was to analyze studies in which researchers have used Ellenberg indicator values to address a variety of problems. Of course, when the authors of the paper did not indicate that they used Ellenberg indicator values, or indicator values developed on the basis of it, then these papers would not be included in our research analysis. On the other hand, when the authors used the supplemented and modernized Ellenberg indicator values and indicated that the Ellenberg indicator values were taken as the basis for the development of new ecological values of indicators, then such studies would be included in our research analysis. In the future, we plan to conduct research analysis for other environmental indicator values using a similar methodology.

2.2. Selecting Studies to Include in a Systematic Review

The presence of an English abstract was a prerequisite for the record selection. Geographical location was not included in the list of criteria for excluding records. The use of Ellenberg indicator values in the study was the main condition for including the record in this research review. All abstracts were analyzed to decide whether to include or exclude the record. Only publications in journals and books indexed by Scopus and Web of Science were selected. Despite the fact that “Ellenberg indicator value” was a search term, we found many records based on the automatic search that related to other ecological indicators. These records were excluded from further research analysis. All the authors of this paper participated in the decision to include or exclude the record. Duplicate records were excluded at the final stage. The number of records selected was 98.

2.3. Data Extraction, Management, and Analysis

The data were extracted manually and recorded in an Excel spreadsheet. The criteria used for data extraction are summarized in Table 1.
Similar topics were encoded with the same words. For example, papers devoted to all aspects of plant dynamics were encoded with the word “dynamics”. Further, this paper group was divided into subgroups. The subgroup list included “successions”, “climatic changes”, “anthropogenic transformation”, and “long-term dynamics”. Further sorting and classification of the data were carried out in Microsoft Excel 2019 MSO (version 2211, Yekaterinburg, Russia). The GeoCharts library [40] was used to visualize the distribution of studies by country. This library was developed by Google and is included in the react-google-charts package (version 3.0.15). We also used a JavaScript application with a ReactJS framework [41].

2.4. Study Limitations

The present scientific analysis was limited to papers indexed by Scopus and Web of Science. We have imposed restrictions on the year of publication. Only papers published between 2020 and 2022 were included in the research analysis. The use of PRISMA guidelines [38], guidelines for environmental science research [39], and strict selection/quality criteria for paper appraisal allowed us to carry out our research analysis at a high scientific level. We believe that scientific results have been obtained, conclusions have been substantiated, and research goals have been achieved.

3. Results

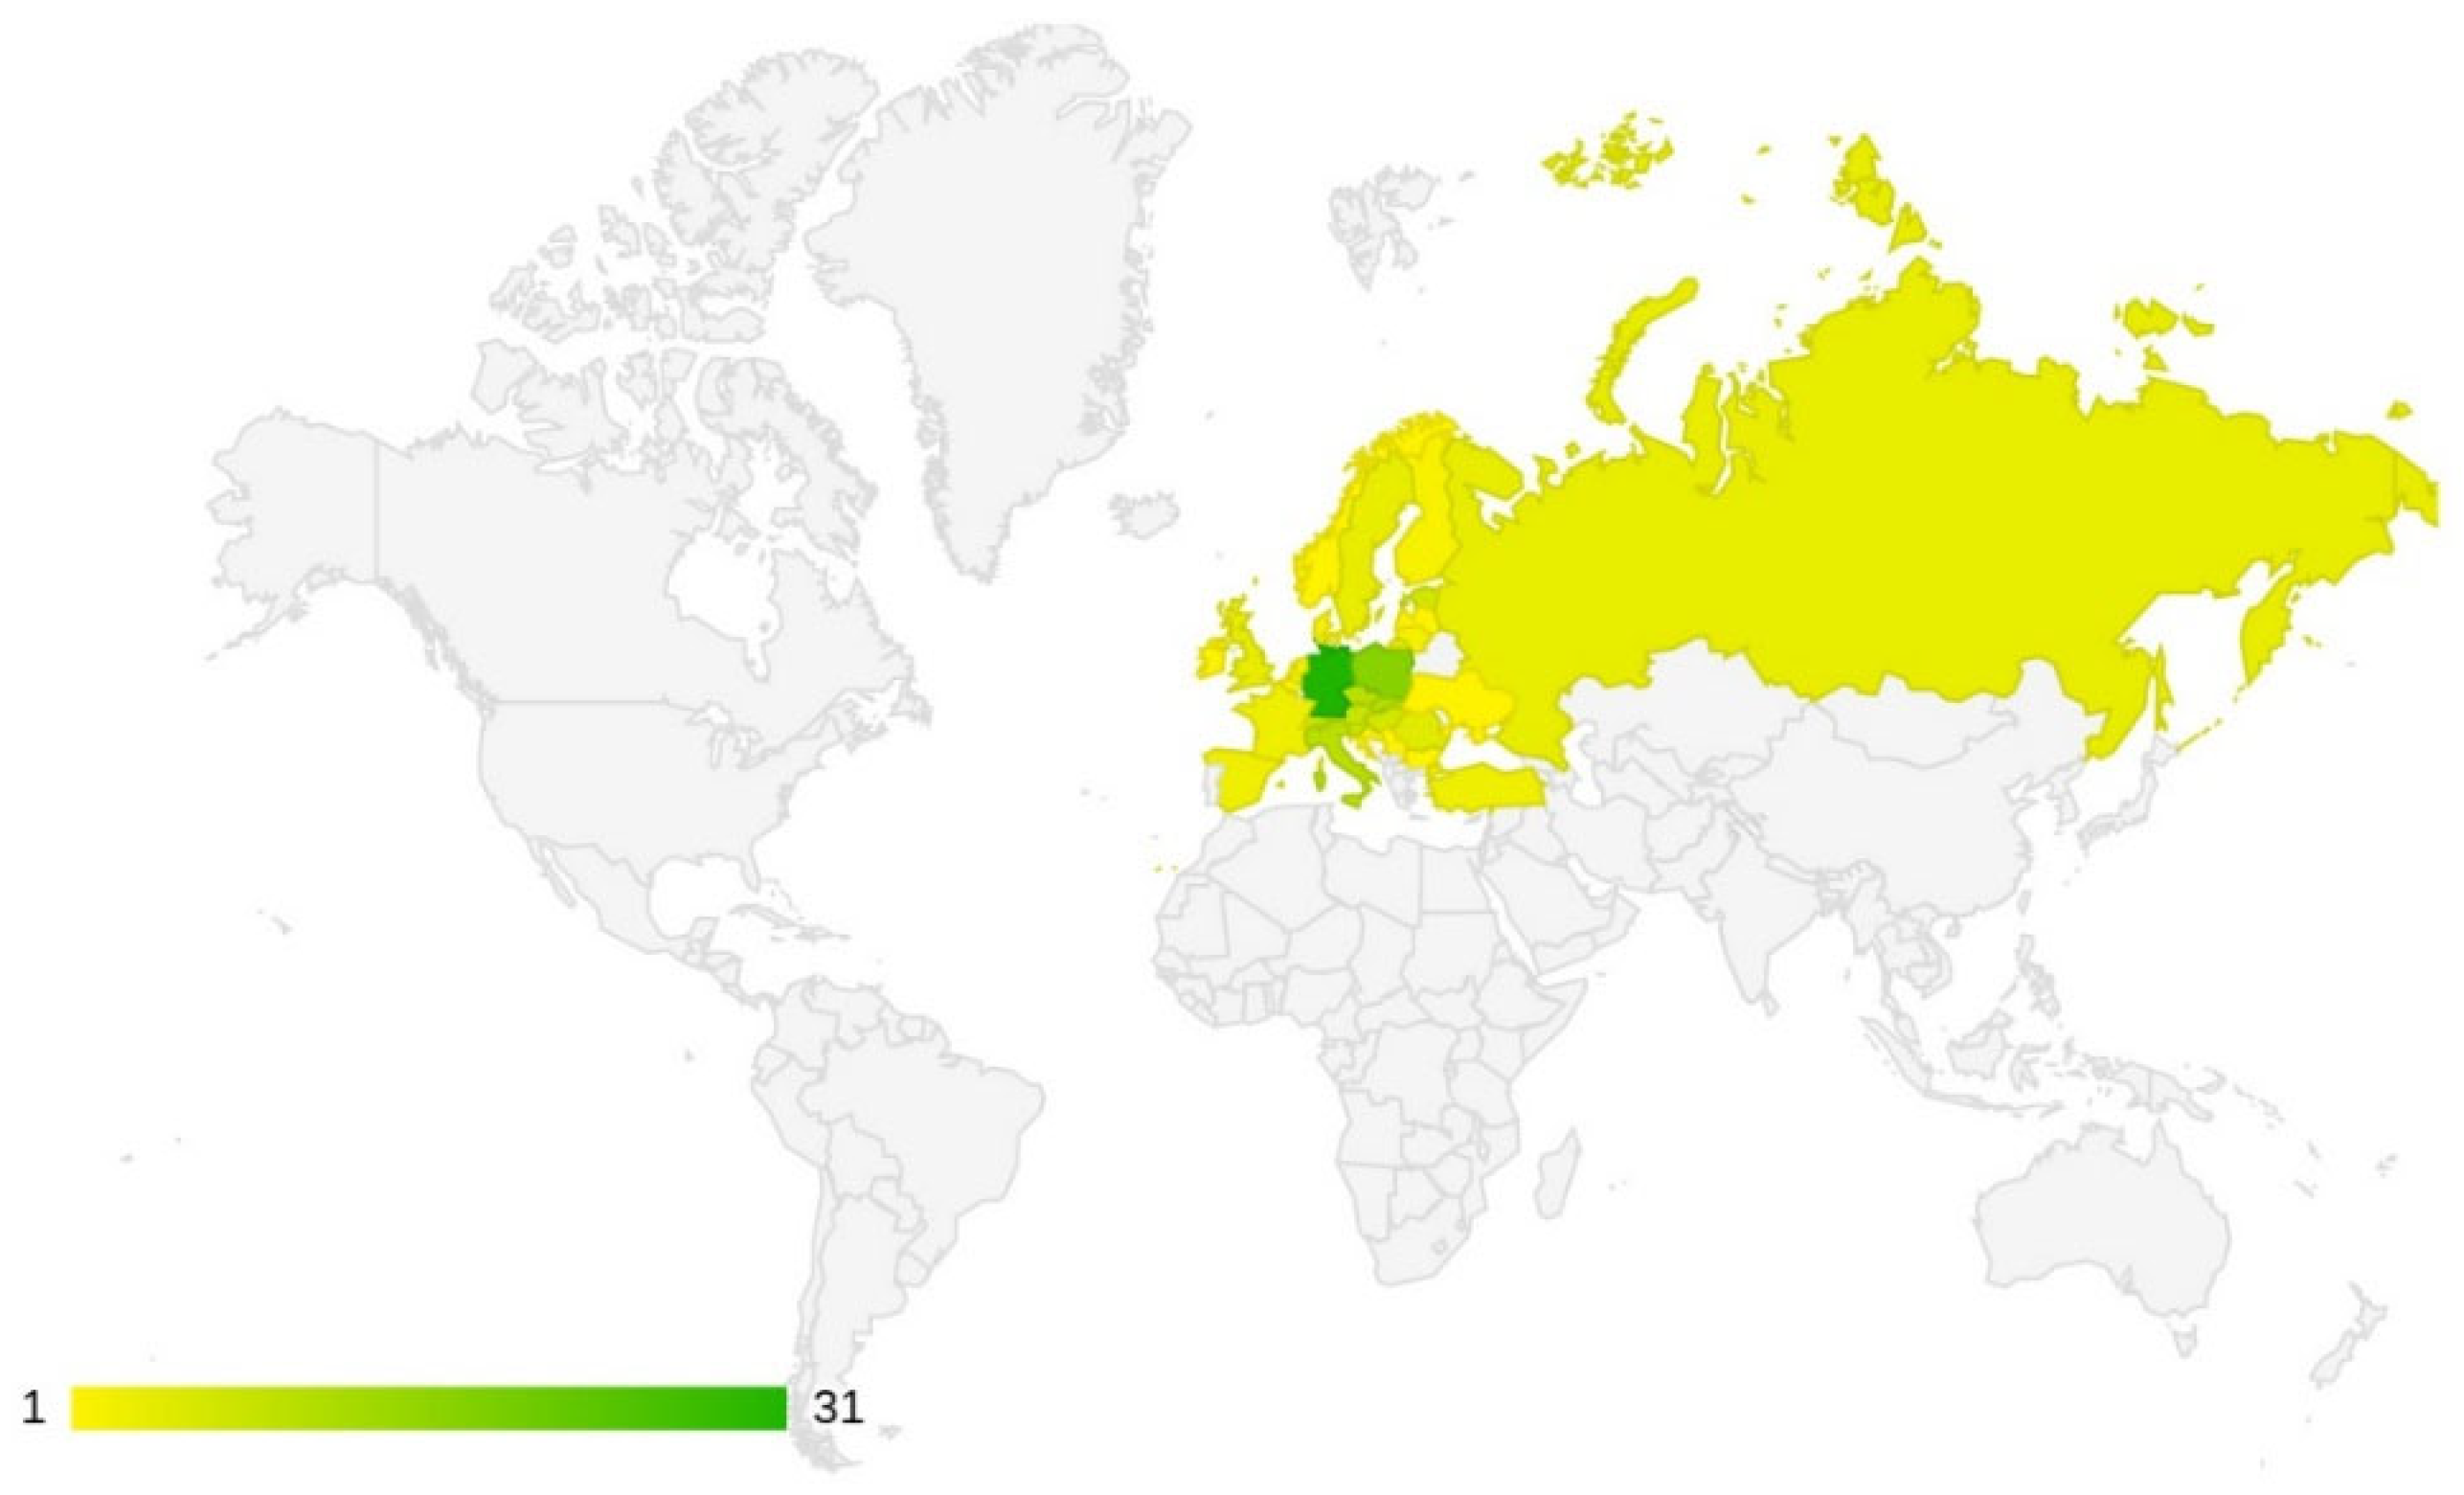
3.1. Frequency of Studies by Country

The geography of the use of Ellenberg indicator values in modern research has been visualized as a map (Figure 1).
Most of the research is concentrated in Europe. Across the globe, Germany has the highest number of studies (i.e., 31) in which Ellenberg indicator values were used as the main or additional research method. It should be clarified here that the Ellenberg indicator values were designed specifically for this country. The map (Figure 1) clearly shows that the research center based on this methodology has remained the same. The next conclusion, which follows from the analysis of Figure 1, is that the area of use of Ellenberg indicator values has expanded significantly. For example, Poland ranked second with 17 studies, followed by Slovakia (11 studies). Ten studies were carried out in both Italy and Czech Republic. Figure 1 also shows that there are successful studies based on Ellenberg indicator values that were conducted outside of Central Europe. So, for example, over the past three years, 4 and 3 studies using the Ellenberg indicator values were conducted in Russia and Turkey, respectively.

3.2. Type of Plant Community under Research

Studies based on Ellenberg indicator values can be divided into two large groups: studies conducted in various plant communities and laboratory experiments. It should be noted that laboratory experiments account for only 3% of the total number of studies. We would like to mention 3 papers in this group [42,43,44]. In laboratory studies, Ellenberg indicator values are used to select plants with certain ecological niches. The conducted studies have confirmed the effectiveness of Ellenberg indicator values for these purposes [43,44].
When conducting research in the natural habitat, Ellenberg indicator values are used most often for the study of forest vegetation. The share of such studies exceeds 46%. Among them, 19% are devoted to the study of a whole range of different forest types. For example, studies conducted by groups of authors from Germany are devoted to the study of acidophilic and oligo-mesophilic forest types [45,46,47] as well forest types ranging from wet forests (alluvial, swamp and bog forests of Alnion incanae, Alnion glutinosae and Betulion pubescentis) to acidic mixed oak forests (Quercion roboris) up to acidic, mostly dry pine forests with different nutrient status (Dicrano-Pinion) [48] and larger-scale studies covered 61 forest types [49]. Forests in nineteen temperate forest regions throughout Europe have been studied by a large international team of authors [50]. Different forest communities in comparison with semi-open habitats with high and low canopy closure and open habitats are studied using the example of German forests [51]. Moreover, large-scale studies of various forest types have been conducted in the Czech Republic [52], Romania [53], Poland [54], Russia [55,56], and Turkey [57]. Research on mountain forests should be considered separately [58,59,60,61]. Only pine forests are also often chosen as research objects [62,63,64]. Single studies are devoted to spruce [65], oak [66], and beech [67] forests.
Ellenberg indicator values are also widely used in the study of grassland. Detailed studies of grassland were conducted in Germany [68,69,70,71,72], Italy [73], Sweden [74], Estonia [75], and Lithuania [76]. Large-scale research that covers various pastures throughout Central Europe is of particular scientific value [16,77]. We would also like to mention some studies devoted to species-rich mesophilous mountain hay meadows [78] and other subalpine grassland communities [79,80], tall-herbs vegetation [81], mesic and wet grasslands [82], and xerothermic grasslands [83].
Studies to clarify the ecology of individual plant species, ecological niches, and to identify the influence of environmental factors on the distribution of species are often carried out using Ellenberg indicator values. Over the past three years, studies have been conducted for such plant species as Rosa gallica [84], Malus sylvestris and Malus domestica [85], Ligularia sibirica [86], and Fraxinus excelsior [87]. Separately, a study on the ecology of 107 German Carex species should be noted [88].
Our systematic review also revealed those plant communities that Ellenberg indicator values are rarely used to study. These include mountain tundra [89], segetal flora [90], tree lines [91], balks, i.e., uncultivated strips separating fields [92], arable habitats [93], urban flora [94], and rocky scrub communities [95].
In the conclusion of this section, we would like to mention studies that cover a wide range of plant communities. A group of authors from Sweden conducted a study of 38 vegetation types [96]. All vascular flora of the Cantabrian Mountains was studied by a large team of Spanish authors [97]. All EUNIS terrestrial habitat types included in the European Red List of Habitats, and 10 additional anthropogenic habitat types taken from the eurovegchecklist have been studied within Central Europe [15]. Vegetation types of the Northern Urals were studied by Russian authors [98].

3.3. Characterization of Research Topics

The directions of modern research using the Ellenberg indicator values are very diverse. The largest number of papers over the past three years have been aimed at studying the dynamics of vegetation and assessing the impact of various factors on natural ecosystems (Table 2). Long-term vegetation dynamics under the influence of various factors is given for forests [48,52,59,63,65,67,99,100,101,102]; grasslands [68,71,72,80,103] including calcareous grasslands [69,76,104,105]. The largest number of studies are devoted to anthropogenic changes for all vegetation types studied [63,69,71,72,99,100,106]. Ellenberg indicator values are used less frequently to study natural successions [65,67,104,107]. The study of managed forest successions in the NE German lowlands is a very interesting one, as it covers a wide range of forest types and the identification of forest-typological features of environmental change using the Ellenberg indicator values [48]. The study of the long-term dynamics of vegetation of Rzeszów Reservoir over 22 years (1994–2016) [106] revealed the disappearance of 14 plant communities and the occurrence of 12 new ones. Furthermore, significant environmental changes have been noticed. However, not all studies reveal differences in the dynamics of environmental conditions depending on the type of plant community. So, for example, similar habitat dynamics were revealed in different semi-natural dry calcareous grasslands when grazing was canceled [104]. The study of the climatogenic dynamics of vegetation deserves special attention. We can mention a study conducted in the mountain forests of France [59]. In this study, the authors noted the changes in the plant communities in the context of global warming. Mires are devoted to two papers for this period. Palynological richness and phylogenetic diversity as well as Ellenberg indicator values were compared throughout the 10,000-year history of the Saaremaa mires [108]. Thirty calcareous fens were studied in the Inner Western Carpathians (Slovakia, Poland) after 13–17 years of warm summers and land-use changes [109].
The studies on vegetation dynamics presented below are worth mentioning separately. Fifteen years of habitat, floristic and vegetation change on a pioneer sand-dune and slack system at Ainsdale, north Merseyside were analyzed [107]. Moreover, the researchers tested the relative importance of environmental characteristics and species traits in determining colonization success using old (70 years old) and modern data on the floristic diversity from 471 islands in the archipelago of SW Finland. They assumed that predictions of plant colonization primarily require understanding of habitat properties and species’ historical distributions [110]. Changes in vegetation composition and α- and β-diversities change in mid- and high-elevation Mediterranean ecosystems over the last 46 years have been studied [58]. In one article, the flora changes in Rome City are investigated over the period (1995 and 2015–2018), and drivers of this change were assessed [94].
The studies on vegetation dynamics are carried out mainly for plant communities, but there are few works aimed at a specific species. Habitat characteristics of the Montana arnica population have been investigated to determine the factors causing the species to decline in numbers [70].
Studies on the analysis of growing conditions, ecological niches rank second in terms of the number of published papers over the past three years (Table 2). Ecological niches were evaluated for the following plant communities and species: Fraxinus excelsior [87]; Rosa gallica [84]; Malus sylvestris and its hybrid with Malus domestica [85]; bog arum (Calla palustris) [111]; macrofungal communities [83]; Arnica montana [112]; orchidaceae [56]; mosses and lichens [54,61,113]. Using the Ellenberg indicator values, an assessment was made of the ratio and frequency of medicinal plants from the influence of management on these values in the semi-natural grasslands of Estonia [75], and the issue of the influence of fungal-mediated decomposition on soil fertility and organic matter turnover was also resolved in a temperate mountain forest [60]. Researchers presented the first standardized list of the vascular flora of the Cantabrian Mountains (N. Spain) [97]; a substantially updated list of 292 native wild food plants in Sicily [114] and the first inventory of the segetal flora of Italian winter cereal crops and allied crop types [90].
The topographically induced pattern of ground vegetation in managed Scots pine (Pinus sylvestris) stands on inland dunes in the Toruń Basin (N. Poland) and the link of the pattern to the spatial variation of environmental agents (microclimatic and soil conditions) was determined [62]. Ellenberg indicator values, tolerance values, species niche models for soil nutrient availability, salinity, and pH in coastal dune vegetation along a landward gradient (Euxine, Turkey) were studied [115]. The influence of environmental factors on the species composition and structure of soil algal assemblages in different types of mountain tundra and sparse forests in the Northern Urals was studied [89]. When studying the low plains to the subalpine belt (southeastern Carpathians) throughout Romania, researchers found that the availability of resources and the equitability of niche partitioning, underlying the process of species sorting during plant community assembly, play a major role in shaping the ranked species occupancy curves [53].
The third place in terms of the number of published papers is occupied by studies on the determination of ecological groups of species, vegetation classification, and the ordination of plant communities according to environmental factors (Table 2). The researchers conducted floristic and phytosociological studies for the non-calcareous grasslands of the Monti Sibillini National Park (central Italy) [116]; vegetation of temperate inland salt marshes in central Germany (Saxony-Anhalt and Thuringia) [117]; uncultivated strips separating fields (balks) (Poland) [92]; tall-herbs vegetation from the East Carpathians Rank Călimani and Gurghiu Mountains [81]; mesic and wet grasslands (Molinio-Arrhenatheretea, Polygono-Poetea) (Poland) [82]; mesophilous mountain hay meadows (Triseto flavescentis-Polygonion bistortae alliance, Molinio-Arrhenatheretea class) (Carpathian) [78]; forest associations (121 relevés classified under eight associations) in Küre Mountains National Park (Turkey) [57]; scree vegetation in the northern Apennines with the aim of comparing vegetation types classified in different syntaxa [118]. Semi-open habitats of European pasture landscapes have been studied as dispersal corridors for both plants from woodlands and open habitats [51]. Differentiation of vegetation according to ecological characteristics was carried out, and the operating factors that determine the structure and variability were identified. The following plant communities have been studied: Ligularia sibirica populations from Romania [86]; middle taiga spruce forests (ass. Linnaeo borealis–Piceetum abietis dryopteridetosum var. typica) and secondary communities formed after winter clearcuttings [55]; old-drained forests in Estonia [119]; natural rocky scrub vegetation in Central Europe [95]. The first attempt to describe the mycorrhizal status of vegetation at the Telpos-iz Ridge (Northern Urals, Russia) across different elevations and ecological conditions was made [98]. Relationships between the vegetation of Macedonian pine (Pinus peuce Griseb.) and different types of soils have been looked at [64]. Ellenberg indicator values were estimated in different subalpine grassland communities of the Giresun Mountains (Turkey). It has been established that soil acidity and moisture were significant ecological parameters in the distribution of the plant communities in the study area [79].
Eight papers on establishing the relationship between environmental characteristics and ecological indicators (improving Ellenberg indicator values) were published from 2020 to 2022 (Table 2). The relationship between the Ellenberg indicator values of soil moisture and water table depth has been studied [16,120]. Researchers introduced a new dataset of species-specific ecological indicator values for Swedish vascular plants [96]; a list of Ellenberg indicator values N-values for Central European bryophytes and the methodology which was used to obtain these values [121]; modified Ellenberg indicator values for mixed forests and pannonic woods in the Podunajská niína [122]. The use of indicators to explain the complex relationships between vegetation and humus in forest ecosystems from all over the Italian Peninsula was analyzed [123]. Researchers confirmed that Ellenberg N provides a robust indication of the overall nutrient preferences of individual grassland species. In grassland sites developing on previously arable land N-values may represent an integrated response not only to nutrients but also to other historical processes that drive grassland community assembly [74].
New methodological developments of studying plant communities and vegetation dynamics using Ellenberg indicator values deserve special attention. The possibility of using incomplete floristic monitoring data from habitat mapping programmers to detect species trends was evaluated [124]. A new resource of vegetation plot data of arable habitats in Central Europe (AgriWeedClim database) was introduced [93]. The methodology of the spatially detailed ecosystem integrity assessment system is being improved [49]. Other researchers compared modeled niche optima obtained from European-scale SDMs (species distribution models) of 1476 terrestrial vascular plant species with empirical ecological indicator values and also provide a method to give insight into the ecological realism of modeled niche optima and projected core habitats [15]. Derivation of environmental data layers by mapping ecological indicator values in space has been suggested. Six million plant occurrences have been combined with Ellenberg indicator values of 3600 species in Switzerland. The resulting maps were among the most important predictors in species distribution models [13].
The effect of atmospheric nitrogen deposition is considered for bryophyte communities in central and northern European forests [125] and the vegetation composition of temperate forest understories in south-western Germany [46,47]. Testing the explanatory power of modeled deposition datasets for vegetation gradients was made. Researchers combined vegetation and soil data recorded across eutrophication gradients in ten oligo-mesotrophic forest types in southwest Germany with datasets from two different deposition models specifically fitted for forests in the study region [45].
In three papers, the relationship between Ellenberg indicator values and plant characteristics was established. Researchers determined that root anatomy predicts ecological optima in Carex (Cyperaceae) (tested for the 107 German Carex species) [88]. The possibility of the existence of a general adaptation modifying the seedling shoot: root ratio according to the species niche position on the soil moisture gradient has been demonstrated for temperate grassland species across a broad range of angiosperm phylogeny [77]. High turgor promotes drought survival of common perennial European temperate mesic grassland species (41 species common Germany: 20 forbs, 21 grasses) by enabling them to maintain high leaf water potentials under drought. However, turgor was not related to species moisture association [42].
Ellenberg indicator values are also used to monitor invasive species. Central-northern Italian Quercus pubescens forest habitats without and with the presence of Robinia pseudoacacia and in respect of R. pseudoacacia dominant communities that are present in the same forest potential areas were investigated [66]. By using logistic regression models on vegetation surveys, environmental data based on Ellenberg indicator values, and patch metrics, researchers identified patch characteristics explaining the presence of invasive species (Prunus serotina, Impatiens parviflora) in Illyrian oak-hornbeam forest (NE Slovenia) [126]. It has been established that sewage pollution promotes the invasion-related traits of Impatiens glandulifera in an oligotrophic habitat of the Sharr Mountain, Western Balkans [127].

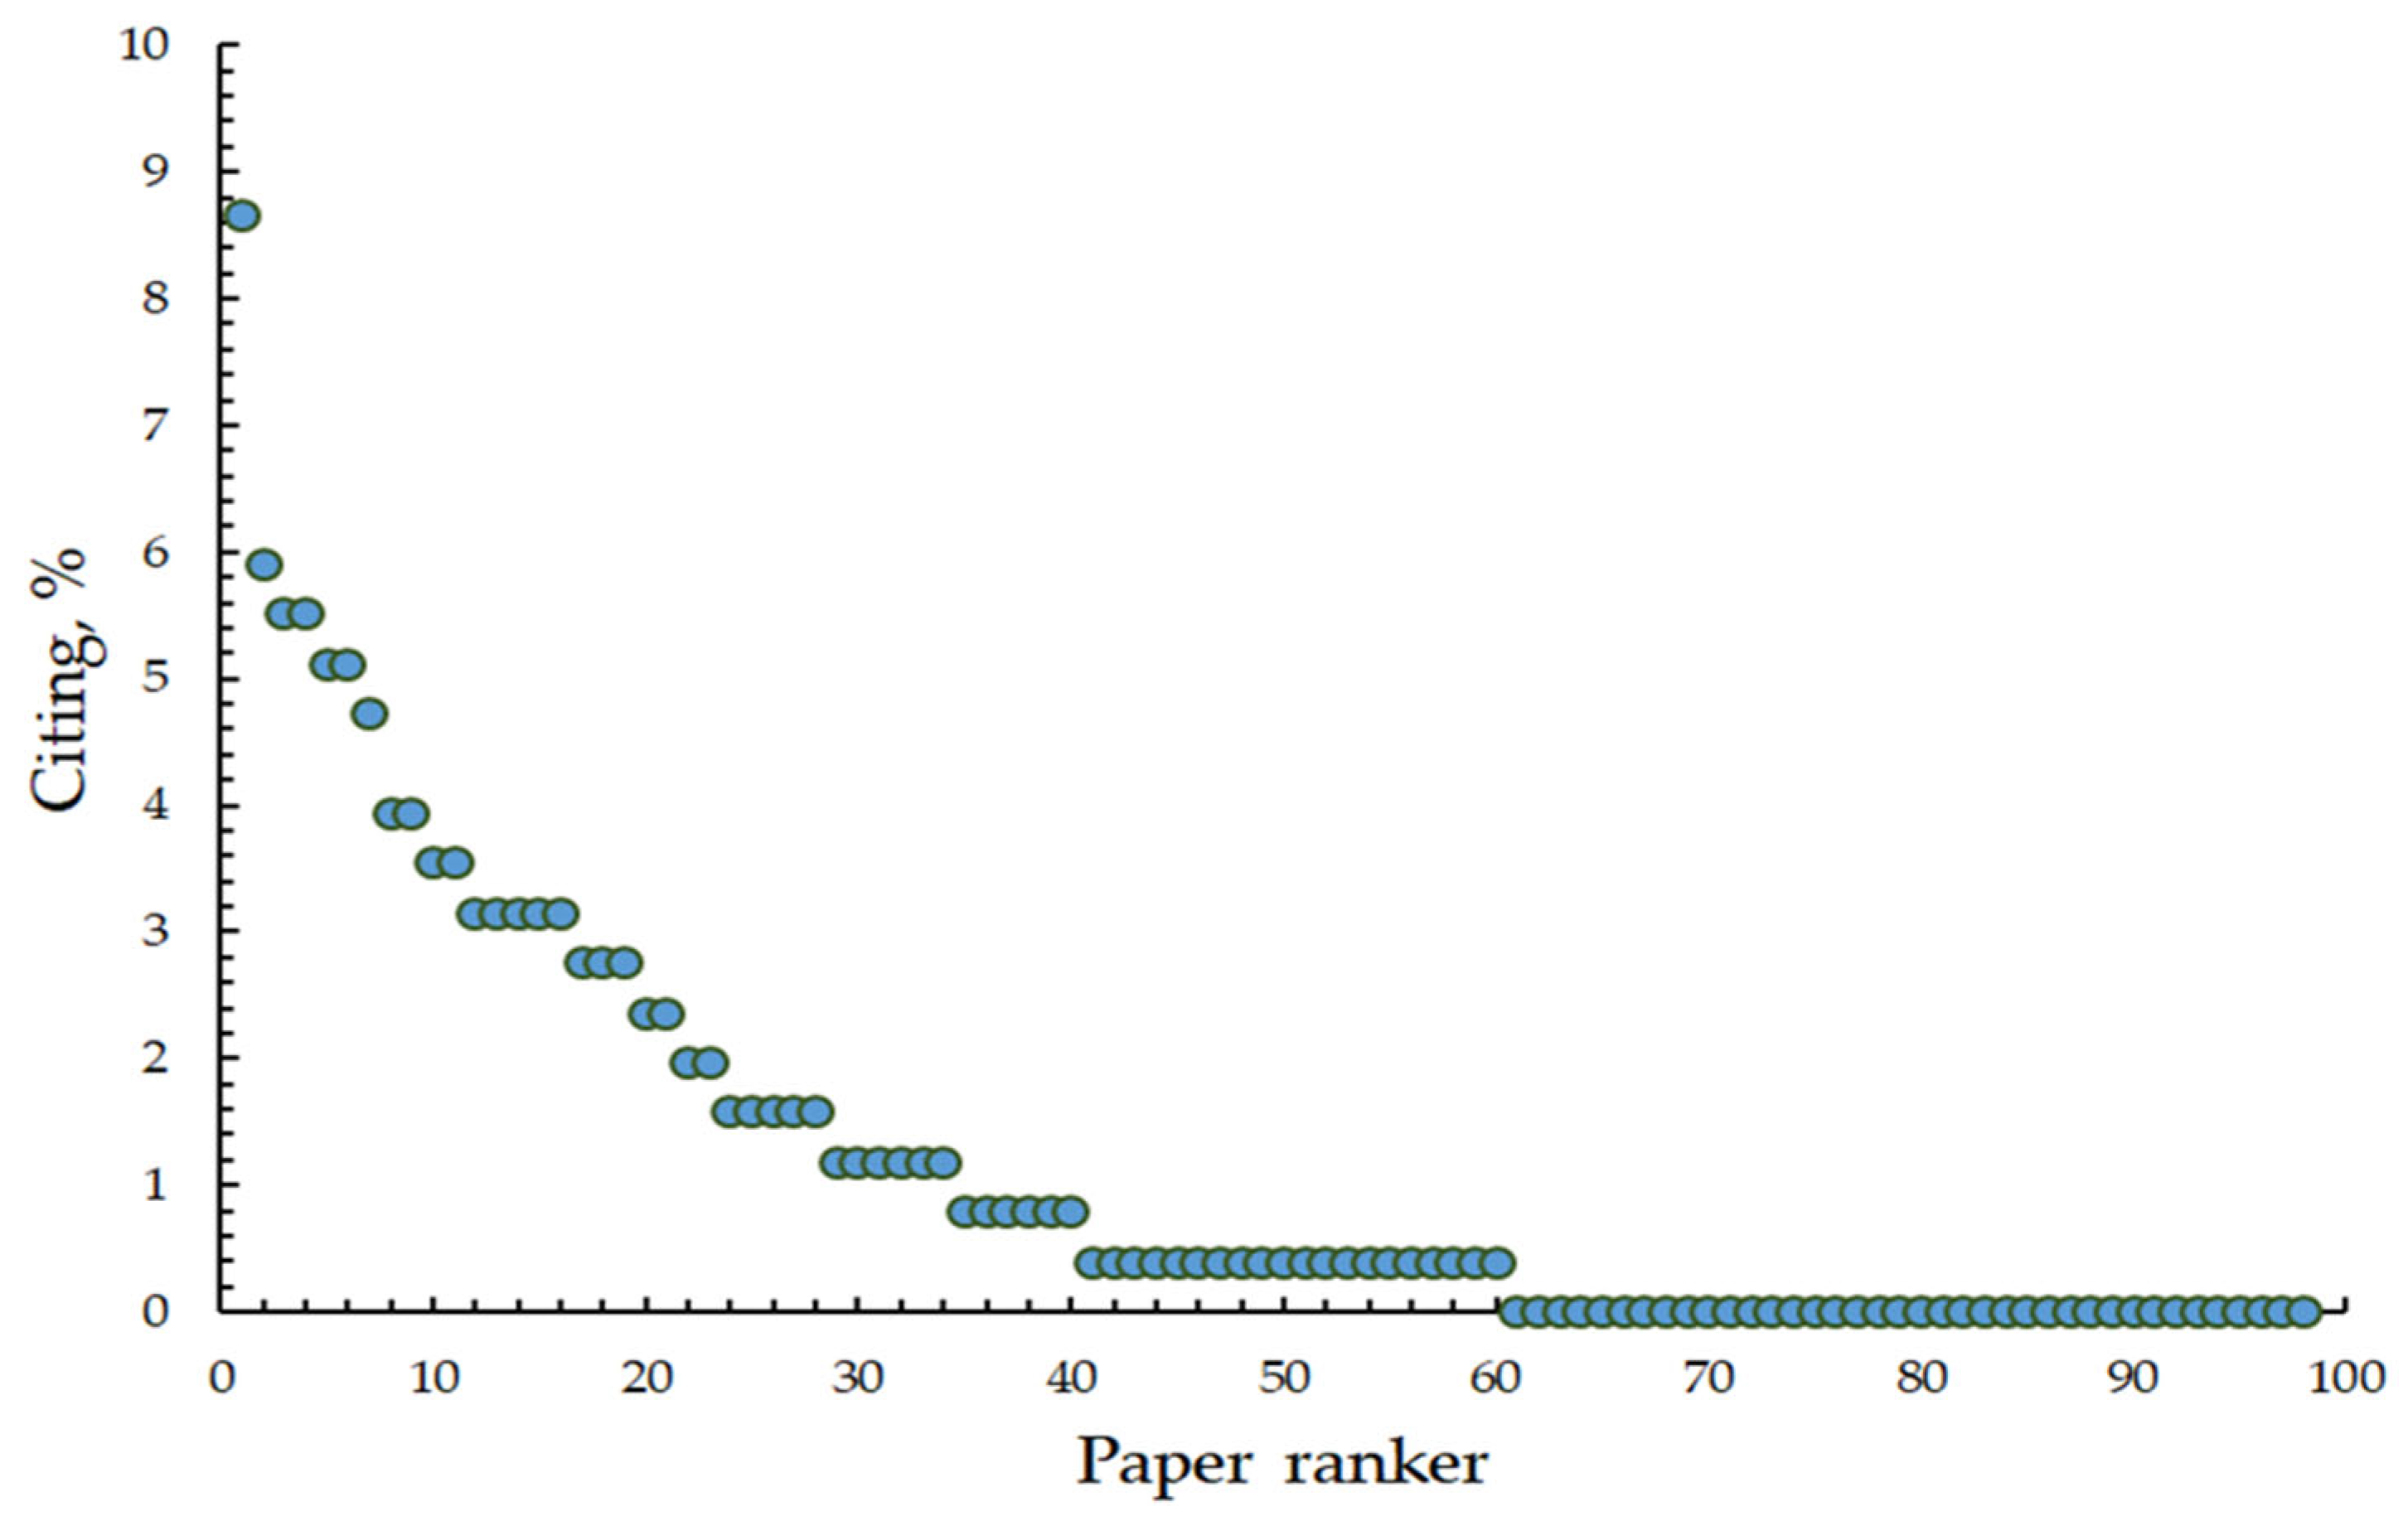
3.4. Characterization of Citing

Citation analysis has been recognized as an important feature for determining the significance of papers, since it reflects the attention of researchers [128]. We analyzed the paper ranker distribution. This type of distribution is widely used in ecology and other sciences [129,130,131,132]. The advantage of this analysis is that it allows you to identify and visually display the contribution of each ranker. In this case, the distribution characterizes the contribution of each particular paper to a scientific discipline based on its citation. The results of the analysis are shown in Figure 2. This figure clearly shows that one paper stands out sharply among all the others. If we sum up the citations of all the papers under consideration, we will see that 8.6% of all references are to a paper of the first ranker. The citation of other papers is much lower. However, despite the recent publication of papers, most of them are actively cited (Figure 2). This result confirms the relevance of the topic of Ellenberg indicator values and the scientific significance of modern research.
Table 3 sums up the most frequently cited papers on the subject of Ellenberg indicator values from 2020 to 2022, including the paper ranker, number of citations, authors, year, research topics, and journal. The most cited paper has 22 citations. This is a review that is dedicated to the potential of soil, plant-, and remote sensing-based metrics to compare the nutrient status. This study was conducted by a group of authors from different countries: Belgium, Switzerland, Finland, and Spain. The authors analyzed the data for all of European, managed temperate and boreal forests. This example clearly shows the advantages of international cooperation and the opportunity to obtain more significant scientific results by a large scientific team.
The next most cited paper is written by authors from Poland. This paper is dedicated to endangered Calcareous fens. The authors investigated the long-term dynamics and anthropogenic transformation of these interesting ecosystems and revealed acceptable indicative sensitivity of Ellenberg indicator values.
The third paper in the ranking has been cited 14 times. The research is devoted to the improvement of Ellenberg indicator values. To this end, the authors conducted a broad survey of published and unpublished data. The paper authors have developed new ecological indicator values and trait values for all Swedish plants (in 38 main vegetation types). These indicators are applicable to vegetation changes at all temporal and spatial scales. The scientific and practical significance of the paper is beyond doubt.
A paper dedicated to biomass partitioning in response to intraspecific competition dependence has the same citation rating. The study was carried out by the authors from Germany and was organized as a laboratory experiment. Ellenberg indicator values were used to select plants with different realized niches with respect to nutrients.
Next, we can mention a paper on the dynamics of plant communities, which has 13 citations. This study was carried out by a team of authors from France. The research objects were temperate and mountainous forests. The authors investigated whether forest gaps favored vegetation adaptation to warmer climates. The results of this study showed that the disturbance regime plays a key role in the adaptation of forest communities to climate warming.
A large-scale and interesting study was carried out by a group of authors from Switzerland. Their efforts were aimed at mapping environmental data over large geographic extents and at high spatial resolution remains. For these purposes, the authors obtained environmental data layers by mapping ecological indicator values in space. The authors concluded that combining large citizen science databases with Ellenberg indicator values is an effective approach for generalizing local edaphic and climatic conditions over large areas.
We would like to mention another paper by a group of authors from Germany dedicated to drought survival. This paper was published in 2020 and already has 12 citations. In this study, the Ellenberg indicator values were used to select plants with different indicator values for the experiment. The authors reached an interesting conclusion, which is that the relationship between Turgor loss point and drought survival in herbaceous grassland species is opposite to the one previously shown in woody species.

4. Discussion

4.1. Frequency of Studies by Country

An analysis of the geography of studies using the Ellenberg indicator values showed that demand for them remains high in Europe. In other regions, less research is carried out. This is probably due to the fact that these ecological indicators were created specifically for these areas, the farther the studied habitat, the more serious differences in the species composition of plant communities and, accordingly, the less accurate the results of using the Ellenberg indicator values. Turkish and Russian researchers are showing interest in the Ellenberg indicator values and are finding ways to use them in their studies, while simultaneously developing national ecological indicators. For example, Tsyganov indicator values are most widely used in Russia [11]. Scientists from the USA, Africa, China, and other regions of the planet have not used Ellenberg indicator values in their work over the past three years. However, a small number of studies have been conducted before [134,135,136].
The experience of using Ellenberg indicator values is undoubtedly important for countries located at a considerable distance from the center of origin of this methodology. Positive experience and profound results obtained on the basis of Ellenberg indicator values undoubtedly contribute to the emergence and development of national indicator values. On the other hand, the comparison of the research results obtained on the basis of the values of the Ellenberg indicator values and the other national indicator values should contribute to a deeper analysis of the environment and more informed conclusions. In this research review, we did not analyze the experience of simultaneous use of several indicator values. This analysis is planned to be carried out in the future. We hope that it will reveal new positive aspects in the use of Ellenberg indicator values.

4.2. Type of Plant Community under Research

The use of Ellenberg indicator values has proven to be effective for the analysis of various plant community types, as well as for the selection of plants for laboratory experiments. Ellenberg indicator values are actively used in studies of forests and grasslands. Studies published in 2020–2022 on other plant communities also showed reliable results and reasonable conclusions. Single studies are presented for a number of plant communities: mountain tundra, segetal flora, tree lines, balks, i.e., uncultivated strips separating fields, arable habitats, urban flora, and rocky scrub communities. We did not find any limitations to the use of Ellenberg indicator values in studying these plant communities. Therefore, our global review allows us to conclude that it is advisable to actively and more widely use these ecological indicators in a wide variety of communities. In our opinion, the use of the Ellenberg indicator values can be very useful in the study of ecotones, including the upper and northern boundaries of the forest. When studying tree lines, as a rule, the main attention is paid to only one tree species, and the habitat assessment is carried out in insufficient detail [137,138,139]. Therefore, many questions remain about habitat dynamics despite the high scientific level of studies. Some of these questions could be solved using the Ellenberg indicator values.

4.3. Characterization of Research Topics

The analysis of research topics showed that Ellenberg indicator values are used to solve the most pressing issues of the modern world, such as plant dynamics, anthropogenic transformation, and the identification of factors that determine the structure and dynamics of vegetation. Numerous studies are devoted to these topics, and the Ellenberg indicator values certainly make a significant contribution to the success of solving these problems, including the validity of the conclusions made. Ecological indicators have made it easier to solve many particular problems within the framework of the general topic of identifying drivers of plant dynamics. This is due to the fact that determining the values of climatic and edaphic factors is associated with a number of difficulties and is often impossible in large-scale studies. By contrast, the Ellenberg indicator values are quite easy to use. The results of our review confirmed their effectiveness.
The problem of ecological niches, for which the Ellenberg indicator values are widely used, is also one of the most pressing issues today. This is explained by the fact that the ecological niche is a key concept in ecology and biogeography [140,141]. Despite the importance of the problem, estimates of the ecological niches of many species are still often based on limited data on occurrence and are not clearly characterized [142]. In addition, an increasing number of researchers report fairly rapid changes in the niches of some species in space and time, and revised estimates are not available in most cases [143,144]. The use of such inaccurate or outdated data may lead to false conclusions. As our study has shown, the Ellenberg indicator values help clearly and comprehensively characterize the ecological niche of a species or identify its change, if such has occurred. The newly updated estimates of ecological niches of species can be used either in further studies, for example, to model the distribution of species, or in practice for the successful introduction of valuable plant species. Our study also revealed the successful application of the Ellenberg indicator values to the study of biological invasions. This problem is also extremely relevant [145,146].
The problem of vegetation classification is one of the main directions in forestry, botany, and biogeography. The results of scientific research, environmental management, and nature protection largely depend on the classification systems used for work [147,148,149]. Our study showed, that the Ellenberg indicator values are actively used to solve this problem. This method allows for in-depth ecological analysis, which is the basis of classification. This makes the construction of classification schemes justified and allows them to be used to solve a wide variety of problems, including planning environmental management and biodiversity conservation.
Research aimed at improving the values of the Ellenberg indicator values is necessary to expand the scope of these indicators and increase the effectiveness of this method. Methodological studies, where the Ellenberg indicator values complement other approaches, such as habitat mapping and species distribution models, are of particular interest. As a result of these comprehensive studies, interesting data is obtained.
In addition, we would like to note the need for comparative studies of various ecological indicators that are used to study the vegetation of Eurasia. The lack of comprehensive reviews on this topic makes it very difficult to compare the results of studies based on different ecological indicators.

5. Conclusions

A global review of modern studies based on the Ellenberg indicator values revealed that the geography of this method application is quite extensive. However, about half of the studies were carried out in Germany and Poland. An analysis of the types of plant communities revealed the effectiveness of the Ellenberg indicator values for studying the most diverse vegetation, as well as for choosing plants for experiments. At the same time, most of the research is focused on forests and grasslands. However, restrictions on the use of Ellenberg indicator values for other plant communities have not been identified. A review of research topics has shown that the Ellenberg indicator values are used to solve a wide range of topical problems in biology, ecology, and forestry. Almost half of the studies are devoted to ecological niches, habitat analysis, assessment of vegetation dynamics, and influence of various factors on plants. The improvement of the methodology for assessing the state of ecosystems and the study of the relationship between environmental characteristics and Ellenberg indicator values should be mentioned among the important areas of research too. Citation analysis revealed that despite the recent publication of articles, most of them are actively cited. This result confirms the relevance of the topic of Ellenberg index values and the scientific significance of modern research on its basis.
In general, our study revealed the effectiveness of these ecological indicators for solving a wide range of urgent problems for a wide variety of plant communities located in a wide gradient of climatic conditions and confirmed the expediency of its more active use. In particular, Ellenberg indicator values can act as criteria integrating many aspects of the environment and provide information for a comprehensive multi-criteria analysis of the environment, including for monitoring climate change, habitat change, and conservation of biodiversity of species and ecosystems. We hope that our global review of the Ellenberg indicator will increase its popularity among researchers in different countries and contribute to its further development and the expansion of scientific application and geography of distribution.

Author Contributions

Conceptualization, N.I. and E.Z.; methodology, N.I. and E.Z.; formal analysis, N.I. and E.Z.; investigation, N.I. and E.Z.; writing—original draft preparation, N.I. and E.Z.; writing—review and editing, N.I., E.Z. and S.I.; visualization, N.I., S.I. and E.Z. All authors have read and agreed to the published version of the manuscript.

Funding

The studies are carried out as a part of the State assignment of the Institute Botanic Garden, Ural Branch of the Russian Academy of Sciences and part of the State assignment of the Zavaritsky Institute of Geology and Geochemistry, Ural Branch of Russian Academy of Sciences (state registration No. AAAA-A18-118052590028-9 and No. FUMZ-2023-0001) using the «Geoanalitik» shared research facilities of the IGG UB RAS. The re-equipment and comprehensive development of the «Geoanalitik» shared research facilities of the IGG UB RAS is financially supported by the grant of the Ministry of Science and Higher Education of the Russian Federation (Agreement No. 075-15-2021-680).

Institutional Review Board Statement

Not applicable.

Data Availability Statement

Not applicable.

Conflicts of Interest

The authors declare no conflict of interest.

References

  1. Ri, X.; Yang, J.; Zhao, L.-Q.; Qing, H.; Latanzhula, A.; Yao, Z.-Y.; Zhu, L.; Wu, Y.-H.; Tian, J.-B.; Cao, X.-P.; et al. Establishment, development, and decline of Salix psammophila communities: Changes in soil conditions and floristic composition in dune slacks. Glob. Ecol. Conserv. 2020, 22, e00967. [Google Scholar] [CrossRef]
  2. Ivanova, N.S.; Zolotova, E.S.; Li, G. Influence of soil moisture regime on the species diversity and biomass of the herb layer of pine forests in the Ural Mountains. Ecol. Quest. 2021, 32, 27–38. [Google Scholar] [CrossRef]
  3. Mumshad, M.; Ahmad, I.; Khan, S.M.; Rehman, K.; Islam, M.; Sakhi, S.; Khan, S.U.; Afridi, S.G.; Shams, S.; Azam, S.; et al. Phyto-ecological studies and distribution pattern of plant species and communities of Dhirkot, Azad Jammu and Kashmir, Pakistan. PLoS ONE 2021, 16, e0257493. [Google Scholar] [CrossRef] [PubMed]
  4. Scherrer, D.; Guisan, A. Ecological indicator values reveal missing predictors of species distributions. Sci. Rep. 2019, 9, 3061. [Google Scholar] [CrossRef] [Green Version]
  5. Dítě, Z.; Šuvada, R.; Tóth, T.; Jun, P.; Píš, V.; Dítě, D. Current Condition of Pannonic Salt Steppes at Their Distribution Limit: What Do Indicator Species Reveal about Habitat Quality? Plants 2021, 10, 530. [Google Scholar] [CrossRef]
  6. Zhivotovsky, L.A.; Osmanova, G.O. Phyto-Indicator of Variation in Environmental Conditions. Biol. Bull. 2021, 48, 207–213. [Google Scholar] [CrossRef]
  7. Rodríguez, J.P.; Sucre, B.; Mileham, K.; Sánchez-Mercado, A.; De Andrade, N.; Bezeng, S.B.; Croukamp, C.; Falcato, J.; García-Borboroglu, P.; González, S.; et al. Addressing the Biodiversity Paradox: Mismatch between the Co-Occurrence of Biological Diversity and the Human, Financial and Institutional Resources to Address Its Decline. Diversity 2022, 14, 708. [Google Scholar] [CrossRef]
  8. Ellenberg, H. Zeigerwerte der Gefässpflanzen Mitteleuropas. Scr. Geobot 1974, 9, 1–166. [Google Scholar]
  9. Landolt, E. Okologische Zeigerwerts zur Sweizer Flora. Veroff. Geobot. Inst. ETH. Zurich 1977, 64, 1–208. [Google Scholar]
  10. Ramensky, L.G.; Tsatsenkin, I.A.; Chizhikov, O.N.; Antipin, N.A. Ecological Assessment of Fodder Lands by Vegetation Cover; Sel’khozhiz: Moscow, Russia, 1956; pp. 1–472. [Google Scholar]
  11. Tsyganov, D.N. Phytoindication of Ecological Regimes in The Subzone of Coniferous-Deciduous Forests; Nauka: Moskow, Russia, 1983; 196p. [Google Scholar]
  12. Bartelheimer, M.; Poschlod, P. Functional characterizations of Ellenberg indicator values–A review on ecophysiological determinants. Funct. Ecol. 2016, 30, 506–516. [Google Scholar] [CrossRef]
  13. Descombes, P.; Walthert, L.; Baltensweiler, A.; Meuli, R.G.; Karger, D.N.; Ginzler, C.; Zurell, D.; Zimmermann, N.E. Spatial modelling of ecological indicator values improves predictions of plant distributions in complex landscapes. Ecography 2020, 43, 1448–1463. [Google Scholar] [CrossRef]
  14. Egorova, N.Y. Influence of Ecological Factors on the Population-Ontogenetic Parameters of Vaccinium vitis-idaea L. in Forest Ecosystems of the European Northeast of Russia. Contemp. Probl. Ecol. 2020, 13, 656–662. [Google Scholar] [CrossRef]
  15. Hellegers, M.; Ozinga, W.A.; Hinsberg, A.; Huijbregts, M.A.J.; Hennekens, S.M.; Schaminée, J.H.J.; Dengler, J.; Schipper, A.M. Evaluating the ecological realism of plant species distribution models with ecological indicator values. Ecography 2020, 43, 161–170. [Google Scholar] [CrossRef]
  16. Hájek, M.; Dítě, D.; Horsáková, V.; Mikulášková, E.; Peterka, T.; Navrátilová, J.; Jiménez-Alfaro, B.; Hájková, P.; Tichý, L.; Horsák, M. Towards the pan-European bioindication system: Assessing and testing updated hydrological indicator values for vascular plants and bryophytes in mires. Ecol. Indic. 2020, 116, 106527. [Google Scholar] [CrossRef]
  17. Saatkamp, A.; Falzon, N.; Argagnon, O.; Noble, V.; Dutoit, T.; Meineri, E. Calibrating ecological indicator values and niche width for a Mediterranean flora. Plant Biosyst. Int. J. Deal. all Asp. Plant Biol. 2022, 156, 1–11. [Google Scholar] [CrossRef]
  18. Ellenberg, H.; Weber, H.E.; Dull, R.; Wirth, V.; Werner, W.; Paulußen, D. Zeigerwerte von Pflanzen in Mitteleuropa. Scr. Geobot. 1991, 18, 1–248. [Google Scholar]
  19. Ellenberg, H.; Weber, H.E.; Duell, R.; Wirth, V.; Werner, W. Zeigerwerte der Gefasspflanzen Mitteleuropas (3 Aufl). Scr. Geobot. 2001, 18, 1–262. [Google Scholar]
  20. Diekmann, M. Species indicator values as an important tool in applied plant ecology–A review. Basic Appl. Ecol. 2003, 4, 493–506. [Google Scholar] [CrossRef]
  21. Carroll, T.; Gillingham, P.K.; Stafford, R.; Bullock, J.M.; Diaz, A. Improving estimates of environmental change using multilevel regression models of Ellenberg indicator values. Ecol. Evol. 2018, 8, 9739–9750. [Google Scholar] [CrossRef]
  22. Hennekens, S.M.; Schaminée, J.H.J. TURBOVEG, a comprehensive data base management system for vegetation data. J. Veg. Sci. 2001, 12, 589–591. [Google Scholar] [CrossRef] [Green Version]
  23. Tichý, L. JUICE, software for vegetation classification. J. Veg. Sci. 2002, 13, 451–453. [Google Scholar] [CrossRef]
  24. Zubkova, E.V.; Khanina, L.G.; Grokhlina, T.I.; Dorogova, J.A. Computer Processing of Geobotanical Descriptions on Ecological Scales Using the Program EcoScaleWin Software; Publishing house of Morgan State University: Yoshkar Ola, Russia, 2008; pp. 1–96. (In Russian) [Google Scholar]
  25. Ewald, J. The sensitivity of Ellenberg indicator values to the completeness of vegetation relevés. Basic Appl. Ecol. 2003, 4, 507–513. [Google Scholar] [CrossRef]
  26. Smart, S.M.; Scott, W.A. Bias in Ellenberg indicator values—problems with detection of the effect of vegetation type. J. Veg. Sci. 2004, 15, 843–846. [Google Scholar] [CrossRef]
  27. Otýpková, Z. The influence of sample plot size on evaluations with Ellenberg indicator values. Biologia 2009, 64, 1123–1128. [Google Scholar] [CrossRef]
  28. Berg, C.; Welk, E.; Jäger, E.J. Revising Ellenberg’s indicator values for continentality based on global vascular plant species distribution. Appl. Veg. Sci. 2017, 20, 482–493. [Google Scholar] [CrossRef]
  29. Schaffers, A.P.; Sýkora, K.V. Reliability of Ellenberg indicator values for moisture, nitrogen and soil reaction: A comparison with field measurements. J. Veg. Sci. 2000, 11, 225–244. [Google Scholar] [CrossRef]
  30. Diekmann, M. Use and improvement of Ellenberg’s indicator values in deciduous forests of the Boreo-nemoral zone in Sweden. Ecography 1995, 18, 178–189. [Google Scholar] [CrossRef]
  31. Szymura, T.H.; Szymura, M.; Macioł, A. Bioindication with Ellenberg’s indicator values: A comparison with measured parameters in Central European oak forests. Ecol. Indic. 2014, 46, 495–503. [Google Scholar] [CrossRef]
  32. Hill, M.O.; Mountford, J.O.; Roy, D.B.; Bunce, R.G.H. Ellenberg’s Indicator Values for British Plants; Institute of Terrestrial Ecology: Huntington, UK, 1999. [Google Scholar]
  33. Bohling, N.; Greuter, W.; Raus, T. Indicator values for vascular plants in the Southern Aegean (Greece). Braun Blanquetia 2002, 32, 1–106. [Google Scholar]
  34. Marcenò, C.; Guarino, R. A test on Ellenberg indicator values in the Mediterranean evergreen woods (Quercetea ilicis). Rend. Lincei 2015, 26, 345–356. [Google Scholar] [CrossRef] [Green Version]
  35. Lawesson, J.E.; Fosaa, A.M.; Olsen, E. Calibration of Ellenberg indicator values for the Faroe Islands. Appl. Veg. Sci. 2003, 6, 53–62. [Google Scholar] [CrossRef]
  36. LaPaix, R.; Freedman, B.; Patriquin, D. Ground vegetation as an indicator of ecological integrity. Environ. Rev. 2009, 17, 249–265. [Google Scholar] [CrossRef]
  37. Williams, N.S.G.; Hahs, A.K.; Vesk, P.A. Urbanisation, plant traits and the composition of urban floras. Perspect. Plant Ecol. Evol. Syst. 2015, 17, 78–86. [Google Scholar] [CrossRef]
  38. Liberati, A.; Altman, D.G.; Tetzlaff, J.; Mulrow, C.; Gøtzsche, P.C.; Ioannidis, J.P.A.; Clarke, M.; Devereaux, P.J.; Kleijnen, J.; Moher, D. The PRISMA Statement for Reporting Systematic Reviews and Meta-Analyses of Studies That Evaluate Health Care Interventions: Explanation and Elaboration. PLoS Med. 2009, 6, e1000100. [Google Scholar] [CrossRef] [PubMed]
  39. Mengist, W.; Soromessa, T.; Legese, G. Method for conducting systematic literature review and meta-analysis for environmental science research. Methodsx 2020, 7, 100777. [Google Scholar] [CrossRef] [PubMed]
  40. GeoCharts Quick Start. Available online: https://developers.google.com/chart/interactive/docs/gallery/geochart (accessed on 1 October 2022).
  41. Stefanov, S. React: Up & Running: Building Web Applications, 1st ed.; O’Reilly Media: Sebastopol, CA, USA, 2016; 222p. [Google Scholar]
  42. Sun, S.; Jung, E.Y.; Gaviria, J.; Engelbrecht, B.M.J. Drought survival is positively associated with high turgor loss points in temperate perennial grassland species. Funct. Ecol. 2020, 34, 788–798. [Google Scholar] [CrossRef]
  43. Rehling, F.; Sandner, T.M.; Matthies, D. Biomass partitioning in response to intraspecific competition depends on nutrients and species characteristics: A study of 43 plant species. J. Ecol. 2021, 109, 2219–2233. [Google Scholar] [CrossRef]
  44. Bartušková, A.; Filartiga, A.L.; Herben, T.; Qian, J.; Klimešová, J. Comparative analysis of root sprouting and its vigour in temperate herbs: Anatomical correlates and environmental predictors. Ann. Bot. 2021, 127, 931–941. [Google Scholar] [CrossRef]
  45. Roth, M.; Michiels, H.-G.; Puhlmann, H.; Sucker, C.; Winter, M.-B.; Hauck, M. Responses of Temperate Forests to Nitrogen Deposition: Testing the Explanatory Power of Modeled Deposition Datasets for Vegetation Gradients. Ecosystems 2021, 24, 1222–1238. [Google Scholar] [CrossRef]
  46. Roth, M.; Michiels, H.G.; Puhlmann, H.; Sucker, C.; Hauck, M. Multiple soil factors explain eutrophication signals in the understorey vegetation of temperate forests. J. Veg. Sci. 2021, 32, e13063. [Google Scholar] [CrossRef]
  47. Roth, M.; Müller-Meißner, A.; Michiels, H.-G.; Hauck, M. Vegetation changes in the understory of nitrogen-sensitive temperate forests over the past 70 years. For. Ecol. Manag. 2022, 503, 119754. [Google Scholar] [CrossRef]
  48. Günther, K.; Schmidt, M.; Quitt, H.; Heinken, T. Vegetation change in the forests between the Elbe and Havel rivers (NE Germany) from 1960 to 2015. Tuexenia 2021, 41, 53–85. [Google Scholar] [CrossRef]
  49. Jenssen, M.; Nickel, S.; Schütze, G.; Schröder, W. Reference states of forest ecosystem types and feasibility of biocenotic indication of ecological soil condition as part of ecosystem integrity and services assessment. Environ. Sci. Eur. 2021, 33, 1–18. [Google Scholar] [CrossRef]
  50. Depauw, L.; Perring, M.P.; Landuyt, D.; Maes, S.L.; Blondeel, H.; De Lombaerde, E.; Brūmelis, G.; Brunet, J.; Closset-Kopp, D.; Decocq, G.; et al. Evaluating structural and compositional canopy characteristics to predict the light-demand signature of the forest understorey in mixed, semi-natural temperate forests. Appl. Veg. Sci. 2021, 24, e12532. [Google Scholar] [CrossRef]
  51. Travers, E.; Pitz, W.T.; Fichtner, A.; Matthies, D.; Härdtle, W. The role of semi-open habitats as dispersal corridors for plant species of woodlands and open habitats. Appl. Veg. Sci. 2021, 24. [Google Scholar] [CrossRef]
  52. Řepka, R.; Keclíková, J.; Šebesta, J. Comparison of Forest Species- Diversity and Composition Inside and Outside of the Holedná Game Reserve (The City of Brno, Czech Republic). J. Landsc. Ecol. 2021, 14, 1–18. [Google Scholar] [CrossRef]
  53. Gafta, D.; Stoica, I.A.; Coldea, G. The ranked species occupancy curves reflect the dominant process of species sorting: Evidence from forest/scrub communities. J. Veg. Sci. 2021, 32. [Google Scholar] [CrossRef]
  54. Fojcik, B.; Chmura, D. Vertical distribution of epiphytic bryophytes depends on phorophyte type; a case study from windthrows in Kampinoski National Park (Central Poland). Folia Cryptogam. Estonica 2020, 57, 59–71. [Google Scholar] [CrossRef]
  55. Likhanova, I.A.; Perminova, E.M.; Shushpannikova, G.S.; Zheleznova, G.V.; Pystina, T.N.; Kholopov, Y.V. Dynamics of vegetation after clearcutting bilberry spruce forests (middle taiga subzone of the European North-East of Russia). Rastitel’nost’ Rossii 2021, 40, 108–136. [Google Scholar] [CrossRef]
  56. Kirillova, I.A.; Dubrovskiy, Y.A.; Degteva, S.V.; Novakovskiy, A.B. Ecological and habitat ranges of Orchids in the northernmost regions of their distribution areas: A case study from Ural Mountains, Russia. Plant Divers. 2022. [Google Scholar] [CrossRef]
  57. Tunçkol, B.; Aksoy, N.; Çoban, S.; Zengin, H. Diversity and ecology of forest communities in Küre Mountains National Park of Turkey. Bosque Valdivia 2020, 41, 289–305. [Google Scholar] [CrossRef]
  58. Merle, H.; Garmendia, A.; Hernández, H.; Ferriol, M. Vegetation change over a period of 46 years in a Mediterranean mountain massif (Penyagolosa, Spain). Appl. Veg. Sci. 2020, 23, 495–507. [Google Scholar] [CrossRef]
  59. Dietz, L.; Collet, C.; Dupouey, J.L.; Lacombe, E.; Laurent, L.; Gégout, J.C. Windstorm-induced canopy openings accelerate temperate forest adaptation to global warming. Glob. Ecol. Biogeogr. 2020, 29, 2067–2077. [Google Scholar] [CrossRef]
  60. Mayer, M.; Rewald, B.; Matthews, B.; Sandén, H.; Rosinger, C.; Katzensteiner, K.; Gorfer, M.; Berger, H.; Tallian, C.; Berger, T.W.; et al. Soil fertility relates to fungal-mediated decomposition and organic matter turnover in a temperate mountain forest. New Phytol. 2021, 231, 777–790. [Google Scholar] [CrossRef] [PubMed]
  61. Chmura, D.; Żarnowiec, J.; Staniaszek-Kik, M. Altitude is a better predictor of the habitat requirements of epixylic bryophytes and lichens than the presence of coarse woody debris in mountain forests: A study in Poland. Ann. For. Sci. 2022, 79, 7. [Google Scholar] [CrossRef]
  62. Sewerniak, P.; Puchałka, R. Topographically induced variation of microclimatic and soil conditions drives ground vegetation diversity in managed Scots pine stands on inland dunes. Agric. For. Meteorol. 2020, 291, 108054. [Google Scholar] [CrossRef]
  63. Čakšs, R.; Čakša, L.; Desaine, I.; Lībiete, Z.; Elferts, D.; Butlers, A.; Jansons, Ā. Long-Term Influence of Stump-Removal on Components of Hemiboreal Pine Forest Ecosystem. Sustainability 2021, 13, 2095. [Google Scholar] [CrossRef]
  64. Mandžukovski, D.; Teofilovski, A.; Andreevski, M.; Ćušterevska, R.; Tzonev, R.; Dimitrov, M. Relationships between vegetation of Macedonian pine (Pinus peuce Griseb.) and different types of soils on which it develops. Hacquetia 2022, 21, 89–106. [Google Scholar] [CrossRef]
  65. Baumann, M.; Dittrich, S.; Körner, M.; von Oheimb, G. Temporal changes in the ground vegetation in spruce forests in the Erzgebirge (Ore Mountains)—bryophytes are better indicators of the impact of liming and of sulphur and nitrogen deposition than the herb layer. Appl. Veg. Sci. 2021, 24. [Google Scholar] [CrossRef]
  66. Montecchiari, S.; Tesei, G.; Allegrezza, M. Effects of Robinia pseudoacacia coverage on diversity and environmental conditions of central-northern Italian Quercus pubescens sub-Mediterranean forests (habitat code 91Aa*): A threshold assessment. Ann. Bot. 2020, 10, 33–54. [Google Scholar] [CrossRef]
  67. Prausová, R.; Doležal, J.; Rejmánek, M. Nine decades of major compositional changes in a Central European beech forest protected area. Plant Ecol. 2020, 221, 1005–1016. [Google Scholar] [CrossRef]
  68. Peppler-Lisbach, C.; Stanik, N.; Könitz, N.; Rosenthal, G. Long-term vegetation changes in Nardus grasslands indicate eutrophication, recovery from acidification, and management change as the main drivers. Appl. Veg. Sci. 2020, 23, 508–521. [Google Scholar] [CrossRef]
  69. Bauer, M.; Albrecht, H. Vegetation monitoring in a 100-year-old calcareous grassland reserve in Germany. Basic Appl. Ecol. 2020, 42, 15–26. [Google Scholar] [CrossRef]
  70. Hollmann, V.; Donath, T.W.; Grammel, F.; Himmighofen, T.; Zerahn, U.; Leyer, I. From nutrients to competition processes: Habitat specific threats to Arnica montana L. populations in Hesse, Germany. PLoS ONE 2020, 15, e0233709. [Google Scholar] [CrossRef]
  71. Mazalla, L.; Ludwig, G.; Peppler-Lisbach, C. Nardus grasslands and wet heaths are affected differently by reintroduction of management and pH recovery. Tuexenia 2021, 41, 227–252. [Google Scholar] [CrossRef]
  72. Kaulfuß, F.; Rosbakh, S.; Reisch, C. Grassland restoration by local seed mixtures: New evidence from a practical 15-year restoration study. Appl. Veg. Sci. 2022, 25, e12652. [Google Scholar] [CrossRef]
  73. Cancellieri, L.; Rosati, L.; Brunetti, M.; Mancini, L.D.; Primi, R.; Ronchi, B.; Scoppola, A.; Filibeck, G. The dry grasslands of Abruzzo National Park, the oldest protected area in the Apennines (Central Italy): Overview of vegetation composition, syntaxonomy, ecology and diversity. Tuexenia 2020, 40, 547–571. [Google Scholar] [CrossRef]
  74. Löfgren, O.; Hall, K.; Schmid, B.C.; Prentice, H.C. Grasslands ancient and modern: Soil nutrients, habitat age and their relation to Ellenberg. N. J. Veg. Sci. 2020, 31, 367–379. [Google Scholar] [CrossRef]
  75. Kose, M.; Melts, I.; Heinsoo, K. Medicinal Plants in Semi-Natural Grasslands: Impact of Management. Plants 2022, 11, 353. [Google Scholar] [CrossRef]
  76. Uogintas, D.; Rašomavičius, V. Impact of Short-Term Abandonment on the Structure and Functions of Semi-Natural Dry Grasslands. Botanica 2020, 26, 40–48. [Google Scholar] [CrossRef]
  77. Mašková, T.; Maternová, J.; Těšitel, J. Shoot: Root ratio of seedlings is associated with species niche on soil moisture gradient. Plant Biol. 2021, 24, 286–291. [Google Scholar] [CrossRef] [PubMed]
  78. Hegedüšová, K.; Korzeniak, J.; Májeková, J.; Stoica, A.; Coldea, G.; Kuzemko, A.; Budzhak, V.; Tokaryuk, A.; Chorney, I.; Škodová, I. Syntaxonomical revision of the Triseto flavescentis-Polygonion bistortae alliance in the Carpathians. Plant Biosyst. Int. J. Deal. All Asp. Plant Biol. 2020, 155, 16–41. [Google Scholar] [CrossRef]
  79. Huseyinova, R. Ellenberg Indicator Values (EIVs) in Different Plant Communities in Subalpine Grasslands of the Giresun Mountains (Turkey). Russ. J. Ecol. 2021, 52, 223–229. [Google Scholar] [CrossRef]
  80. Skálová, H.; Hadincová, V.; Krahulec, F.; Pecháčková, S.; Herben, T. Dynamics of a mountain grassland: Environment predicts long-term trends, while species’ traits predict short-term fluctuations. J. Veg. Sci. 2022, 33, e13138. [Google Scholar] [CrossRef]
  81. Oroian, S.; Sămărghiţan, M.; Domokos, E. Plant Associations of Petasition officinalis Alliance in the East Carpathians (Călimani and Gurghiu Mountains Romania). In Tools for Landscape-Scale Geobotany and Conservation; Springer: Cham, Switzerland, 2021; pp. 205–229. [Google Scholar] [CrossRef]
  82. Lengyel, A.; Swacha, G.; Botta-Dukát, Z.; Kącki, Z. Trait-based numerical classification of mesic and wet grasslands in Poland. J. Veg. Sci. 2020, 31, 319–330. [Google Scholar] [CrossRef] [Green Version]
  83. Łuszczyński, J.; Adamska, E.; Wojciechowska, A.; Czerwik-Marcinkowska, J. Diversity Patterns of Macrofungi in Xerothermic Grasslands from the Nida Basin (Małopolska Upland, Southern Poland): A Case Study. Biology 2022, 11, 531. [Google Scholar] [CrossRef] [PubMed]
  84. Wójcik, T.; Ziaja, M. Abundance and conservation status of Rosa gallica in Strzyżów Foothills (SE Poland). Ecol. Quest. 2022, 33, 83–90. [Google Scholar] [CrossRef]
  85. Ahl, L.; Aas, G.; Walentowski, H.; Höltken, A.M.; Feulner, M. Niche differentiation between Malus sylvestris and its hybrid with Malus domestica indicated by plant community, soil and light. J. Veg. Sci. 2021, 32, e13078. [Google Scholar] [CrossRef]
  86. Cîșlariu, A.G.; Mânzu, C.C.; Baltag, E. Which are the drivers that influence the performance of Ligularia sibirica populations from Romania? Plant Biosyst. Int. J. Deal. All Asp. Plant Biol. 2021, 155, 394–405. [Google Scholar] [CrossRef]
  87. Jochner-Oette, S.; Rohrer, T.; Eisen, A.-K.; Tönnes, S.; Stammel, B. Influence of Forest Stand Structure and Competing Understory Vegetation on Ash Regeneration—Potential Effects of Ash Dieback. Forests 2021, 12, 128. [Google Scholar] [CrossRef]
  88. Hoffmann, M.H.; Gebauer, S.; Lühmann, R. Root anatomy predicts ecological optima in Carex (Cyperaceae) in terms of Ellenberg indicator values. Ecol. Indic. 2021, 129, 107979. [Google Scholar] [CrossRef]
  89. Novakovskaya, I.V.; Dubrovskiy, Y.A.; Patova, E.N.; Novakovskiy, A.B.; Sterlyagova, I.N. Influence of ecological factors on soil algae in different types of mountain tundra and sparse forests in the Northern Urals. Phycologia 2020, 59, 320–329. [Google Scholar] [CrossRef]
  90. Fanfarillo, E.; Latini, M.; Iberite, M.; Bonari, G.; Nicolella, G.; Rosati, L.; Salerno, G.; Abbate, G. The segetal flora of winter cereals and allied crops in Italy: Species inventory with chorological, structural and ecological features. Plant Biosyst. Int. J. Deal. All Asp. Plant Biol. 2020, 154, 935–946. [Google Scholar] [CrossRef]
  91. Paal, T.; Zobel, K.; Liira, J. Standardized response signatures of functional traits pinpoint limiting ecological filters during the migration of forest plant species into wooded corridors. Ecol. Indic. 2020, 108, 105688. [Google Scholar] [CrossRef]
  92. Skrajna, T.; Bogusz, A. Floral diversity of plant communities in field balks. Stud. Quat. 2020, 37, 45–50. [Google Scholar] [CrossRef]
  93. Glaser, M.; Berg, C.; Buldrini, F.; Buholzer, S.; Bürger, J.; Chiarucci, A.; Chytrý, M.; Dřevojan, P.; Follak, S.; Küzmič, F.; et al. AgriWeedClim database: A repository of vegetation plot data from Central European arable habitats over 100 years. Appl. Veg. Sci. 2022, 25, e12675. [Google Scholar] [CrossRef]
  94. Fratarcangeli, C.; Fanelli, G.; Testolin, R.; Buffi, F.; Travaglini, A. Floristic changes of vascular flora in the city of Rome through grid-cell census over 23 years. Urban Ecosyst. 2022, 25, 1851–1864. [Google Scholar] [CrossRef]
  95. Świerkosz, K.; Reczyńska, K. Differentiation of natural scrub communities of the Cotoneastro-Amelanchieretum group in Central Europe. PLoS ONE 2022, 17, e0266868. [Google Scholar] [CrossRef]
  96. Tyler, T.; Herbertsson, L.; Olofsson, J.; Olsson, P.A. Ecological indicator and traits values for Swedish vascular plants. Ecol. Indic. 2021, 120, 106923. [Google Scholar] [CrossRef]
  97. Jiménez-Alfaro, B.; Carlón, L.; Fernández-Pascual, E.; Acedo, C.; Alfaro-Saiz, E.; Redondo, R.A.; Cires, E.; Mazuelas, F.D.E.; Del Río, S.; Gonz´alez, T.E.D.; et al. Checklist of the vascular plants of the Cantabrian Mountains. Mediterr. Bot. 2021, 42, e74570. [Google Scholar] [CrossRef]
  98. Sizonenko, T.A.; Dubrovskiy, Y.A.; Novakovskiy, A.B. Changes in mycorrhizal status and type in plant communities along altitudinal and ecological gradients—A case study from the Northern Urals (Russia). Mycorrhiza 2020, 30, 445–454. [Google Scholar] [CrossRef] [PubMed]
  99. Bähner, K.W.; Tabarelli, M.; Büdel, B.; Wirth, R. Habitat fragmentation and forest management alter woody plant communities in a Central European beech forest landscape. Biodivers. Conserv. 2020, 29, 2729–2747. [Google Scholar] [CrossRef]
  100. Klynge, D.; Svenning, J.-C.; Skov, F. Floristic changes in the understory vegetation of a managed forest in Denmark over a period of 23 years–Possible drivers of change and implications for nature and biodiversity conservation. For. Ecol. Manag. 2020, 466, 118128. [Google Scholar] [CrossRef]
  101. Kowalska, A. Neofityzacja łęgów jesionowo-wiązowych w dolinach polskich rzek = Neophyte-induced degradation of Poland’s riparian hardwood forests. Prz. Geogr. 2020, 92, 327–340. [Google Scholar] [CrossRef]
  102. Mikulová, K.; Jarolímek, I.; Šibík, J.; Bacigál, T.; Šibíková, M. Long-Term Changes of Softwood Floodplain Forests—Did the Disappearance of Wet Vegetation Accelerate the Invasion Process? Forests 2020, 11, 1218. [Google Scholar] [CrossRef]
  103. Kaiser, T.; Ahlborn, J. Long-term vegetation monitoring in the floodplain grasslands of the lower Havel Valley (northeastern Germany) and conclusions for sustainable management practices. J. Nat. Conserv. 2021, 63, 126053. [Google Scholar] [CrossRef]
  104. Rendeková, A.; Miškovic, J.; Mičieta, K.; Michalová, M.; Eliašová, M.; Ballová, D. Changes in the Diversity of Dry Calcareous Grasslands After Abandonment of Traditional Management in Devínska Kobyla National Nature Reserve (Southwestern Slovakia, Central Europe). Ekológia 2020, 39, 101–115. [Google Scholar] [CrossRef]
  105. Mazalla, L.; Diekmann, M.; Duprè, C. Microclimate shapes vegetation response to drought in calcareous grasslands. Appl. Veg. Sci. 2022, 25, e12672. [Google Scholar] [CrossRef]
  106. Ziaja, M.; Wójcik, T.; Wrzesień, M. Phytosociological Data in Assessment of Anthropogenic Changes in Vegetation of Rzeszów Reservoir. Sustainability 2021, 13, 9071. [Google Scholar] [CrossRef]
  107. Smith, P.H.; Lockford, P. Fifteen years of habitat, floristic and vegetation change on a pioneer sand-dune and slack system at Ainsdale, north Merseyside, UK. Br. Ir. Bot. 2021, 3. [Google Scholar] [CrossRef]
  108. Blaus, A.; Reitalu, T.; Poska, A.; Vassiljev, J.; Veski, S. Mire plant diversity change over the last 10,000 years: Importance of isostatic land uplift, climate and local conditions. J. Ecol. 2021, 109, 3634–3651. [Google Scholar] [CrossRef]
  109. Hájek, M.; Horsáková, V.; Hájková, P.; Coufal, R.; Dítě, D.; Němec, T.; Horsák, M. Habitat extremity and conservation management stabilise endangered calcareous fens in a changing world. Sci. Total. Environ. 2020, 719, 134693. [Google Scholar] [CrossRef] [PubMed]
  110. Aikio, S.; Ramula, S.; Muola, A.; Von Numers, M. Island properties dominate species traits in determining plant colonizations in an archipelago system. Ecography 2020, 43, 1041–1051. [Google Scholar] [CrossRef] [Green Version]
  111. Dudáš, M.; Slezák, M.; Hrivnák, R. Distribution, ecology and vegetation affinity of bog arum (Calla palustris) in Slovakia. Biologia 2021, 76, 2021–2029. [Google Scholar] [CrossRef]
  112. Wittig, B.; Müller, J.; Quast, R.; Miehlich, H. Arnica montana in Calluna vulgaris-heathlands on the firing range Unterlüß (Lower Saxony). Tuexenia 2020, 40, 131–146. [Google Scholar] [CrossRef]
  113. Petersson, L.; Nilsson, S.; Holmström, E.; Lindbladh, M.; Felton, A. Forest floor bryophyte and lichen diversity in Scots pine and Norway spruce production forests. For. Ecol. Manag. 2021, 493, 119210. [Google Scholar] [CrossRef]
  114. Pasta, S.C.; La Rosa, A.; Garfì, G.; Marcenò, C.; Gristina, A.S.; Carimi, F.; Guarino, R. An Updated Checklist of the Sicilian Native Edible Plants: Preserving the Traditional Ecological Knowledge of Century-Old Agro-Pastoral Landscapes. Front. Plant Sci. 2020, 11. [Google Scholar] [CrossRef]
  115. Kutbay, H.G.; Sürmen, B. Ellenberg ecological indicator values, tolerance values, species niche models for soil nutrient availability, salinity, and pH in coastal dune vegetation along a landward gradient (Euxine, Turkey). Turk. J. Bot. 2022, 46, 346–360. [Google Scholar] [CrossRef]
  116. Ballelli, S.; Tardella, F.M.; Pennesi, R.; Panichella, T.; Bricca, A.; Vitanzi, A.; Catorci, A. Contribution to the knowledge of the non-calcareous grasslands of the Monti Sibillini National Park (central Italy): Coenological structure, syntaxonomy, ecology, and floristic aspects. Hacquetia 2022, 21, 41–72. [Google Scholar] [CrossRef]
  117. Dítě, D.; Šuvada, R.; Kliment, J.; Dítě, Z. Vegetation of temperate inland salt marshes on their north-western border (North German Plain). Preslia 2022, 94, 111–141. [Google Scholar] [CrossRef]
  118. Tomaselli, M.; Carbognani, M.; Foggi, B.; Adorni, M.; Petraglia, A.; Forte, T.G.W.; Segadelli, S.; Rossi, G.; Gennai, M. Scree vegetation in the northern Apennines (N-Italy). Phytocoenologia 2021, 51, 39–94. [Google Scholar] [CrossRef]
  119. Paal, J.; Jürjendal, I. Diversity of old-drained forests in Estonia. Balt. For. 2020, 26, 40–53. [Google Scholar] [CrossRef]
  120. Dwyer, C.; Millett, J.; Pakeman, R.J.; Jones, L. Environmental modifiers of the relationship between water table depth and Ellenberg’s indicator of soil moisture. Ecol. Indic. 2021, 132, 108320. [Google Scholar] [CrossRef]
  121. Simmel, J.; Ahrens, M.; Poschlod, P. Ellenberg N values of bryophytes in Central Europe. J. Veg. Sci. 2021, 32, e12957. [Google Scholar] [CrossRef]
  122. Lukovičová, M.; Balanac, Z.; David, S. Changes in Habitat Conditions of Invaded Forest Communities in Podunajská Nížina and the Impact of Non-Native Species on Biodiversity (SW Slovakia). Ekológia 2021, 40, 364–378. [Google Scholar] [CrossRef]
  123. Testi, A.; Fanelli, G.; Nicola, C.D.; D’Angeli, D.N.; Sanctis, M.D. Can ecoindicators be a tool to reduce and understand complexity of plant communities? Flora Mediterr. 2021, 31, 317–337. [Google Scholar] [CrossRef]
  124. Bruelheide, H.; Jansen, F.; Jandt, U.; Bernhardt-Römermann, M.; Bonn, A.; Bowler, D.; Dengler, J.; Eichenberg, D.; Grescho, V.; Harter, D.; et al. Using incomplete floristic monitoring data from habitat mapping programmes to detect species trends. Divers. Distrib. 2020, 26, 782–794. [Google Scholar] [CrossRef]
  125. Weldon, J.; Merder, J.; Ferretti, M.; Grandin, U. Nitrogen deposition causes eutrophication in bryophyte communities in central and northern European forests. Ann. For. Sci. 2022, 79, 1–14. [Google Scholar] [CrossRef]
  126. Šipek, M.; Šajna, N.; Kosić, I.V.; Horvat, E. Presence of alien Prunus serotina and Impatiens parviflora in lowland forest fragments in NE Slovenia. Šumar. List 2022, 146, 215–222. [Google Scholar] [CrossRef]
  127. Stanojevic, M.; Trailovic, M.; Dubljanin, T.; Krivošej, Z.; Nikolic, M.; Nikolic, N. Sewage Pollution Promotes the Invasion-Related Traits of Impatiens glandulifera in an Oligotrophic Habitat of the Sharr Mountain (Western Balkans). Plants 2021, 10, 2814. [Google Scholar] [CrossRef]
  128. Gao, J.; Faheem, M.; Yu, X. Global Research on Contaminated Soil Remediation: A Bibliometric Network Analysis. Land 2022, 11, 1581. [Google Scholar] [CrossRef]
  129. Alavi, S.J.; Veiskarami, R.; Esmailzadeh, O.; Gadow, K.V. Analyzing the Biological and Structural Diversity of Hyrcanian Forests Dominated by Taxus baccata L. Forests 2020, 11, 701. [Google Scholar] [CrossRef]
  130. Tan, L.; Zhang, P.; Zhao, X.; Fan, C.; Zhang, C.; Yan, Y. Von Gadow, K. Analysing species abundance distribution patterns across sampling scales in three natural forests in Northeastern China. iForest Biogeosci. For. 2020, 13, 482–489. [Google Scholar] [CrossRef]
  131. Ivanova, N. Forest typological features of herb species abundance distributions of pine forests in the Ural Mountains. In Proceedings of the BIO Web of Conferences: Northern Asia Plant Diversity: Current Trends in Research and Conservation, Novosibirsk, Russia, 6–12 September 2021; Volume 38, p. 00047. [Google Scholar] [CrossRef]
  132. Ivanova, N.; Petrova, I. Species abundance distributions: Investigation of adaptation mechanisms of plant communities. In E3S Web of Conferences: International Scientific and Practical Conference “Fundamental and Applied Research in Biology and Agriculture: Current Issues, Achievements and Innovations” (FARBA 2021); EDP Sciences: Les Ulis, France, 2021; Volume 254, p. 02003. [Google Scholar] [CrossRef]
  133. Van Sundert, K.; Radujković, D.; Cools, N.; De Vos, B.; Etzold, S.; Fernández-Martínez, M.; Janssens, I.A.; Merilä, P.; Peñuelas, J.; Sardans, J.; et al. Towards comparable assessment of the soil nutrient status across scales—Review and development of nutrient metrics. Glob. Chang. Biol. 2020, 26, 392–409. [Google Scholar] [CrossRef] [PubMed]
  134. Blumenthal, D.; Mitchell, C.E.; Pyšek, P.; Jarošík, V. Synergy between pathogen release and resource availability in plant invasion. Proc. Natl. Acad. Sci. 2009, 106, 7899–7904. [Google Scholar] [CrossRef] [Green Version]
  135. Song, Y.; Yan, E.; Song, K. Synthetic comparison of eight dynamics plots in evergreen broadleaf forests, China. Biodivers. Sci. 2015, 23, 139–148. [Google Scholar] [CrossRef]
  136. Wittig, R. Shared species of the spontaneous flora of a West African (Burkina Faso) and a Central European country (Germany). Flora Veg. Sudano Sambesica 2015, 18, 21–27. [Google Scholar] [CrossRef]
  137. Ivanova, N.; Tantsyrev, N.; Li, G. Regeneration of Pinus sibirica Du Tour in the Mountain Tundra of the Northern Urals against the Background of Climate Warming. Atmosphere 2022, 13, 1196. [Google Scholar] [CrossRef]
  138. Fomin, V.; Mikhailovich, A.; Golikov, D.; Agapitov, E. Reconstruction of the Expansion of Siberian Larch into the Mountain Tundra in the Polar Urals in the 20th—Early 21st Centuries. Forests 2022, 13, 419. [Google Scholar] [CrossRef]
  139. Moiseev, P.A.; Hagedorn, F.; Balakin, D.S.; Bubnov, M.O.; Devi, N.M.; Kukarskih, V.V.; Mazepa, V.S.; Viyukhin, S.O.; Viyukhina, A.A.; Grigoriev, A.A. Stand Biomass at Treeline Ecotone in Russian Subarctic Mountains Is Primarily Related to Species Composition but Its Dynamics Driven by Improvement of Climatic Conditions. Forests 2022, 13, 254. [Google Scholar] [CrossRef]
  140. Guisan, A.; Petitpierre, B.; Brönnimann, O.; Daehler, C.; Kueffer, C. Unifying niche shift studies: Insights from biological invasions. Trends Ecol. Evol. 2014, 29, 260–269. [Google Scholar] [CrossRef] [PubMed] [Green Version]
  141. Owens, H.L.; Ribeiro, V.; Saupe, E.E.; Cobos, M.E.; Hosner, P.A.; Cooper, J.C.; Samy, A.M.; Barve, V.; Barve, N.; Muñoz-R., C.J.; et al. Acknowledging uncertainty in evolutionary reconstructions of ecological niches. Ecol. Evol. 2020, 10, 6967–6977. [Google Scholar] [CrossRef]
  142. Peterson, A.T. Ecological niche conservatism: A time-structured review of evidence. J. Biogeogr. 2011, 38, 817–827. [Google Scholar] [CrossRef]
  143. Atwater, Z.D.; Barney, J.N. Climatic Niche Shifts in 815 Introduced Plant Species Affect their Predicted Distributions. Glob. Ecol. Biogeogr. 2021, 30, 1671–1684. [Google Scholar] [CrossRef]
  144. Liu, C.; Wolter, C.; Courchamp, F.; Roura-Pascual, N.; Jeschke, J.M. Biological invasions reveal how niche change affects the transferability of species distribution models. Ecology 2022, 103, e3719. [Google Scholar] [CrossRef]
  145. Pearson, D.E.; Ortega, Y.K.; Eren, Ö.; Hierro, J.L. Community Assembly Theory as a Framework for Biological Invasions. Trends Ecol. Evol. 2018, 33, 313–325. [Google Scholar] [CrossRef] [PubMed]
  146. Marin, P.; Genitoni, J.; Barloy, D.; Maury, S.; Gibert, P.; Ghalambor, C.K.; Vieira, C. Biological invasion: The influence of the hidden side of the (epi)genome. Funct. Ecol. 2020, 34, 385–400. [Google Scholar] [CrossRef] [Green Version]
  147. Kusbach, A.; Friedl, M.; Zouhar, V.; Mikita, T.; Šebesta, J. Assessing Forest Classification in a Landscape-Level Framework: An Example from Central European Forests. Forests 2017, 8, 461. [Google Scholar] [CrossRef] [Green Version]
  148. Muldavin, E.H.; Addicott, E.; Hunter, J.T.; Lewis, D.; Faber-Langendoen, D. Australian vegetation classification and the International Vegetation Classification framework: An overview with case studies. Aust. J. Bot. 2021, 69, 339–356. [Google Scholar] [CrossRef]
  149. Ivanova, N.; Fomin, V.; Kusbach, A. Experience of Forest Ecological Classification in Assessment of Vegetation Dynamics. Sustainability 2022, 14, 3384. [Google Scholar] [CrossRef]
Figure 1. Geography of the use of Ellenberg indicator values in modern research: 1–31—the number of studies over the past 3 years based on Ellenberg indicator values.
Diversity 15 00014 g001
Figure 2. Paper ranker distribution on the basis of “citing”.
Diversity 15 00014 g002
Table 1. Criteria used to data extraction.
Extraction CriteriaExplanatory Information; Research Objective
Publication yearFrom 2020–2022
Country of research siteAcross the globe; identify the geographical distribution of researches.
Countries of co-authorsAcross the globe; analysis of country cooperation network.
Type of plant community under researchNo restrictions on the plant community type; analysis of distribution by plant communities types and identification of priorities.
Research scope of applicationIdentification of the range of tasks that were solved on the basis of Ellenberg indicator values and analysis of hot research topics.
AnnotationIn English; quick introduction to the methodology and results.
Link to the Internet pageIn-depth study of research aim, methods and results.
KeywordsIn English; identification of the range of tasks that were solved on the basis of Ellenberg indicator values and analysis of hot research topics.
Citing by ScopusIdentification of the most significant documents.
Table 2. Main directions of conducted studies over the last 3 years based on Ellenberg indicator values.
Research DirectionsNumber of Studies
Assessment of vegetation dynamics,
influence of various factors on plants
28
Analysis of growing conditions, ecological niches19
Determination of ecological groups of species, vegetation classification and ordination of plant communities according to environmental factors16
Relationship between environmental characteristics and ecological indicators;
improving Ellenberg indicator values
8
Improving ecosystem assessment methodologies5
Effect of nitrogen deposition on vegetation4
Relationship between plant characteristics and ecological indicators3
Monitoring of invasive plant species3
Table 3. Top 7 papers based on Ellenberg indicator values by the number of citing over the last 3 years.
Paper RankerNumber of CitationsAuthors, YearResearch Topics of Ellenberg
Indicator Values
Journal
122Van Sundert et al., 2020 [133]Potential of soil-, plant-, and remote sensing-based metrics to compare the nutrient status across space.Global Change
Biology
215Hájek et al., 2020 [109]Dynamics of plant communities.Science of the
Total Environment
3–414Tyler et al., 2021 [96]Improvement of Ellenberg indicator values.Ecological
Indicators
3–414Rehling et al., 2021 [43]Selection of plants with different indicator values for the experiment.Journal of Ecology
5–613Dietz et al., 2020 [59]Dynamics of plant communities.Global Ecology and Biogeography
5–613Descombes et al., 2020 [13]Spatial modeling of ecological indicator values.Ecography
712Sun et al., 2020 [42]Selection of plants with different indicator values for the experiment.Functional Ecology
Disclaimer/Publisher’s Note: The statements, opinions and data contained in all publications are solely those of the individual author(s) and contributor(s) and not of MDPI and/or the editor(s). MDPI and/or the editor(s) disclaim responsibility for any injury to people or property resulting from any ideas, methods, instructions or products referred to in the content.

