Article

Mapping Ecological Units in Mesophotic Coral Ecosystems of San Andrés Island (Southwestern Caribbean)

by
Katherine Mejía-Quintero
*,
Cristina Cedeño-Posso
,
Santiago Millán
and
Luis Chasqui
Biodiversity and Marine Ecosystem Research Program, Marine and Coastal Research Institute (INVEMAR), Santa Marta 470006, Colombia
*
Author to whom correspondence should be addressed.
Diversity 2022, 14(8), 679; https://doi.org/10.3390/d14080679
Submission received: 16 July 2022 / Revised: 5 August 2022 / Accepted: 11 August 2022 / Published: 19 August 2022
(This article belongs to the Special Issue Biodiversity of Mesophotic Ecosystems)

Abstract

:
To map ecological units in mesophotic coral ecosystems on the western side of San Andrés Island (Colombia) considering biotic components and geomorphic zonation among 30–140 m deep, 27 video transects were done using an ROV. In total, 14 h of video were recorded and 5742 still images were extracted from them, from which 753 met quality criteria for bottom coverage and organisms’ abundance estimations. These estimates were calculated from images through the Planar-Point Intercept method (PPI) using a 1 m × 0.5 m quadrant gridded 0.1 m × 0.1 m. CLUSTER, SIMPROF, and SIMPER analysis of benthic composition considering depth ranges in the group’s formation were done. The clusters formed were simplified and generalized using a color matrix to support the mapping process. Two geomorphological units were found, the deep reef terrace (30–60 m) and the reef slope (60–357 m), overlapping with five ecological units spanning 268 ha. The units Bioturbed sediments–Calcareous algae, Octocorals–Mixed corals, and Octocorals–Sponges sited on the deep reef terrace have been previously described in the shallow waters of the island, and the units Octocorals–Sponges–Antipatharians and Encrusting Sponges sited on the reef slope are described as new here. These findings contribute to the knowledge of Caribbean mesophotic coral ecosystems and are useful to update the Colombian coral reef atlas.

1. Introduction

The Mesophotic Coral Ecosystems (MCEs) are those usually found from 30 to over 150 m depth in tropical and subtropical waters, where light-dependent corals and associated communities are thriving with significant reduction in light penetration [1,2]. This kind of marine habitat has been around since the Silurian period, as suggested by recent studies on fossil reefs [3]. MCEs have received increased attention in the last decades due to the introduction of technical diving in scientific research allowing safe diving over 40 m deep, and the increasing availability of remotely operated vehicles—ROVs [4]. The global exploration of MCEs has exposed a great diversity of biological communities with high levels of endemism [5]. Moreover, MCEs have been considered fairly stable environments that rarely suffer from anthropogenic pressures [6]; therefore, they have been viewed as a kind of lifeboat habitat by acting as a refuge for species suffering multiple threats in shallow ecosystems, such as overfishing and increasing climate change-related stressors (e.g., coral bleaching), such that those “refugees” can act as seed sources for the maintenance or restoration of highly vulnerable shallow ecosystems and their wild populations [2,6,7]. However, several studies suggest that MCEs harbor populations that are genetically and physiologically different from those in shallow zones, even in species with wide bathymetric distribution [2,7], which deny the universality of the hypothesis of MCEs as “Deep reef refugia”.
On a global scale, the studies focused on contemporary MCE have been concentrated in four regions, with the Caribbean standing out in the number of recent publications with studies conducted in the Bahamas, Cayman Islands, Jamaica, and Puerto Rico, among others [8]. In Colombia, the knowledge on MCEs is very limited, with only seven publications to date [9,10,11,12,13,14]. Two of these studies were focused on MCE´s biodiversity of San Andrés Island (SAI), and report a considerable number of species of corals and sponges including new records for the island and for the Sea Flower Biosphere Reserve [11,13]. Aside from the relevant contribution from both works in terms of the MCE’s biodiversity knowledge, the work by Chasqui et al. [13] made an attempt to describe, for the first time in Colombia, the MCE in terms of ecological units.
An ecological unit of a seascape is defined by the biotic assemblages and the physical features that influence their distribution [15], such as geoforms, substrates, depth ranges, among others. These units are used as biodiversity surrogates that can be mapped and sampled in detail in a specific region, circumventing the difficulty of mapping on a species-by-species basis [16]. The ecological units maps are habitat maps that provide inventories of ecological units, their extension and location, promoting future detailed research on species composition and the monitoring of habitat changes [17]. The book Áreas Coralinas de Colombia [18] describes 11 shallow ecological units (<30 m) on SAI, out of 20 units described across Colombian Caribbean. In the ecological units map of San Andrés, the unit Agaricia spp.–Mixed Corals seems to cover the deeper areas (20–30 m) along the western side of the island, even extending to the slope area down to 50 m depth [18]. However, nothing is explained regarding the methods used to extend that unit to the mesophotic zone, but it seems that not enough sampling was done down to that depth, possibly due to decompression management limitations typical of the open-circuit scuba diving they used.
Considering the studies mentioned before and the recent availability of a 3D bathymetric model that allowed the identification and mapping of the reef slope, and deep reef terrace on SAI’s seabed, in this work we propose and delimit the MCE’s ecological units along the western side of the island, through the ROV scanning of benthic composition (substrate coverage and species abundance) of 30–140 m deep. The recognition of the MCE’s ecological units on SAI constitutes a starting point to include the MCE in the national scene, highlighting the urgent need to improve technological and financial capabilities to expand knowledge, regulation, and management to encompass the entire coral ecosystem. This study constitutes the first effort to recognize and map deep ecological units in Colombia, being a pilot for exploration in other areas of interest.

2. Materials and Methods
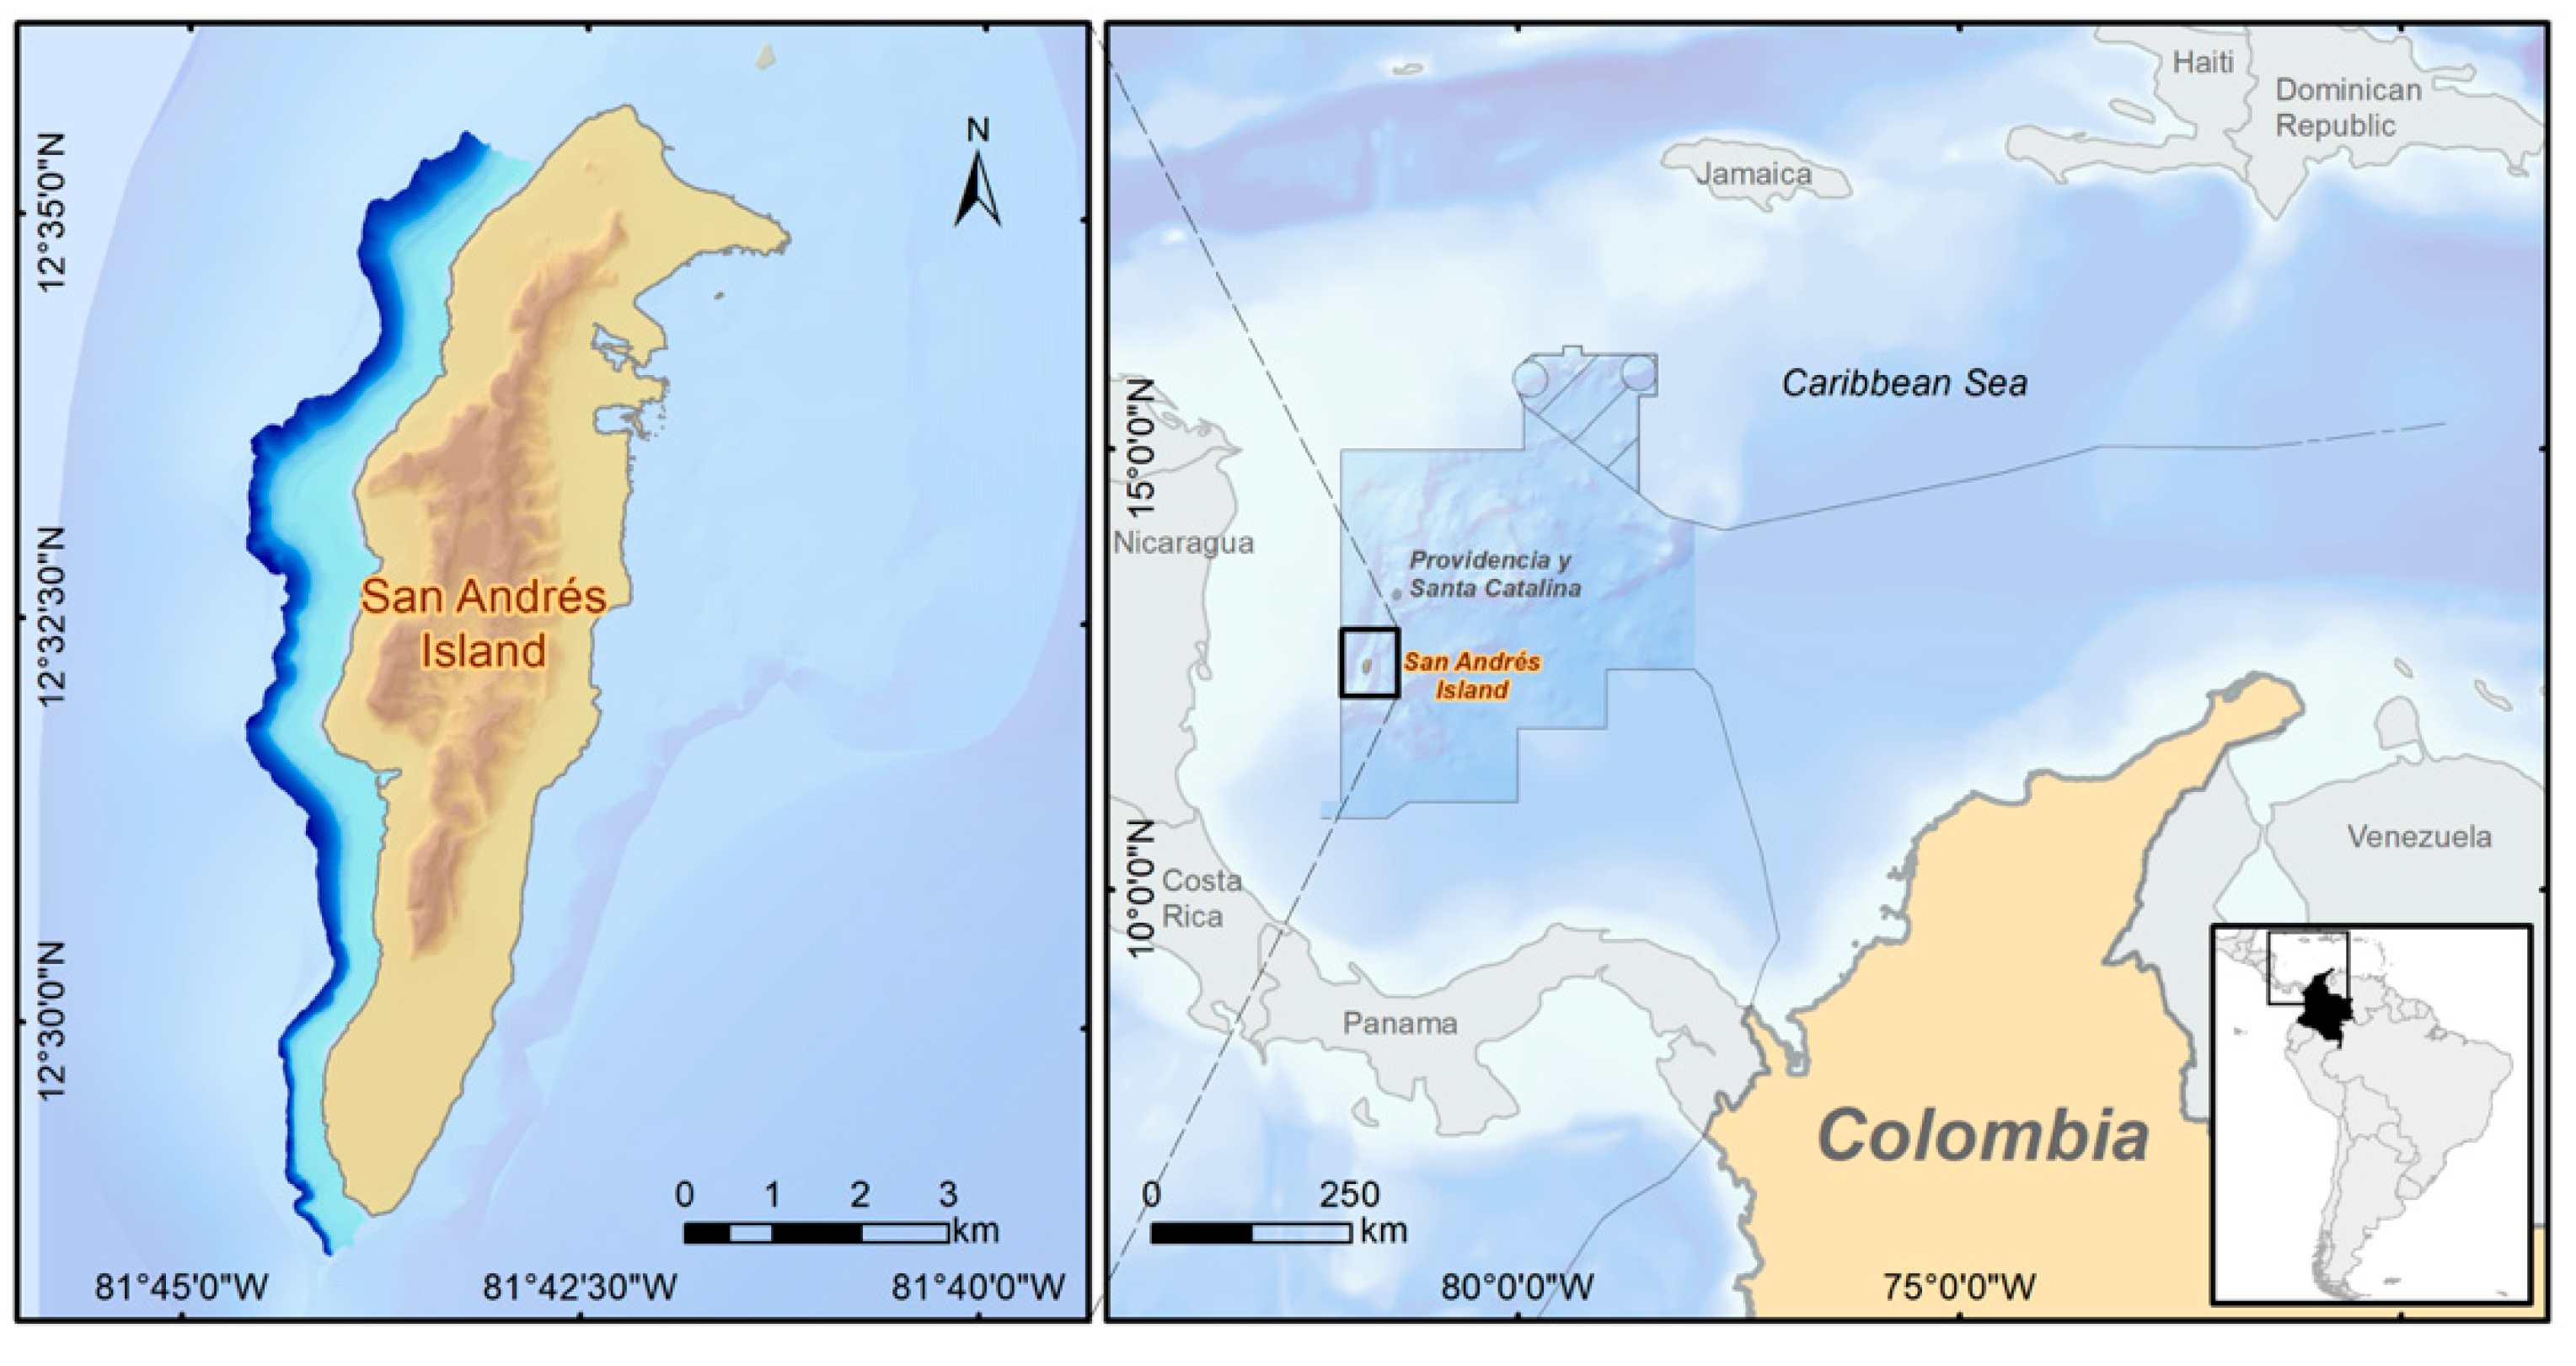
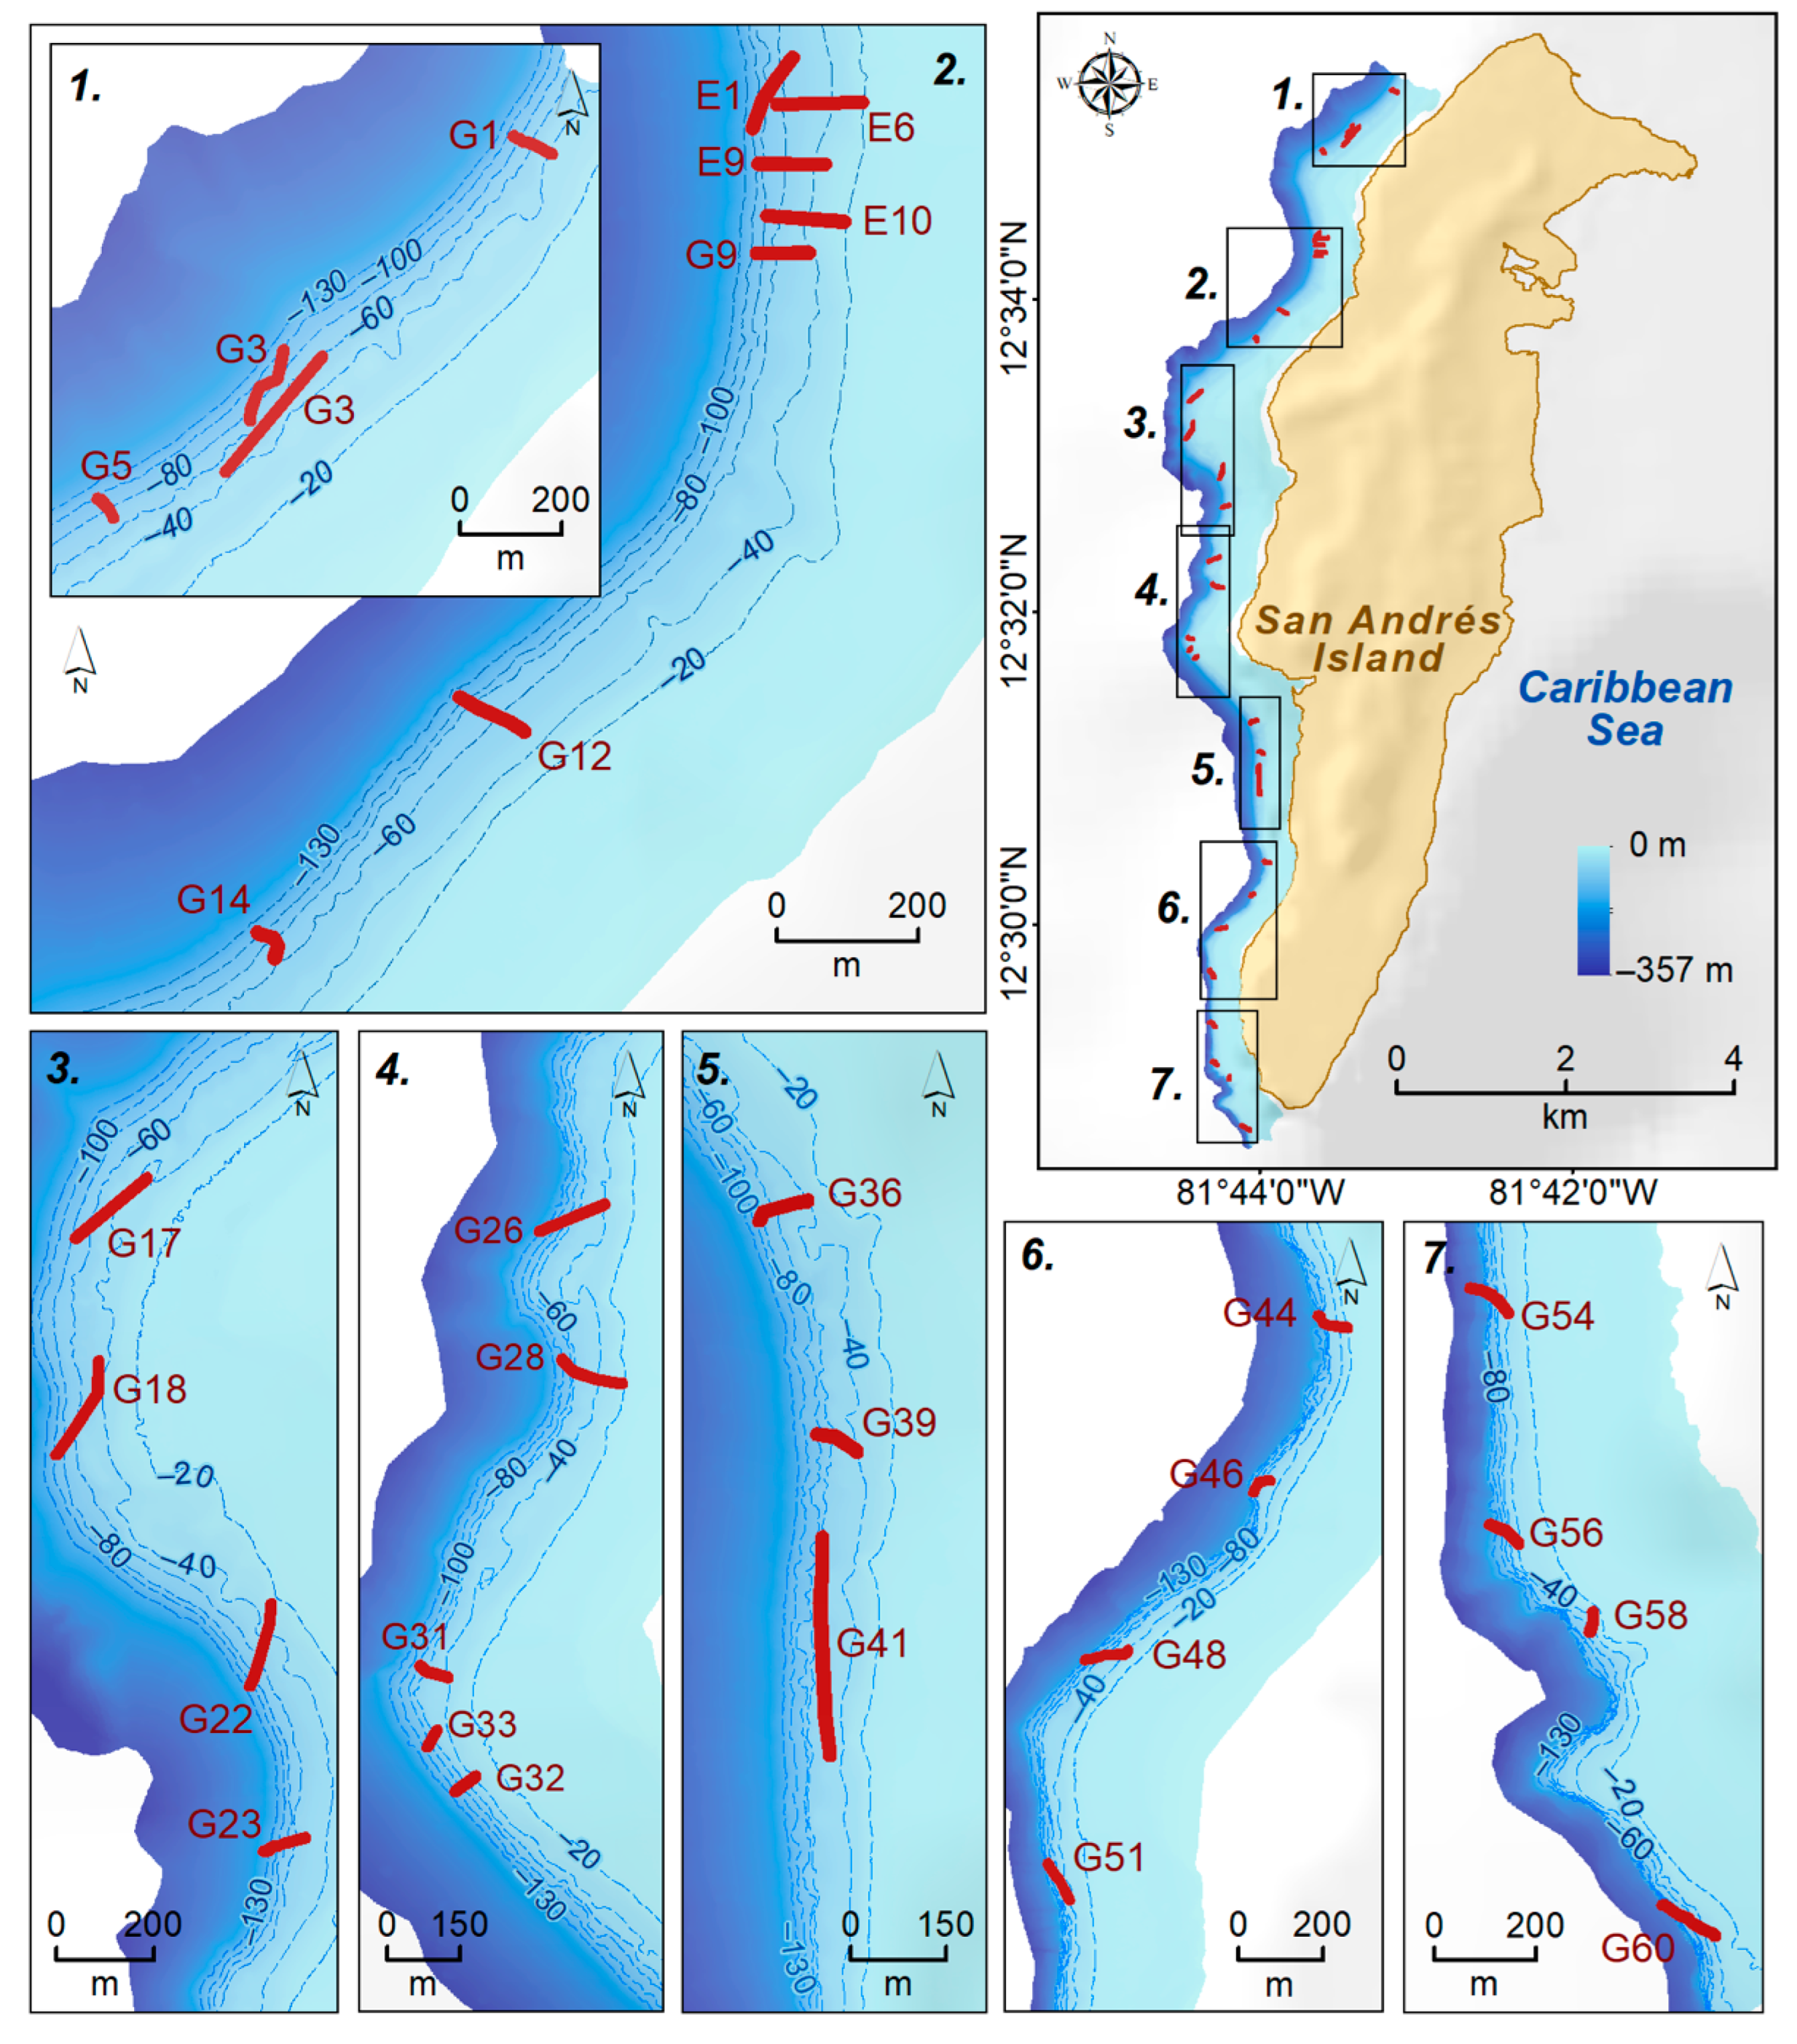
2.1. Study Area

San Andrés Island is located between 12°28′–12°37′ N and 81°39′–81°45′ W in the southwestern Caribbean ecoregion [19], about 700 km off the Colombian continental coast [18]. The island is elongated in shape, and at 12 km long and 4 km wide [18] is the largest island in the San Andrés, Providencia, and Santa Catalina archipelago, which is an assembly of islands, cays, and banks inside the Sea Flower Biosphere Reserve established in 2010. The eastern side of SAI is exposed to the prevailing winds and holds a well-studied barrier reef [18]. On the western side (Leeward) the platform is narrow and ends abruptly, falling almost vertically, such that the sea bottom deepens in several points more than 500 m very near to the coastline (Figure 1 [18]). This wall runs north–south along the island and is home to recently described communities of octocorals, black corals, and sponges in its upper zone [13].

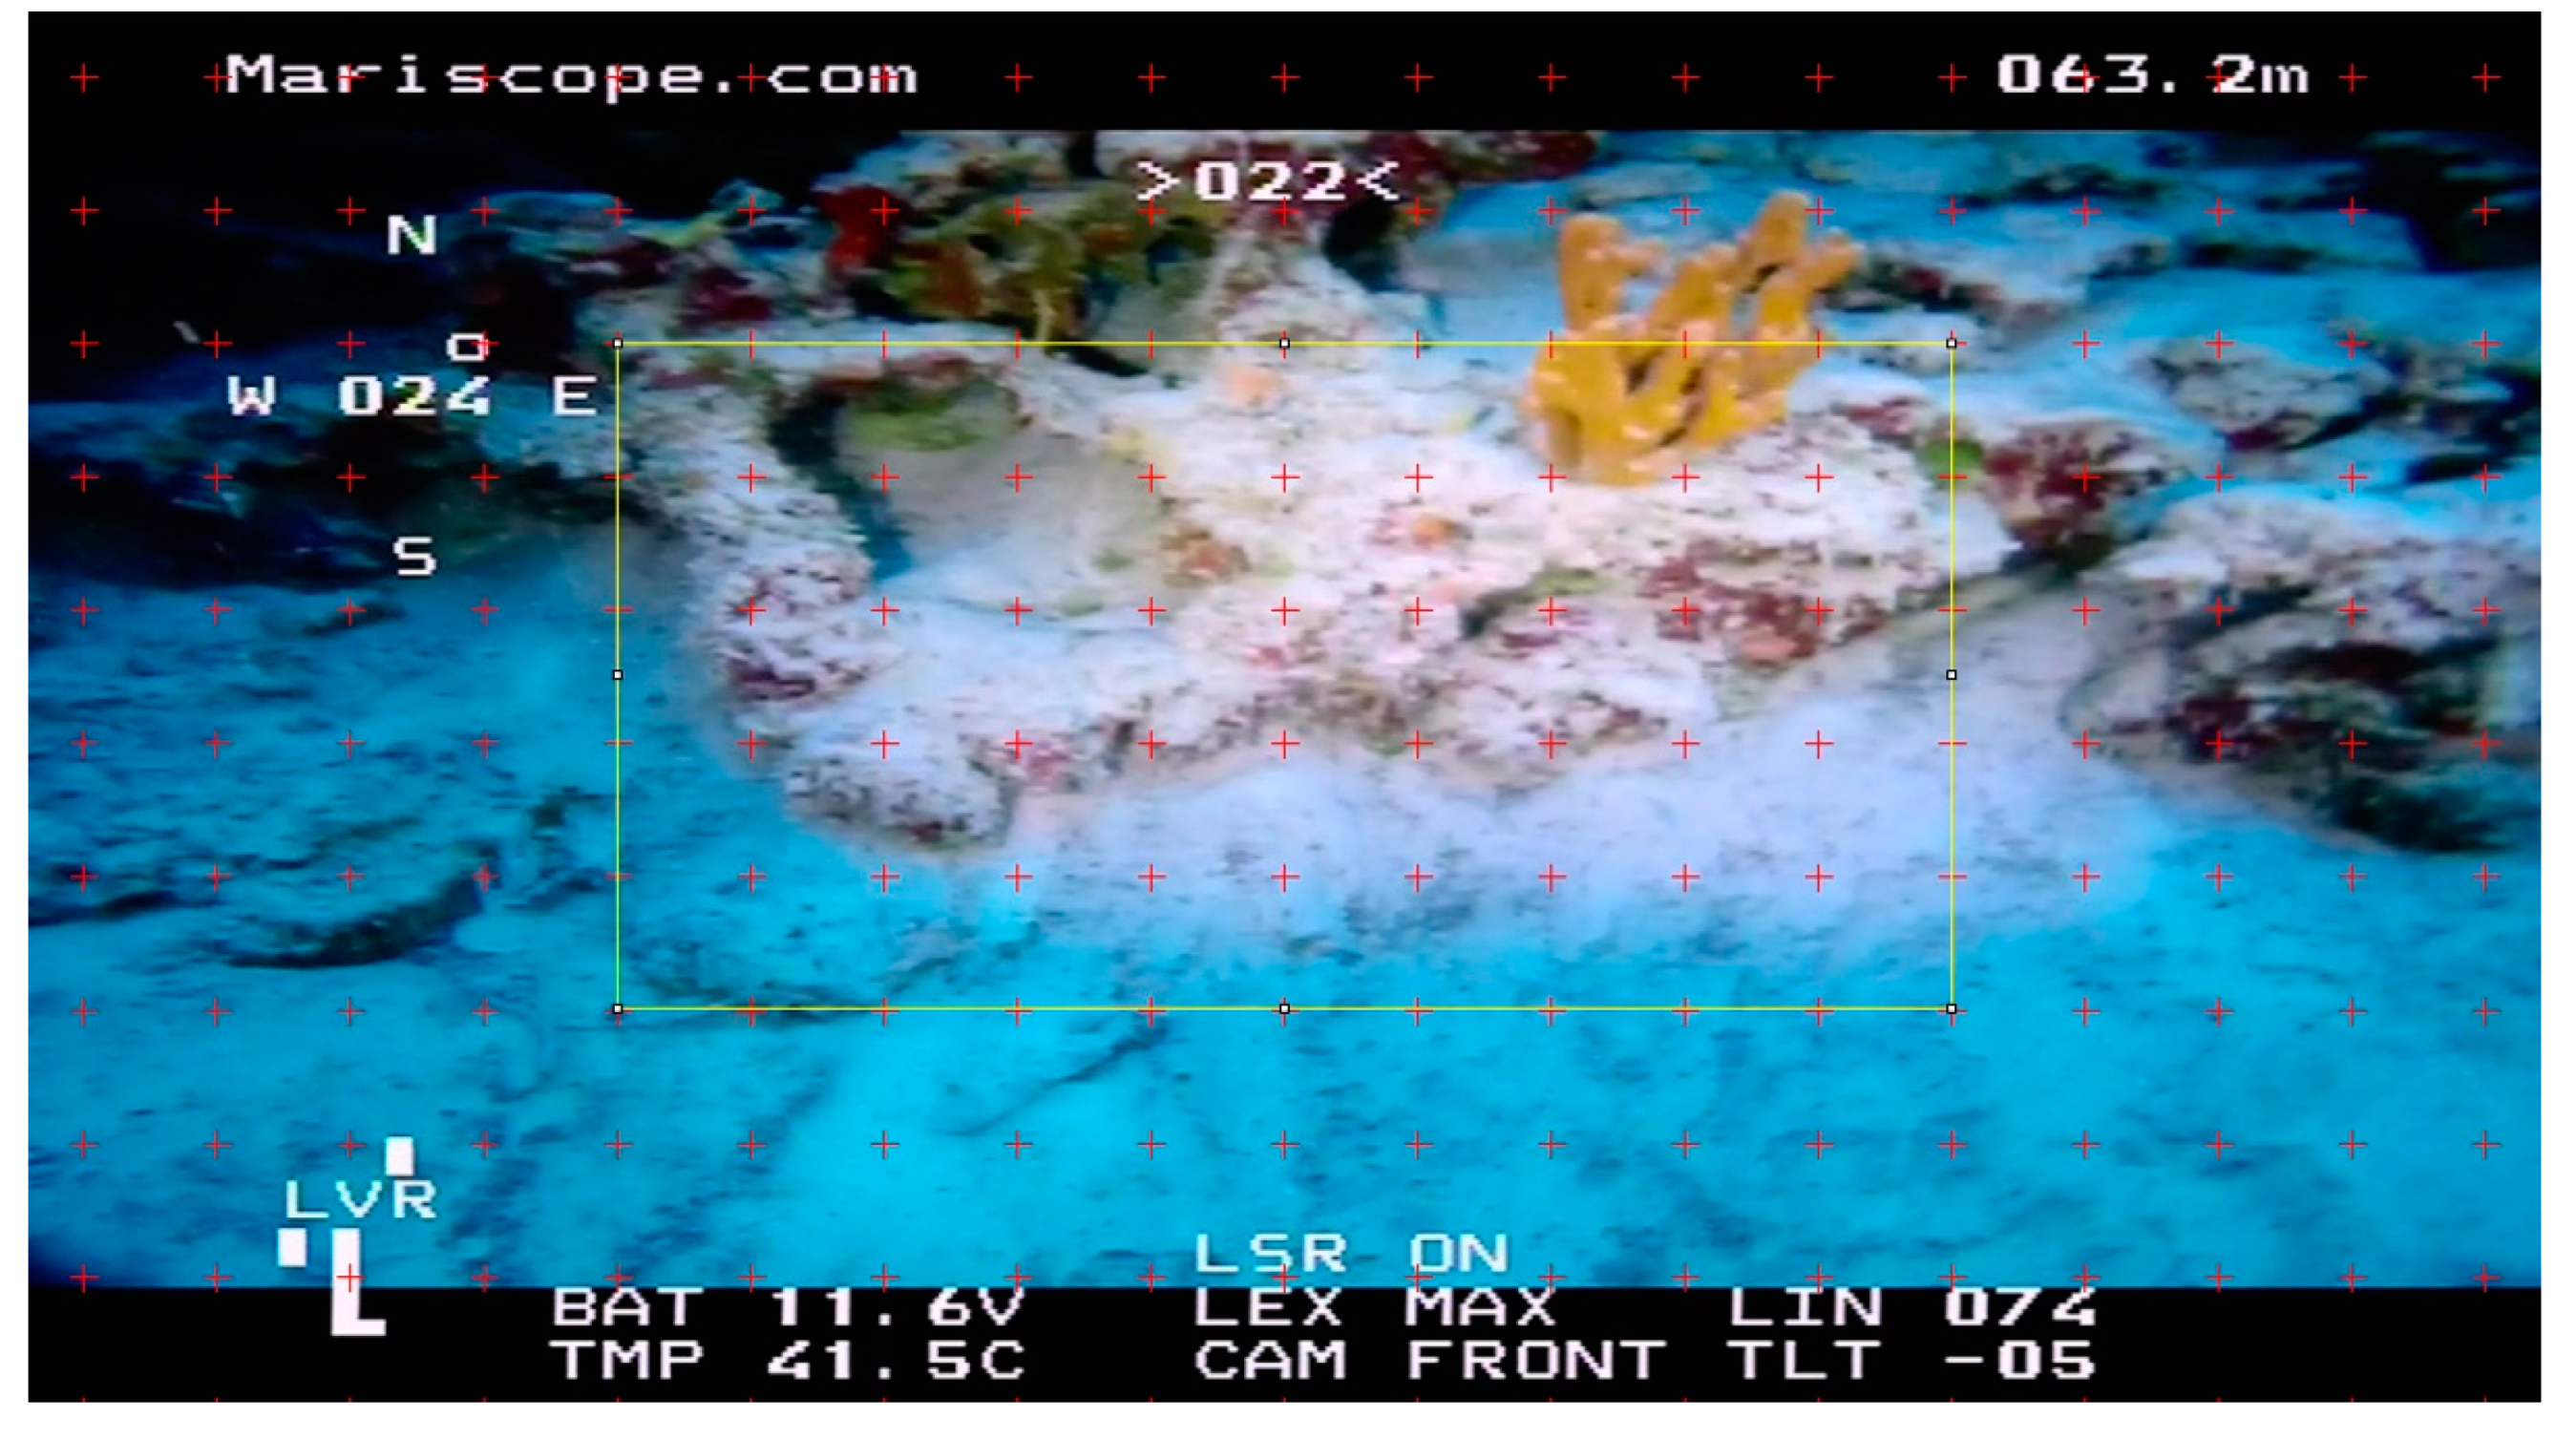
2.2. Data Acquisition

Considering the scarce biological information on the western side of SAI and the potential of the area for MCE study (30–150 m), an exploration using a remotely operated vehicle (ROV Eloy V) was carried out during September–October 2019. The ROV was equipped with three thrusters, a front high-definition digital video camera (Full HD/4K), high-output LED lights mounted on a tilt bar and 10 cm parallel lasers as a scale. The camera’s tilt angle pointed ~0° to view the vertical wall. The video recording has two options: (1) Full HD, and (2) low resolution allowing On-Screen Display (OSD) video overlay recording compass direction, ROV heading, and depth.
Due to the size of the sampling area, a partition into seven sectors was made for field data collection. A minimum of three video transects perpendicular to the coast were made along a depth gradient in each sector and were named as G_number and E_number (Figure 2). The video transects were made with the ROV used as a drift-cam due to the lack of a USBL (underwater positioning system), with the boat drifting by wind force (when wind was blowing from the west) and the bow pointing to the coast (west). In cases of unfavorable wind, the video transects were made parallel to the coast, managing to conserve the ROV as much as possible in the same depth but covering vast stretches along the wall.
Sites to make the transects were chosen based on the depth and topographic features of the bottom from the 3D bathymetric model, and according to weather conditions on the sampling date. The positioning of the video-transects was done from the surface, with the ROV remaining almost vertical under the boat, carefully controlling the tether length. In that way, when ROV reached the bottom or the wall at the desired depth and at a distance allowing for clear visualization of the substrate, the waypoint was logged in GPS and video recording started. The end of the transects was marked in GPS where the ROV stopped to emerge, according to the tether’s maximum length. Additionally, to improve the approximation from the surface to the real ROV path at the bottom (and positioning of video transects), the trajectory of the vessel was GPS tracked during the operation. The ROV diving data (e.g., site, start and end position and time, depth, direction, and length of the cable) for each video transect were entered in the field log. The videos were analyzed back at the office.
To map each video transect the starting point and trajectory were represented in poly-lines using the ArcGIS 10.6 software [20]. Video transects on Sector 2 were named E_number for their location in the vicinity of the massive island sewage outfall (Figure 2).

2.3. Analysis of Biological Data

2.3.1. Image Analysis and Processing

To define benthic habitats, we used still images taken from the video transects with the GOM player software, using 5 s as a timeframe to reduce autocorrelation between images [21,22]. Images from the water column, from the ROV chassis, and ones that were out of focus were omitted. Relevant information to define habitats was extracted from the images and recorded in a matrix: ROV depth, geoforms (deep reef terrace, or slope reef), substrate (e.g., sand, rock, patch reef), presence/absence of biota, compass direction, relief type (flat or wavy), slope (Soft—0–30°; Medium—30–60°; Strong—>60°, after Díaz et al. [18]), and image quality (Impossible—no identification possible; Probable—there is a reliable identification but with some reservation; True—there is certainty in identification).
For estimations of benthic coverage and species abundance, only still images with an image quality of “True” were used. With the ImageJ software [23], a 0.1 m × 0.1 m grid was established on every image using the laser pointers emitted by the ROV as a reference. Afterward, we identified and recorded the objects under each one of 66 grid intersections on a quadrant of 1 m × 0.5 m at the center of the grid (Figure 3). From this data, the coverage (%) was estimated for encrusting organisms (e.g., hard corals, sponges, algae) and abiotic substrate (e.g., rock, sand), and species abundance was calculated by counting the organisms with three-dimensional growth (i.e., branched, tubular, among others) such as octocorals, black corals, and sponges inside the quadrant.
To enable the listing of the different objects seen in the quadrats (>1 cm), an initial classification in OTUs (Operational Taxonomic Units) according to growth forms (erect, encrusting) and main taxonomic groups (octocorals, black corals, sponges) was done. Later, detailed analysis with experts of a number of images for every OTU allowed its identification until the lowest possible taxonomic level.

2.3.2. Identification and Spatialization of Ecological Units

For the recognition of ecological units along the depth scope of the study (30–140 m), we used 10 m intervals (ranks), starting around 30–50 m to 140 m deep, and calculated the averages of benthic cover and OTUs abundance by depth rank in every transect (sampling unit). To perform a combined analysis of benthic covers and OTUs counts, the averaged data matrices were merged after standardization as follows (after [24,25]): coverage matrix was 4th-root transformed and each entry divided by the sum of the matrix and multiplied by 100; count matrix was square-root transformed, and each entry was divided by the sum of the matrix and multiplied by 200.
To identify benthic assemblages and their association with the different depth ranks, cluster analysis with group-averaged linkage was run on a Bray–Curtis similarity matrix (After [26,27]) calculated from the combined matrix of benthic coverage and OTUs counts. To recognize significant clusters (p < 0.01) and identify OTUs contributing to cluster formation, SIMPROF and SIMPER routines (similarity profile [26]) of PRIMER (v.6) were performed, respectively.
Two sequential runs of SIMPROF + SIMPER routines allowed the identification of the most consistent clusters, which were those with 100% contribution of substrate components (sand, rock), and clusters with >70% similarity and components sharing. In the second run, the consistent clusters were excluded to identify new significant clusters (p < 0.01). Those new clusters were then analyzed in a color matrix with different colors given to each cluster (letter), which were then located in a matrix with video transects as columns and depth rank as rows; therefore, every cell in the matrix represented an approximation to spatial positioning of the sampling units in the reef wall/bottom. The matrix was filled cell-by-cell with the color assigned to each group (letter) within the cluster analysis, allowing us to visualize the spatial positioning of each formed group (i.e., with similar depth or spatially close). Afterward, taking into account the groups and their cumulative percentage contribution on the SIMPER, three sequential arrays were performed until we had a fairly consistent color matrix, in which patches of cells with the same color instead of isolated cells were seen. Those patches in the matrix represent the biotic assemblages or general seascape features corresponding to the ecological units in a way that can be represented in a map.
To recognize spatial patterns defining the ecological units, two types of information were employed: the color matrix of biotic units as a spatial representation of biotic assemblages and the geoforms inferred from the bathymetric model [28]. The overlap of that information revealed trends in the distribution of the ecological units along the depth gradient. In addition, the following criteria were used to fill gaps in the color matrix due to the lack of biological information in unsampled areas (i.e., among transects):
1. Relief/geomorphological units: the seascape unit is delimited with the relief information available; if it does not provide information that allows associating, the unit is eliminated or generalized.
2. Generalization based on the trend of biota distribution on the depth ranks: depth areas are generalized where the dominance of some units is evident.
3. Generalization by zone and depth: zones without a continuous pattern with depth but with dominance of any ecological unit were generalized unto that unit.
4. Isolated cells in the color matrix: in isolated cells (row × column) where no association pattern with depth or relief can be identified, the color code (group) was replaced by the dominant color around (the one occupying more neighbors cells).
5. Video-transects: in the cells with a lack of benthic coverage information (cells in black in Figure 4 and Figure 5), the benthic composition at the landscape level was verified in the videos to validate the correct assignment of the landscape unit by generalizing by the dominance of neighboring cells.
The spatialization process employed the bathymetric 3D model [28], and isobaths between 30–140 m generated with the Contour tool of ArcGis 10.6 software [20]. Likewise, video transects were used to verify seascape features directly on the representation of the terrain, employing the bathymetric and the shadow model of this side of the island [28]. Building the cartographic product involve manual editing of ecological units, starting from the deeper ranks until the shallowest portions. In this way, a 2D cartographic layer from the previously 3D model was created, to generate a 3D visual representation of the ecological units on the western side of San Andrés. The map was built on the scale 1:50,000 covering 268.8 ha between 30 and 140 m deep, on which ecological units are represented with different colors.

3. Results

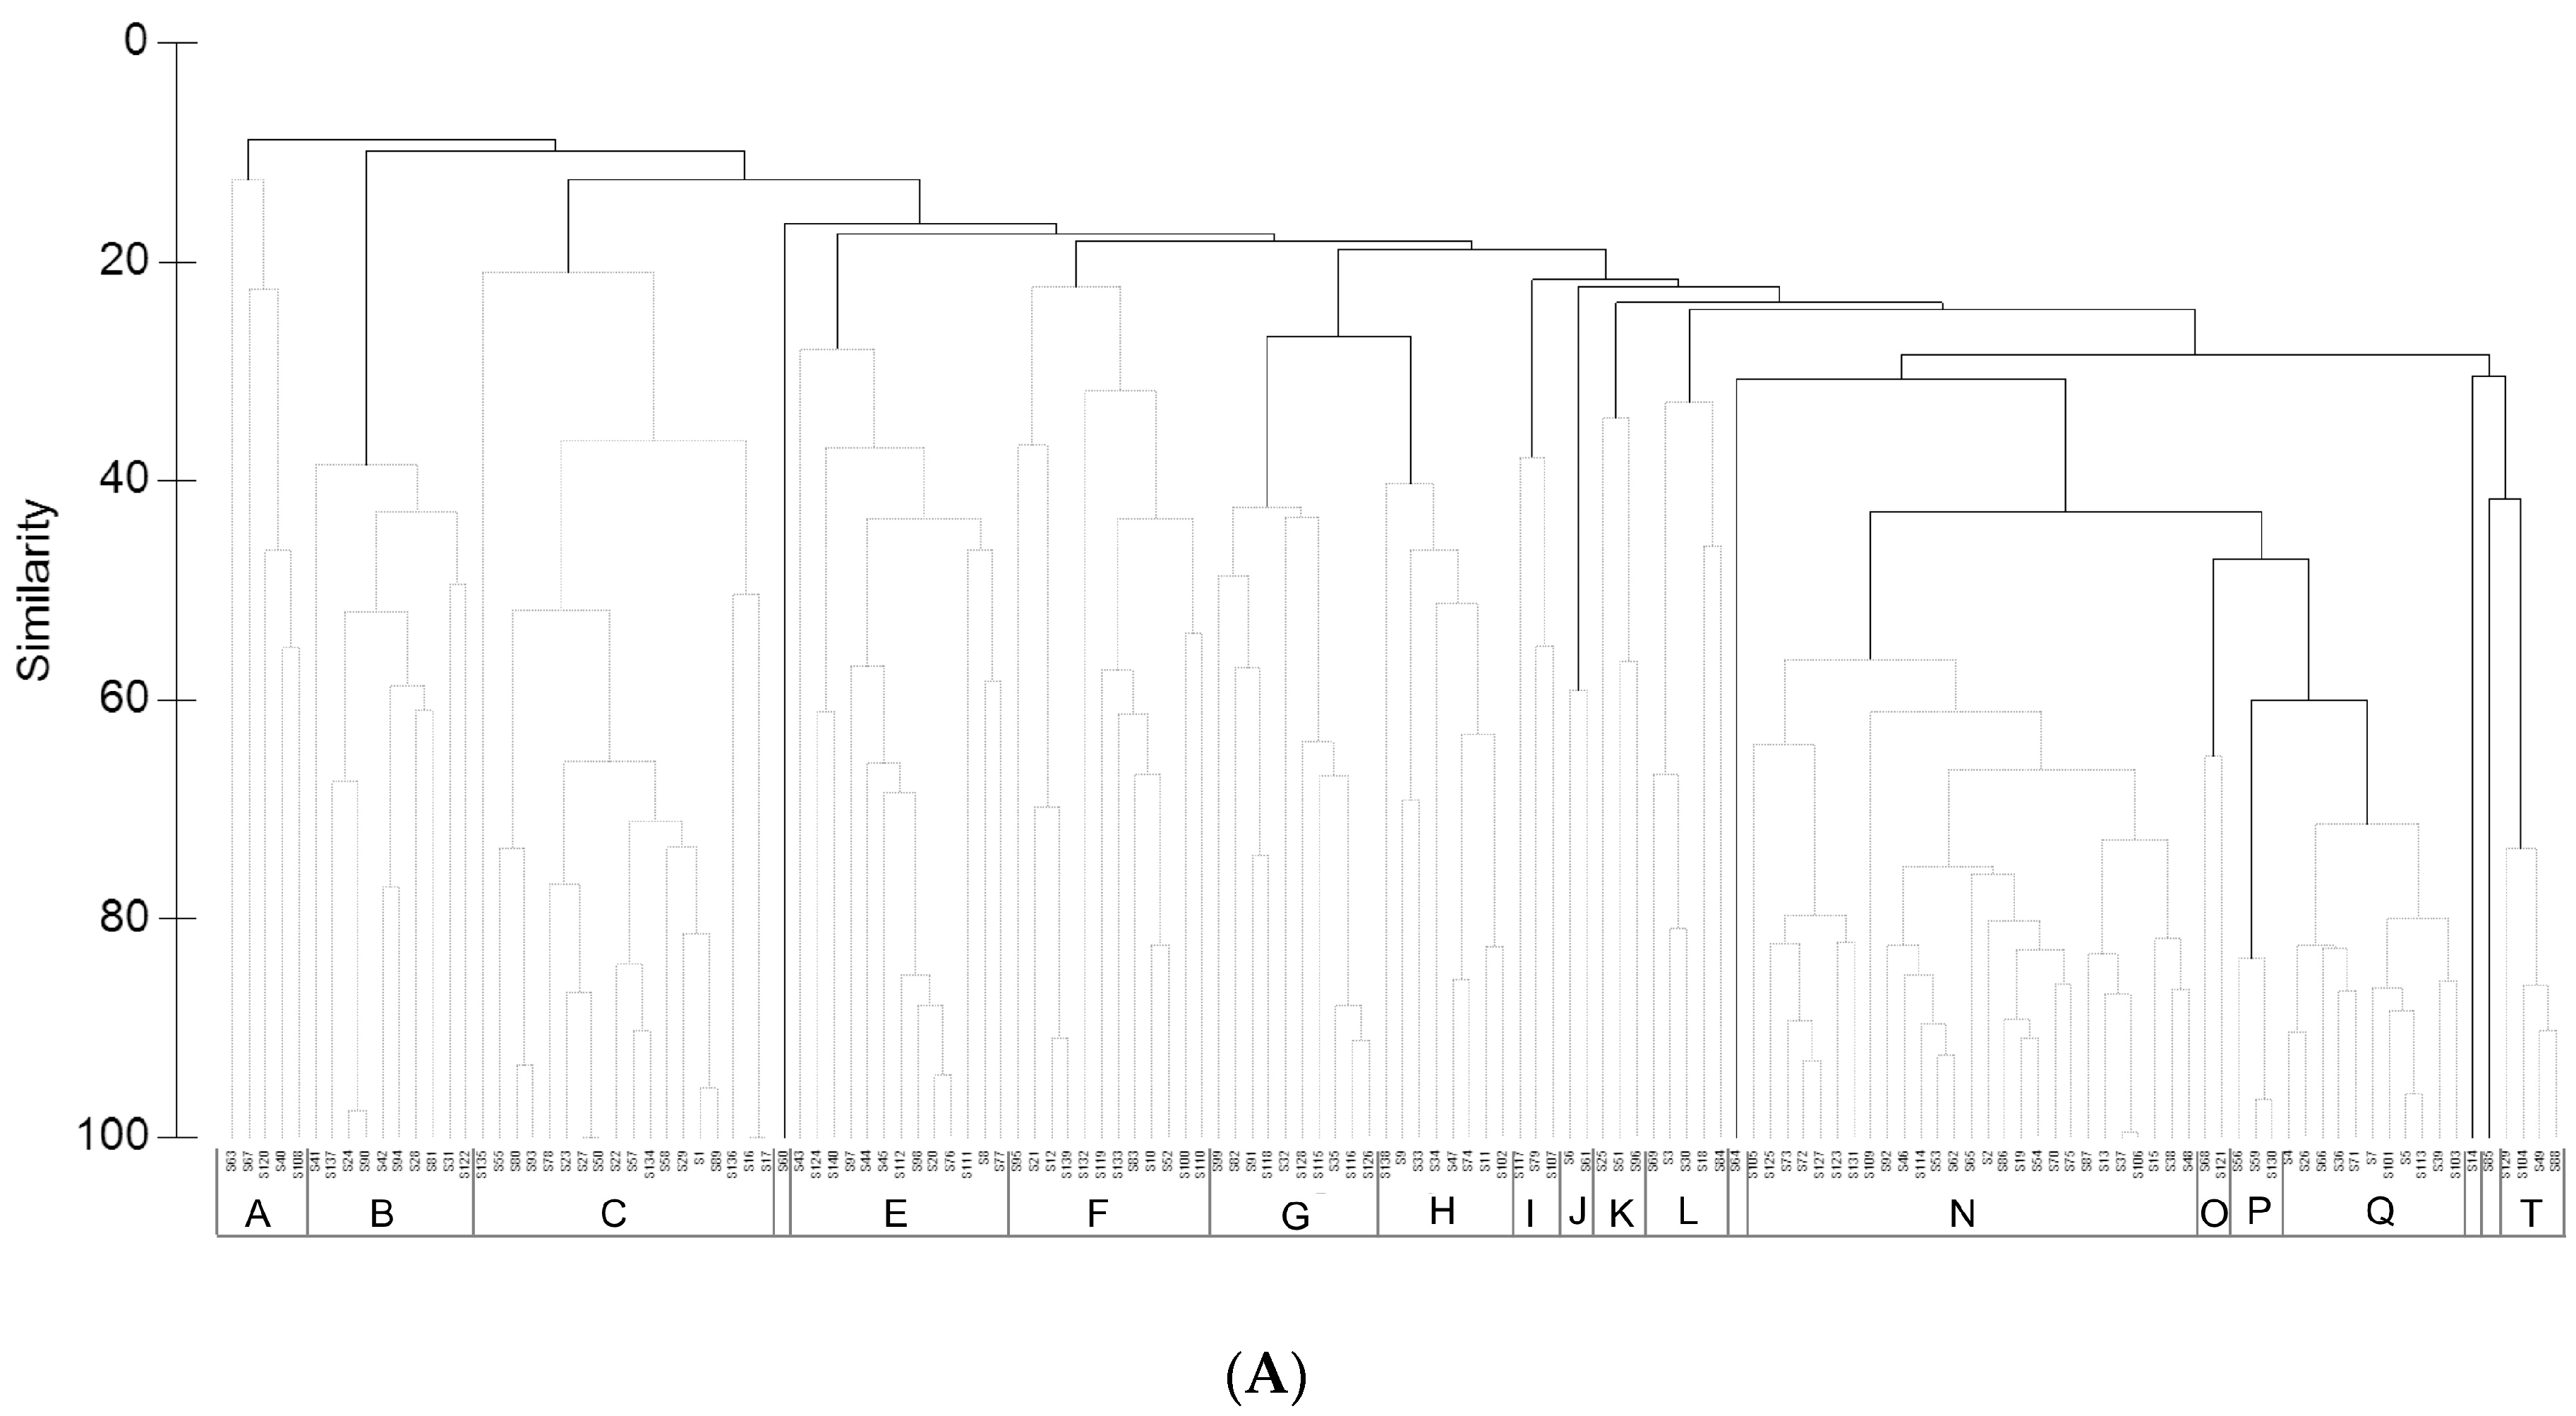
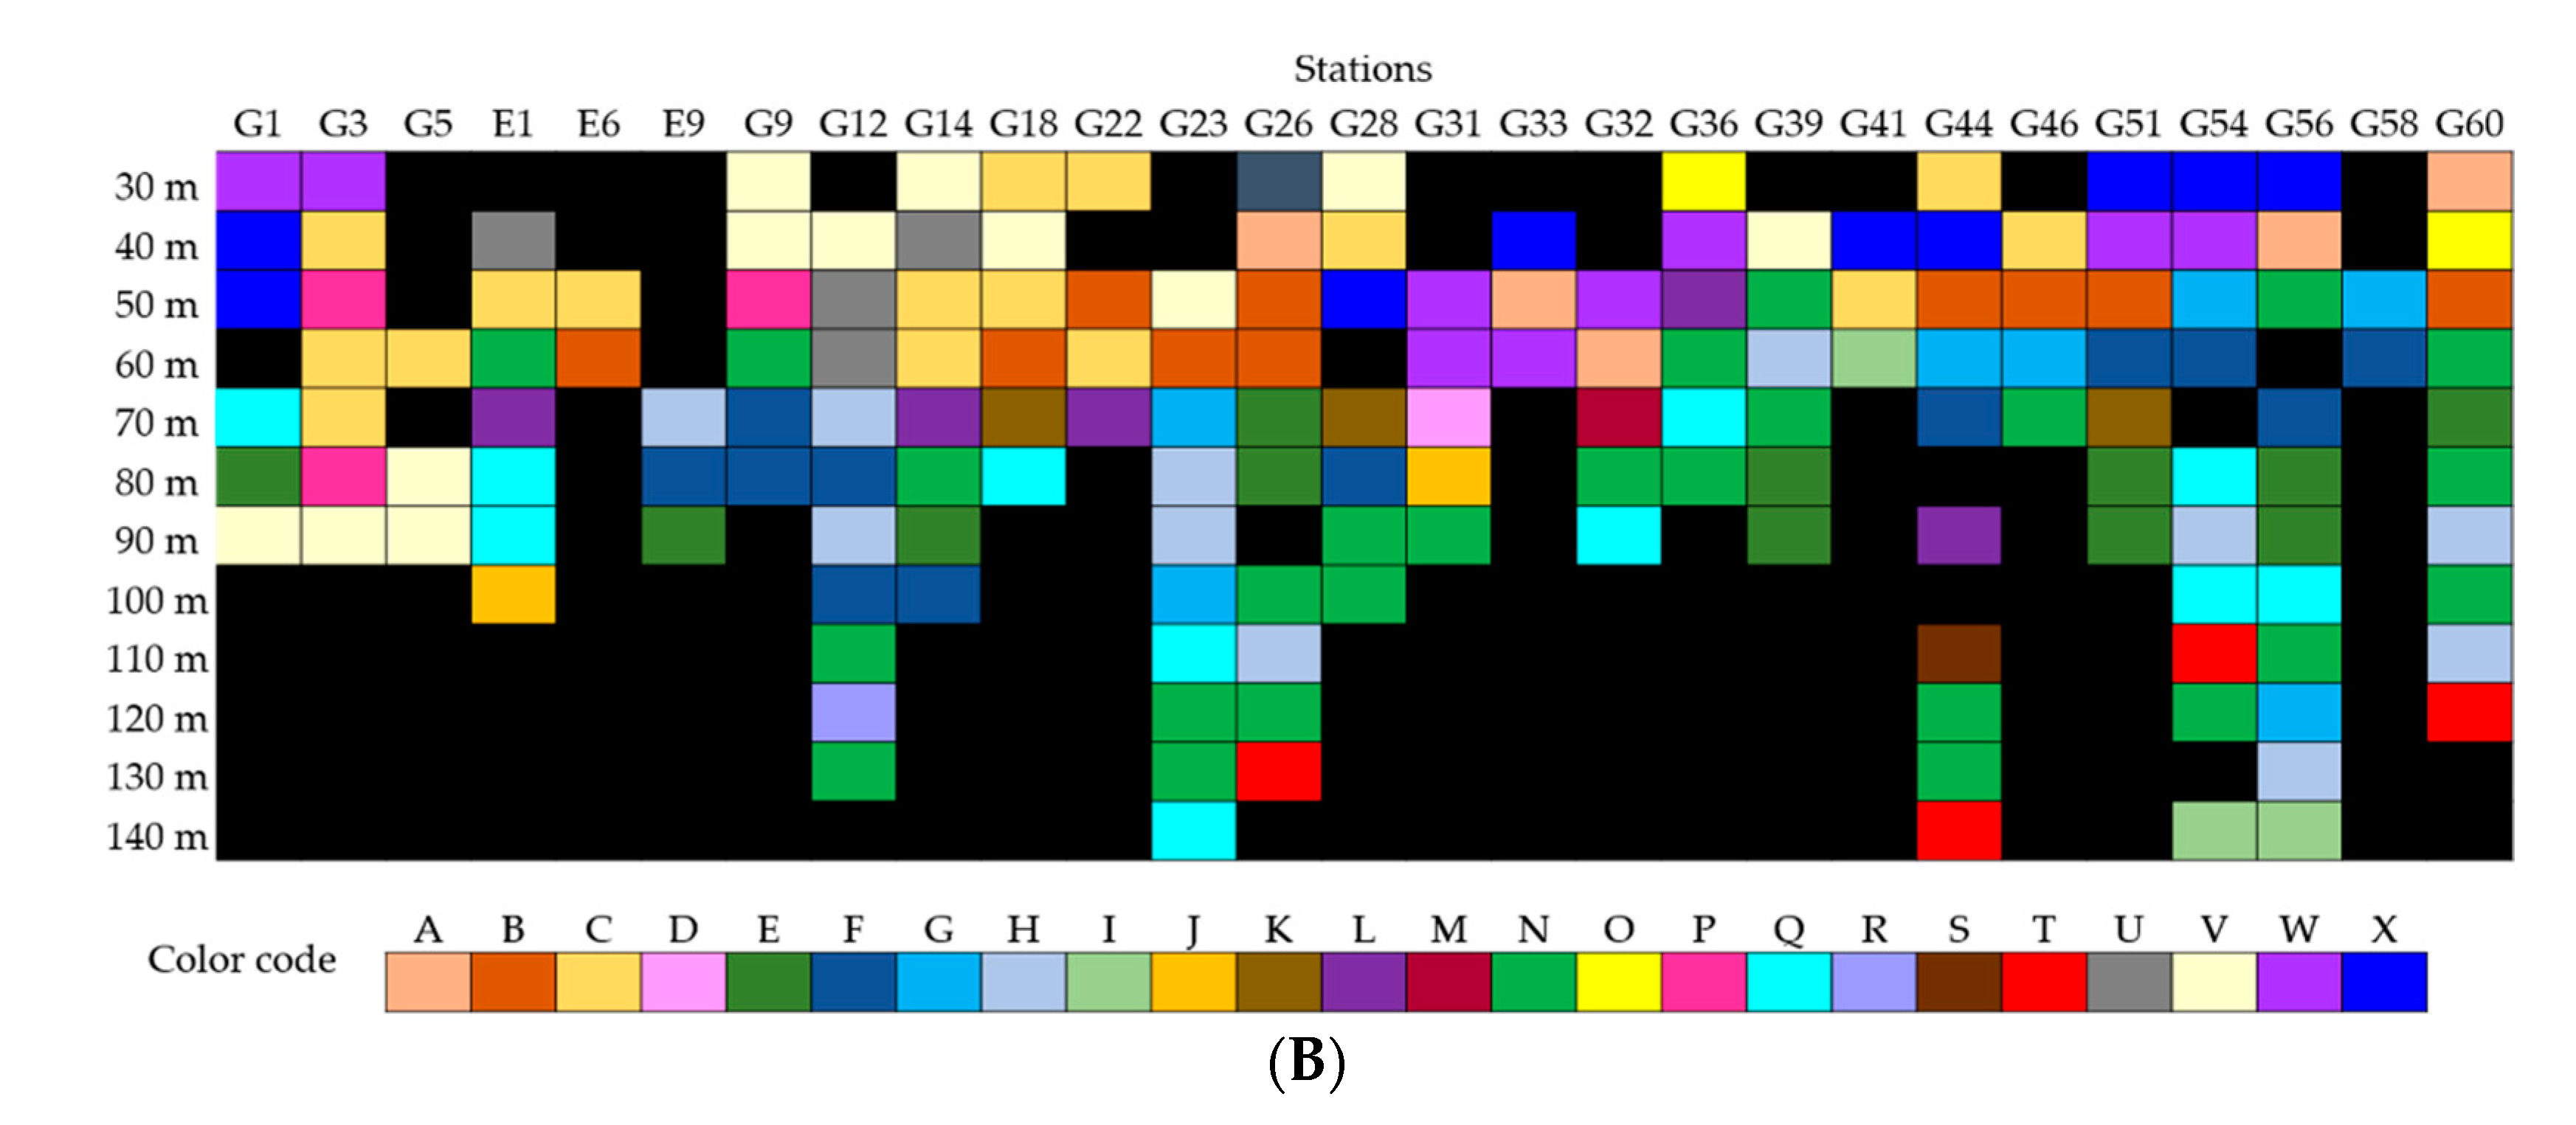
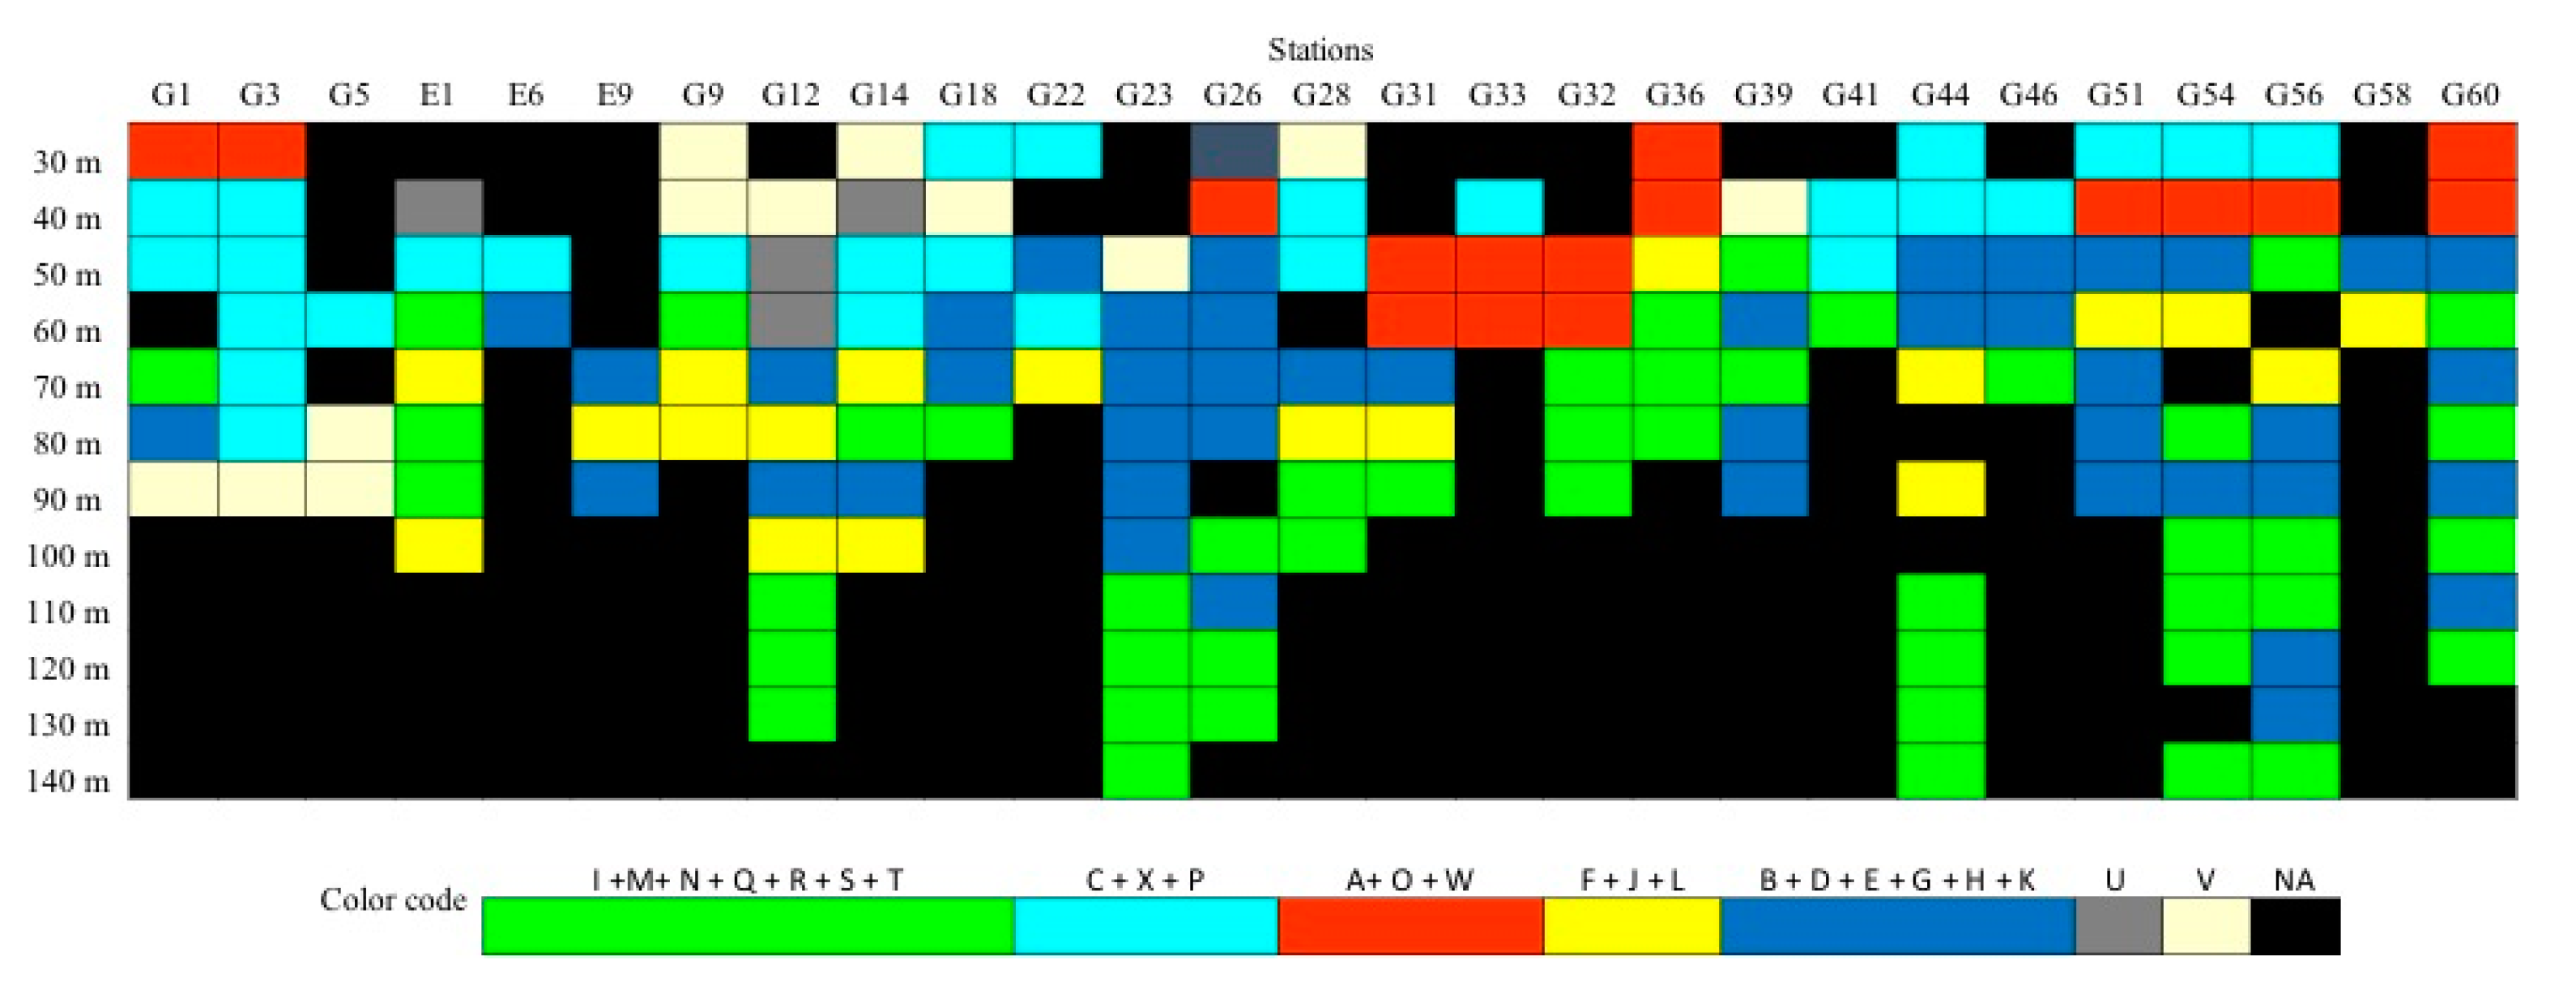
3.1. Community Analysis for the Mapping Process

In total, 27 vertical video transects from 30–147 m depth in the east-west direction and 3 horizontal video transects (G3 and G41) were performed from 27 November to 5 October, on 14.5 km of coastline corresponding to the entire western side of San Andrés Island (Figure 2). From the videos, 14 h were analyzed and 5742 still images were extracted, from which 753 images were suitable to estimate benthic coverage and OTUs abundance data (details in Supplementary material Table S1).
The image analysis led to the identification of 90 OTUs, including sponges, octocorals, black corals, and scleractinian corals. In some images 30–60 m deep, detailed analysis could not be done due to unfit ROV positioning; in such cases, the categories “patch reef” (continuous coral reef-like structure) and “scattered corals” (small coral patches scattered on sand bottom) were recorded with 100% coverage in the data matrix.
Two SIMPROF routines were done for community analysis. The first analysis identified 28 significant clusters (p < 0.01), three of them showed 100% similarity (constituted of a single benthic category such as sand, rock, coral patch, among others), and were removed prior to the second SIMPROF, which identified 20 significant clusters (Figure 4A). The 20 clusters obtained were categorized with letters A-T (black boxes, Figure 4A) and colors. In order to visualize each sample of the groups considering their spatial location (stations) and depth ranges, a matrix color was carried out positioning each sample in a cell and colored according to the color of their group (Figure 4B).
Additionally, to recognize the OTUs contribution to the differences or similarities between groups (from A to T) a SIMPER routine was done (Table 1). These results analyzed with the color matrix allowed the integration of two or more groups considering components that provided up to 70% similarity. To exemplify the process, the groups N, T, and Q, were joined as they were mainly composed of OTU29 (green encrusting sponge) rock and sand. Moreover, the groups C, P, X and A, O, W were united, as they were represented by scattered corals with sand and higher proportions of the category “Patch reef”, respectively (Table 1). This process was carried out several times until all the groups with similar composition were united. For landscape mapping purposes the unions were considered as the same group and re-colored (Table 1, Figure 5). These newly formed groups represent the biotic units and were compared with geomorphological information for the definition of the ecological units. These newly formed groups represent the biotic units and were compared with geomorphological information for the ecological units definition.
The spatial information of the biotic units in the color matrix (Figure 5), reflected spatial patterns and trends according to depth and geomorphology. The comparison of the biotic and geomorphologic information (using 3D bathymetry model), led to the identification of new zoning trends, such as patch reefs in the reef terrace, the sponges’ dominance in the deepest zones, or the conspicuous presence of octocorals and black corals on the steep seascape (towards the south of the island). These zoning patterns and the criteria used with the color matrix (explained in Section 2.3.2) aided in the recognition of the ecological units and determined the layout of several boundaries between the units.

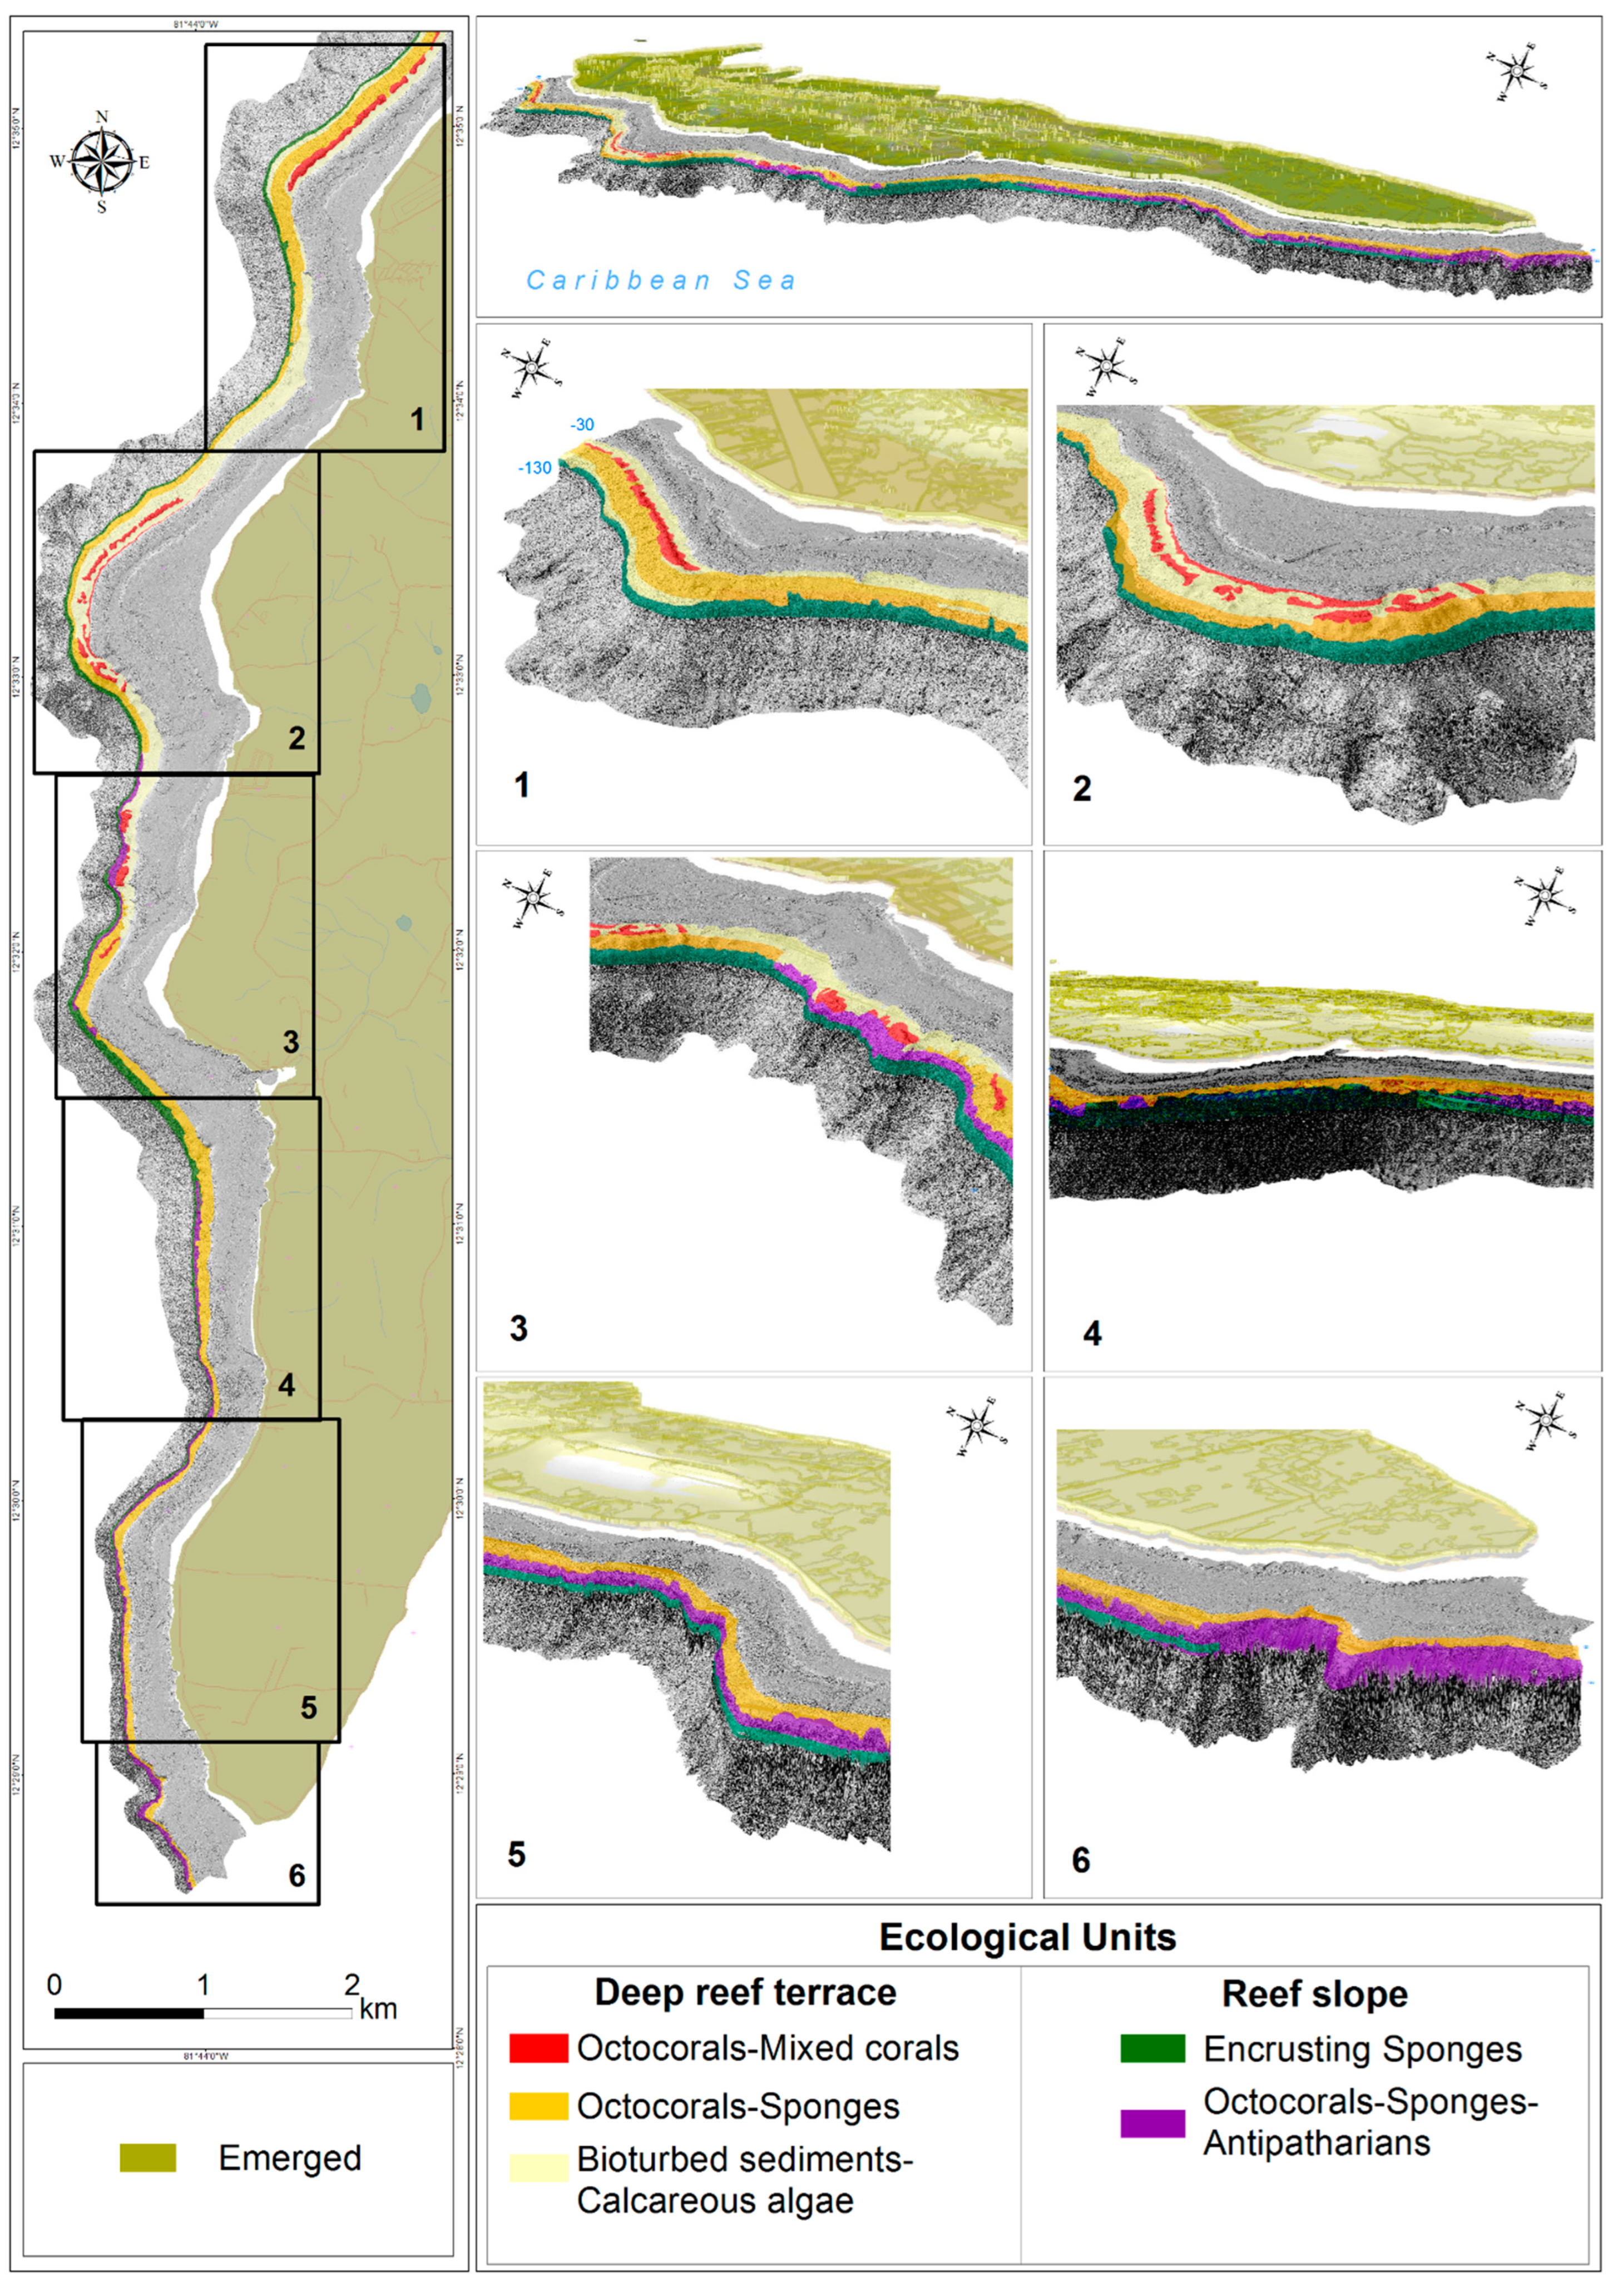
3.2. Mesophotic Ecological Units Map

Five ecological units of MCE were recognized on the 30–140 m deep interval covering 268.8 ha of the deep reef terrace and the reef slope along the western side of San Andrés Island, which was represented in a 1:50,000 cartographic output (Figure 6): Bioturbed sediments–calcareous algae, Octocoral–Mixed corals, Octocorals–Sponges, Octocorals–Sponges–Antipatharians and Encrusting sponges. Defining ecological units involved physical variables such as depth, type of substrate, slope, and relief, and that information is given in the units description that follows:
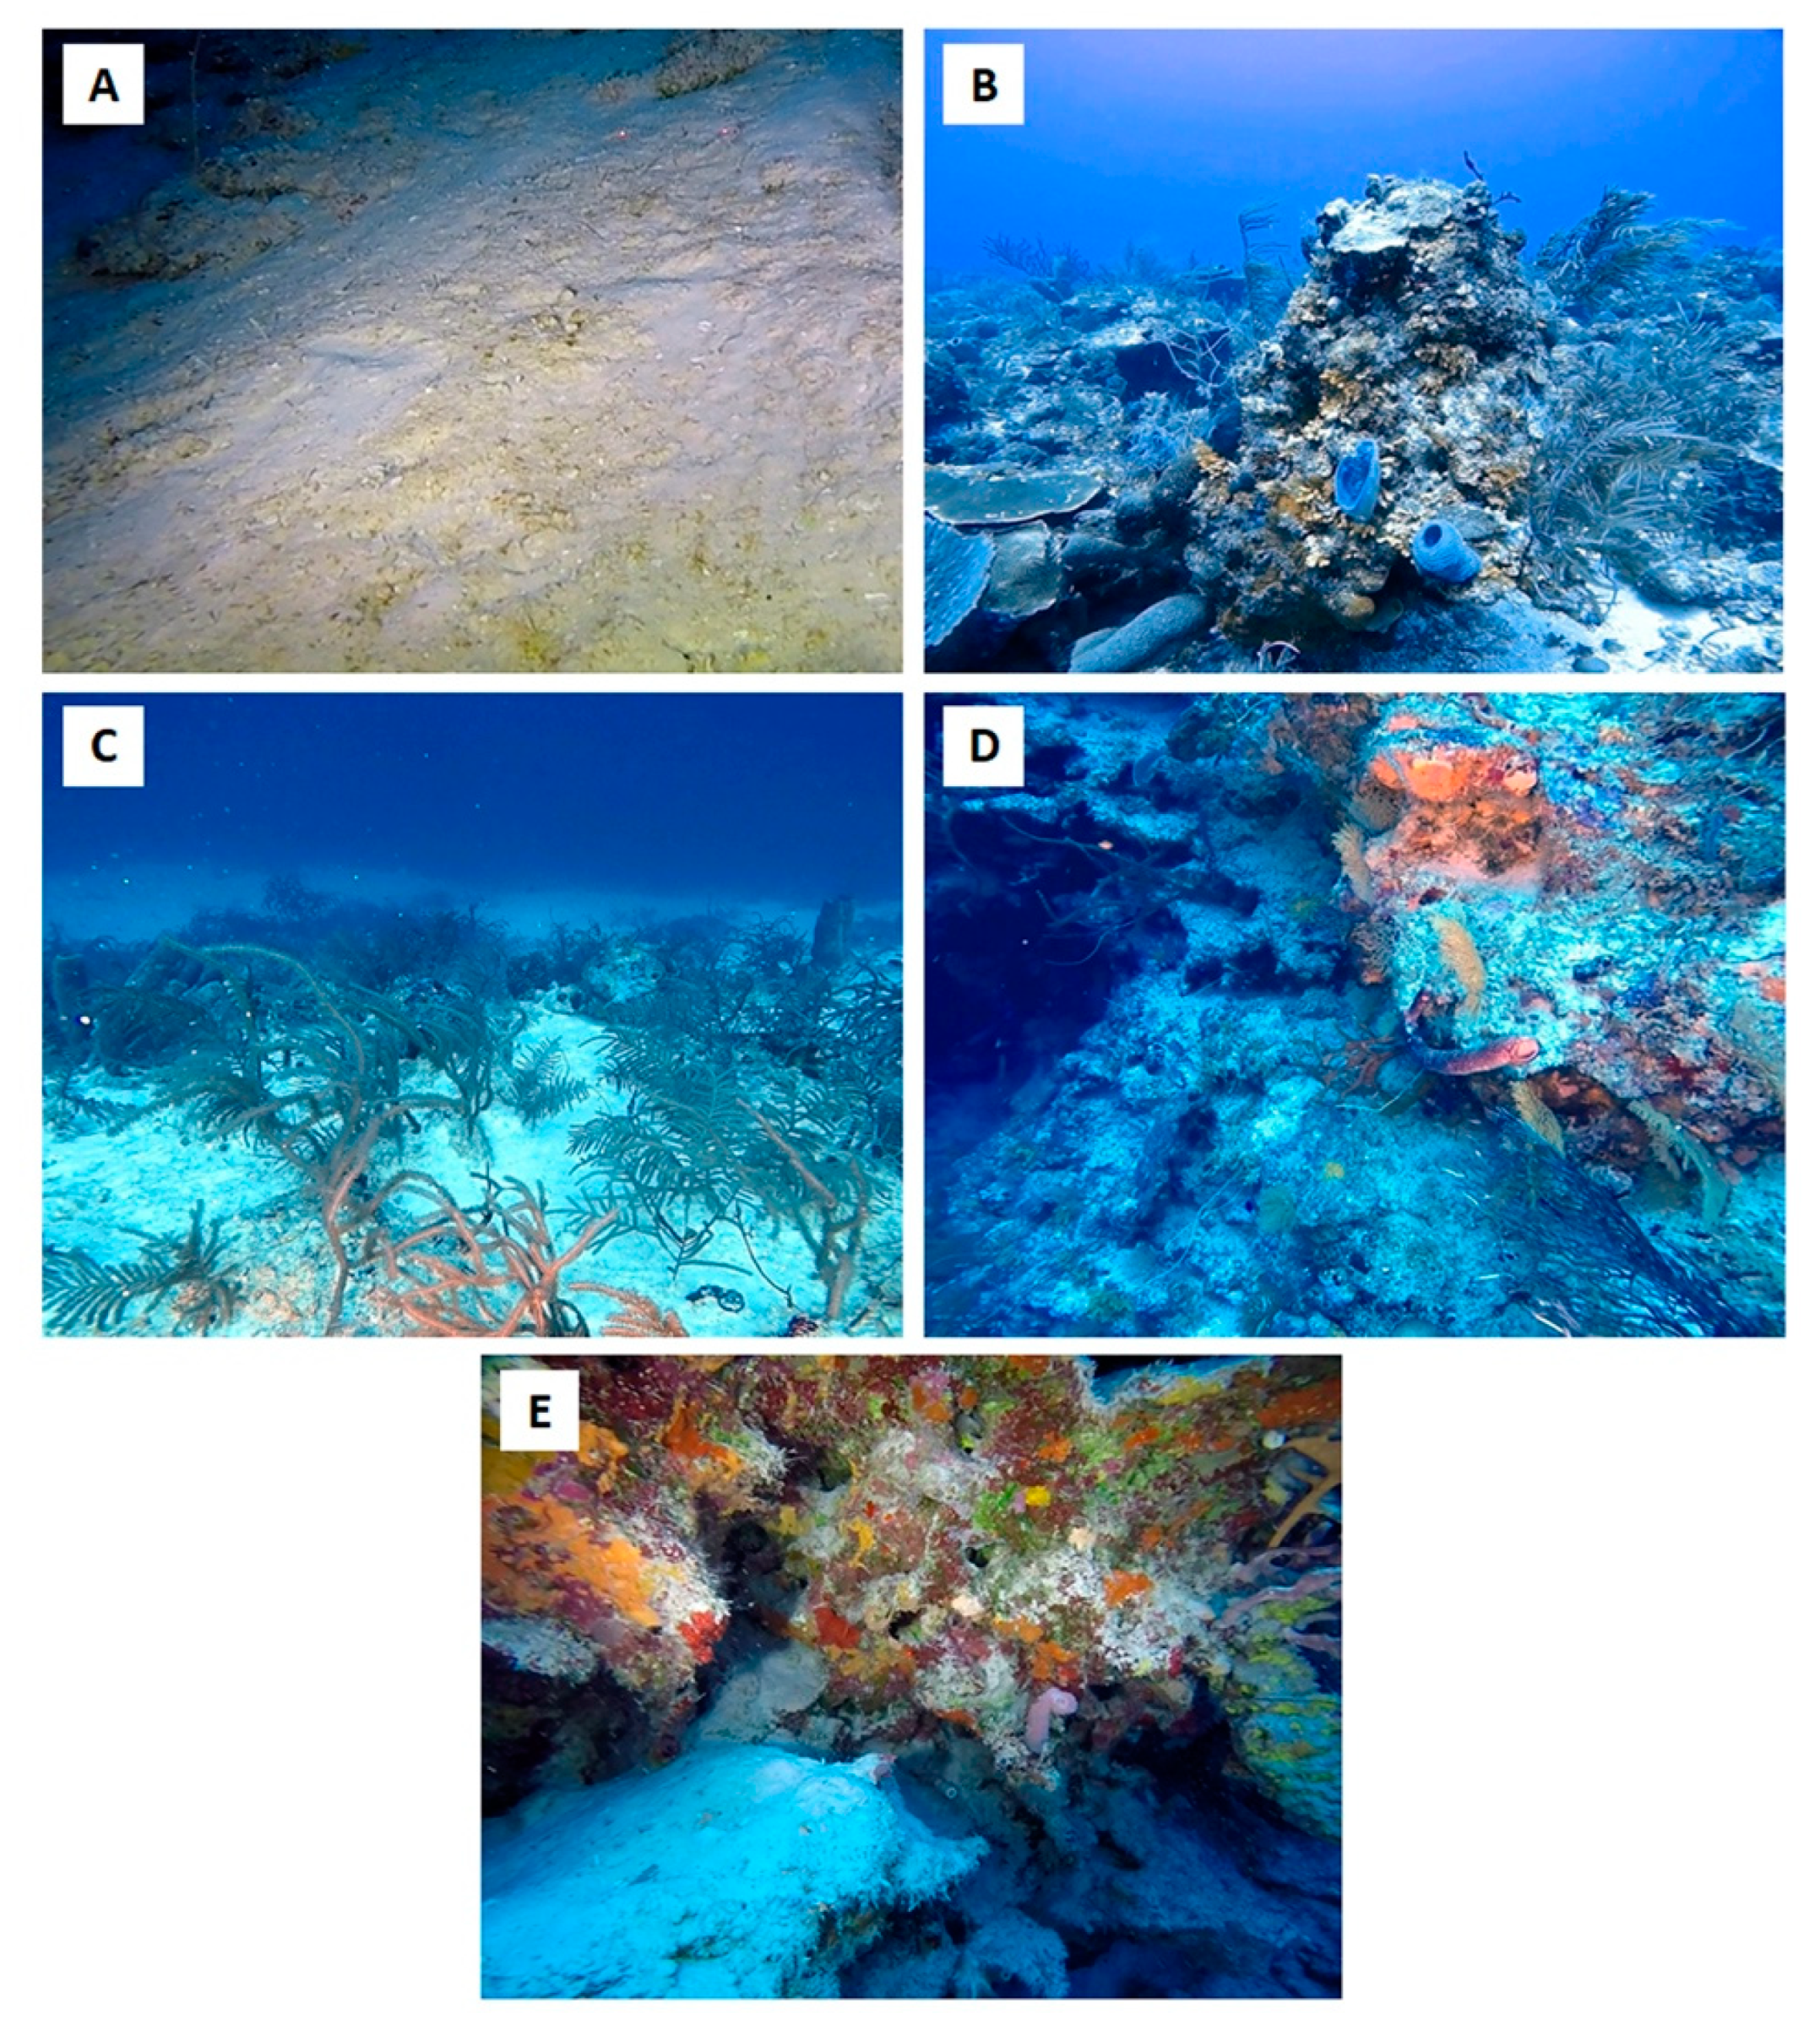
  • Bioturbed sediments-calcareous algae:
Spanning around 62.6 ha, this unit represents areas coated by coral sand, without any macroscopic sessile biota, giving a snowy appearance to the bottom (Figure 7A). On terrain, this unit goes from 1 km north of El Cove (center of the study area) to the northern tip of the island, in maximum depths up to 60 m, where large sand patches cover the deep reef terrace (30–60 m deep) with gentle slopes (0–30°) and flat relief. A few small sandy patches to the south (Nirvana sector) share the attributes of this unit but were not represented on the map due to scale issues. Some vagile biota as the Jolthead porgy Calamus bajonado and the Brown garden eel Heteroconger longissimus can be seen. In some sectors to the north, a very fine layer of sand barely covers the calcareous terrace, and nearby to the submarine emissary at 40–60 m deep the seafloor looks uncover, even of sand, being just exposed hard substrate (coral pavement), without any evident accumulation of sand or conspicuous benthic biota. Since it was not possible to differentiate between coral pavement and bioturbed sediment environments, both are represented as the same unit Bioturbed sediments–calcareous algae. Finally, at the north end of the study area (Box 1, Figure 6), the unit was represented as a narrow strip on a second deep reef terrace at 90–110 m deep, where some accumulated sediment and few sessile biota are found.
  • Octocorals–Mixed Corals:
Appears in the shallower part of the deep reef terrace between 30–60 m, in areas with a gentle slope (0–30°) and a flat to undulating relief (due to the three-dimensionality provided by corals); it is located mainly to the north and encompass 14.8 ha of the sea bottom. Depending on where located, this unit is either a continuation of the patch reefs from the upper adjacent terrace found shallower than 30 m deep or are isolated coral patches growing deeper than the coral reef. This unit is characterized by the presence of big octocoral colonies of the genera Antillogorgia, Eunicea, Plexaura, and Pseudoplexaura, among small colonies of several scleractinian species with encrusting or plate growth-form such as Agaricia, Montastraea, Porites, Orbicella, Pseudodiploria, Colpophyllia, among others (Figure 7B). Tubular or barrel sponges of the genera Aplysina, Agelas, and Xestospongia, and massive or encrusting sponges such as Plakortis or Ircinia are also found. Some whip or branched black corals are present, mainly on Stichopathes, Plumapathes, and Antipathes genera. Macroalgae are also abundant in this unit, being particularly conspicuous the genera Halimeda, Dyctiota, and Lobophora.
  • Octocorals–Sponges:
This is the most extensive unit with 88.2 ha, spanning along the entire west side of the island on the shallow part of the MCEs (Figure 6), mostly restricted to the deep reef terrace (30–60 m). The unit is found deeper at the north, from around 40 m to more than 60 m deep, and even around 90–100 m on a second deep terrace at a site named High Rock. The unit is defined by the moderate presence of stony corals, soft corals, and sponges on a calcareous sand bottom (Figure 7C). Substrate inclination is about 30–60° and relief is wavy. Coralline sand is the predominant substrate among which scleractinian corals such as Montastraea cavernosa (Linnaeus, 1767), Porites astreoides Lamarck, 1816, and the octocorals Antillogorgia spp. and Eunicea spp. are found. Some sponges such as Xestospongia muta (Schmidt, 1870), Monanchora arbuscula (Duchassaing & Michelotti, 1864), Cliona delitrix Pang, 1973, Agelas spp., Aplysina spp., and calcareous macroalgae on genus Halimeda are also present.
  • Octocorals–Sponges–Antipatharians:
Located on the reef slope 50 to 140 m deep, from the center to the south of the island (Figure 6), this unit spans around 45.4 ha on a steep relief with a ground angle greater than 60°, where calcareous matrix (rock) is the predominant substrate as a wall with wavy relief shaping projections in which small sand pits are found (Figure 7D). The most common fauna on the unit is sea fans on genera Nicella and sea whips (Ellisella spp.) that stand out by their abundance and sizes. Furthermore, black corals (antipatharians) in the genera Stichopates, Antipathes, and Plumapathes are also common. Among the conspicuous sponges are Aplysina, Agelas, Ircinia, Monanchora, as well as others.
  • Encrusting sponges:
Associated with the reef slope 60–140 m deep, this unit spans around 57.8 ha from the center to the south of the island (Figure 6). The slope is high (>60°) and relief is undulating. The substrate is calcareous matrix, and the main feature is the dominance of encrusting sponges (yellow, orange, brown, and pink morphotypes), with the prevalence of a lemon green morphotype in the entire depth gradient usually covering the lower part of the rocky overhangs (Figure 7E). Along with this abundant sponge, some purple and white cup corals (possibly Thalamophyllia riisei (Duchassaing & Michelotti, 1864) and Phacelocyathus flos (Pourtalès, 1878), respectively) were observed, but their abundance and cover were not enough to be considered an ecological unit by themselves. Other sessile organisms such as sea fans and sea whips were also noted.

4. Discussion

Evaluation of biotic and abiotic components on the Mesophotic Coral Ecosystems 30–150 m deep at leeward (western side) of San Andrés Island, Colombian Caribbean, shows the presence of five ecological units on two geoforms. In the deep reef terrace (30–60 m) the units “Bioturbed sediments-calcareous algae”, “Octocoral-Mixed corals” and “Octocorals-Sponges”; and on the reef slope (60–140 m) the units “Octocorals-Sponges-Antipatharians” and “Encrusting sponges” were identified.
From the two geomorphological units shown here for SAI, the reef slope had been described by Díaz et al. [18] as a vertical wall that extends up to more than 500 m. However, a recent unpublished report [28] establishes the bottom of the slope as around 357.3 m and its beginning as about 60–70 m deep. Otherwise, the shallow reef terrace corresponds to the upper and lower terraces (0–22 m deep) described by Díaz et al. [18] as the substrate harboring the most diverse and dense sessile fauna of the coral complex, but also corresponds to the deep terrace (15–20 m deep) described by Díaz et al. [29]. The area that follows in depth after the shallow terrace, described by Díaz et al. [18] as a “step or truncation covered with sediments” that form at 35–40 m deep, was here considered as a deep reef-terrace extending to almost 60 m deep (according to the 3D model), with a significant presence of coral patches surrounded by sediment.
Our results suggest that some ecological units described by Díaz et al. [18] for shallow areas of coral reefs in Colombia can be extended to Mesophotic Coral Ecosystems, in some cases with variations in species composition, but without extreme differences that demands description of new units. For example, we find the units “Octocorals-Mixed Corals” and “Bioturbed Sediments-Calcareous Algae” by Díaz et al. [18] useful to describe and map the MCE habitats in the deepest pre-reef terrace. This unit extends south to north along the east side of the island. However, a main difference in this unit among shallow waters (<25 m) and on the deep terrace (30–60 m) is its discontinuity on the latter, mainly in the north and center of the study area (Figure 6, unit red on the map).
In contrast, in the ecological unit’s map of SAI produced by Díaz et al. [18] the unit “Agaricia spp.-Mixed corals” is presented as a continuous strip surrounding all the coral formation “more than 45–50 m deep”. Their description of this unit implies the significant presence of “several species of the genus Agaricia and some massive species such as Montastraea franksi, M. cavernosa and Mycetophyllia spp.”, which was not seen by us. That work lacks a detailed description of methods used for the polygons built and the coordinates of sampling sites, but considering the date and type of sampling we can suppose they must have been seriously limited by diving capabilities. Our ROV sampling allowed us to have a wider view of the seascape in the deep, as videos of Scattered Coral Patches, which when analyzed together with biodiversity information by Chasqui et al. [13] reveals a significant presence of large octocorals among very scattered scleractinian colonies, leading us to reconsider the definition and spatial representation of the unit. As a result, the spatial representation of ecological units offered here shows the units “Octocorals-Mixed corals” and “Octocoral-Sponges” represented as strips width variable running discontinuously along the western side of SAI from 30 to around 60 m deep, with the last one reaching even up to 90 m deep in one site.
The last ecological unit included here, Bioturbed sediments–calcareous algae (yellow in Figure 6), corresponds in both description and location to previous reports [18]. However, this study expands its distribution to a greater bathymetric range. Similarly, the description and location of two new ecological units 60–140 m deep (i.e., Octocorals–Sponges–Antipatharians, and Encrusting sponges) allows the recognition of new mesophotic habitats, which in turn can include more detailed ecological units, some of which resemble in composition the biodiversity described on the southeast slope of the island [11]. The recognition of new habitats will allow future exploration with intensive sampling and different methodologies to expand its knowledge, as a basis for the design and implementation of MCE monitoring programs [16].
The composition of ecological units described here, especially Octocorals-–Sponges-Antipatharians, and the geomorphology on the western side of San Andrés Island, are very similar to other areas on Caribbean and the Western Atlantic. Considering the shape and composition features of the MCEs in Cuba, and the exhaustive review on the topic for Bahamas, Jamaica, and Belize by Reed et al. [30], we conclude the slope of San Andrés Island coincides (at level of large taxonomic groups) with other deep coral reef walls along the Caribbean. In general, the slope biota is composed mainly of sponges (e.g., Xestospongia, Agelas, and several fouling sponges), octocorals (e.g., Ellisella, Nicella), black corals (e.g., Stichopathes, Antipathes, among others), algae (e.g., Halimeda spp.), and a few scleractinian corals (Agaricia spp.). It is interesting that coral walls between 50–125 m in Cuba showed the greatest diversity and abundance of the benthic macrofauna seen in deep reefs, and that most species were reported up to 150 m deep [31]. In San Andrés Island, a similar pattern was found in terms of diversity and abundance, commonly found up to 100–110 m, and only towards the south of the island was it possible to find this unit extended up to 140 m deep.
The scleractinian corals on the slope were mainly isolated platy colonies of Agaricia species (A. grahamae, A. undata, and A. lamarcki) growing as a roof or pagoda shape, seen up to a maximum depth of 70–80 m and most frequently towards thew south, where the slope is more tilted (>50°). These sightings suggest the presence of the ecological unit Agaricia spp.–Mixed corals, previously noted by Chasqui et al. [13] from 50 to 70 m deep around The Nirvana diving site. The presence of such platy corals in the shallowest areas of the coral reef slopes seems common throughout the Caribbean [30,31,32]; however, the sampling effort here did not allow the recognition and mapping of this unit on the western side of San Andrés Island, possibly due to the fact that platy-like habitat patches are small and located in an unsampled sector of the reef, being unnoticeable in the pre-established mapping scale. Later studies on a finer spatial scale may allow the recognition of new ecological units and show more detailed composition of the island’s mesophotic environments.
The composition of the ecological units on the deep terrace on SAI, especially the Octocorals–Mixed Corals unit (30–60 m deep), coincides with previous reports in Puerto Rico [32], Cuba [31] and other areas, such as in the Gulf of Mexico [30]. In this ecological unit, the structuring and habitat-forming species are represented by the scleractinian corals Agaricia spp., Montastraea cavernosa (generally in plate-shape), or Porites astreoides. Other typical fauna of the upper mesophotic zones includes several species of octocorals, sponges, black corals, and algae.
Although mapping 268.8 hectares of MCEs on San Andrés Island represents a great advance in the knowledge of this marine environments for the country, future explorations in MCEs in other locations and towards deeper environments (>140 m) will allow the recognition of habitats with special ecological importance. For example, deep reef banks dominated by ahermatypic corals such as Madracis myriaster (Milne Edwards & Haime, 1850) have been previously reported in the continental platform of Colombia [33], but detailed description of these environments is lacking for this region. In other Caribbean locations such as Cuba, those ecosystems have been found as well, at 125–150 m deep [30]. Furthermore, explorations with detailed samplings and focused on accurately characterizing each ecological unit could allow the establishment of ecological units at the biotopes level, that facilitate the identification and location of vulnerable species or habitats [15,34,35]. Future works needs to consider the samplings with methodologies and equipment allowing the collection of biological samples, essentially to achieve identification to species level, and built a more realistic idea of the biodiversity on the mesophotic environments of the country. Finally, the identification, establishment, and mapping of mesophotic ecological units on the western side of San Andrés Island represent the first advance in the country, and Southern Caribbean, on mapping benthic habitats in this depth scope. Since habitat maps are fundamental tools for monitoring and conservation on Marine Protected Areas, we hope the results offered here can be useful to a most integral management of the coral ecosystems in the Seaflower Biosphere Reserve, including mesophotic coral ecosystems for the first time.

Supplementary Materials

The following supporting information can be downloaded at: https://www.mdpi.com/article/10.3390/d14080679/s1, Table S1: General information of the 30 video-transects taken by the ROV Eloy V on the western side of San Andrés Island. Video-transects marked with an asterisk (*) were not taken into account during the image analysis and processing.

Author Contributions

L.C. conceived the study. All authors collected the field data. C.C.-P. drove the ROV and manage the video analysis. K.M.-Q. and C.C.-P. identified species from the still images. K.M.-Q., C.C.-P. and S.M. analyzed the data. S.M. built the cartographical product. K.M.-Q., C.C.-P., S.M. and L.C. wrote the manuscript. All authors have read and agreed to the published version of the manuscript.

Funding

This work was funded by INVEMAR and CORALINA through the project “Evaluación de los ecosistemas profundos en la Reserva de Biosfera Seaflower”, under the Special Cooperation Agreement No. 001/2019.

Institutional Review Board Statement

Not applicable.

Informed Consent Statement

Not applicable.

Data Availability Statement

The data presented in this study are available and could be request to the Sistema de Información Ambiental Marina (SIAM) of the Marine and Coastal Research Institute–INVEMAR, trough the link: https://siam.invemar.org.co.

Acknowledgments

We gratefully acknowledge Ivonne Corredor, Manuel Garrido, and David Alonso of INVEMAR for their help in data collection. To Mario Mow (the father) and his crew for logistical support in the fieldwork. Special thanks to Juliana Sánchez and Silvia Sierra of INVEMAR for their support in image analysis and maps construction, respectively. To David Morales Giraldo and Mauricio Bejarano Espinosa of INVEMAR for the geomorphologic information (using 3D bathymetry model) of San Andrés Island produced in 2018. To CORALINA, and especially to Nacor Bolaños, for logistical support in the Island, and to SERPORT for their help to solve ROV failures during fieldwork. To Andrea Beltrán and Felipe Valencia (LABSIS-INVEMAR) for help with sampling maps. This work is contribution 1341 of Marine and Coastal Research Institute—INVEMAR.

Conflicts of Interest

The authors, who were staff of INVEMAR at the time of the study, declare that both of funders’ institutions agreed on the right to publish the results of the study “on their own” as part of the agreement.

References

  1. Hinderstein, L.M.; Marr, J.C.A.; Martinez, F.A.; Dowgiallo, M.J.; Puglise, K.A.; Pyle, R.L.; Zawada, D.G.; Appeldoorn, R. Theme Section on “Mesophotic Coral Ecosystems: Characterization, Ecology, and Management”. Coral Reefs 2010, 29, 247–251. [Google Scholar] [CrossRef]
  2. Lesser, M.P.; Slattery, M.; Mobley, C.D. Biodiversity and Functional Ecology of Mesophotic Coral Reefs. Annu. Rev. Ecol. Evol. Syst. 2018, 49, 49–71. [Google Scholar] [CrossRef]
  3. Zapalski, M.K.; Berkowski, B. The Silurian Mesophotic Coral Ecosystems: 430 Million Years of Photosymbiosis. Coral Reefs 2019, 38, 137–147. [Google Scholar] [CrossRef]
  4. Pyle, R.L.; Copus, J.M. Mesophotic Coral Ecosystems: Introduction and Overview. In Mesophotic Coral Ecosystems; Loya, Y., Puglise, K.A., Bridge, T.C.L., Eds.; Coral Reefs of the World; Springer International Publishing: Cham, Switzerland, 2019; Volume 12, pp. 3–27. [Google Scholar] [CrossRef]
  5. Sinniger, F.; Ballantine, D.L.; Bejarano, I.; Colin, P.L.; Pochon, X.; Pomponi, S.A.; Puglise, K.A.; Pyle, R.L.; Museum, B.P.B.; Reaka, M.L.; et al. Biodiversity of Mesophotic Coral Ecosystems. In Mesophotic Coral Ecosystems—A Lifeboat for Coral Reefs? 1st. ed.; The United Nations Environment Programme and GRID-Arendal: Arendal, Norway, 2016; pp. 50–62, Chapter 4. [Google Scholar]
  6. Lesser, M.P.; Slattery, M.; Leichter, J.J. Ecology of Mesophotic Coral Reefs. J. Exp. Mar. Biol. Ecol. 2009, 375, 1–8. [Google Scholar] [CrossRef]
  7. Bongaerts, P.; Ridgway, T.; Sampayo, E.M.; Hoegh-Guldberg, O. Assessing the ‘Deep Reef Refugia’ Hypothesis: Focus on Caribbean Reefs. Coral Reefs 2010, 29, 309–327. [Google Scholar] [CrossRef]
  8. Loya, Y.; Puglise, K.A.; Bridge, T.C.L. (Eds.) Mesophotic Coral Ecosystems; Coral Reefs of the World; Springer International Publishing: Cham, Switzerland, 2019; Volume 12. [Google Scholar] [CrossRef]
  9. Gonzalez-Zapata, F.L.; Bongaerts, P.; Ramírez-Portilla, C.; Adu-Oppong, B.; Walljasper, G.; Reyes, A.; Sanchez, J.A. Holobiont Diversity in a Reef-Building Coral over Its Entire Depth Range in the Mesophotic Zone. Front. Mar. Sci. 2018, 5, 29. [Google Scholar] [CrossRef]
  10. Chasqui Velasco, L.H.; González Corredor, J.D. Peces Registrados En Ambientes Mesofóticos de Bajo Frijol, La Porción Más Somera Del Parque Nacional Natural Corales de Profundidad, Usando Buceo Técnico CCR. Bull. Mar. Coast. Res. 2019, 48, 89–101. [Google Scholar] [CrossRef]
  11. Sánchez, J.A.; González-Zapata, F.L.; Dueñas, L.F.; Andrade, J.; Pico-Vargas, A.L.; Vergara, D.C.; Sarmiento, A.; Bolaños, N. Corals in the Mesophotic Zone (40–115 m) at the Barrier Reef Complex From San Andrés Island (Southwestern Caribbean). Front. Mar. Sci. 2019, 6, 536. [Google Scholar] [CrossRef]
  12. Mejía-Quintero, K.; Chasqui, L. Octocorals and Antipatharians in the Mesophotic Rocky Reefs of Colombian Pacific (Eastern Tropical Pacific). Front. Mar. Sci. 2020, 7, 311. [Google Scholar] [CrossRef]
  13. Chasqui, L.; Mejía-Quintero, K.; González, J.D. Biodiversity and Ecological Units of the Mesophotic Coral Ecosystems in San Andrés Island, SeaFlower Biosphere Reserve. Front. Mar. Sci. 2020, 7, 559273. [Google Scholar] [CrossRef]
  14. Sánchez, J.A.; González-Zapata, F.L.; Prada, C.; Dueñas, L.F. Mesophotic Gorgonian Corals Evolve Multiple Times and Faster than Deep and Shallow Lineages. Evol. Biol. 2020; preprint. [Google Scholar] [CrossRef]
  15. FGDC-STD-018-2012; Coastal and Marine Ecological Classification Standard. Marine and Coastal Spatial Data Subcommittee Federal Geographic Data Committee: Reston, VA, USA, 2012. Available online: https://iocm.noaa.gov/standards/cmecs-home.html#:~:text=The%20Coastal%20and%20Marine%20Ecological,types%20of%20sensors%20and%20platforms (accessed on 20 November 2019).
  16. Costello, M. Distinguishing Marine Habitat Classification Concepts for Ecological Data Management. Mar. Ecol. Prog. Ser. 2009, 397, 253–268. [Google Scholar] [CrossRef]
  17. Loubersac, L.; Dahl, A.; Collote, P.; Lemaire, O.; D’Ozouville, L. Impact Assesment of Cyclone Sally on the Almost Atoll of Aitutaki (Cook Islands) by Remote Sensing. In Proceedings of the 6th International Coral Reef Symposium, Townsville, Australia, 8–12 August 1988; Volume 2, pp. 455–462. [Google Scholar]
  18. Díaz, J.M.; Barrios, L.M. (Eds.) Áreas Coralinas de Colombia; Serie Publicaciones especiales; Instituto de Investigaciones Marinas y Costeras “José Benito Vives de Andreis”, INVEMAR: Santa Marta, Colombia, 2000. [Google Scholar]
  19. Spalding, M.D.; Fox, H.E.; Allen, G.R.; Davidson, N.; Ferdaña, Z.A.; Finlayson, M.; Halpern, B.S.; Jorge, M.A.; Lombana, A.; Lourie, S.A.; et al. Marine Ecoregions of the World: A Bioregionalization of Coastal and Shelf Areas. BioScience 2007, 57, 573–583. [Google Scholar] [CrossRef]
  20. Environmental Systems Research Institute (ESRI). ArcGIS Release 10.1.; ESRI: Redlands, CA, USA, 2012. [Google Scholar]
  21. Howell, K.L.; Huvenne, V.; Piechaud, N.; Robert, K.; Ross, R.E. Analysis of Biological Data from the JC060 Survey of Areas of Conservation Interest in Deep Waters off North and West Scotland; Joint Nature Conservation Committee: Peterborough, UK, 2013; p. 109. [Google Scholar]
  22. Henry, L.-A.; Vad, J.; Findlay, H.S.; Murillo, J.; Milligan, R.; Roberts, J.M. Environmental Variability and Biodiversity of Megabenthos on the Hebrides Terrace Seamount (Northeast Atlantic). Sci. Rep. 2014, 4, 5589. [Google Scholar] [CrossRef] [PubMed]
  23. Rasband, W.S.; ImageJ, U.S. National Institutes of Health, Bethesda, Maryland, USA. 1997–2018. Available online: https://imagej.nih.gov/ij/ (accessed on 10 August 2022).
  24. Davies, J.S.; Howell, K.L.; Stewart, H.A.; Guinan, J.; Golding, N. Defining Biological Assemblages (Biotopes) of Conservation Interest in the Submarine Canyons of the South West Approaches (Offshore United Kingdom) for Use in Marine Habitat Mapping. Deep Sea Res. Part II Top. Stud. Oceanogr. 2014, 104, 208–229. [Google Scholar] [CrossRef]
  25. Davies, J.S.; Stewart, H.A.; Narayanaswamy, B.E.; Jacobs, C.; Spicer, J.; Golding, N.; Howell, K.L. Benthic Assemblages of the Anton Dohrn Seamount (NE Atlantic): Defining Deep-Sea Biotopes to Support Habitat Mapping and Management Efforts with a Focus on Vulnerable Marine Ecosystems. PLoS ONE 2015, 10, e0124815. [Google Scholar] [CrossRef] [PubMed]
  26. Clarke, K.R. Non-Parametric Multivariate Analyses of Changes in Community Structure. Austral Ecol. 1993, 18, 117–143. [Google Scholar] [CrossRef]
  27. Mumby, P.J. Beta and Habitat Diversity in Marine Systems: A New Approach to Measurement, Scaling and Interpretation. Oecologia 2001, 128, 274–280. [Google Scholar] [CrossRef]
  28. INVEMAR; CORALINA. Actualización Del Conocimiento Sobre Los Ecosistemas Sumergidos de San Andrés Isla Para La Gestión Ambiental Del Departamento Archipiélago de San Andrés, Providencia y Santa Catalina; Convenio Especial de Cooperación No. 007 de 2017; Informe técnico final; Instituto de Investigaciones Marinas y Costeras: Santa Marta, Colombia, 2018; p. 96. [Google Scholar]
  29. Díaz, J.M.; Garzón-Ferreira, J.; Zea, S. Los Arrecifes Coralinos de La Isla de San Andrés, Colombia: Estado Actual y Perspectivas Para Su Conservación. Revista Acad. Colomb. Ci. Exact. 1995, 7, 150. [Google Scholar]
  30. Reed, J.K.; Farrington, S.; David, A.; Harter, S.; Pomponi, S.A.; Cristina Diaz, M.; Voss, J.D.; Spring, K.D.; Hine, A.C.; Kourafalou, V.H.; et al. Pulley Ridge, Gulf of Mexico, USA. In Mesophotic Coral Ecosystems; Loya, Y., Puglise, K.A., Bridge, T.C.L., Eds.; Coral Reefs of the World; Springer International Publishing: Cham, Switzerland, 2019; Volume 12, pp. 57–69. [Google Scholar] [CrossRef]
  31. Reed, J.K.; González-Díaz, P.; Busutil, L.; Daranas, B.M.; Rojas, D.C.; Méndez, J.G. Cuba’s Mesophotic Coral Reefs and Associated Fish Communities/ Arrecifes de Coral Mesofóticos de Cuba y Comunidades de Peces Asociadas. Rev. Investig. Mar. 2018, 38, 60–129. [Google Scholar]
  32. Appeldoorn, R.S.; Alfaro, M.; Ballantine, D.L.; Bejarano, I.; Ruíz, H.J.; Schizas, N.V.; Schmidt, W.E.; Sherman, C.E.; Weil, E. Puerto Rico. In Mesophotic Coral Ecosystems; Loya, Y., Puglise, K.A., Bridge, T.C.L., Eds.; Coral Reefs of the World; Springer International Publishing: Cham, Switzerland, 2019; Volume 12, pp. 111–129. [Google Scholar] [CrossRef]
  33. Santodomingo, N.; Reyes, J.; Gracia, A.; Martínez, A.; Ojeda, G.; García, C. Azooxanthellate Madracis Coral Communities off San Bernardo and Rosario Islands (Colombian Caribbean). Bull. Mar. Sci. 2007, 81, 273–287. [Google Scholar]
  34. Aghajanpour, F.; Savari, A.; Danehkar, A.; Chegini, V. Combining Biological and Geomorphological Data to Introduce Biotopes of Bushehr Province, the Persian Gulf. Environ. Monit. Assess. 2015, 187, 740. [Google Scholar] [CrossRef] [PubMed]
  35. Porskamp, P.; Rattray, A.; Young, M.; Ierodiaconou, D. Multiscale and Hierarchical Classification for Benthic Habitat Mapping. Geosciences 2018, 8, 119. [Google Scholar] [CrossRef]
Figure 1. Location of San Andrés Island in the Caribbean Sea. The blue gradient is a bathymetric representation of the sampled area along the leeward side of the island.
Diversity 14 00679 g001
Figure 2. Location and name (G_number and E_number) of the video transects (red lines) made along the western side of San Andrés Island, Colombian Caribbean.
Diversity 14 00679 g002
Figure 3. Quadrant of 1 m × 0.5 m established at the center of grid on the still images, which enclose 66 grid–points used for estimations of benthic coverage and OTUs abundance.
Diversity 14 00679 g003
Figure 4. (A) SIMPROF analysis from the benthic composition in San Andrés. Significant clusters (p < 0.01) used are illustrated in black, while groups that do not differ significantly are in grey. The black boxes and the letters A–T highlight the groups formed with significant differences that were used in the SIMPER analysis. (B) Color matrix with a different color for each of the 20 clusters (from A–T). The four other groups (U–X) represent the categories with 100% similarity (sand, coral pavement, scattered corals, and patch reef).
Diversity 14 00679 g004aDiversity 14 00679 g004b
Figure 5. Color matrix after the grouping process, considering the SIMPER results of Table 1 and the union of different groups for the identification of biotic units.
Diversity 14 00679 g005
Figure 6. Ecological units of the mesophotic coral ecosystems (MCE) on the western side of San Andrés Island.
Diversity 14 00679 g006
Figure 7. Ecological units on the Mesophotic Coral Ecosystems at the western side of San Andrés Island. (A) Bioturbed sediments-calcareous algae, (B) Octocoral–Mixed corals, (C) Octocorals–Sponges, (D) Octocorals–Sponges–Antipatharians, and (E) Encrusting sponges. Images taken with the ROV Eloy V.
Diversity 14 00679 g007
Table 1. Biological assemblage of each group considering the SIMPER analysis (A–T). The letters U, V, represent groups with 100% of coverage. Inside the parenthesis is the OTUs number of the species that most contributed to the differences.
GroupBiological Assemblage with SIMPER AnalysisColor
Assigned
Biotic Unit
AAbundance ERSP (OTU39) with patch reef and octocorals Patch reef
OPatch reef and sand
WPatch reef
CScattered coral and sand Scattered coral and sand
PSand and Scattered coral
XScattered coral
FAbundance ERSP (Agelas sceptrum) with rocks and sand Erect sponges with sand and rock
JAbundance ERSP (Agelas spp.) with sand
LAbundance ERSP (Aplysina archeri) with rock and sand
BAbundance Gorgonians (Antillogorgia sp.) with rock and sand Octocorals and black corals with rock and sand
DRocks and sand
EAbundance Gorgonians (cf. Nicella sp1.) with rock and sand
GAbundance Black corals (Stichopathes sp.) with rock and sand
HAbundance Gorgonians (cf. Nicella sp2.) with rock and sand
KAbundance Gorgonians (Ellisella schmitti) with rock and sand
IAbundance ERSP (OTU49-OTU65) with green ENSP (OTU29) with rocks and sand Encrusting sponges in rock and sand
MEncrusting sponges (OTU27, OTU28, OTU29) with sand
NRocks, sand, and green encrusting sponge (OTU29)
QSand, rock, and green encrusting sponge (OTU29)
RRock, sand, and green encrusting sponge (OTU29)
SEncrusting sponges (OTU19, OTU29, OTU36)
TGreen encrusting sponge (OTU29) and rock
UCoral pavement Coral pavement
VSand Sand
ERSP: Erect sponges. ENSP: Encrusting sponges.
Publisher’s Note: MDPI stays neutral with regard to jurisdictional claims in published maps and institutional affiliations.

