
Unveiling the Genetic Diversity of Declining Population of the Harvest Mouse Micromys minutus in Italy

 ,
,  , , and
Abstract
:1. Introduction
2. Materials and Methods
3. Results
4. Discussion
5. Conclusions
Author Contributions
Funding
Institutional Review Board Statement
Informed Consent Statement
Data Availability Statement
Acknowledgments
Conflicts of Interest
Appendix A

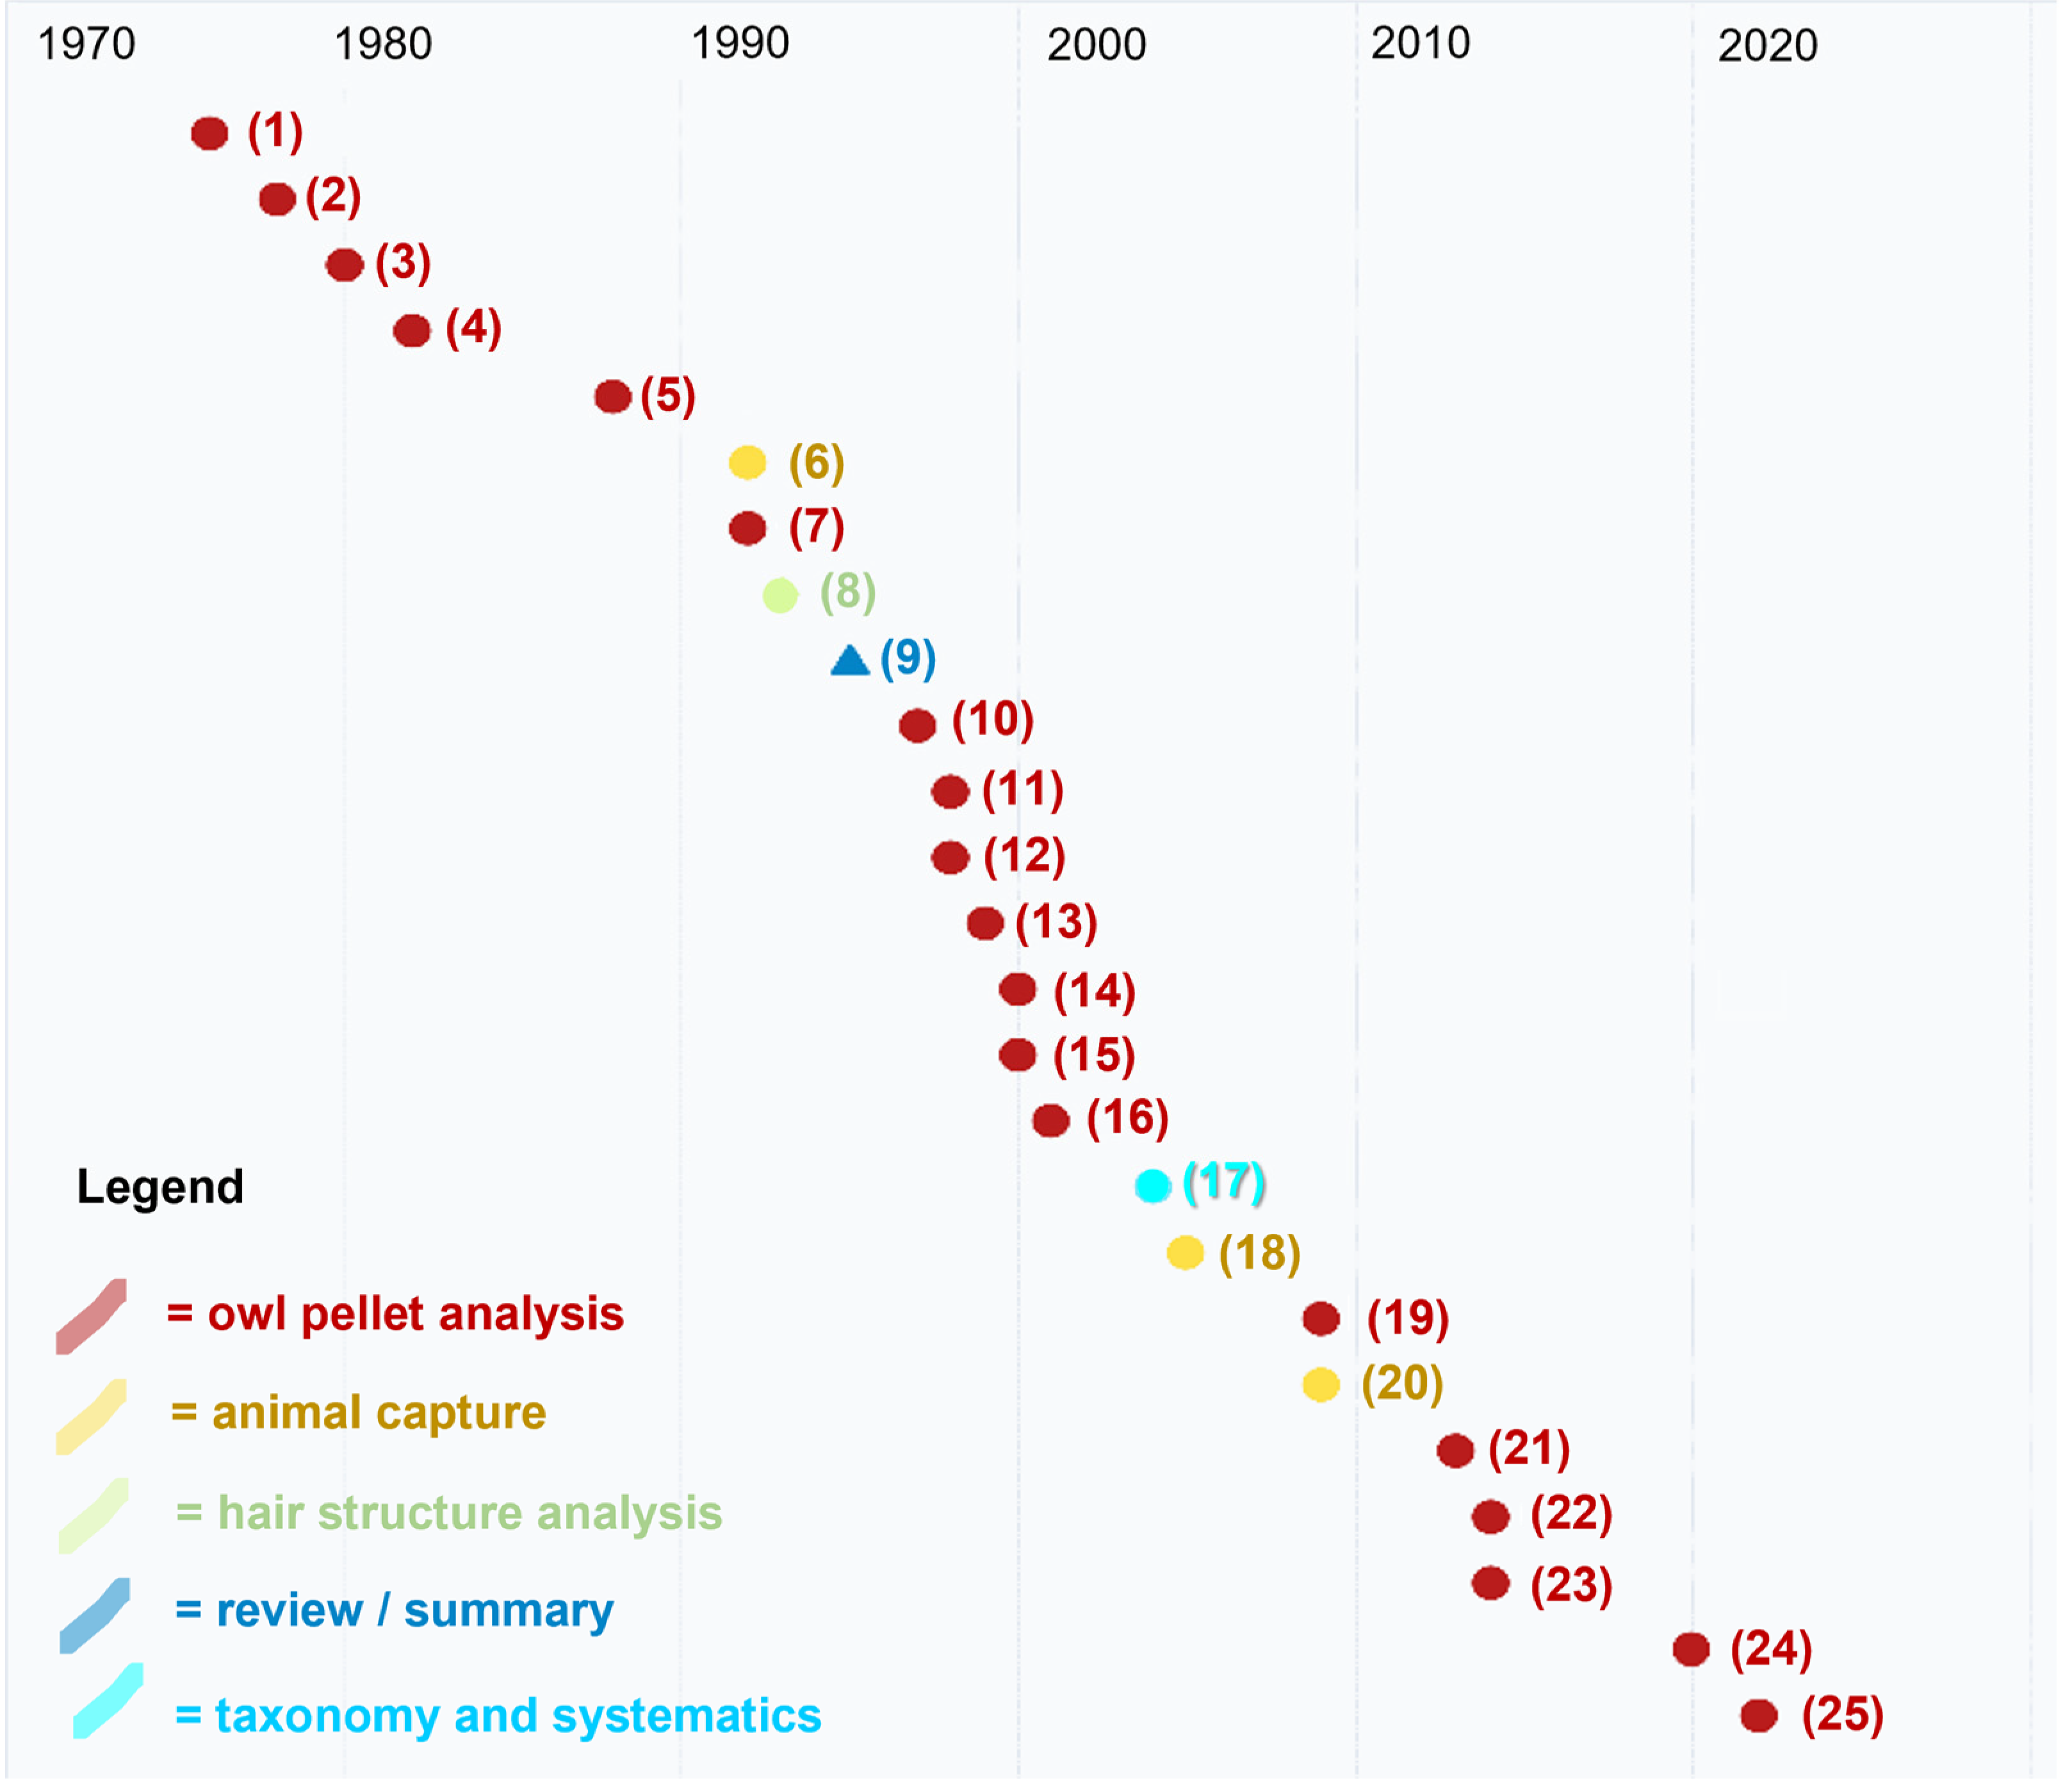
| Year | Full Reference | Method | Topic |
|---|---|---|---|
| 1976 | (1) Barbieri, F.; Fogliani, G.; Fasola, M. Aspetti della predazione di barbagianni (T. alba). Atti V Simp. Cons. Nat. Bari 1976, 5, 293–302. | Owl pellet analysis | Distribution |
| 1978 | (2) Bertazzini, M.; Sala, B. Prime indagini sulle associazioni a micromammiferi del Basso Ferrarese. Studi Trentini Scienze Nat. 1978, 55, 35–46. | Owl pellet analysis | Distribution |
| 1980 | (3) Gerdol, R.; Mantovani, E. Dati preliminari sulla predazione di Tyto alba (Scopoli) nel ferrarese. Avocetta 1980, 4, 83–86. | Owl pellet analysis | Distribution |
| 1982 | (4) Boldreghini, P.; Casini, L.; Santolini, R. Dati sulla predazione di Tyto alba (Scop.) su micromammiferi nelle Valli Bertuzzi (Delta del Po). Boll. Zool. 1982, 49, 23–24. | Owl pellet analysis | Distribution |
| 1988 | (5) Boldreghini, P.; Casini, L.; Santolini, R. Variazioni stagionali della dieta di Tyto alba nel Bosco della Mesola (Delta del Po). Nat. Sicil. 1988, 4, 151–153. | Owl pellet analysis | Distribution |
| 1992 | (6) Canova, L. Distribution and habitat preference of small mammals in a biotope of the north Italian plain. Ital. J. Zool. 1992, 59, 417–420. | Captures | Ecology |
| 1992 | (7) Bon, M.; Roccaforte, P.; Sirna, G. Primi dati sui micromammiferi della gronda lagunare di Venezia tramite borre di Tyto alba (Scopoli, 1796). Boll. Mus. Civ. Sto. Nat. Venezia 1992, 41, 256–273. | Owl pellet analysis | Distribution |
| 1993 | (8) De Marinis, A.M.; Agnelli, P. Guide to the microscope analysis of Italian mammals hairs: Insectivora, Rodentia and Lagomorpha. Ital. J. Zool. 1993, 60, 225–232. | Hair structure analysis | Morphology |
| 1995 | (9) Agnelli, P.; Lazzaretti, A. On the distribution of Micromys minutus in Italy. Ital. J. Zool. 1995, 62, 395–399. | Review | Distribution |
| 1997 | (10) Gotta, A.; Pigozzi, G. Trophic niche of the barn owl and little owl in a rice field habitat in northern Italy. Ital. J. Zool. 1997, 64, 55–59. | Owl pellet analysis | Distribution |
| 1998 | (11) Castioni, C.; Debernardi, P.; Patriarca, E. L’alimentazione invernale del Gufo comune (Asio otus) nel Parco del Ticino (Italia nord-occidentale). Riv. Piem. Sto. Nat. 1998, 19, 299–312. | Owl pellet analysis | Distribution |
| 1998 | (12) Mazzotti, S.; Caramori, G. Analysis of small mammal communities in South-Eastern Po valley. Gortania 1998, 20, 253–262. | Owl pellet analysis | Distribution |
| 1999 | (13) Paci, A.; Romano, C. Micromammalia umbra: aggiornamento allo status 1983. Atti Conv. Naz. Biol. Selv. 1999, 4, 142. | Owl pellet analysis | Distribution |
| 2000 | (14) Ragni, B.; Chiappini, M.M. Micromys minutus (Mammalia, Rodentia) nel Lago Trasimeno (Italia, Umbria). Riv. Idrobiol. 2000, 89, 215–220. | Owl pellet analysis | Distribution |
| 2000 | (15) Pirovano, A.; Rubolini, D.; Brambilla, S.; Ferrari, N. Winter diet of urban roosting Long-eared Owls Asio otus in northern Italy: the importance of the Brown Rat Rattus norvegicus. Bird Study 2000, 47, 242–244. | Owl pellet analysis | Distribution |
| 2001 | (16) Manganelli, G.; Pezzo, F.; Piazzini, S. Micromys minutus (Mammalia, Rodentia, Muridae) nel comprensorio dei Laghi di Chiusi e Montepulciano (Toscana—Umbria). Atti Soc. Tosc. Sci. Nat. 2001, 108, 109–111. | Owl pellet analysis | Distribution |
| 2004 | (17) Agnelli, P.; Nappi, A.; Maio, N. Conclusive remarks about the synonymy of Mus meridionalis OG Costa, 1844 (Mammalia, Rodentia, Muridae). Ital. J. Zool. 2004, 71, 353–357. | Taxonomic assessment | Taxonomy |
| 2005 | (18) Mazzotti, S.; Lunardi, S. Struttura e fenologia delle comunità della microteriofauna di Valle Brusà. Quad. Staz. Ecol. Civ. Mus. Sto. Nat. Ferrara 2005, 15, 113–124. | Captures | Ecology |
| 2009 | (19) Lapini, L. Small mammals of the Natural Reserve” Lake of Cornino” (Forgaria nel Friuli, Udine, North-Eastern Italy). Gortania 2009, 31, 143–170. | Captures | Distribution |
| 2009 | (20) Gaggi, A.; Paci, A.M. Note sull’orientamento trofico del barbagianni Tyto alba in Umbria. Uccelli d’Italia 2009, 34, 19–34. | Owl pellet analysis | Distribution |
| 2013 | (21) Mazzotti, S.; Tiozzi, E. Impatto dei cambiamenti climatici sulle comunità di micromammiferi (Mammalia: Soricomorpha, Rodentia) del Delta del Po. Quad. Mus. Sto. Nat. Ferrara 2013, 1, 111–117. | Owl pellet analysis | Distribution |
| 2014 | (22) Gaggi, A.; Paci, A.M. Atlante degli Erinaceomorfi dei Soricomorfi e dei Piccoli Roditori dell’Umbria. Dimensione Grafica Snc, Spello (Perugia), Italy, 2014. | Owl pellet analysis | Distribution |
| 2014 | (23) Ferri, V.; Soccini, C.; Battisti, C. Check-List dei Mammiferi della Riserva Naturale di Monticchie (Lodi; Italia Settentrionale)—1985–2012. Nat. Hist. Sci. 2014, 1, 49–54. | Owl pellet analysis | Distribution |
| 2020 | (24) Bini, A.; Cecere, F.; Rossetti, G.; Leandri, F.; Mori, E. Il ruolo dei micromammiferi nella dieta del gufo comune nella Pianura Padana Cremonese. Quad Mus Civ. Sto Nat. Ferrara 2020, 8, 93–99. | Owl pellet analysis | Distribution |
| 2022 | (25) Mori, E.; Bartolini, A.; Zarri, E.; Bini, A.; Bona, F.; Ussi, F.; Viviano, A. On the safe side of the rock: harvest mice still occur in “Padule di Fucecchio” wetland (Tuscany, Central Italy). Atti del XII Congresso Italiano di Teriologia, Cogne (AO), 08-11/06/2022 2022, 1. | Owl pellet analysis | Distribution |
References
- Hewitt, G.M. Mediterranean peninsulas: The evolution of hotspots. In Biodiversity Hotspots; Zachos, F.E., Habel, J.C., Eds.; Springer: Amsterdam, The Netherlands, 2011; pp. 123–147. [Google Scholar]
- Amori, G.; Castiglia, R. Mammal endemism in Italy: A review. Biogeographia 2018, 33, 19–31. [Google Scholar] [CrossRef] [Green Version]
- Loy, A.; Aloise, G.; Ancillotto, L.; Angelici, F.M.; Bertolino, S.; Capizzi, D.; Castiglia, R.; Colangelo, P.; Contoli, L.; Cozzi, B.; et al. Mammals of Italy: An annotated checklist. Hystrix 2019, 30, 87–106. [Google Scholar]
- Canestrelli, D.; Cimmaruta, R.; Costantini, V.; Nascetti, G. Genetic diversity and phylogeography of the Apennine yellow-bellied toad Bombina pachypus, with implications for conservation. Molec. Ecol. 2005, 15, 3741–3754. [Google Scholar] [CrossRef]
- Randi, E.; Alves, P.C.; Carranza, J.; Milošević-Zlatanović, S.; Sfougaris, A.; Mucci, N. Phylogeography of roe deer (Capreolus capreolus) populations: The effects of historical genetic subdivisions and recent nonequilibrium dynamics. Mol. Ecol. 2004, 13, 3071–3083. [Google Scholar] [CrossRef]
- Randi, E. Genetics and conservation of wolves Canis lupus in Europe. Mammal Rev. 2011, 41, 99–111. [Google Scholar] [CrossRef]
- Loy, A.; Genov, P.; Galfo, M.; Jacobone, M.G.; Vigna Taglianti, A. Cranial morphometrics of the Apennine brown bear (Ursus arctos marsicanus) and preliminary notes on the relationships with other southern European populations. Ital. J. Zool. 2008, 75, 67–75. [Google Scholar] [CrossRef] [Green Version]
- Bertolino, S.; Colangelo, P.; Mori, E.; Capizzi, D. Good for management, not for conservation: An overview of research, conservation and management of Italian small mammals. Hystrix 2015, 26, 25–35. [Google Scholar]
- Vega, R.; Amori, G.; Aloise, G.; Cellini, S.; Loy, A.; Searle, J.B. Genetic and morphological variation in a Mediterranean glacial refugium: Evidence from Italian pygmy shrews, Sorex minutus (Mammalia: Soricomorpha). Biol. J. Linn. Soc. 2010, 100, 774–787. [Google Scholar] [CrossRef] [Green Version]
- Bannikova, A.A.; Zemlemerova, E.D.; Colangelo, P.; Sözen, M.; Sevindik, M.; Kidov, A.A.; Dzuev, R.I.; Kryštufek, B.; Lebedev, V.S. An underground burst of diversity—A new look at the phylogeny and taxonomy of the genus Talpa Linnaeus, 1758 (Mammalia: Talpidae) as revealed by nuclear and mitochondrial genes. Zool. J. Linn. Soc. 2015, 175, 930–948. [Google Scholar] [CrossRef] [Green Version]
- Santucci, F.; Emerson, B.C.; Hewitt, G.M. Mitochondrial DNA phylogeography of European hedgehogs. Molec. Ecol. 1998, 7, 1163–1172. [Google Scholar] [CrossRef]
- Colangelo, P.; Aloise, G.; Franchini, P.; Annesi, F.; Amori, G. Mitochondrial DNA reveals hidden diversity and an ancestral lineage of the bank vole in the Italian peninsula. J. Zool. 2012, 287, 41–52. [Google Scholar] [CrossRef]
- Chiocchio, A.; Colangelo, P.; Aloise, G.; Amori, G.; Bertolino, S.; Bisconti, R.; Castiglia, R.; Canestrelli, D. Population genetic structure of the bank vole Myodes glareolus within its glacial refugium in peninsular Italy. J. Zool. System. Evol. Res. 2019, 57, 959–969. [Google Scholar] [CrossRef]
- Lo Brutto, S.; Sarà, M.; Arculeo, M. Italian Peninsula preserves an evolutionary lineage of the fat dormouse Glis glis L. (Rodentia: Gliridae). Biol. J. Linn. Soc. 2011, 102, 11–21. [Google Scholar] [CrossRef] [Green Version]
- Mouton, A.; Mortelliti, A.; Grill, A.; Sarà, M.; Kryštufek, B.; Juškaitis, R.; Latinne, A.; Amori, G.; Randi, E.; Büchner, S.; et al. Evolutionary history and species delimitations: A case study of the hazel dormouse, Muscardinus avellanarius. Conserv. Gen. 2017, 18, 181–196. [Google Scholar] [CrossRef]
- Rotondi, C.; Annesi, F.; Amori, G.; Aloise, G.; Mori, E.; Castiglia, R. The “mistery of the Etruscan”: Preliminary data on the phylogeographic relationships of Italian populations of the Etruscan shrew, Suncus etruscus (Savi, 1822). In Proceedings of the Atti del III Convegno Nazionale sui Piccoli Mammiferi, Colle Val d’Elsa, Italy, 8–9 November 2017; Volume 3, p. 37. [Google Scholar]
- Sandor, M.E.; Elphick, C.S.; Tingley, M.W. Extinction of biotic interactions due to habitat loss could accelerate the current biodiversity crisis. Ecol. Appl. 2022, 1, e2608. [Google Scholar] [CrossRef]
- Mortelliti, A.; Amori, G.; Capizzi, D.; Cervone, C.; Fagiani, S.; Pollini, B.; Boitani, L. Independent effects of habitat loss, habitat fragmentation and structural connectivity on the distribution of two arboreal rodents. J. Appl. Ecol. 2011, 48, 153–162. [Google Scholar] [CrossRef]
- Bertolino, S. Distribution and status of the declining garden dormouse Eliomys quercinus. Mammal Rev. 2017, 47, 133–147. [Google Scholar] [CrossRef]
- Chevret, P.; Renaud, S.; Helvaci, Z.; Ulrich, R.G.; Quéré, J.P.; Michaux, J.R. Genetic structure, ecological versatility, and skull shape differentiation in Arvicola water voles (Rodentia, Cricetidae). J. Zool. System. Evol. Res. 2020, 58, 1323–1334. [Google Scholar] [CrossRef]
- Yasuda, S.P.; Vogel, P.; Tsuchiya, K.; Han, S.H.; Lin, L.K.; Suzuki, H. Phylogeographic patterning of mtDNA in the widely distributed harvest mouse (Micromys minutus) suggests dramatic cycles of range contraction and expansion dujring the mid- to late Pleistocene. Can. J. Zool. 2005, 83, 1411–1420. [Google Scholar] [CrossRef] [Green Version]
- Kryštufek, B.; Lunde, D.P.; Meinig, H.; Aplin, K.; Batsaikhan, N.; Henttonen, H. Micromys minutus. The IUCN Red List of Threatened Species 2019. E.T13373A119151882. Available online: https://dx.doi.org/10.2305/IUCN.UK.2019-1.RLTS.T13373A119151882.en (accessed on 26 May 2022).
- Harris, S. History, distribution, status and habitat requirements of the harvest mouse in Britain. Mammal Rev. 1979, 4, 159–171. [Google Scholar] [CrossRef]
- Canova, L. Distribution and habitat preference of small mammals in a biotope of the North Italian plain. Ital. J. Zool. 1992, 59, 417–420. [Google Scholar] [CrossRef] [Green Version]
- Marks, M.; Lapin, B.; Randall, J. Phragmites australis (P. communis): Threats, management, and monitoring. Nat. Areas J. 1994, 14, 285–294. [Google Scholar]
- Darinot, F. The harvest mouse (Micromys minutus Pallas, 1771) as prey: A literature review. J. Vert. Biol. 2016, 65, 117–137. [Google Scholar]
- Råberg, L.; Loman, J.; Hellgren, O.; van der Kooij, J.; Isaksen, K.; Solheim, R. The origin of Swedish and Norwegian populations of the Eurasian harvest mouse (Micromys minutus). Acta Theriol. 2013, 58, 101–104. [Google Scholar] [CrossRef]
- Abramov, A.V.; Meschersky, I.G.; Rozhnov, V.V. On the taxonomic status of the harvest mouse Micromys minutus (Rodentia: Muridae) from Vietnam. Zootaxa 2009, 2199, 58–68. [Google Scholar] [CrossRef] [Green Version]
- Wauters, L.A.; Amori, G.; Aloise, G.; Gippoliti, S.; Agnelli, P.; Galimberti, A.; Casiraghi, M.; Preatoni, D.; Martinoli, A. New endemic mammal species for Europe: Sciurus meridionalis (Rodentia, Sciuridae). Hystrix 2017, 28, 1–8. [Google Scholar]
- Vogel, P.; Gander, A. Live trapping design for the harvest mouse (Micromys minutus) in its summer habitat. Rev. Suisse Zool. 2020, 122, 143–148. [Google Scholar]
- Amori, G.; Contoli, L.; Nappi, A. Mammalia II: Erinaceomorpha, Soricomorpha, Lagomorpha, Rodentia; Calderini Editions: Bologna, Italy, 2008. [Google Scholar]
- Bon, M. Nuovo Atlante dei Mammiferi del Veneto; WBA Monographs Editions: Verona, Italy, 2017. [Google Scholar]
- Deflorian, M.C.; Caldonazzi, M.; Zanghellini, S.; Pedrini, P. Atlante dei Mammiferi della provincia di Trento; Monografie del Museo delle Scienze 6; Soc. Veneziana di Scienze Naturali: Trento, Italy, 2019. [Google Scholar]
- Mori, E.; Bartolini, A.; Zarri, E.; Bini, A.; Bona, F.; Ussi, F.; Viviano, A. On the safe side of the rock: Harvest mice still occur in “Padule di Fucecchio” wetland (Tuscany, Central Italy). In Proceedings of the Atti del XII Congresso Italiano di Teriologia, Cogne, Italy, 8–11 June 2022. [Google Scholar]
- Buhay, J.E. COI-like sequences are becoming problematic in molecular systematic and DNA barcoding studies. J. Crustacean Biol. 2009, 29, 96–110. [Google Scholar] [CrossRef]
- Song, H.; Buhay, J.E.; Whiting, M.F.; Crandall, K.A. Many species in one: DNA barcoding overestimates the number of species when nuclear mitochondrial pseudogenes are coamplified. Proc. Nat. Acad. Sci. USA 2008, 105, 13486–13491. [Google Scholar] [CrossRef] [Green Version]
- Darriba, D.; Taboada, G.L.; Doallo, R.; Posada, D. jModelTest 2: More models, new heuristics and parallel computing. Nat. Methods 2012, 30, 772. [Google Scholar] [CrossRef] [Green Version]
- Ronquist, F.; Huelsenbeck, J.P. MrBayes 3: Bayesian phylogenetic inference under mixed models. Bioinformatics 2003, 19, 1572–1574. [Google Scholar] [CrossRef] [Green Version]
- Gouy, M.; Guindon, S.; Gascuel, O. SeaView version 4: A multiplatform graphical user interface for sequence alignment and phylogenetic tree building. Mol. Biol. Evol. 2010, 27, 221–224. [Google Scholar] [CrossRef] [Green Version]
- Clement, M.; Posada, D.; Crandall, K.A. TCS: A computer program to estimate gene genealogies. Mol. Ecol. 2000, 9, 1657–1660. [Google Scholar] [CrossRef] [Green Version]
- Bandelt, H.J.; Forster, P.; Röhl, A. Median-joining networks for inferring intraspecific phylogenies. Mol. Biol. Evol. 1999, 16, 37–48. [Google Scholar] [CrossRef]
- Santos, A.M.; Cabezas, M.P.; Tavares, A.I.; Xavier, R.; Branco, M. tcsBU: A tool to extend TCS network layout and visualization. Bioinformatics 2016, 32, 627–628. [Google Scholar]
- Rambaut, A.; Drummond, A.J.; Xie, D.; Baele, G.; Suchard, M.A. Posterior summarization in Bayesian phylogenetics using Tracer 1.7. System. Biol. 2018, 67, 901–904. [Google Scholar] [CrossRef] [Green Version]
- Bouckaert, R.; Heled, J.; Kühnert, D.; Vaughan, T.; Wu, C.H.; Xie, D.; Suchard, M.A.; Rambaut, A.; Drummond, A.J. BEAST 2: A software platform for Bayesian evolutionary analysis. PLoS Comp. Biol. 2014, 10, e1003537. [Google Scholar] [CrossRef] [Green Version]
- Martin, Y.; Gerlach, G.; Schlötterer, C.; Meyer, A. Molecular phylogeny of European muroid rodents based on complete cytochrome b sequences. Mol. Phyl. Evol. 2000, 16, 37–47. [Google Scholar]
- Arbogast, B.S.; Browne, R.A.; Weigel, P.D. Evolutionary genetics and Pleistocene biogeography of North American tree squirrels (Tamiasciurus). J. Mammal. 2001, 82, 302–319. [Google Scholar]
- Tamura, K.; Battistuzzi, F.U.; Billing-Ross, P.; Murillo, O.; Filipski, A.; Kumar, S. Estimating divergence times in large molecular phylogenies. Proc. Natl. Acad. Sci. USA 2012, 109, 19333–19338. [Google Scholar] [CrossRef] [Green Version]
- Drummond, A.J.; Suchard, M.A.; Xie, D.; Rambaut, A. Bayesian Phylogenetics with BEAUti and the BEAST 1.7. Mol. Biol. Evol. 2012, 29, 1969–1973. [Google Scholar] [CrossRef] [PubMed] [Green Version]
- Rambaut, A. FigTree. Ver.1.4. 2; University of Edinburgh Press: Edinburgh, UK, 2012. [Google Scholar]
- Nicolas, V.; Ndiaye, A.; Benazzou, T.; Souttou, K.; Delapre, A.; Denys, C. Phylogeography of the North African dipodil (Rodentia: Muridae) based on cytochrome-b sequences. J. Mammal. 2014, 95, 241–253. [Google Scholar] [CrossRef] [Green Version]
- Kim, H.R.; Park, Y.C. Genetic diversity and genetic structure of the striped field mouse Apodemus agrarius coreae (Muridae, Rodentia) in Korea. Gene 2015, 572, 292–297. [Google Scholar] [CrossRef] [PubMed]
- Barbosa, S.; Pauperio, J.; Searle, J.B.; Alves, P.C. Genetic identification of I berian rodent species using both mitochondrial and nuclear loci: Application to noninvasive sampling. Mol. Ecol. Res. 2013, 13, 43–56. [Google Scholar] [CrossRef] [PubMed]
- Bryja, J.; Mikula, O.; Patzenhauerová, H.; Oguge, N.O.; Šumbera, R.; Verheyen, E. The role of dispersal and vicariance in the pleistocene history of an e ast a frican mountain rodent, p raomys delectorum. J. Biogeogr. 2014, 41, 196–208. [Google Scholar] [CrossRef]
- McDonough, M.M.; Šumbera, R.; Mazoch, V.; Ferguson, A.W.; Phillips, C.D.; Bryja, J. Multilocus phylogeography of a widespread savanna–woodland-adapted rodent reveals the influence of Pleistocene geomorphology and climate change in Africa’s Zambezi region. Mol. Ecol. 2015, 24, 5248–5266. [Google Scholar] [CrossRef]
- Ghawar, W.; Chaouch, M.; Ben Abderrazak, S.; Snoussi, M.A.; Salem, S.; Chouchen, S.; Bouaoun, A.; Salah, A.B.; Bettaieb, J. Evaluation of the Taxonomic Status of Lesser Egyptian Jerboa, Jaculus jaculus: First Description of New Phylogroups in Tunisia. Animals 2022, 12, 758. [Google Scholar] [CrossRef]
- Ellerman, J.R.; Morrison-Scott, T.C.S. Checklist of Palaearctic and Indian Mammals 1758 to 1946; Natural History Museum: London, UK, 1951. [Google Scholar]
- Hewitt, G.M. Some genetic consequences of ice ages, and their role in divergence and speciation. Biol. J. Linn. Soc. 1996, 58, 247–276. [Google Scholar] [CrossRef]
- Bon, M.; Trabucco, R.; Delfino, M. La fauna del Pozzo Romano di Lova (Laguna di Venezia, I sec. a.C.—I sec- d. C.). Boll. Mus. Civ. Sto. Nat. Venezia 2001, 51, 159–185. [Google Scholar]
- Spitzenberger, F. Micromys minutus (Pallas, 1771). In The Atlas of European Mammals; Mitchell-Jones, A.J., Amori, G., Bogdanowicz, W., Krystufek, B., Reijnders, P.J.H., Spitzenberger, F., Stubbe, M., Thissen, J.B.M., Vohralik, V., et al., Eds.; Academic Press: London, UK, 1999; pp. 264–265. [Google Scholar]
- Musser, G.G.; Carleton, M.D. Family Muridae. In Mammal Species of the World. A Taxonomic and Geographic Reference; Wilson, D.E., Reeder, D.H., Eds.; Smithsonian Institute Press: Washington, DC, USA, 1993; pp. 501–755. [Google Scholar]
- Mamuris, Z.; Sfougaris, A.I.; Stamatis, C. Genetic structure of Greek brown hare (Lepus europaeus) populations as revealed by mtDBNA RFLP-PCR analysis: Implications for conserving genetic diversity. Biol. Conserv. 2001, 101, 187–196. [Google Scholar] [CrossRef]
- Darinot, F.; Le Petitcorps, Q.; Arnal, V.; Coulon, A.; Montgelard, C. Effects of landscape features and flooding on the genetic structure of a small wetland rodent, the harvest mouse (Micromys minutus). Landsc. Ecol. 2021, 36, 1755–1771. [Google Scholar] [CrossRef]
- Cagnacci, F.; Cardini, A.; Ciucci, P.; Ferrari, N.; Mortelliti, A.; Preatoni, D.G.; Russo, D.; Scandura, M.; Wauters, L.A.; Amori, G. Less is more: Researcher survival guide in times of economic crisis. Hystrix 2012, 23, 1–7. [Google Scholar]
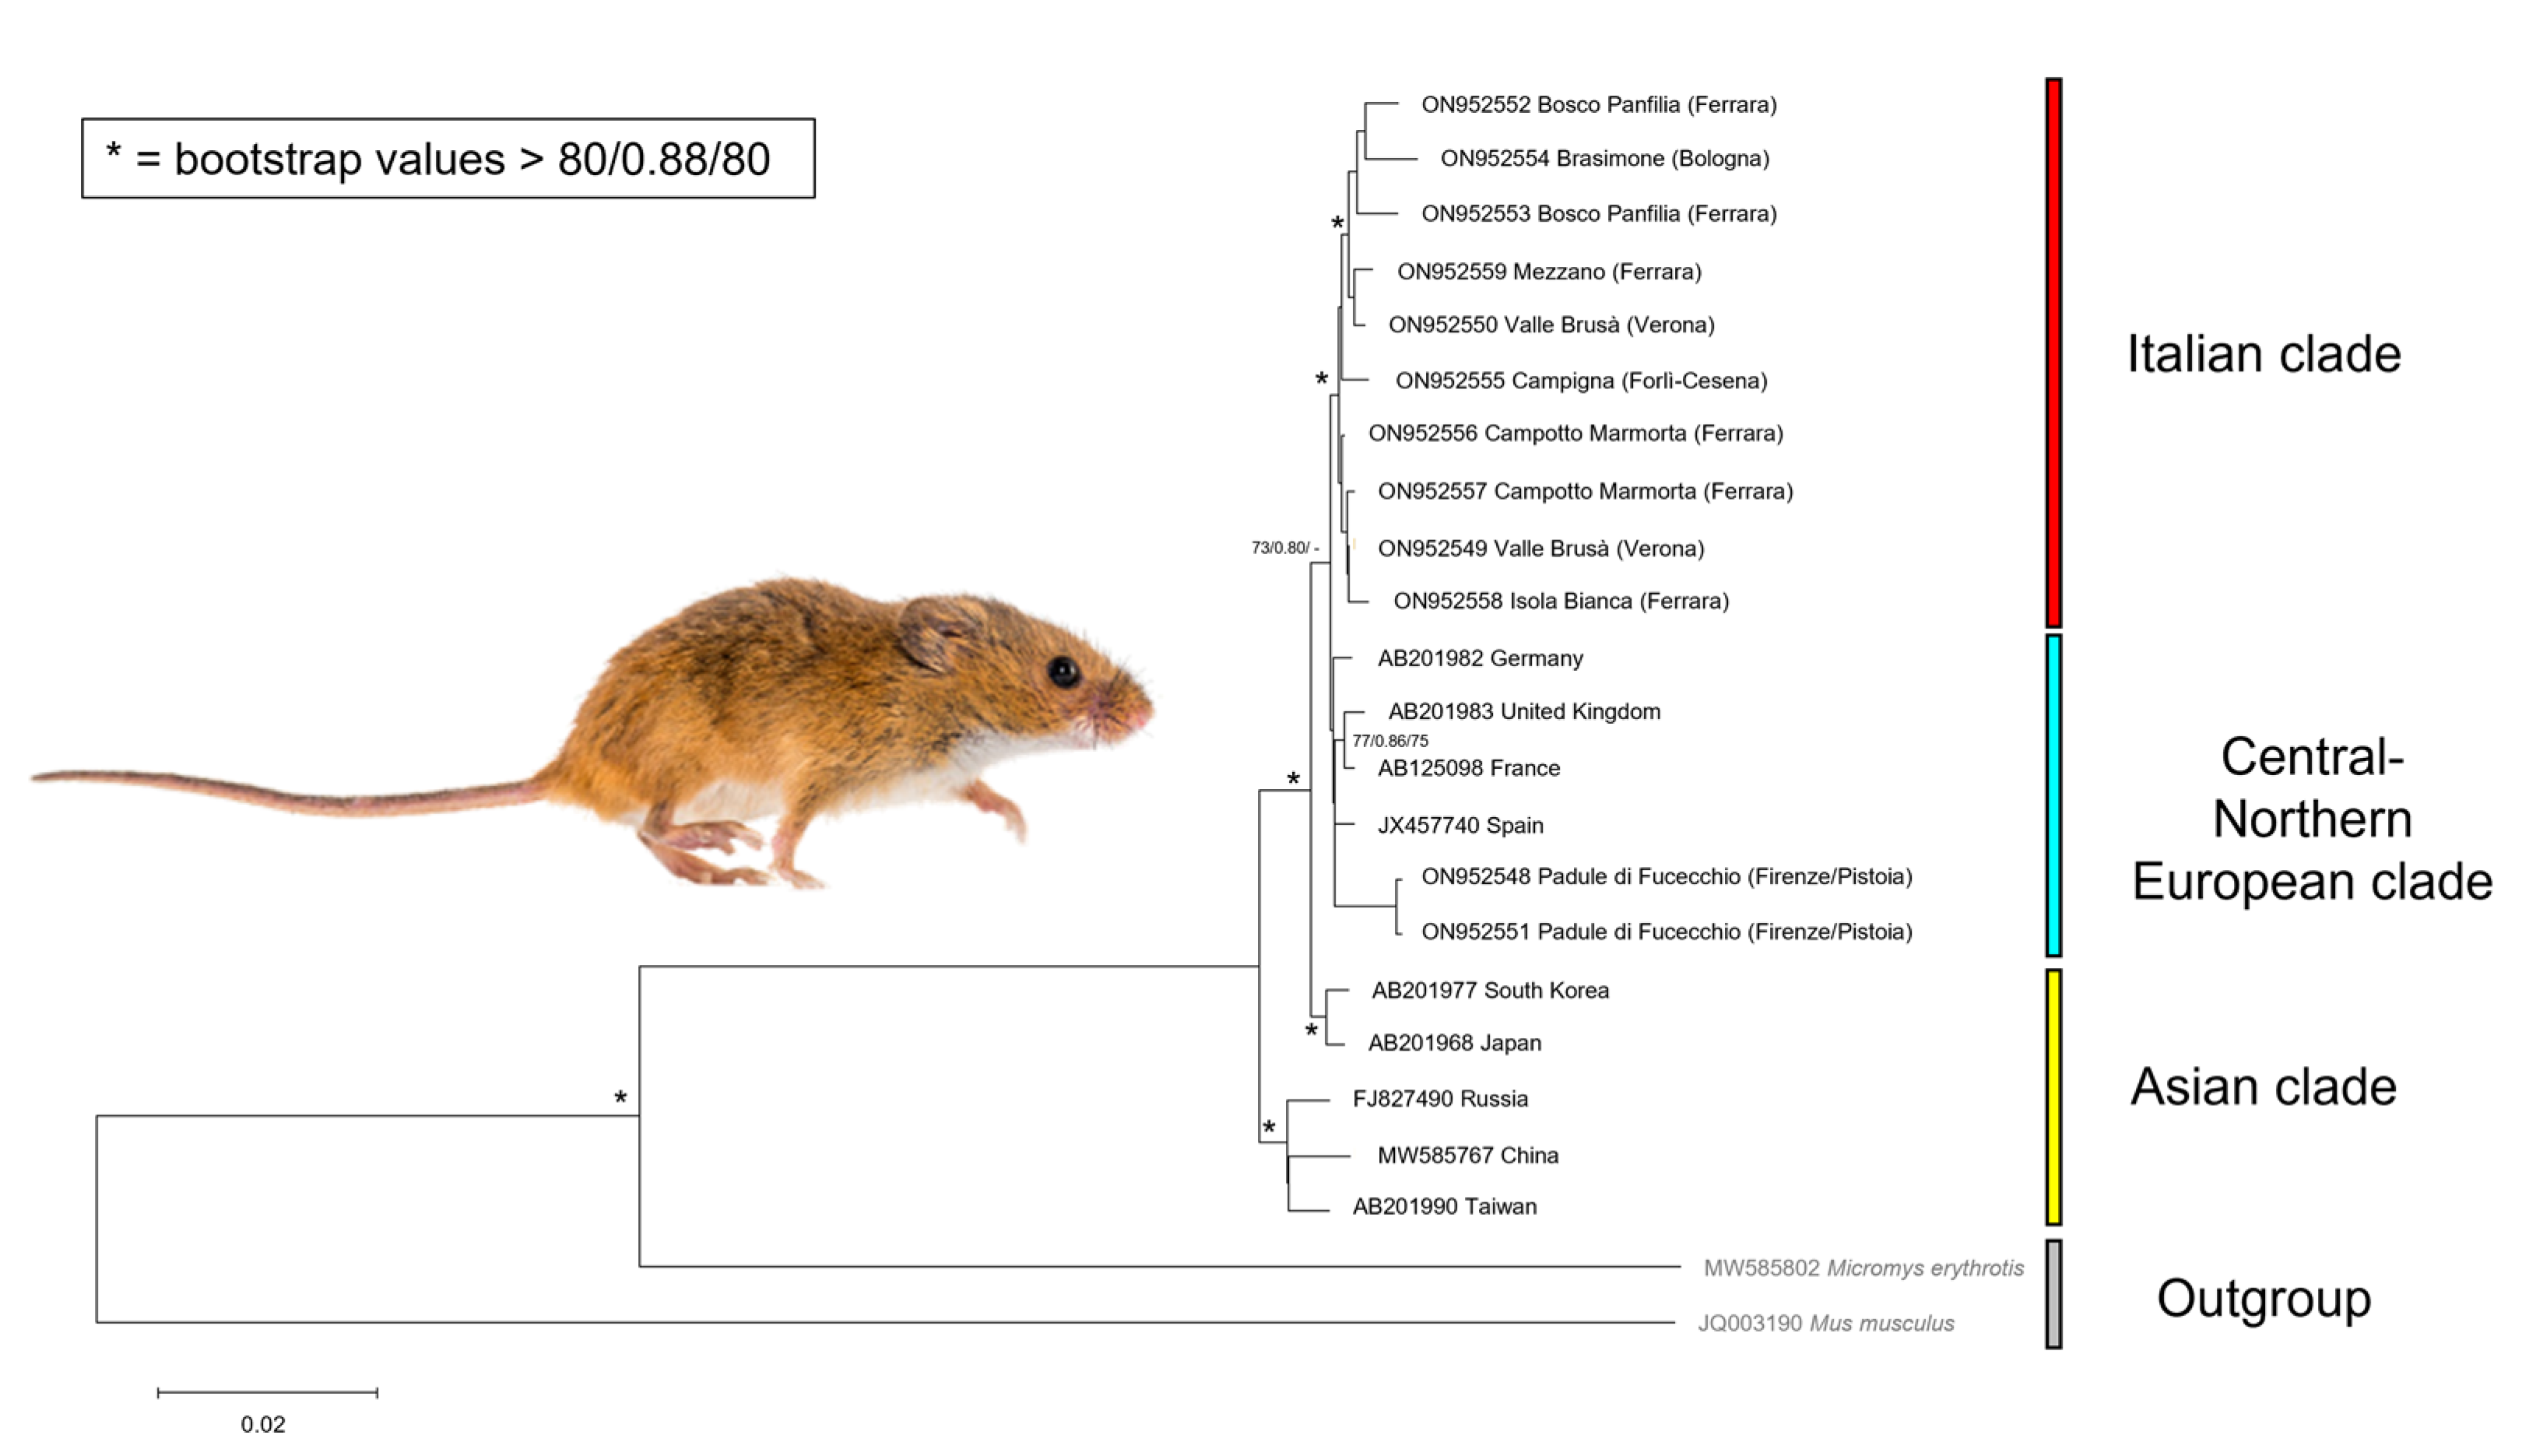

| Label | Location of Origin (District) | Region | Collection | Year of Collection | Museum Specimen Code | GenBank Accession Number |
|---|---|---|---|---|---|---|
| (Italy) | ||||||
| MM1 | Bosco Panfilia, S. Agostino (Ferrara) | Emilia Romagna | Museo Civico di Storia Naturale (Ferrara) | 2000 | R336 | ON952552 |
| MM2 | Bosco Panfilia, S. Agostino (Ferrara) | Emilia Romagna | Museo Civico di Storia Naturale (Ferrara) | 2000 | R351 | ON952553 |
| MM3 | Brasimone, Castiglione Pepoli (Bologna) * | Emilia Romagna | Museo Civico di Storia Naturale (Ferrara) | 1992 | R154 | ON952554 |
| MM4 | Campigna (Forlì-Cesena) * | Emilia Romagna | Museo Civico di Storia Naturale (Ferrara) | 1980 | R073 | ON952555 |
| MM5 | Campotto Marmorta (Ferrara) | Emilia Romagna | Museo Civico di Storia Naturale (Ferrara) | 1991 | R089 | ON952556 |
| MM6 | Campotto Marmorta (Ferrara) | Emilia Romagna | Museo Civico di Storia Naturale (Ferrara) | 1991 | R090 | ON952557 |
| MM7 | Isola Bianca (Ferrara) | Emilia Romagna | Museo Civico di Storia Naturale (Ferrara) | 1996 | R152 | ON952558 |
| MM9 | Mezzano (Ferrata) | Emilia Romagna | Museo Civico di Storia Naturale (Ferrara) | 2004 | R556 | ON952559 |
| MM10 | Padule di Fucecchio (Firenze-Pistoia) | Tuscany | CNR-IRET Molecular Lab (Sesto Fiorentino) | 2022 | NA | ON952548 |
| MM11 | Valle Brusà—Cerea (Verona) | Veneto | Museo Civico di Storia Naturale (Ferrara) | 2006 | R614 | ON952549 |
| MM12 | Valle Brusà—Cerea (Verona) | Veneto | Museo Civico di Storia Naturale (Ferrara) | 2006 | R626 | ON952550 |
| MM14 | Padule di Fucecchio (Firenze-Pistoia) | Tuscany | CNR-IRET Molecular Lab (Sesto Fiorentino) | 2022 | NA | ON952551 |
| Germany * | NA | AB201982 | ||||
| France * | NA | AB125098 | ||||
| Spain * | NA | JX457740 | ||||
| United Kingdom * | NA | AB201983 | ||||
| Russia * | NA | FJ827490 | ||||
| China * | NA | MW585767 | ||||
| Japan * | NA | AB201968 | ||||
| Taiwan * | NA | AB201990 | ||||
| South Korea * | NA | AB201977 | ||||
| Outgroup | Micromys erythrotis * | NA | MW585805 | |||
| Outgroup | Mus musculus * | NA | JQ003190 |
Publisher’s Note: MDPI stays neutral with regard to jurisdictional claims in published maps and institutional affiliations. |
© 2022 by the authors. Licensee MDPI, Basel, Switzerland. This article is an open access article distributed under the terms and conditions of the Creative Commons Attribution (CC BY) license (https://creativecommons.org/licenses/by/4.0/).
Share and Cite
Mori, E.; Viviano, A.; Mazzotti, S.; Sogliani, D.; Bini, A.; Baratti, M. Unveiling the Genetic Diversity of Declining Population of the Harvest Mouse Micromys minutus in Italy. Diversity 2022, 14, 627. https://doi.org/10.3390/d14080627
Mori E, Viviano A, Mazzotti S, Sogliani D, Bini A, Baratti M. Unveiling the Genetic Diversity of Declining Population of the Harvest Mouse Micromys minutus in Italy. Diversity. 2022; 14(8):627. https://doi.org/10.3390/d14080627
Chicago/Turabian StyleMori, Emiliano, Andrea Viviano, Stefano Mazzotti, Davide Sogliani, Alessandro Bini, and Mariella Baratti. 2022. "Unveiling the Genetic Diversity of Declining Population of the Harvest Mouse Micromys minutus in Italy" Diversity 14, no. 8: 627. https://doi.org/10.3390/d14080627
APA StyleMori, E., Viviano, A., Mazzotti, S., Sogliani, D., Bini, A., & Baratti, M. (2022). Unveiling the Genetic Diversity of Declining Population of the Harvest Mouse Micromys minutus in Italy. Diversity, 14(8), 627. https://doi.org/10.3390/d14080627