Article

Spatial and Temporal Variability in Parrotfish Assemblages on Bahamian Coral Reefs

Perry Institute for Marine Science, Fisheries Research and Conservation Program, P.O. Box 435, Waitsfield, VT 05673, USA
*
Author to whom correspondence should be addressed.
Diversity 2022, 14(8), 625; https://doi.org/10.3390/d14080625
Submission received: 2 June 2022 / Revised: 3 August 2022 / Accepted: 4 August 2022 / Published: 6 August 2022
(This article belongs to the Section Marine Diversity)

Abstract

:
Because herbivory is a critical component of resilient reefs, there is a need to investigate the dynamics of herbivorous fish assemblages over various spatiotemporal scales. During the period of 2011–2019, 483 belt transect surveys were conducted across 26 sites around New Providence to assess the status of parrotfish populations across different reefs. Non-metric multidimensional scaling revealed two distinct parrotfish assemblages around New Providence temporally, differing between 2019 and earlier surveys, and spatially between fore and patch reef zones. Temporal analysis showed a significant decrease (59%) in parrotfish densities across reef sites and significant changes in mean density over time for three species Scarus iseri, Sparisoma aurofrenatum and Sp. atomarium. Changes in the size frequency distribution of parrotfish—particularly reductions in individuals ≥31 cm in size and the complete loss of fish >40 cm across all sites were found. Interactions between reef zone and size class were significant with the greater frequencies of larger individuals (≥21 cm) driving patterns (positive associations) on forereefs. These patterns also appear to be partly driven by variability in the abundance and size composition of Sparisoma viride, which is one of the species primarily targeted by Bahamian fishers, as well as one of the most common parrotfish across reef zones.

1. Introduction

Coral reefs are highly productive and diverse ecosystems that provide critical ecosystem services and functions to coastal communities worldwide. Coral reefs provide food security, generate revenue and protect coastlines, making them the most valuable ecosystem on the planet on a per unit area basis [1,2]. However, globally coral reefs are in crisis from anthropogenic and natural threats that vary spatially in scale and intensity [3,4,5,6,7]. The resilience of coral reef ecosystems is dependent on diverse faunal communities, particularly herbivores [8].
Abundant and biodiverse fish assemblages have been recognized as important for maintaining trophic dynamics, productivity, benthic community composition and structure for resilient coral reef ecosystems [9,10,11,12]. Herbivorous fish (e.g., parrotfish (Scarini) and surgeonfish (Acanthuridae)) contribute to multiple biological and physical processes within coral reef systems. Of particular interest is their ability to regulate macroalgal cover through grazing [8,12,13,14,15], which is beneficial for enhancing recruitment and survivorship of reef-building corals [16,17]. However, emerging research is beginning to provide a more comprehensive understanding of the functional roles of herbivorous fish, which is often species-specific [15,18,19,20]. Interspecific differences in parrotfish grazing and bioerosion rates appear to be related to their composition, size structure and habitat use [19,21]. Parrotfish assemblages can be influenced by both fishing [8,22,23] as well as the habitat type, seascape configuration and local environmental conditions such as depth [24,25]. Thus, major or even subtle declines in any herbivorous fish species may impact ecosystem function and are of great concern.
In recent decades, the overexploitation of traditional fish species such as groupers (Epinephelidae) and snappers (Lutjanidae) has led to increased fishing pressure on non-traditional reef fish including herbivores [16,17,26,27,28]. Fishing for commercial, subsistence or recreational purposes occurs throughout the Bahamian archipelago, but reef associated fishing is concentrated on the banks [28]. Herbivorous parrotfish are an example of a non-traditional fishery that has emerged within The Bahamas with up to 30% of fishers harvesting them on each trip [29]. Previous studies have shown that parrotfish biomass in The Bahamas was greater within marine protected areas (MPAs) than reefs outside MPAs [16,17,30]. Although The Bahamas generally has more abundant herbivorous fish populations compared to other countries in the region, in situ assessments from the last decade have shown a decrease in parrotfish biomass in some islands (e.g., New Providence) that may be associated with a growing fishery [28,29,30,31,32]. Fishing pressure for parrotfish is variable throughout the country and is related to differences in age, fishing method and island [29]. Callwood [29] reports that fishers from the islands of New Providence, Grand Bahama and Eleuthera are most likely to target parrotfish via Hawaiian sling or handline fishing, although a range of gear types are employed across the archipelago. However, despite the emergence of this fishery and a growing demand by both individuals and restaurants [29], no management measures currently exist for parrotfish in The Bahamas.
Because herbivory is a critical component of resilient coral reef ecosystems, there is a need to investigate the dynamics of herbivorous fish assemblages over various spatial scales and identify the processes that may be driving the observed patterns. This information is necessary to mitigate biodiversity loss and declines in reef condition and function through improved management approaches such as fisheries regulations [22,33] and the design and establishment of effective marine protected areas [33,34,35,36]. Here, we used a long-term data set to examine the fine-scale spatial and temporal patterns of parrotfish diversity on Bahamian coral reefs. The specific objectives were to (1) quantitatively assess the population status of parrotfish species over time across different reefs and zones around New Providence and Rose Island and (2) determine whether changes in parrotfish composition and abundance have occurred that may be associated with the growing fishery for herbivorous fish.

2. Materials and Methods
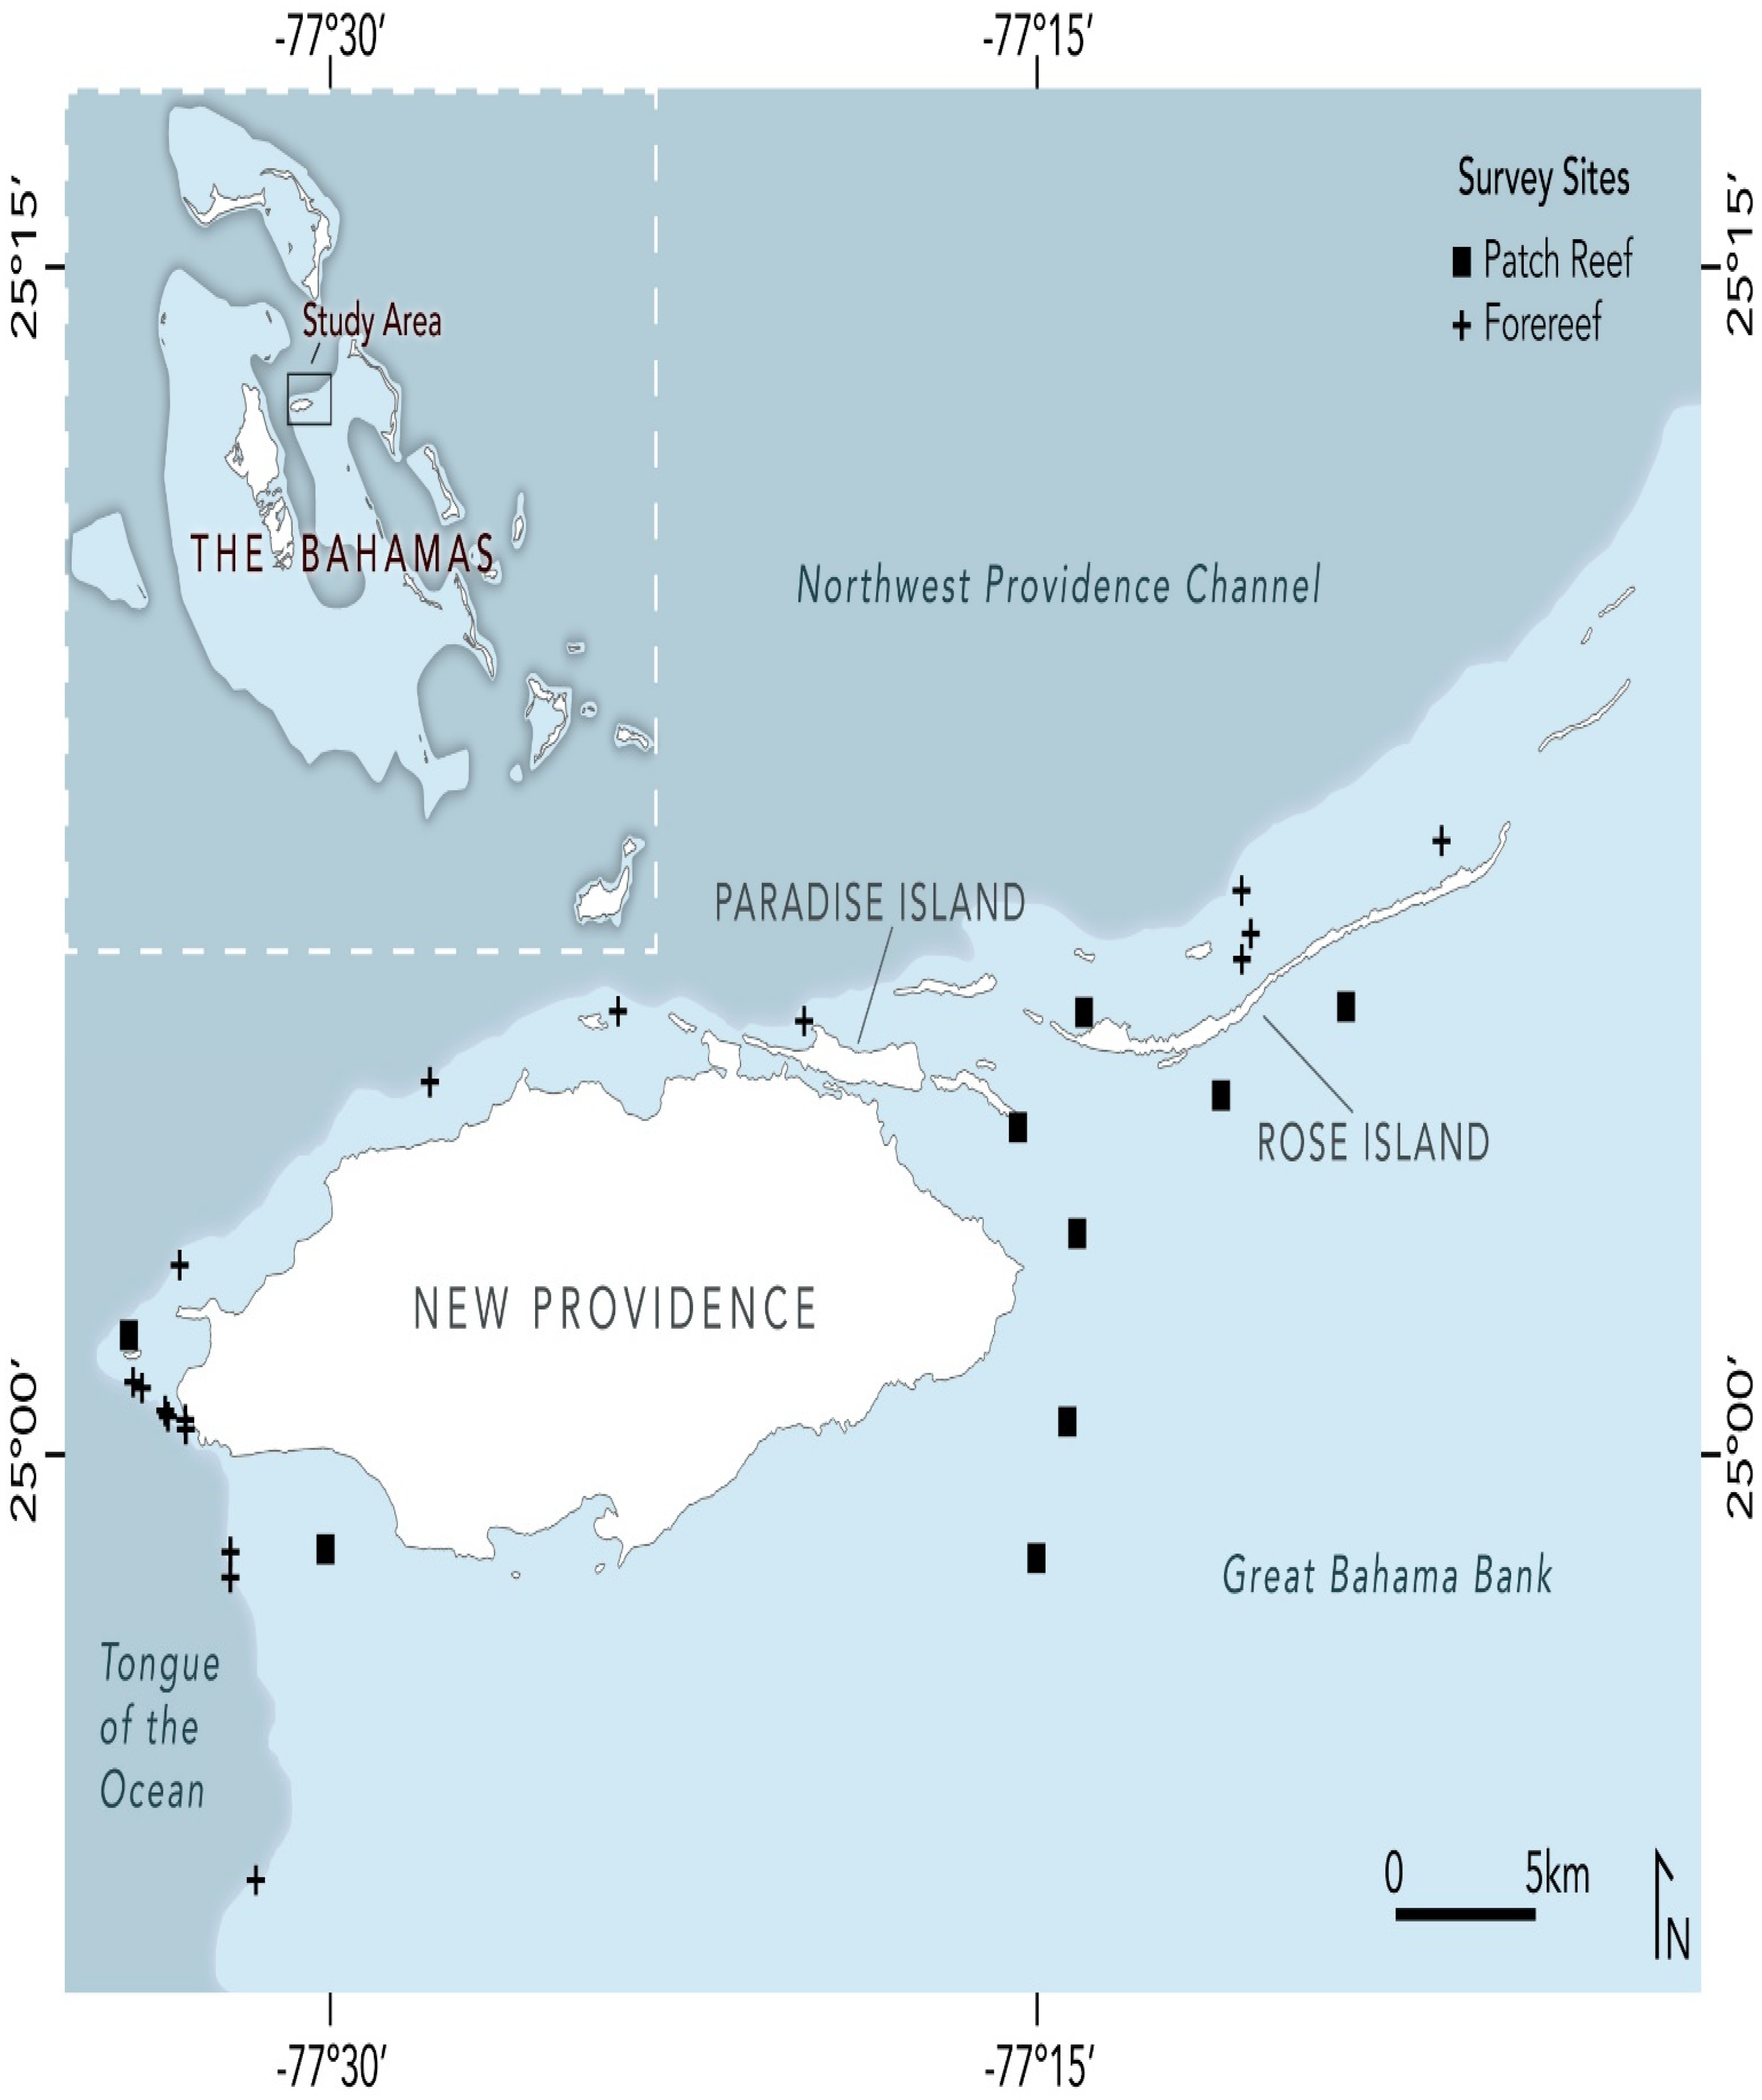
2.1. Study Area

This study was conducted in The Bahamas, an archipelagic island nation situated between 20° and 28° N latitude and 72° and 80° W longitude, with an exclusive economic zone encompassing ~630,000 km2. Surveys were completed around the islands of New Providence where the country’s capital (Nassau) is located and nearby Rose Island—hereafter collectively referred to as New Providence (Figure 1). Forereef habitats are large linear reefs running in parallel to the shoreline along the northern coasts of both islands at a depth of 5–20 m between the reef crest and sheer drop-off into deeper water. Forereefs also occur along the shelf edge of the Tongue of the Ocean off the southwest coast of New Providence, but this section of reef lacks a reef crest. Shallow patch reefs are isolated reef clusters surrounded by sand and seagrass on the bank south of Rose Island and are scattered across the Great Bahama Bank to the south of New Providence in 3–7 m of water [37]. Coral and macroalgal cover are variable across sites and reef zones, but averages ~15% and 42%, respectively, around New Providence [32].

2.2. Fish Surveys

The Atlantic Gulf Rapid Reef Assessment (AGRRA) protocol (https://www.agrra.org/; accessed on 3 August 2021) was used to conduct quantitative fish surveys on coral reefs from 26 sites, representing two reef zones: patch (n = 9) and forereef (n = 17) (Figure 1; Table 1). Fish assessments were completed during three survey periods: 2011–2012, 2015–2016 and 2019. Surveys during the first period were completed in October 2011 (fall) and May 2012 (spring). During the second survey period, assessments occurred in July 2012 (summer) and May 2012 (spring). For the final survey period, surveys were completed in the months of April and June (spring and summer). Three trained surveyors with expertise in fish identification and size estimation conducted between 4 and 15 belt transects (30 × 2 m) per site per survey period at depths ranging from 0.5 to 28.0 m to assess species composition, abundance and size structure (Table 1). Within each belt transect, Scarini (all parrotfish) were identified to species, counted and their sizes were estimated in 5 cm bins for individuals ≤10 cm and 10 cm bins for fish ≥11 cm. Divers recorded the survey depth per transect and measured the maximum reef relief at six regularly spaced intervals (every 5 m) along each transect. In total, 483 belt transects were conducted across 26 coral reef sites around New Providence, The Bahamas (Table 1; Figure 1). Repeated surveys by the same surveyors were undertaken at several sites to assess temporal changes in fish community structure (Table 1).

2.3. Data and Statistical Analyses

To assess small-scale patterns of spatial and temporal variability of herbivorous fish on Bahamian coral reefs, we analyzed fish data for all parrotfish species around New Providence. Mean density (number of individuals/100 m2) of parrotfish at each site were computed based on transect data. The parrotfish species examined for comparisons of density and size structure within New Providence included: Midnight (Scarus coelestinus), Blue (Scarus coeruleus), Rainbow (Scarus guacamaia), Striped (Scarus iseri), Princess (Scarus taeniopterus), Queen (Scarus vetula), Redband (Sparisoma aurofrenatum), Redtail (Sparisoma chrysopterum), Yellowtail (Sparisoma rubripinne), Stoplight (Sparisoma viride) and Greenblotch (Sparisoma atomarium) parrotfish. Bahamian fishers have indicated they capture all of these species, but primarily target Stoplight (Sp. viride), Blue (Sc. coeruleus) and Rainbow (Sc. guacamaia) parrotfish [29].
All data and statistical analyses were conducted with RStudio (version 4.0.5), with statistical significance set to p ≤ 0.05. The vegan package in R [38] was used to visualize spatial and temporal patterns of parrotfish assemblages across reef zones and survey periods around New Providence through the construction of non-metric multidimensional scaling (NMDS) plots based on density data. NMDS plots were prepared based on the Bray–Curtis distance [39]. A stress value ranging from 0 to 1 was obtained from the metaMDS function to determine whether the ordination accurately described variation, with values < 0.20 indicating that ordinations more accurately represent the dissimilarity among points. The adonis function was used to detect statistical differences between the clusters, followed by the pairwise.adonis function for post hoc comparisons when appropriate. Statistical significance was assessed using 9999 permutations of the data. Confidence ellipses were computed using the ordiellipse function based on the standard deviation of the axis scores and a confidence level set to 0.95. Ellipses were extracted for plotting using the veganCovEllipse function. Species vectors were fit with the function envfit based on 9999 permutations and plotted only if they were found to be significant. Finally, NMDS plots were created with the package ggplot2.
Densities for all parrotfish species were compared across the three survey periods for patch reef and forereef zones. The ggmap package was used to visualize percent changes in parrotfish densities around New Providence [40]. Prior to statistical analysis, data were evaluated for the assumptions of normality and homogeneity of variance using a Shapiro–Wilk goodness-of-fit test from the rstatix package. At least one sample for each comparison using density data showed a non-normal distribution, and thus non-parametric tests were subsequently applied (Table S1). The non-parametric Friedman test from the rstatix package was used to compare family (i.e., all parrotfish) and species-level mean densities at the 10 sites repeatedly assessed across all survey periods. Pairwise comparisons between survey periods were directly applied to compare mean densities employing all available data. This was performed with Wilcoxon signed-rank tests from the rstatix package followed by a Bonferroni correction for multiple comparisons (Table S1).
Size-frequency distributions at the family- and species-level were compared across survey periods using a Chi-Square test for homogeneity. The following size-bins were used for analysis: 0–5 cm, 6–10 cm, 11–20 cm, 21–30 cm and >31 cm. All expected frequencies were verified to be greater than five. Post hoc testing was performed through pairwise comparisons of survey periods using the same procedure, followed by a Bonferroni correction for multiple comparisons. The results were then visualized with corrplots using the corrplot package [41] to highlight significant standardized residuals with magnitudes greater than three to account for the number of cells visualized.

3. Results

Between 2011 and 2019, we identified a total of 6819 individual parrotfish from 11 species represented by the genera Scarus (6 species) and Sparisoma (5 species). Of all species observed, the Striped Parrotfish (Sc. iseri) was the numerically dominant species followed by Stoplight (Sp. viride) and Redband (Sp. aurofrenatum) Parrotfish (Table S2). Species composition was similar among most sites, except for a few sites (e.g., NP1003, NP1004, NP1007, RI1001 and RI1002) that showed changes in species composition over time (Figure S1). Less common or rare species including Rainbow (Sc. guacamaia) and Blue (Sc. coeruleus) Parrotfish were only observed at three sites and the Midnight Parrotfish (Sc. coelestinus) was only observed at one site, namely Trinity Caves (NP1020) (Figure S1). Stoplight Parrotfish (Sp. viride) was the only species observed at all sites surveyed around New Providence (Figure S1).

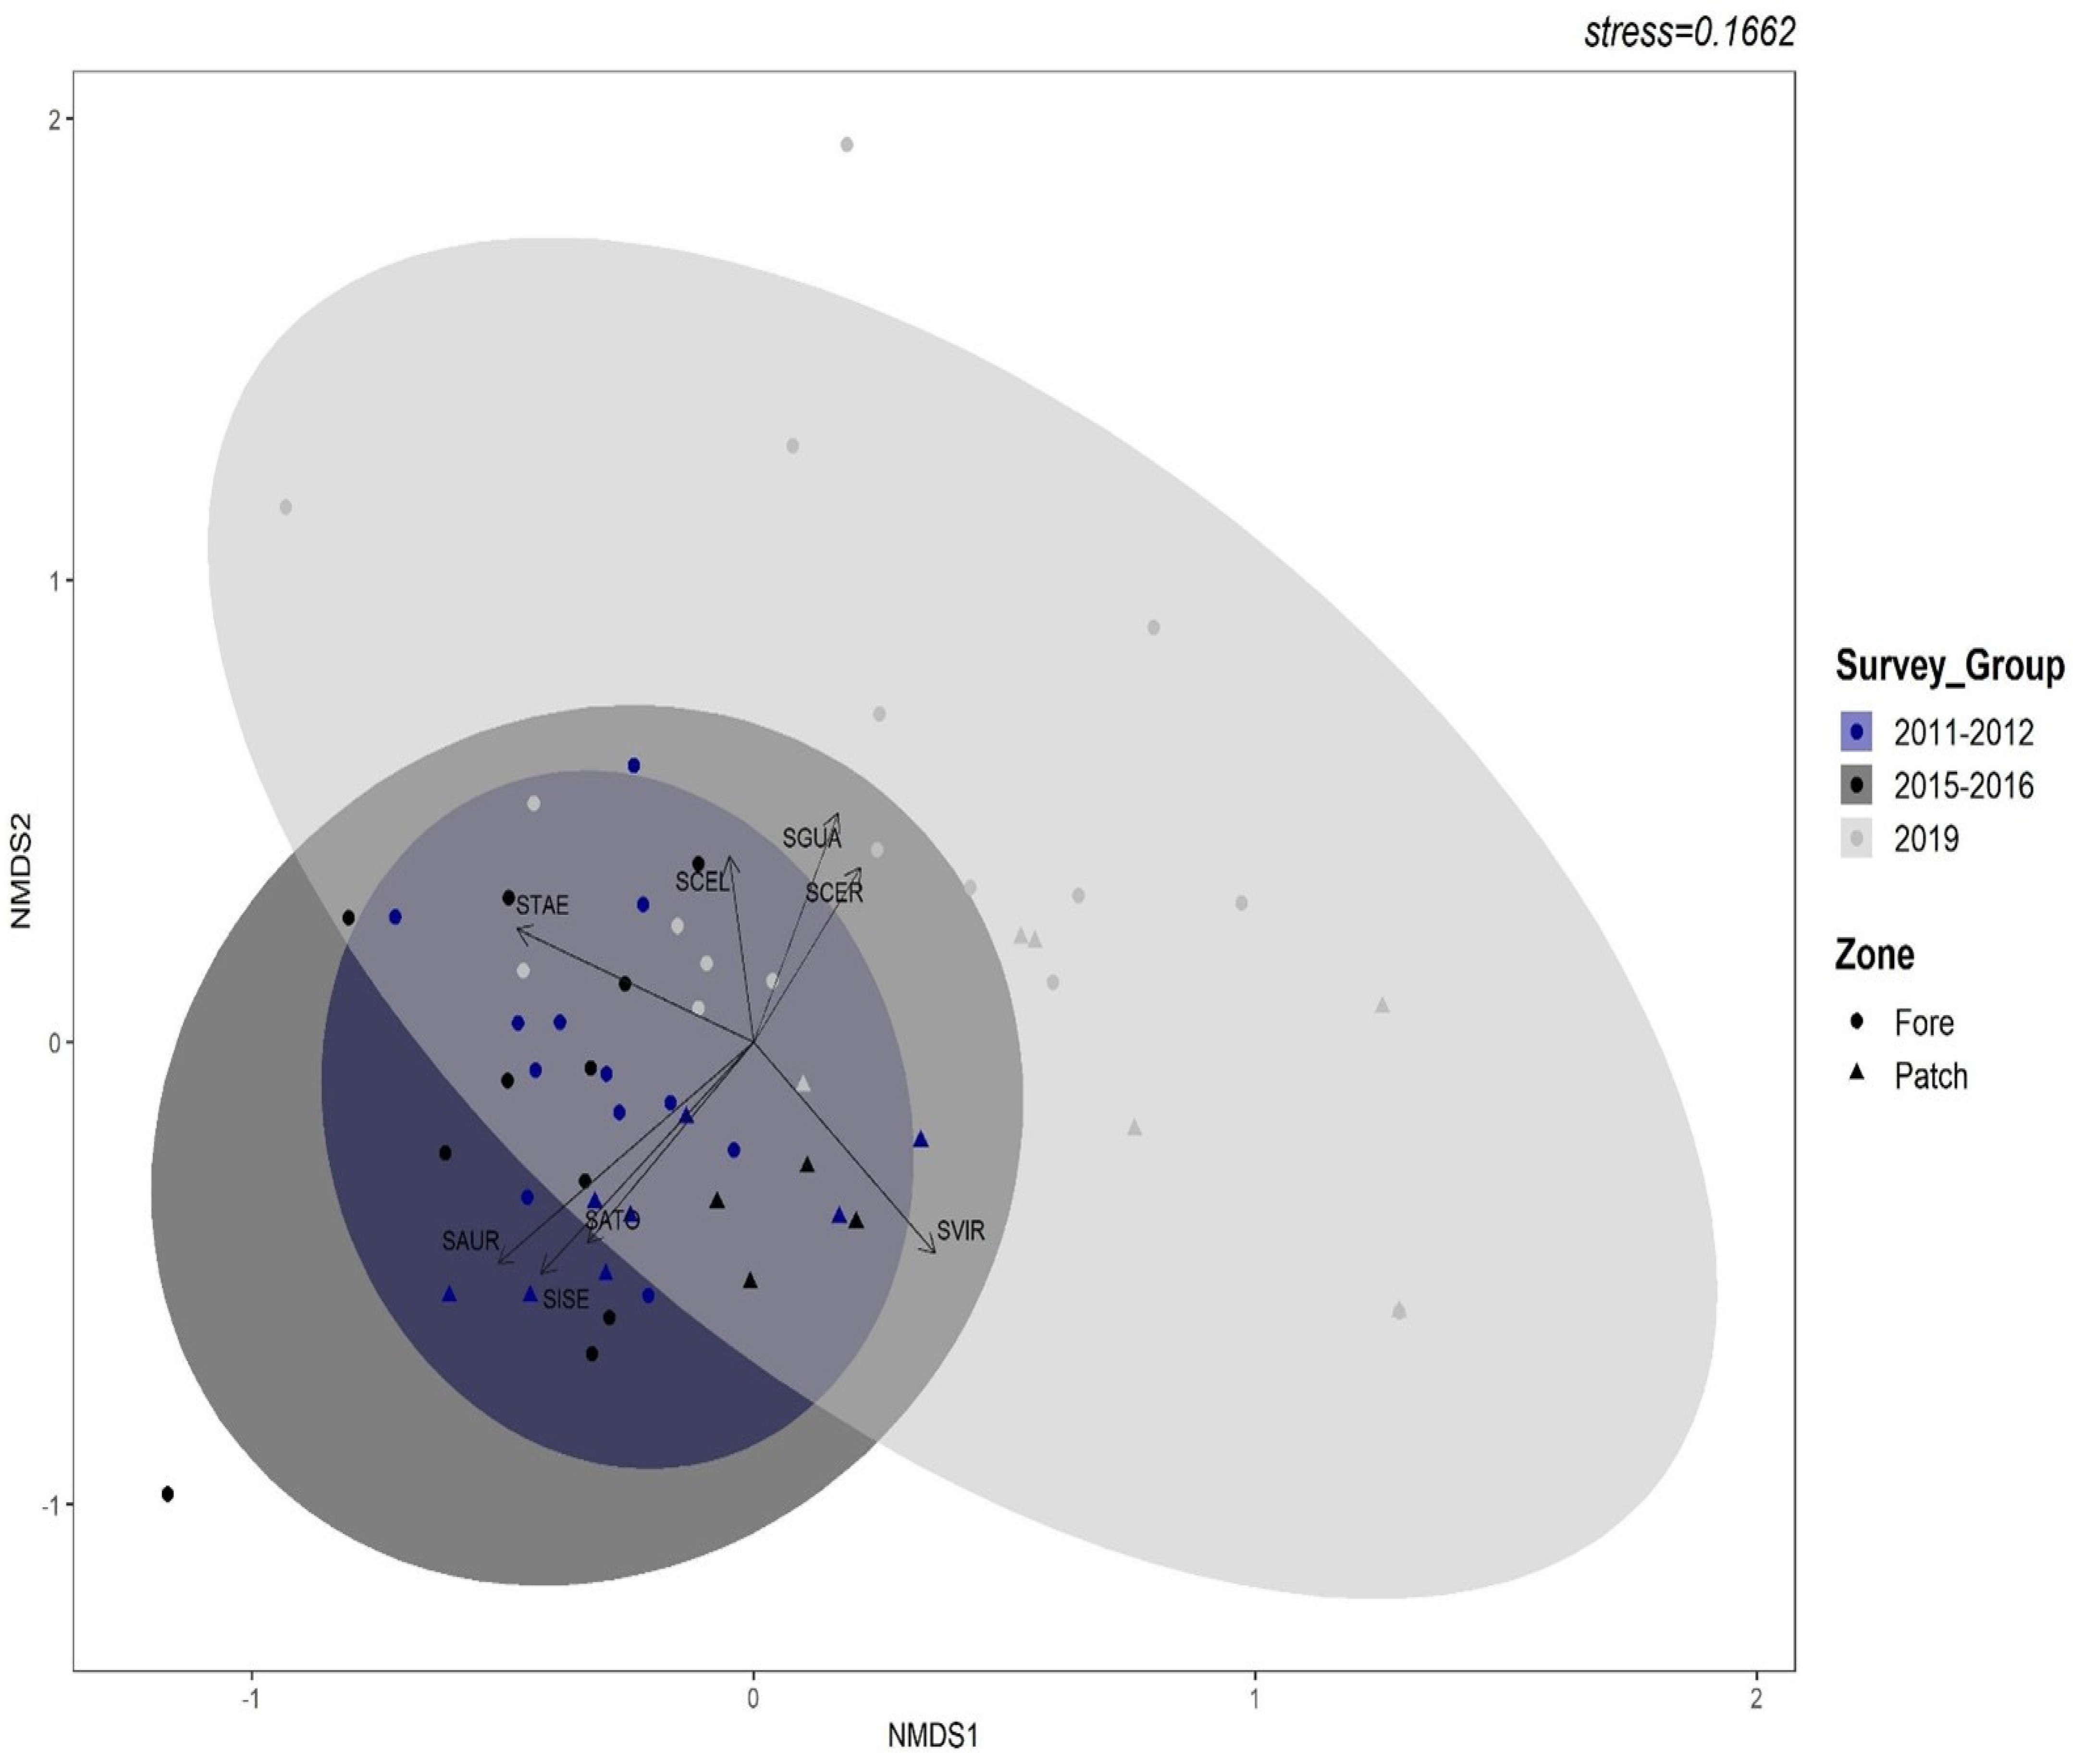
3.1. Spatial Patterns of Parrotfish Assemblages

Mean densities of parrotfish exhibited variability among species and across the surveyed sites, with the highest densities observed on reefs located on the eastern side of New Providence (Table 1; Figure 2 and Figures S1–S4). The site with the overall highest density (38.8 ± 26.7/100 m2) of parrotfish was Jonsa Reef (Table 1). Conversely, the lowest densities of parrotfish were observed at Sand Chute (NP1023), Trinity Caves (NP1020) and Wreck on the Wall (NP1024) with mean densities of 5.4 ± 2.1/100 m2, 6.5 ± 6.9/100 m2 and 7.9 ± 4.2/100 m2, respectively (Table 1; Figure 2 and Figures S2–S4).
Spatial analysis based on NMDS revealed different parrotfish assemblages between survey periods around New Providence (adonis, p < 0.001, stress = 0.166; Figure 3). Parrotfish assemblages during the periods 2011–2012 and 2015–2016 remain unchanged (pairwise adonis, p > 0.05; Figure 3), while both differed from assemblages in 2019 (pairwise adonis, p = 0.003 and p = 0.003; Figure 3). Aggregating data by site, two assemblages could also be distinguished between reef zones (adonis, p = 0.002, stress = 0.161; Figure S5). While there was some overlap of species within reef zones across sites, parrotfish assemblages within the fore reef zone were more diverse and similar versus those found in patch reefs (Figure S5). The spatial analysis of parrotfish species composition across each of the three surveyed periods showed that 2019 was the most distinctive cluster, with differences being primarily driven by the mean densities of Sp. viride (Figure 3; Figure S1).

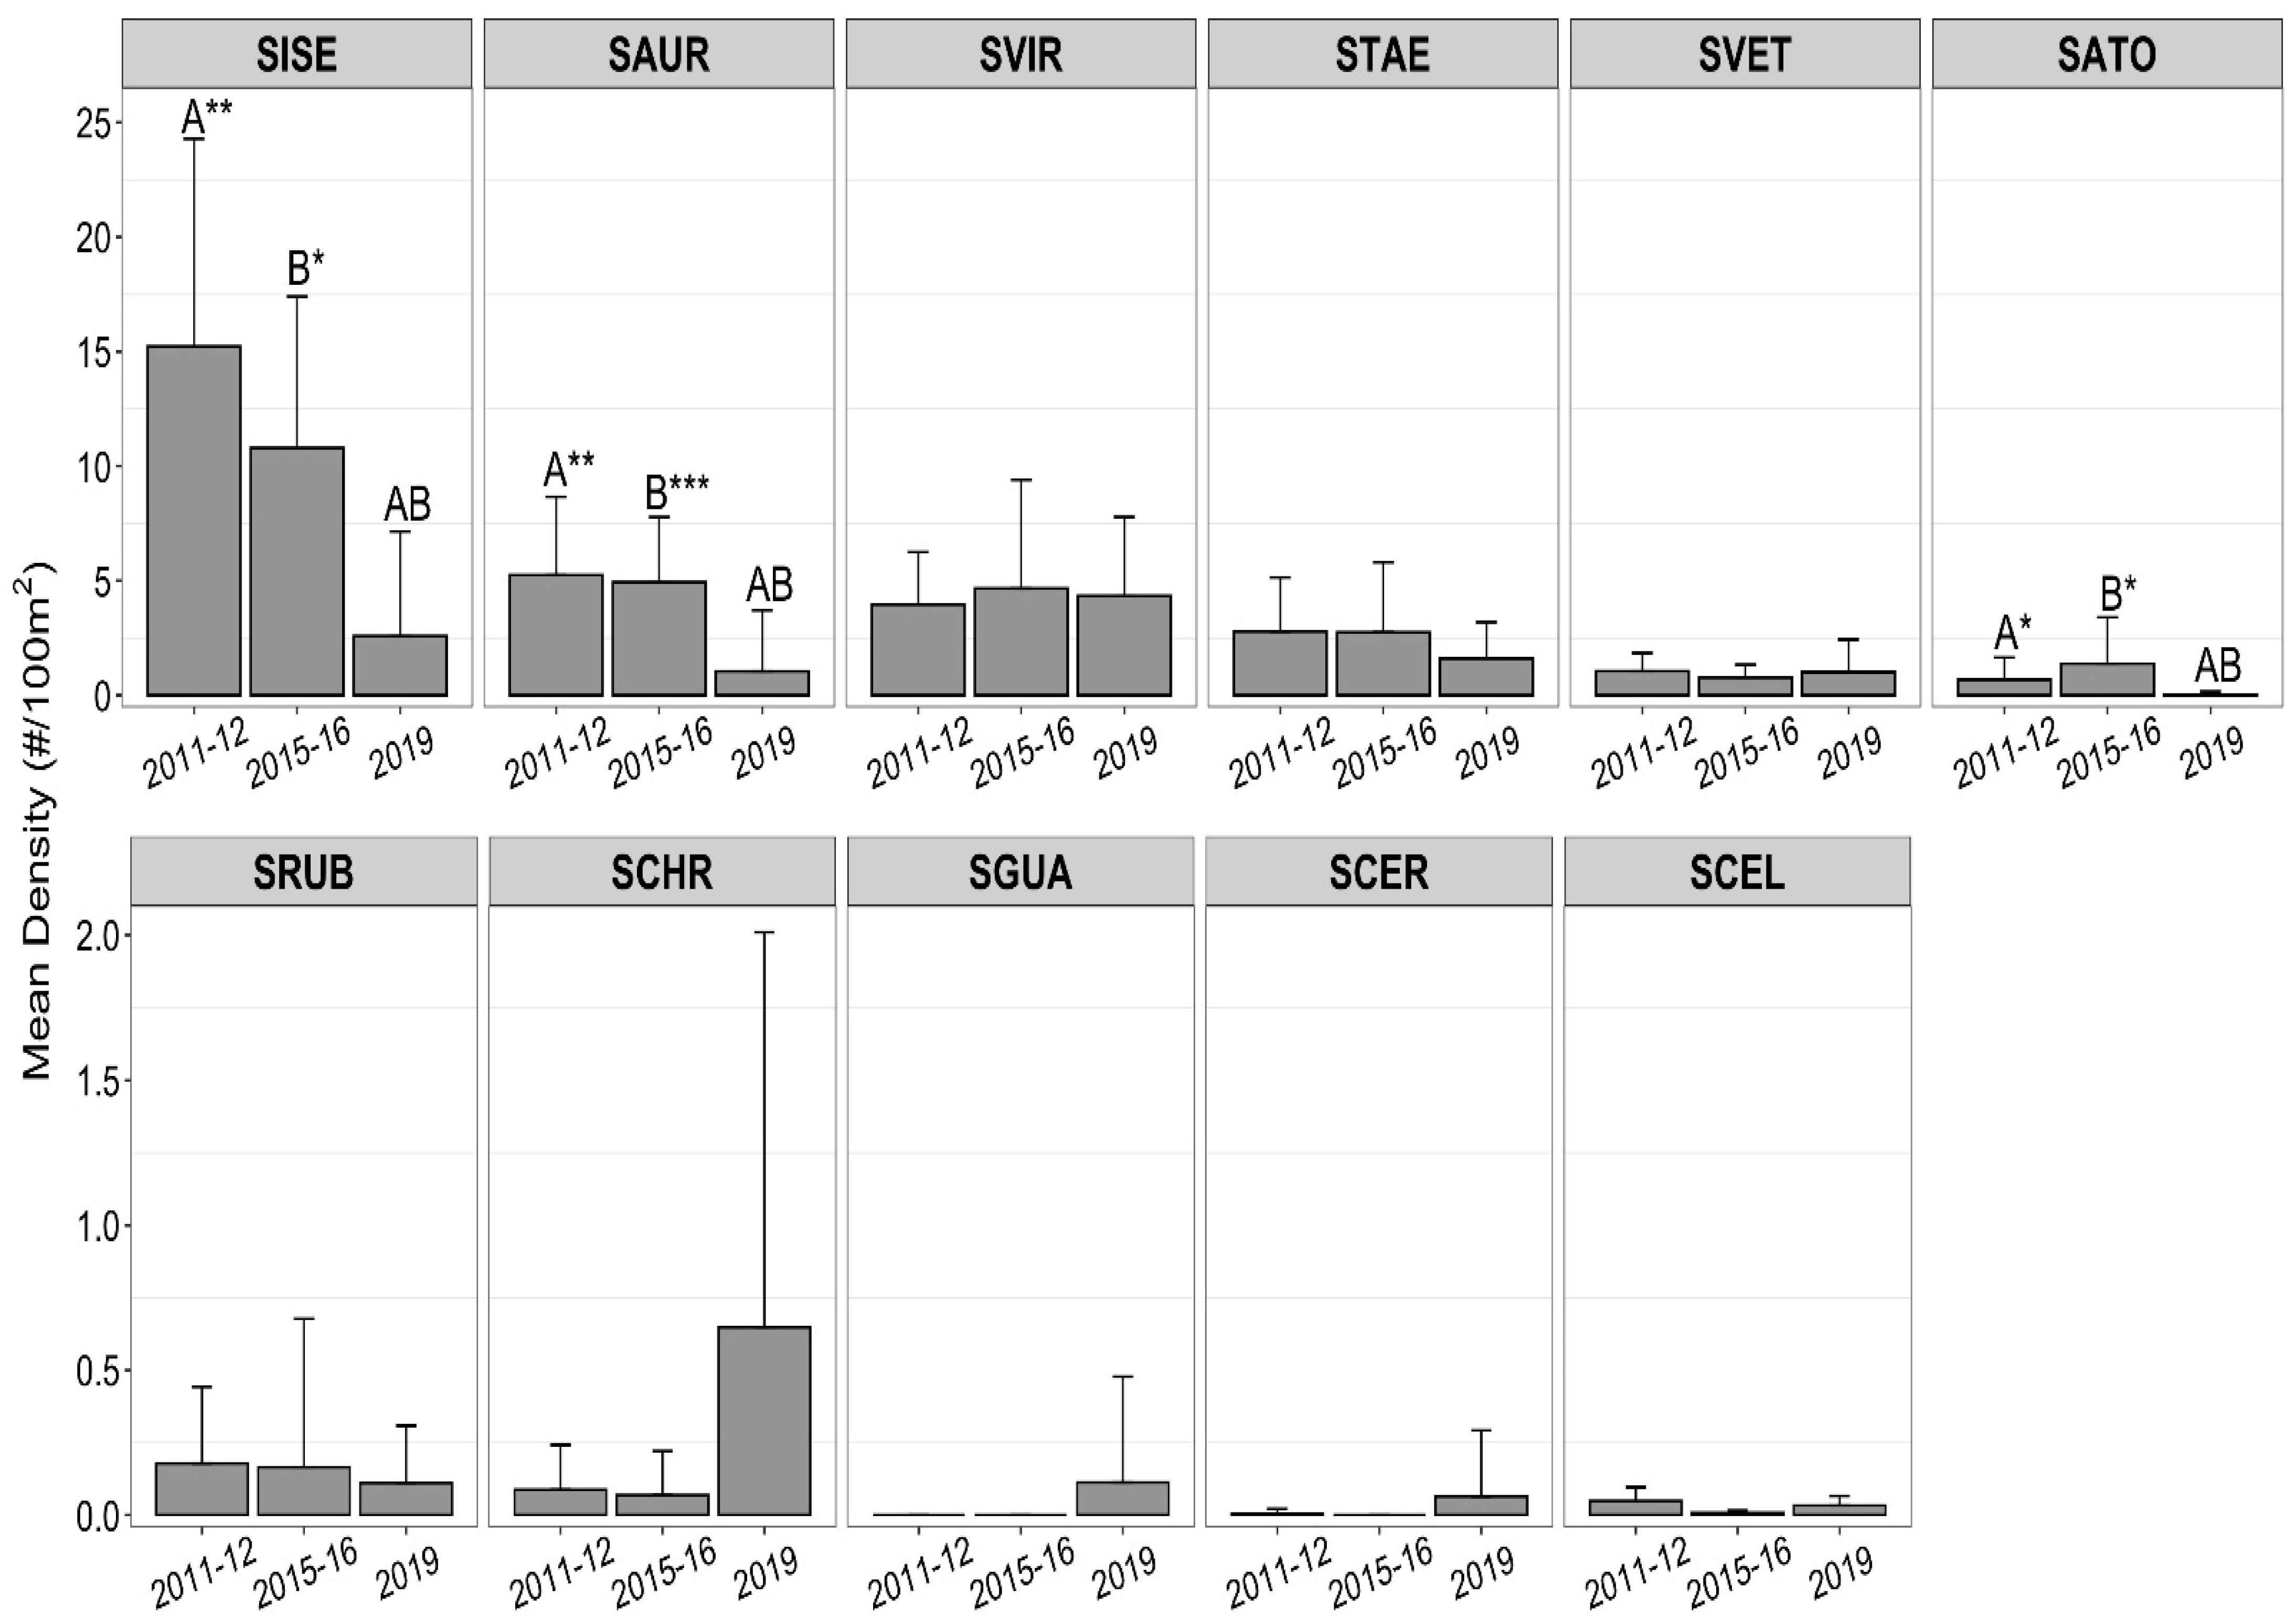
3.2. Temporal Patterns
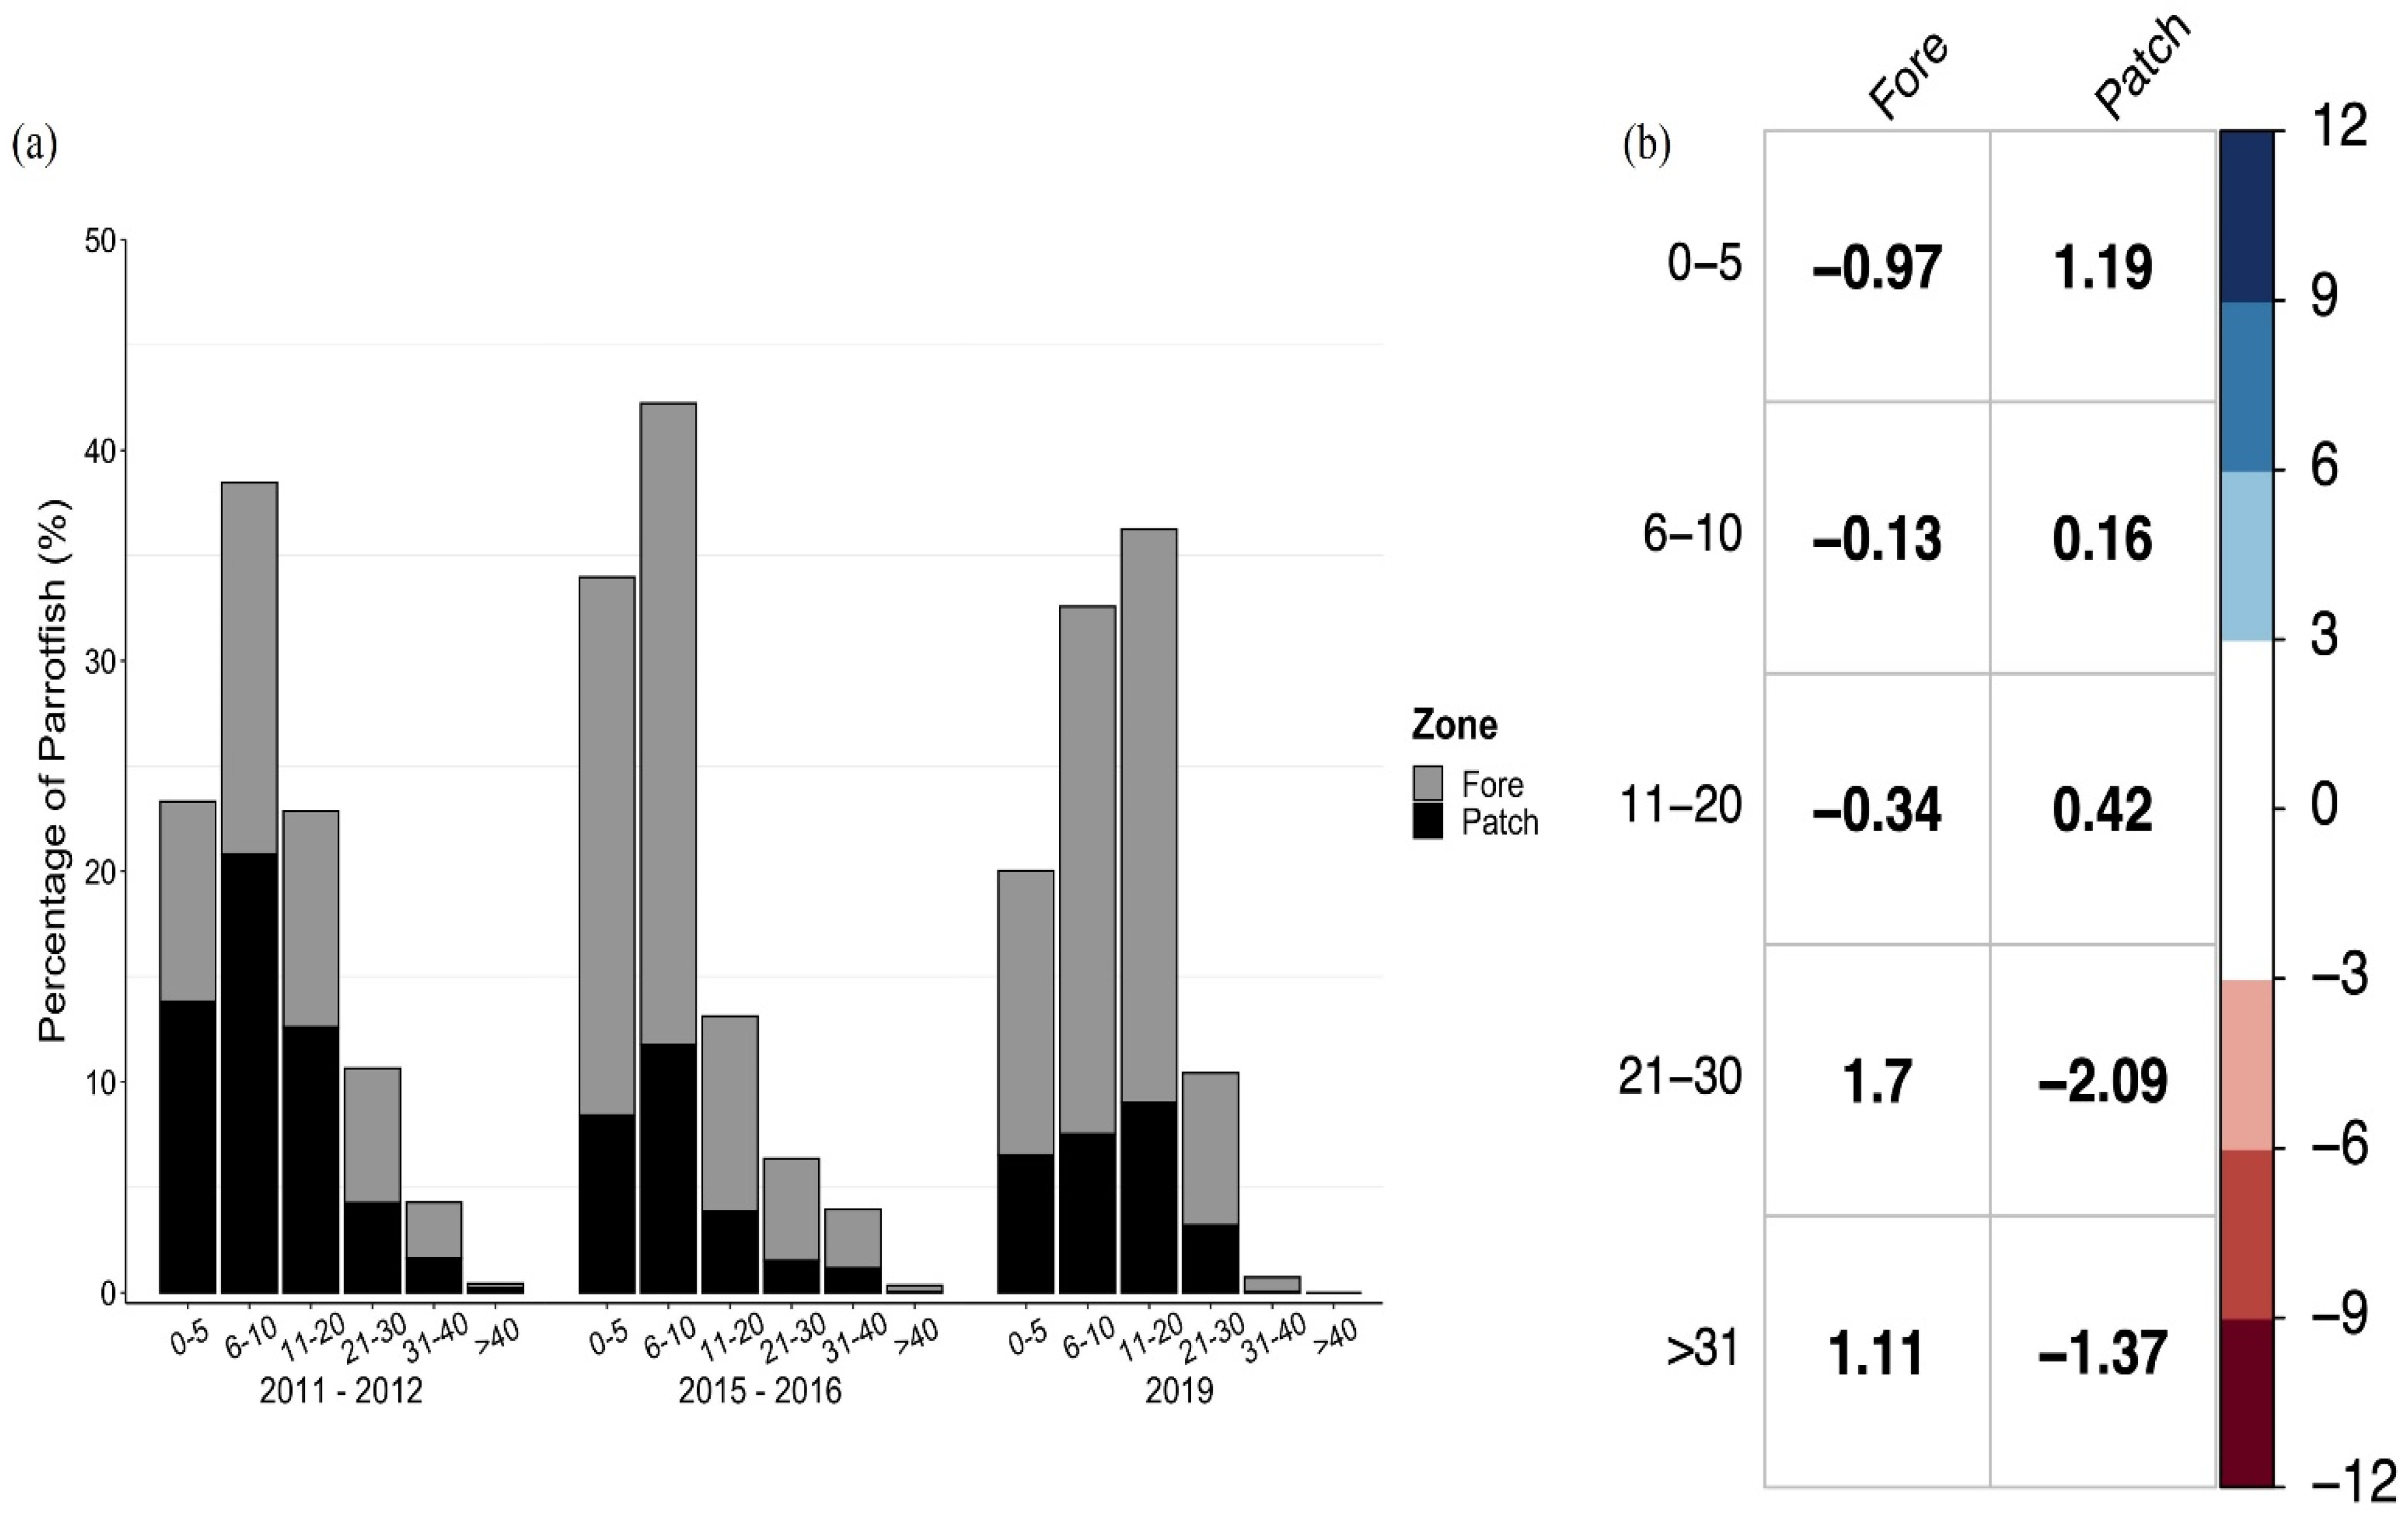
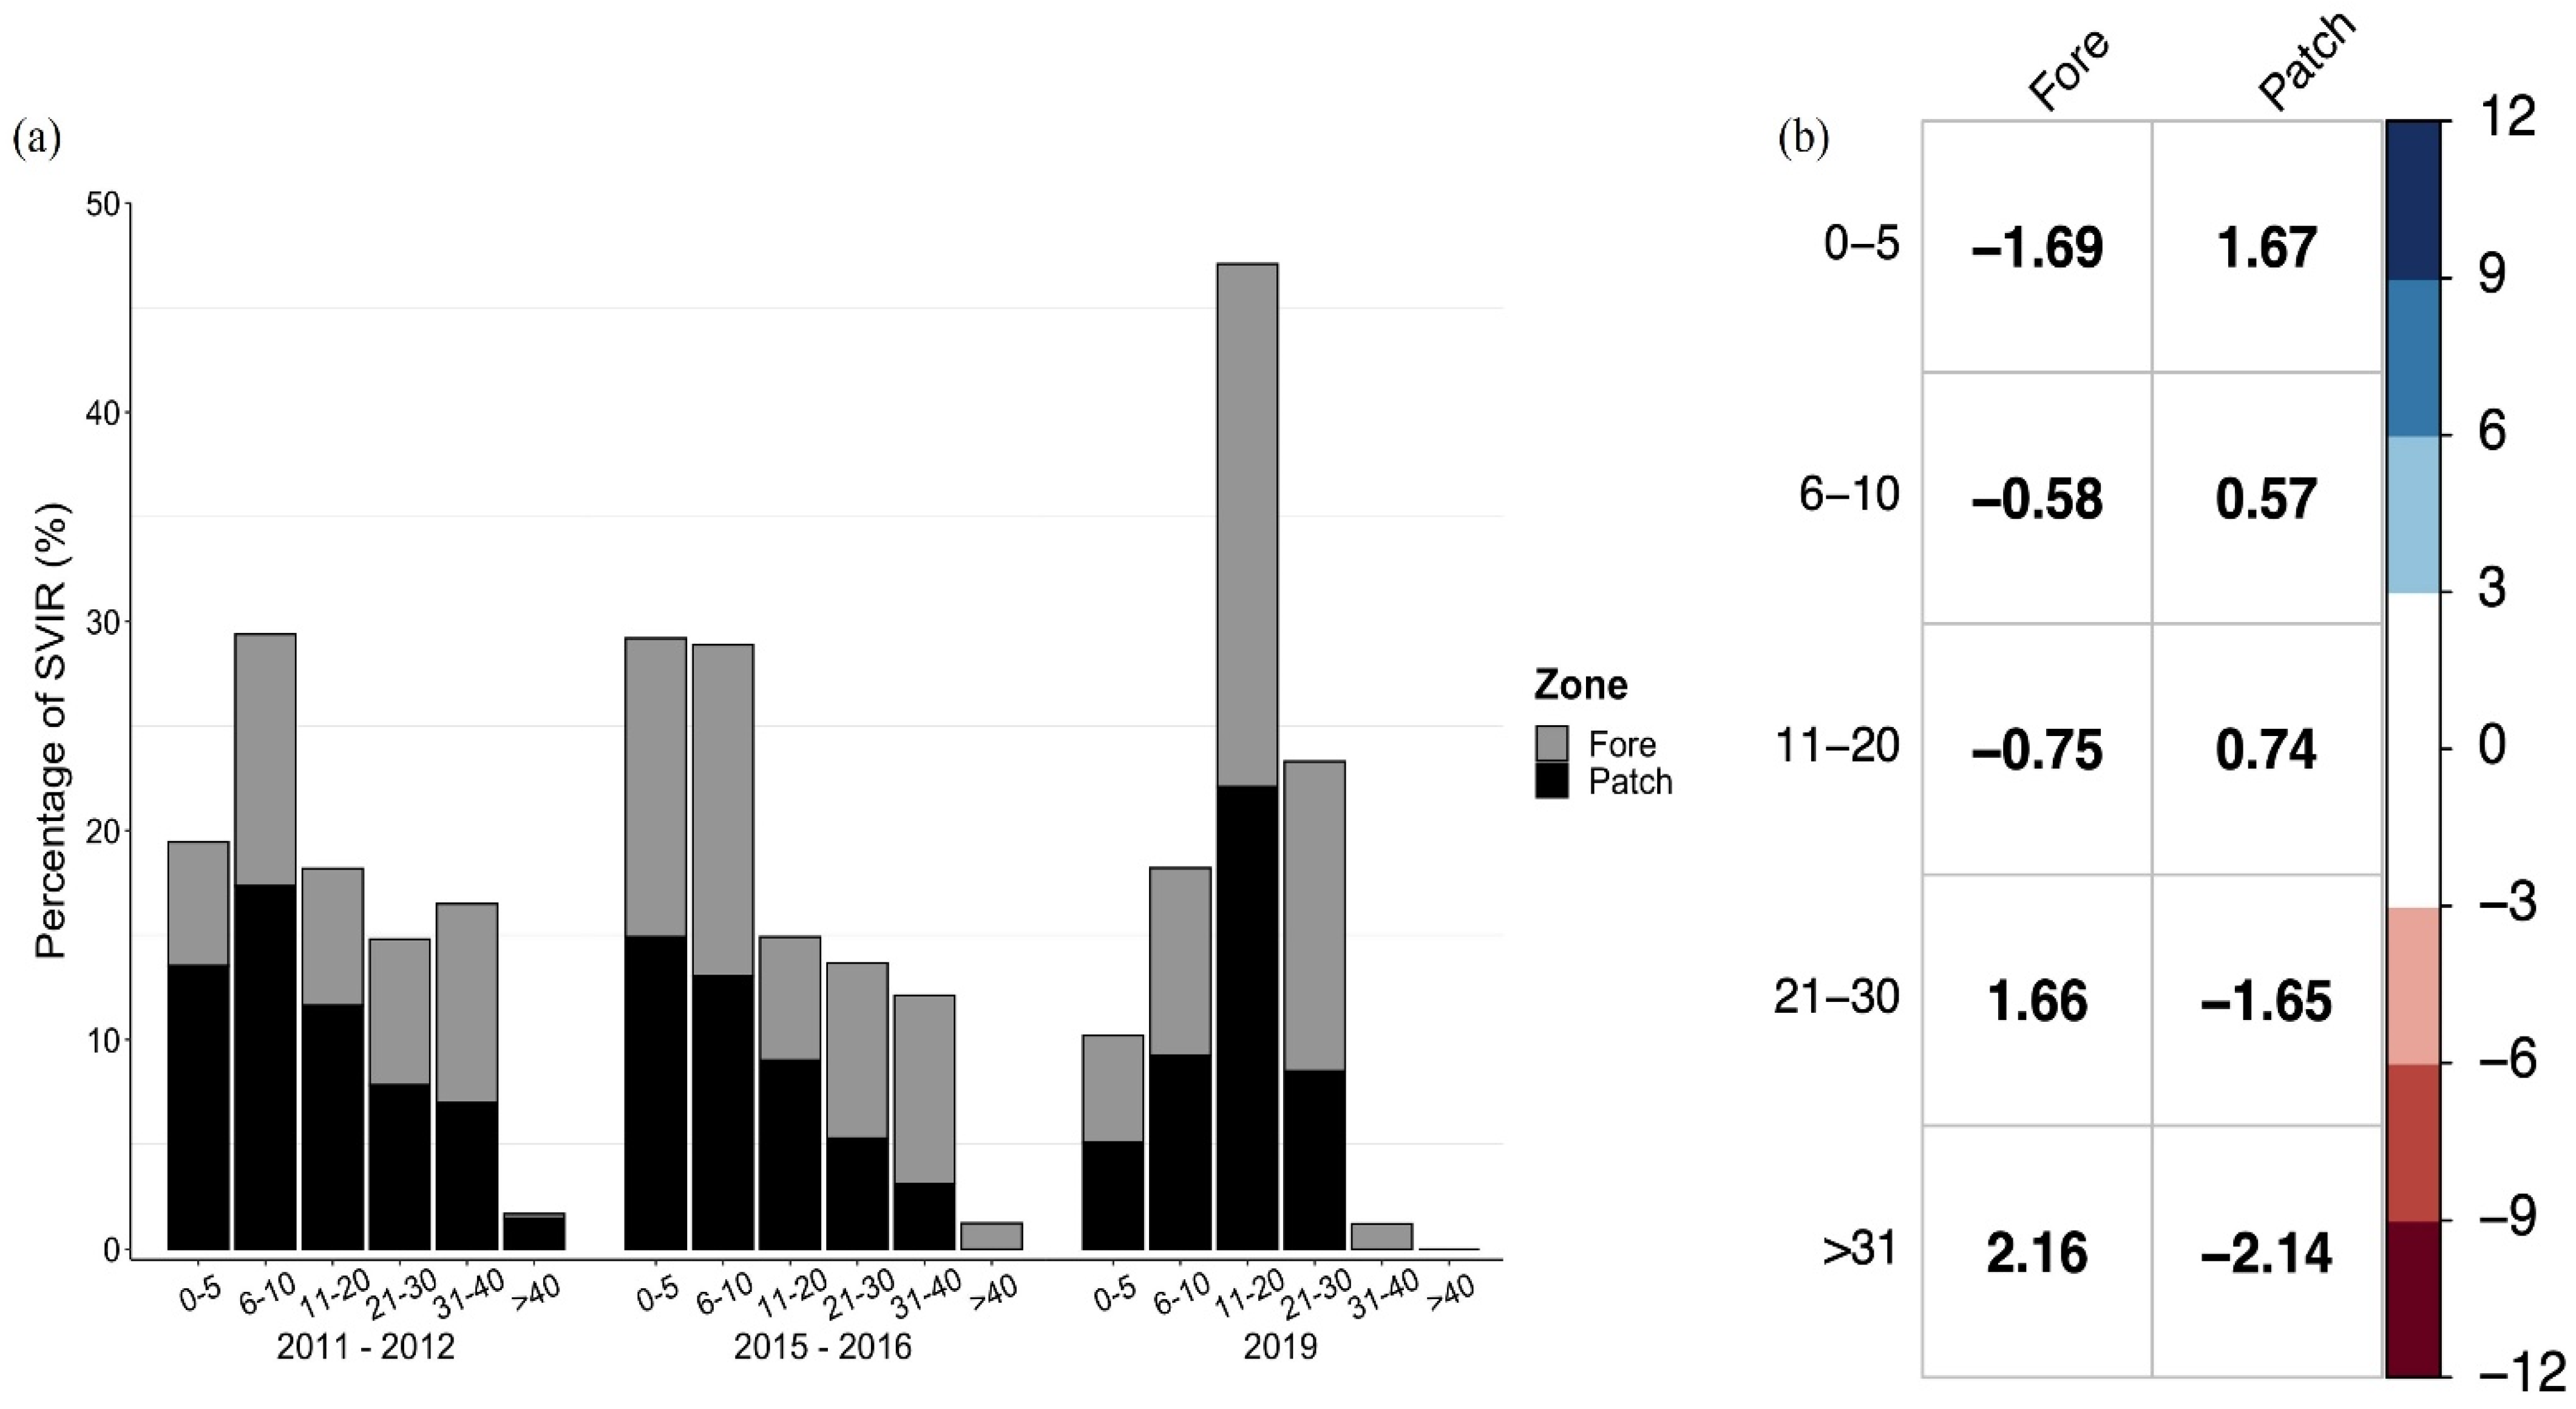
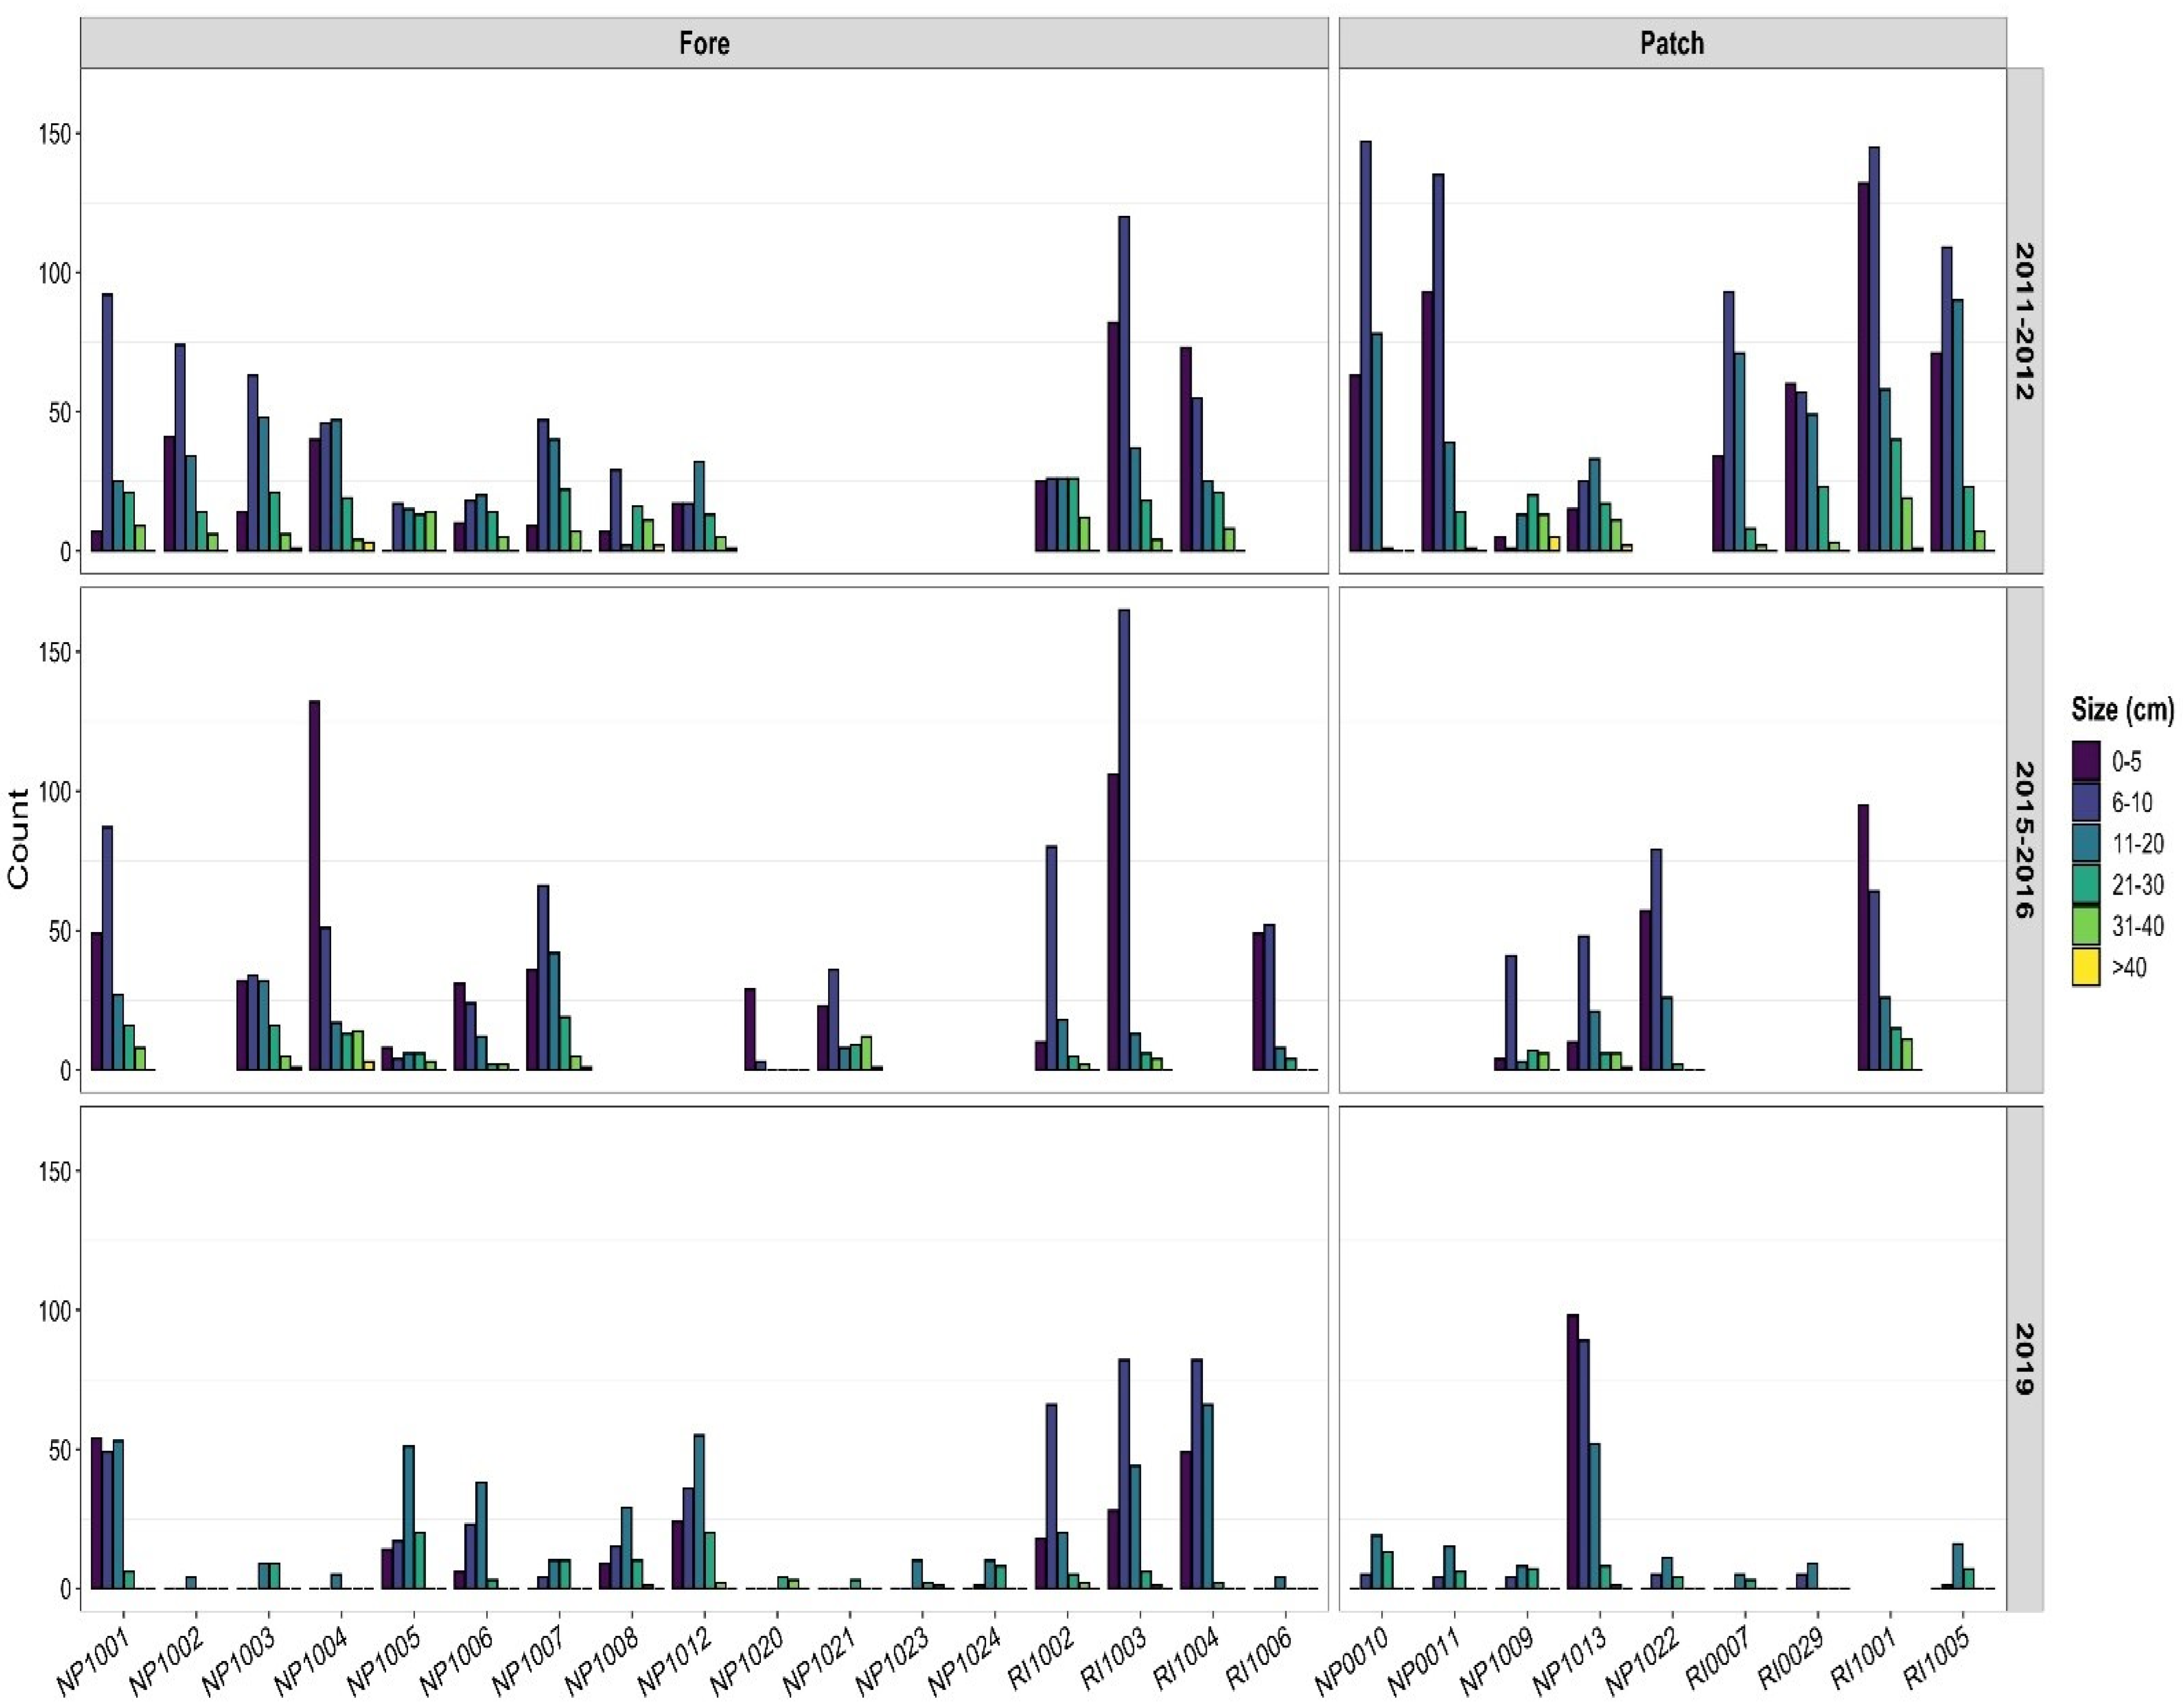
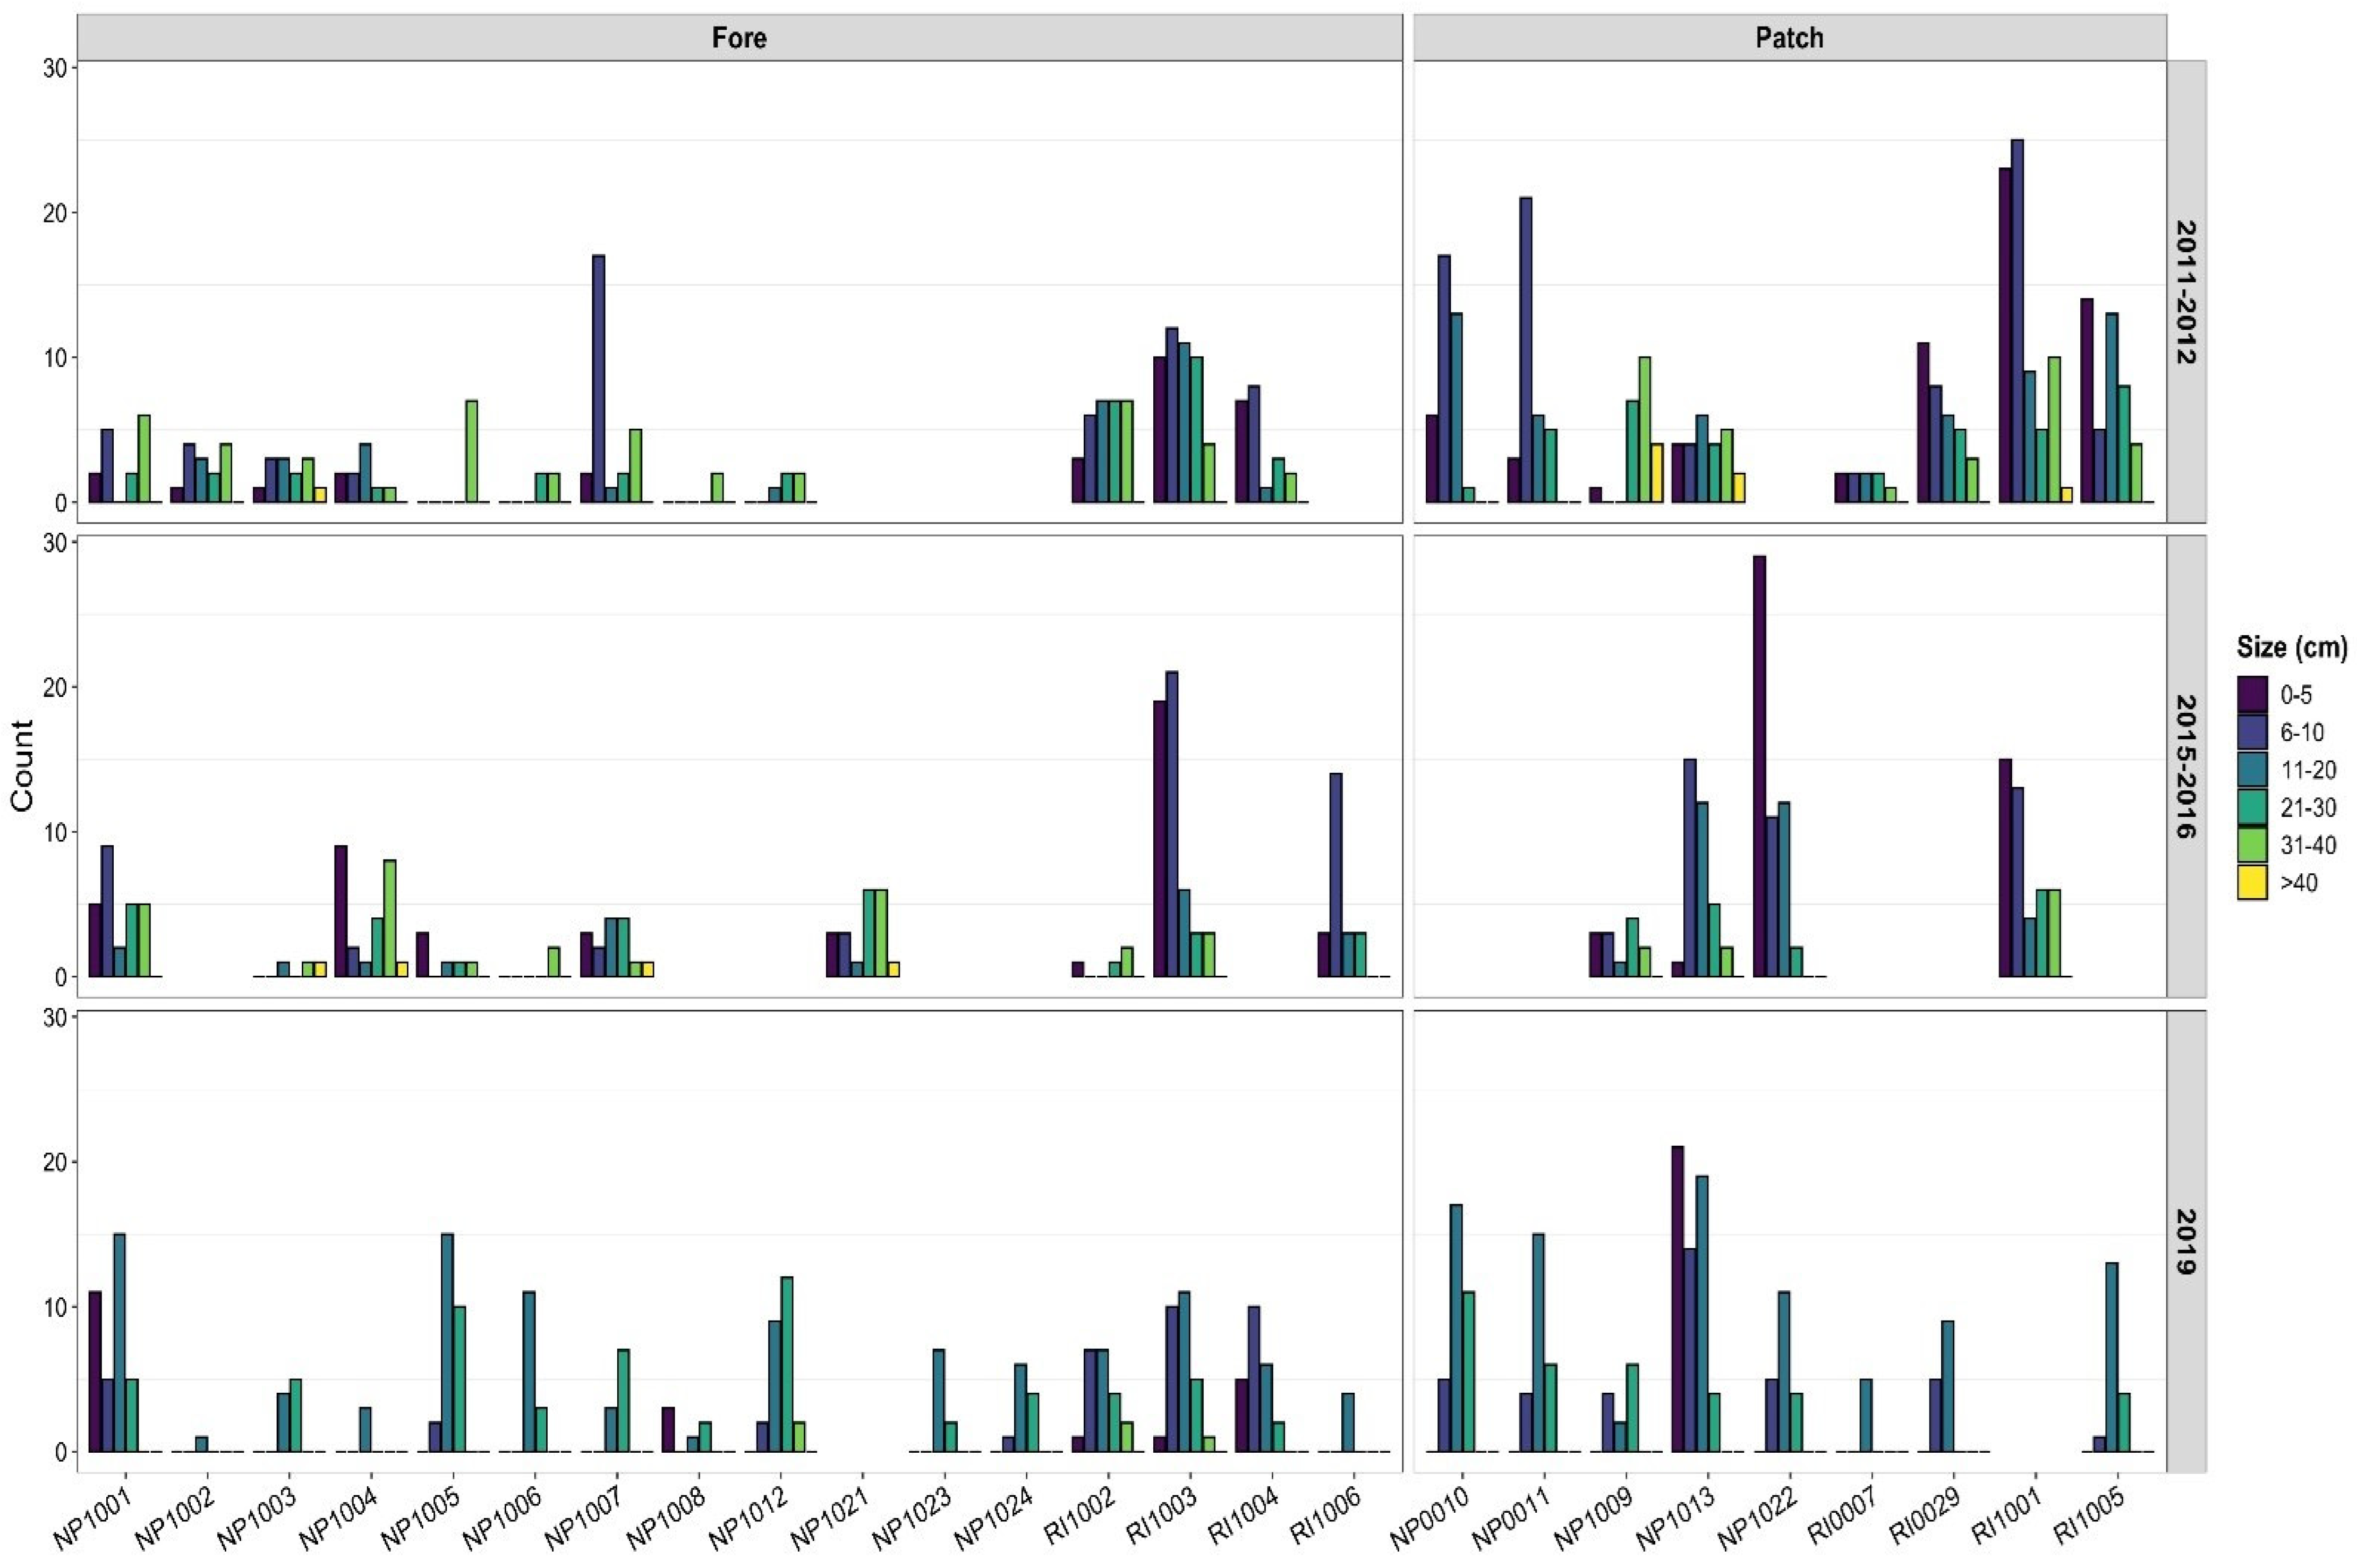
The examination of mean parrotfish densities by survey period for all zones and sites in New Providence showed a significant decline (Wilcoxon signed-rank test, p-value = 0.008) by 59% from 29.1 to 15.9/100 m2 (Figure 2). Between 2011–2012 and 2019, mean parrotfish densities decreased from 26.6 to 12.4/100 m2 across forereefs (Figure 2). Temporal differences were also found across patch reefs, where parrotfish decreased from 33.3 to 11.4/100 m2 (Figure 2). However, while mean densities were generally lower in 2019 for most species (Figure 4; Figures S2–S4; Table S1), statistically significant changes in mean density were only found for three parrotfish species: Sc. iseri (Wilcoxon signed-rank test, p = 0.001), Sp. aurofrenatum (Wilcoxon signed-rank test, p = 0.002) and Sp. atomarium (Wilcoxon signed-rank test, p = 0.017) (Table S1; Figures S2–S4).
At the family level, there were significant differences in the mean densities of parrotfish between 2011–2012 and 2019 at Traveler’s Wall (NP1012—forereef) (Wilcoxon signed-rank test, p = 0.048) where an increase was observed and Nadia’s Reef (RI007—patch reef) where a decrease was found (Wilcoxon signed-rank test, p = 0.040; Figure 5). Parrotfish densities declined at most sites, except for two sites, namely Traveler’s Wall (NP1012—forereef) and Schoolhouse Reef (NP1013—patch reef), where increases in density occurred between 2011–2012 and 2019, and a few sites where no significant change in density was detected (Figure 5 and Figures S2–S4).
Species-level analyses showed low densities for parrotfish species targeted by local fishers with the exception of Sp. viride. In the case of Sp viride, increases were observed at several sites (Figure 4 and Figure S2). Densities were also generally low for key ecologically important species (e.g., Sp. chrysopterum and Sp. rubripinne) as well as other parrotfish species (Figures S3 and S4). Sp. aurofrenatum had higher densities in 2019 at site NP1012 along with Sc. iseri (Figures S3 and S4). Similarly, increases in mean density at Alpha Reef (RI004—forereef) were noted for Sp. aurofrenatum and Sc. taeniopterus (Figures S3 and S4). There was also an increase in the mean densities of Sp. rubripinne at Pumpkin Patch (NP1001), a forereef site located off the southwest of New Providence (Figure 1 and Figure S3). No parrotfish were observed at Cannonball Reef [RI1001], a patch reef off Rose Island in 2019 (Figure 1 and Figure 5).

3.3. Size Structure

Parrotfish assemblages around New Providence were dominated by individuals with a total length (TL) of ≤20 cm (Figure 6 and Figure 7). The interaction between reef zone and size class was significant (Pearson’s chi-squared test = 13.081, df = 4, p-value = 0.011) with greater frequencies of larger individuals (≥21 cm TL) driving patterns (positive associations) on forereef sites (Figure 8 and Figure 9). Parrotfish ≤10 cm in size accounted for 64% of all fish recorded and were more prevalent on patch reefs (Figure 8 and Figure 9). The 11–20 and 21–30 cm size classes held 23% and 9% of fish, respectively, and a few fish were ≥31 cm in size. A similar pattern in the size frequency distribution of parrotfish was observed at the site level, with smaller individuals being more abundant than larger individuals and more prevalent in patch reefs (Figure 6 and Figure 7). While there was some variability in sizes among sites, the number of parrotfish ≥31 cm in size generally decreased across all sites over time. Additionally, no individuals >40 cm were observed in 2019 (Figure 6, Figure 7, Figure 8 and Figure 9).
Size frequency distributions for Sp. viride showed similarities in the number of individuals from different size classes between 2011–2012 and 2015–2016 (Figure 7 and Figure 9). During the last survey period, there was a notable increase in the number of fish in both the 11–20 and 21–30 cm size categories. Approximately 27% of all Sp. viride observed were between 11 and 20 cm TL and less than 1% were >40 cm in size (Figure 9). Differences in the size structure of Sp. viride were significant across reef zones (Pearson’s chi-squared test = 22.155, df = 4, p-value = 0.002) with the positive associations of larger individuals occurring in forereef versus patch reef areas (Figure 9).

4. Discussion

We used a data set spanning nine years to examine fine-scale spatial and temporal patterns of parrotfish distribution and abundance across different reefs and zones. We further explored whether changes in parrotfish composition and abundance have occurred that may be associated with the growing fishery for herbivorous fish. Results from in situ assessments of coral reefs around New Providence revealed interspecific differences in parrotfish assemblages. Specifically, these data have shown a 59% decrease in the mean density of parrotfish overall, with statistically significant declines in density occurring in three parrotfish species Sc. iseri, Sp. aurofrenatum and Sp. atomarium (Figure 2, Figure 4 and Figures S2–S4). Temporal changes in size frequency distribution—particularly a reduction in individuals ≥31 cm in total length and the complete loss of large adults > 40 cm across all sites was observed (Figure 6 and Figure 7). We also found significant interactions between the size structure and reef zone for parrotfish overall, including ubiquitous species such as Sp. viride (Figure 8, Figure 9 and Figure S5). Fine-scale spatial analyses based on NDMS revealed that parrotfish assemblages within the forereef zone were more diverse and comprised of larger individuals versus those found in patch reefs (Figure 6, Figure 8 and Figure S5). The observed differences in parrotfish assemblages appear to be influenced by Sp. viride, Sp. aurofrenatum and Sc. iseri (Figure 3), which is consistent with our findings of significant declines in density (Figure 4; Table S1).
In this study, temporal differences within parrotfish assemblages were related to changes in mean densities and size structure. Closer inspection of the species-level data suggests that the observed changes appear to be partly driven by Sp. viride, one of the most abundant parrotfish species. Sp. viride has critical ecological functions as a grazer and bioeroder [12,19], but is also one of the main species targeted by Bahamian fishers [29] and in regional small-scale fisheries [42]. We found a notable shift in the size structure of Sp. viride in 2019 with a fewer large-bodied (i.e., ≥31 cm TL) individuals and the frequency of fish in the 11–20 and 21–20 size classes notably increased (Figure 7 and Figure 9).
Biological, environmental and anthropogenic processes have been shown to influence the demographic patterns and the spatial distribution of marine species [19,25,34]. Possible explanations for the temporal and spatial patterns observed include differences in parrotfish larval supply and recruitment [43,44], species interactions including predation and competition [34,45], variability in habitat complexity [19,25,34,46], ontogenetic habitat use [24,47,48] and differences in the primary productivity or nutrient availability [49,50]. Other environmental factors such as differences in wave exposure and depth [51,52] often differ between habitats and reef zones and are also known to shape benthic communities, which can subsequently influence the fish community structure. Although surveys were not always conducted during the same months across survey periods, seasonal effects are unlikely because parrotfish are resident spawners with relatively small home ranges [48,53]. The observed interaction between reef zone and size structure suggests that differences in habitat complexity across forereefs and patch reefs [30,31,32] may influence the composition, abundance and spatial distribution of parrotfish populations around New Providence. This pattern is consistent with previous studies that found correlations among the habitat type, structural complexity and parrotfish composition and abundance [19,25,48,54]. Additional research is required to investigate the specific habitat and environmental differences that may shape parrotfish assemblages across reef zones over broader spatial scales and explore whether or not this is related to seasonal variation in abiotic (e.g., rugosity and water temperature) or biotic factors (e.g., spawning and recruitment).
Anthropogenic stressors including fishing and eutrophication have also been shown to impact fish biomass both directly and indirectly [17,23,26,34]. Ecological data from the present study show decreases in density and shifts in the size frequency distribution of ecologically significant parrotfish species and those targeted by small-scale fishers for subsistence or commercial use (Figures S3 and S4). Parrotfish were more abundant in the east when compared to the west (Table 1), even though western reefs are generally more rugose with higher levels of coral cover [30,31,32]. Higher parrotfish densities on reefs in the east relative to reefs in the west is probably associated with differences in fishing, which has been shown to vary spatially throughout the country [29]. This finding is unlikely to be an effect of the sample size as there were no drastic differences in the number of surveys conducted in the east (n = 231) versus the west (n = 252), and in fact, more surveys occurred on the western end of the island (Table 1; Figure 1). Increased fishing pressure for parrotfish is therefore likely to be one of the factors shaping parrotfish assemblages on Bahamian reefs. Most parrotfish species recorded during surveys are reportedly being caught by commercial and subsistence or small-scale fishers around New Providence, where consumption by fishers is estimated to be ~63% and is among the highest in The Bahamas [29]. However, given the problems with parrotfish species misidentification among fishers, it is possible that not all species are actually being fished.
For example, subtle differences in markings differentiate Striped Parrotfish (Sc. iseri) from Princess Parrotfish (Sc. taeniopterus) in their initial and terminal phases. Both species are common in The Bahamas, yet fishers were unable to identify Sc. iseri and other parrotfish species [29]. The Greenblotch Parrotfish (Sp. atomarium) has also been reported as a species caught by fishers in The Bahamas. However, as this cryptic species typically ranges in size from 9 to 10 cm TL, it is unlikely to be targeted by fishers for consumption and reported harvesting may be a result of misidentification. Although we found significant changes in the densities of Sp. atomarium over time across all sites surveyed (Figure 3), this may be due to natural variability rather than fishing pressure. Conversely, Sc. coeruleus and Sc. guacamaia, two of the larger and less common [30,31,32] species of parrotfish found in The Bahamas, are unlikely to be misidentified because of their distinct colorations.
Significant declines (59% from 29.1 to 15.9/100 m2) in the mean density of parrotfish in conjunction with the loss of larger individuals is likely related to the emerging parrotfish fishery. Evidence to support this assertion is based on both local stakeholder assessments [29] and the regional assessments of parrotfish populations that show significant size-dependent associations with fishing pressure [23,42,54,55]. More detailed information on the location of fishing sites, catch rates and sizes of harvested fish around New Providence in tandem with in situ assessments is needed to disentangle the relative importance of biotic and abiotic factors in shaping parrotfish assemblages.
Increasingly, evidence suggests that smaller or initial phase parrotfish are unlikely to be as effective as larger or terminal phase fish in reducing macroalgal abundance [12,15,19,21]. However, only 3% of all parrotfish observed during the three survey periods were large/terminal-phase adults (≥31 cm TL). Moreover, most of the large parrotfish were associated with forereefs (Figure 6, Figure 7, Figure 8 and Figure 9), which other studies have shown to serve as potential refugia from fishing pressure [54,55]. However, because parrotfish undergo ontogenetic shifts [24,47,48], it is not surprising that the results show larger individuals at forereef versus shallower reefs given that forereef habitats are generally more rugose or structurally complex [30,31,32].
Of the larger-bodied parrotfish species observed on Bahamian reefs, Sp. viride is one of the most common [30,31,32] and also one of the species most frequently targeted by fishers [29]. Redband (Sp. aurofrenatum) and Redtail (Sp. chrysopterum) Parrotfish are also important larger-bodied species that are frequently observed on both patch reefs and fore reefs, but Yellowtail Parrotfish (Sp. rubripinne) and other large species are less common [30,31,32]. Species-specific roles also exist within parrotfish communities. For example, Dell et al. [15] showed that Sp. aurofrenatum can consume ~50 g/day of brown macroalgae (Dictyota sp.)—one of the more pervasive algal species dominating coral reefs throughout the region. Therefore, the reduced densities of parrotfish of ecological significance (e.g., Sp. aurofrenatum) and the harvest of reproductive individuals is concerning. This finding has important implications for not only the survival of parrotfish populations, but also their ability to maintain key ecosystem processes on Bahamian coral reefs.
Over the last decade, reefs around New Providence have been negatively impacted by the overfishing of mesopredators, climate-induced coral bleaching, oil spills, one major hurricane (i.e., Hurricane Matthew in 2016), and most recently, the introduction and rapid spread of stony coral tissue loss disease [7,30,31,32]. Significant reductions in one of the key herbivorous fish groups in conjunction with these threats may retard the recovery of already imperiled coral reefs around New Providence. Parrotfish, however, are not the only herbivores on coral reef habitats and other herbivorous fish (e.g., surgeonfish and chubs) along with the long-spined sea urchin (Diadema antillarum) notably contribute to regulating the cover of macroalgae [15,52]. The mass mortality of D. antillarum occurred regionally in the early 1980s [3] and populations in The Bahamas have not fully recovered to pre die-off rates [31,32]. As a result, parrotfish have functioned as the dominant macroalgal grazers on Bahamian coral reefs [11,16,17]. Monitoring data have shown that between 2011 and 2014, macroalgal coverage on reefs around New Providence ranged from 18 to 38% on average, but increased to 42% by 2019 [32]. It is likely that the observed spatial and temporal changes in parrotfish assemblages and particularly the loss of large herbivores has partly contributed to the increase in macroalgal cover around New Providence. Future research examining the spatiotemporal population dynamics of parrotfish and the factors that may be influencing their abundance and distribution is warranted, and such research should be expanded to include other herbivorous species that hold complementary or unique ecological roles within coral reef ecosystems. This work could be further enhanced by exploring correlations between key herbivorous species and benthic community structure across reef zones.
The protection of parrotfish populations through established fishery regulations including gear restrictions, bans, size limits, quotas and seasonal closures have already been implemented in several Caribbean countries [36,42,56], but do not exist for The Bahamas. However, the Bahamian Fisheries (Jurisdiction and Conservation) (Amendment) Act was recently revised [57] and regulations for protecting parrotfish are being considered and discussed with local stakeholders (K. Sherman personal communication with E. Deleveaux former Acting Director for the Department of Marine Resources). The Bahamas has historically had one of the most abundant parrotfish populations in the Caribbean, with 2–4 times the biomass observed in other countries [11,17,30,31]. However, our analyses indicate that mean parrotfish densities for 58% (15/26) of sites around New Providence and for the island overall (15.9/100 m2; Table 1; Figure 2, Figure 4 and Figure 5) are below mean regional values (24.3/100 m2; [58]). Low densities around New Providence compared to those reported from the rest of the country may be due to increased fishing pressure on parrotfish around New Providence [29]. The existence and potential expansion of the parrotfish fishery in the absence of established and enforced fisheries regulations has implications for both the long-term health of parrotfish populations and coral reefs throughout the country.
To prevent further declines in parrotfish abundance and changes to species composition, we recommend implementing a national ban on commercial and recreational parrotfish fishing and establishing complete no-take policies within all MPAs. This is consistent with recent fishery management recommendations derived from available regional biological and socioeconomic data about the status of parrotfish [42]. While little to no research exists about movement patterns and genetic connectivity of parrotfish in The Bahamas, previous studies from other countries provide evidence in support of relatively small home range sizes [47,48] and variable patterns in genetic population structure [59,60]. MPAs therefore represent an important conservation tool for the spatial protection of parrotfish and their required habitats both at national and regional levels. However, additional research should be undertaken to incorporate genetic connectivity and inform sustainable harvesting practices for subsistence fishing including quotas, species-specific minimum and maximum size limits as well as restrictions on certain types of fishing gear. Significant declines in mean parrotfish densities coupled with changes in their size structure emphasizes the critical importance of research and monitoring and the urgent need for implementing science-based management strategies. The data presented in this study provide an important baseline upon which future changes to parrotfish diversity, abundance and size structure can be monitored and compared to evaluate the efficacy of established fishery regulations.

Supplementary Materials

The following supporting information can be downloaded at: https://www.mdpi.com/article/10.3390/d14080625/s1. 1. Table S1. Summary of statistical results from the Shapiro–Wilk normality tests and Wilcoxon signed-rank tests for examining the changes in mean densities over time for each parrotfish species. SISE = Sc. Iseri; SAUR = Sp. Aurofrenatum; SATO = Sp. Atomarium; SVIR = Sp. Viride; SCER = Sc. Coeruleus; STAE = Sc. Taeniopterus; SVET = Sc. Vetula; SCHR = Sp. Chrysopterum; SRUB = Sp. Rubripinne; SGUA = Sc. Guacamaia; and SCEL = Sc. coelestinus. p-values and Bonferroni adjusted p-values are presented and species that exhibited significant changes in density are highlighted in bold. 2. Table S2. Total abundance of parrotfish species counted during AGRRA surveys around New Providence between 2011 and 2019. 3. Figure S1. Species composition of parrotfish across all sites in New Providence. 4. Figure S2. Mean densities (number of individuals per 100 m2) of the top three parrotfish species (SCER = Sc. coeruleus; SGUA = Sc. Guacamaia; and SVIR = Sp. viride) targeted by Bahamian fishers on reefs around New Providence across the three survey periods. 5. Figure S3. Mean densities (number of individuals per 100 m2) of key ecologically important parrotfish species: (SAUR = Sp. Aurofrenatum; SCHR = Sp. chrysopterum; SRUB = Sp. rubripinne) on reefs around New Providence across the three survey periods. 6. Figure S4. Mean densities (number of individuals per 100 m2) of all remaining parrotfish species: SATO = Sp. Atomarium; SCER = Sc. coeruleus; SISE = Sc. iseri; STAE = Sc. Taeniopterus; and SVET = Sc. vetula observed at each site during AGRRA surveys of reefs around New Providence across the three survey periods. 7. Figure S5. Non-metric multidimensional scaling (NMDS) plots describing assemblage-level variation of mean densities of parrotfish species from New Providence by site and zone. Points reflect the mean parrotfish assemblages at individual sites, averaged over all survey groups. Sites are labelled by zone and colored individually. Ellipses represent 95% confidence intervals for parrotfish assemblages associated with each reef zone. The stress value is a measure of distortion due to the representation of ordinations in two-dimensional space. Parrotfish species codes are as follows: SCHR = Sp. Chrysopterum; SGUA = Sc. Guacamaia; SCEL = Sc. coelestinus; SRUB = Sp. Rubripinne; STAE = Sc. Taeniopterus; SVET = Sc. Vetula; SAUR = Sp. Aurofrenatum; SISE = Sc. iseri; SVIR = Sp. viride; SATO = Sp. Atomarium; and SCER = Sc. coeruleus.

Author Contributions

K.D.S. and C.P.D. conceptualized the manuscript; C.P.D. supervised and collected field data; M.I.G., T.K. and K.D.S. performed data analyses. K.D.S. wrote the original draft of the manuscript and all authors contributed to edits. All authors have read and agreed to the published version of the manuscript.

Funding

Funding and in-kind support for the completion of AGRRA surveys was provided by the Atlantis Blue Project Foundation, Disney Conservation Foundation, Devereux Ocean Foundation and Beneath the Waves.

Institutional Review Board Statement

This study did not require ethical approval. Fieldwork was conducted under scientific research permits issued by the Bahamas Department of Marine Resources, Bahamas Environment Science and Technology Commission and Bahamas National Trust.

Data Availability Statement

AGRRA data can be made available by K.D.S. or https://www.agrra.org/ (accessed on 3 August 2021).

Acknowledgments

Funding for the AGRRA surveys was provided by the Atlantis Blue Project Foundation, Disney Conservation Foundation, Devereux Ocean Foundation and Beneath the Waves.

Conflicts of Interest

The authors declare no conflict of interest.

References

  1. Hoegh-Guldberg, O. Reviving the Ocean Economy: The Case for Action—2015; WWF International: Gland, Switzerland; Geneva, Switzerland, 2015; p. 60. Available online: www.ocean.panda.org (accessed on 4 October 2021).
  2. Obura, D.O.; Aeby, G.; Amornthammarong, N.; Appeltans, W.; Bax, N.; Bishop, J.; Brainard, R.E.; Chan, S.; Fletcher, P.; Gordon, T.A.C.; et al. Coral Reef Monitoring, Reef Assessment Technologies, and Ecosystem-Based Management. Front. Mar. Sci. 2019, 6, 580. [Google Scholar] [CrossRef] [Green Version]
  3. Jackson, J.B.C.; Donovan, M.K.; Cramer, K.L.; Lam, V.V. (Eds.) Status and Trends of Caribbean Coral Reefs: 1970–2012; Global Coral Reef Monitoring Network, IUCN: Gland, Switzerland, 2014. [Google Scholar]
  4. Hoegh-Guldberg, O.; Poloczanska, E.S.; Skirving, W.; Dove, S. Coral reef ecosystems under climate change and ocean acidification. Front. Mar. Sci. 2017, 4, 158. [Google Scholar] [CrossRef] [Green Version]
  5. Dahlgren, C.; Sherman, K. Preliminary Assessment of Hurricane Dorian’s Impacts on Coral Reefs of Abaco and Grand Bahama; Report submitted to the Government of The Bahamas; Perry Institute for Marine Science: Waitsfield, VT, USA, 2020; 28p. [Google Scholar]
  6. Lester, S.E.; Rassweiler, A.; McCoy, S.J.; Dubel, A.K.; Donovan, M.K.; Miller, M.W.; Miller, S.D.; Ruttenberg, B.I.; Samhouri, J.F.; Hay, M.E. Caribbean reefs of the Anthropocene: Variance in ecosystem metrics indicates bright spots on coral depauperate reefs. Glob. Chang. Biol. 2020, 26, 4785–4799. [Google Scholar] [CrossRef]
  7. Dahlgren, C.; Pizarro, V.; Sherman, K.; Greene, W.; Oliver, J. Spatial and temporal patterns of stony coral tissue loss disease outbreaks in The Bahamas. Front. Mar. Sci. 2021, 8, 682114. [Google Scholar] [CrossRef]
  8. Bozec, Y.-M.; O’Farrell, S.; Bruggemann, J.H.; Luckhurst, B.E.; Mumby, P.J. Tradeoffs between fisheries harvest and the resilience of coral reefs. Proc. Natl. Acad. Sci. USA 2016, 113, 4536–4541. [Google Scholar] [CrossRef] [Green Version]
  9. Bellwood, D.; Hughes, T.; Folke, C.; Nyström, M. Confronting the coral reef crisis. Nature 2004, 429, 827–833. [Google Scholar] [CrossRef]
  10. Bellwood, D.R.; Wainwright, P.C.; Fulton, C.J.; Hoey, A.S. 2006 Functional versatility supports coral reef biodiversity. Proc. R. Soc. B 2005, 273, 101–107. [Google Scholar] [CrossRef] [Green Version]
  11. Mumby, P.J.; Harborne, A.R.; Williams, J.; Kappel, C.V.; Brumbaugh, D.R.; Micheli, F.; Holmes, K.E.; Dahlgren, C.P.; Paris, C.B.; Blackwell, P.G. Trophic cascade facilitates coral recruitment in a marine reserve. Proc. Natl. Acad. Sci. USA 2007, 104, 8362–8367. [Google Scholar] [CrossRef] [Green Version]
  12. Bonaldo, R.M.; Hoey, A.S.; Bellwood, D.R. The ecosystem roles of parrotfishes on tropical reefs. Oceanogr. Mar. Biol. Annu. Rev. 2014, 52, 81–132. [Google Scholar]
  13. Brandl, S.J.; Bellwood, D.R. Individual-based analyses reveal limited functional overlap in a coral reef fish community. J. Anim. Ecol. 2013, 83, 661–670. [Google Scholar] [CrossRef]
  14. Bozec, Y.-M.; Doropoulos, C.; Roff, G.; Mumby, P.J. Transient grazing and the dynamics of an unanticipated coral-algal phase shift. Ecosystems 2018, 22, 296–311. [Google Scholar] [CrossRef]
  15. Dell, C.L.A.; Longo, G.O.; Burkepile, D.E.; Manfrino, C. Few Herbivore Species Consume Dominant Macroalgae on a Caribbean Coral Reef. Front. Mar. Sci. 2020, 7, 676. [Google Scholar] [CrossRef]
  16. Mumby, P.J. The impact of exploiting grazers (Scaridae) on the dynamics of Caribbean coral reefs. Ecol. Appl. 2006, 16, 747–769. [Google Scholar] [CrossRef] [Green Version]
  17. Mumby, P.J.; Dahlgren, C.P.; Harborne, A.R.; Kappel, C.V.; Micheli, F.; Brumbaugh, D.R.; Holmes, K.E.; Mendes, J.M.; Broad, K.; Sanchirico, J.N.; et al. Fishing, trophic cascades and the process of grazing on coral reefs. Science 2006, 311, 98–101. [Google Scholar] [CrossRef] [Green Version]
  18. Clements, K.D.; German, D.P.; Piché, J.; Tribollet, A.; Choat, H.A. Integrating ecological roles and trophic diversification on coral reefs: Multiple lines of evidence identify parrotfishes as microphages. Biol. J. Linn. Soc. 2016, 120, 729–751. [Google Scholar] [CrossRef]
  19. Ruttenberg, B.I.; Adam, T.C.; Duran, A.; Burkepile, D.E. Identity of coral reef herbivores drives variation in ecological processes over multiple spatial scales. Ecol. Appl. 2019, 29, e01893. [Google Scholar] [CrossRef]
  20. Nicholson, G.M.; Clements, K.D. Resolving resource partitioning in parrotfishes (Scarini) using microhistology of feeding substrata. Coral Reefs 2020, 39, 1313–1327. [Google Scholar] [CrossRef]
  21. Yartlett, R.T.; Perry, C.T.; Wilson, R.W.; Harborne, A.R. Inter-habitat variability in parrotfish bioerosion rates and grazing pressure on an Indian Ocean reef platform. Diversity 2020, 12, 381. [Google Scholar] [CrossRef]
  22. Cox, C.E.; Jones, C.D.; Wares, J.P.; Castillo, K.D.; Bruno, J.F. Fish mislabeling in Belize: Implications for coral reef conservation. Conserv. Lett. 2013, 6, 132–140. [Google Scholar] [CrossRef]
  23. Vallès, H.; Oxenford, H.A. Parrotfish Size: A simple yet useful alternative indicator of fishing effects on Caribbean Reefs? PLoS ONE 2014, 9, e86291. [Google Scholar] [CrossRef] [Green Version]
  24. Nagelkerken, I.; Grol, M.G.G.; Mumby, P.J. Effects of marine reserves versus nursery habitat availability on structure of reef fish communities. PLoS ONE 2012, 7, e36906. [Google Scholar] [CrossRef] [Green Version]
  25. Eggertsen, M.; Chacin, D.H.; van Lier, J.; Eggertsen, L.; Fulton, C.J.; Wilson, S.; Halling, C.; Berkstrom, C. Seascape configuration and fine-scale habitat complexity shape parrotfish distribution and function across a coral reef lagoon. Diversity 2020, 12, 391. [Google Scholar] [CrossRef]
  26. Stallings, C.D. Fishery-independent data reveal negative effect of human population density on Caribbean predatory fish communities. PLoS ONE 2009, 4, e5333. [Google Scholar] [CrossRef]
  27. Bejarano, S.; Golbuu, Y.; Sapolu, T.; Mumby, P.J. Ecological risk and the exploitation of herbivorous reef fish across Micronesia. Mar. Ecol. Prog. Ser. 2013, 482, 197–215. [Google Scholar] [CrossRef] [Green Version]
  28. Sherman, K.D.; Shultz, A.D.; Dahlgren, C.P.; Thomas, C.; Brooks, E.; Brooks, A.; Brumbaugh, D.R.; Gittens, L.; Murchie, K. Contemporary and emerging fisheries in The Bahamas—Conservation and management challenges, achievements and future directions. Fish. Manag. Ecol. 2018, 25, 319–331. [Google Scholar] [CrossRef]
  29. Callwood, K. Examining the development of a parrotfish fishery in The Bahamas: Social considerations and management implications. Glob. Ecol. Conserv. 2021, 28, e01677. [Google Scholar] [CrossRef]
  30. Dahlgren, C.; Kramer, P.R.; Lang, J.; Sherman, K. New Providence and Rose Island, Bahamas 2014 Coral Reef Report Card; Perry Institute for Marine Science: Waitsfield, VT, USA, 2014. [Google Scholar]
  31. Dahlgren, C.; Sherman, K.; Lang, J.; Kramer, P.R.; Marks, K. Bahamas Coral Reef Report Card Volume 1: 2011–2013; Perry Institute for Marine Science: Waitsfield, VT, USA, 2016. [Google Scholar]
  32. Dahlgren, C.; Sherman, K.; Haines, L.; Knowles, L.; Callwood, K. Bahamas Coral Reef Report Card Volume 2: 2015–2019; Perry Institute for Marine Science: Waitsfield, VT, USA, 2020. [Google Scholar]
  33. Williams, I.D.; Kindinger, T.L.; Couch, C.S.; Walsh, W.J.; Minton, D.; Oliver, T.A. Can Herbivore Management Increase the Persistence of Indo-Pacific Coral Reefs? Front. Mar. Sci. 2019, 6, 557. [Google Scholar] [CrossRef]
  34. Bruno, J.F.; Côté, I.M.; Toth, L.T. Climate change, coral loss, and the curious case of the parrotfish paradigm: Why don’t marine protected areas improve reef resilience? Annu. Rev. Mar. Sci. 2019, 11, 307–334. [Google Scholar] [CrossRef] [Green Version]
  35. Chung, A.E.; Wedding, L.M.; Green, A.L.; Friedlander, A.M.; Goldberg, G.; Meadows, A.; Hixon, M.A. Building Coral Reef Resilience Through Spatial Herbivore Management. Front. Mar. Sci. 2019, 6, 98. [Google Scholar] [CrossRef]
  36. McClanahan, T.R.; Muthiga, N.A. Change in fish and benthic communities in Belizean patch reefs in and outside of a marine reserve, across a parrotfish capture ban. Mar. Ecol. Prog. Ser. 2020, 645, 25–40. [Google Scholar] [CrossRef]
  37. Sullivan-Sealey, K. Large-scale ecological impacts of development on tropical island systems: Comparison of developed and undeveloped islands in the central Bahamas. Bull. Mar. Sci. 2004, 75, 295–320. [Google Scholar]
  38. Anderson, M.J. A new method for non-parametric multivariate analysis of variance. Austral Ecol. 2001, 26, 32–46. [Google Scholar]
  39. Bray, J.R.; Curtis, J.T. An ordination of the upland forest community of southern Wisonsin. Ecol. Monogr. 1957, 27, 325–349. [Google Scholar] [CrossRef]
  40. Kahle, D.; Wickham, H. ggmap: Spatial Visualization with ggplot2. R J. 2013, 5, 144–161. Available online: http://journal.r-project.org/archive/2013-1/kahle-wickham.pdf (accessed on 4 October 2021). [CrossRef] [Green Version]
  41. Wei, T.; Simko, V. Corrplot: Visualization of a Correlation Matrix [Online]. R package version 0.92. 2021. Available online: https://cran.r-project.org/package=corrplot (accessed on 4 October 2021).
  42. Harms-Tuohy, C.A. Parrotfishes in the Caribbean: A Regional Review with Recommendations for Management; FAO Fisheries and Aquaculture Circular No.1240; FAO: Rome, Italy, 2021. [Google Scholar] [CrossRef]
  43. Brown, C.J.; Harborne, A.R.; Paris, C.B.; Mumby, P.J. Uniting paradigms of connectivity in marine ecology. Ecology 2016, 97, 2447–2457. [Google Scholar] [CrossRef] [Green Version]
  44. Vallès, H. Parrotfish recruitment revisited: A key role for sea surface currents. Environ. Biol. Fishes 2017, 100, 1649–1657. [Google Scholar] [CrossRef]
  45. Adam, T.C.; Kelley, M.; Ruttenberg, B.I.; Burkepile, D.E. Resource partitioning along multiple niche axes drives functional diversity in parrotfishes on Caribbean coral reefs. Oecologia 2015, 179, 1173–1185. [Google Scholar] [CrossRef] [Green Version]
  46. Graham, N.A.J.; Nash, K.L. The importance of structural complexity in coral reef ecosystems. Coral Reefs 2013, 32, 315–326. [Google Scholar] [CrossRef]
  47. Welsh, J.Q.; Goatley, C.H.R.; Bellwood, D.R. The ontogeny of home ranges: Evidence from coral reef fishes. Proc. R. Soc. B. 2013, 280, 20132066. [Google Scholar] [CrossRef] [Green Version]
  48. Green, A.L.; Maypa, A.P.; Almany, G.R.; Rhodes, K.L.; Weeks, R.; Abesamis, R.A.; Gleason, M.G.; Mumby, P.J.; White, A.T. Larval dispersal and movement patterns of coral reef fishes, and implications for marine reserve network design. Biol. Rev. 2014, 90, 1215–1247. [Google Scholar] [CrossRef]
  49. Roff, G.; Bejarano, S.; Priest, M.; Marshell, A.; Chollett, I.; Steneck, R.S.; Doropoulos, C.; Golbuu, Y.; Mumby, P.J. Seascapes as drivers of herbivore assemblages in coral reef ecosystems. Ecol. Monogr. 2019, 89, e01336. [Google Scholar] [CrossRef] [Green Version]
  50. Evensen, N.R.; Vanwonterghem, I.; Doropoulos, C.; Gouezo, M.; Botté, E.S.; Webster, N.S.; Mumby, P.J. Benthic micro- and macro-community succession and coral recruitment under overfishing and nutrient enrichment. Ecol. Accept. Author Manuscr. 2021, 102, e03536. [Google Scholar] [CrossRef]
  51. Holbrook, S.J.; Brooks, A.J.; Schmitt, R.J. Predictability of fish assemblages on coral patch reefs. Mar. Freshw. Res. 2002, 53, 181–188. [Google Scholar] [CrossRef]
  52. Hixon, M.A. Reef fishes, seaweeds, and corals. In Coral Reefs in the Anthropocene; Birkeland, C., Ed.; Springer: Dordrecht, The Netherlands, 2015; pp. 195–215. [Google Scholar] [CrossRef]
  53. Choat, J.H. Spawning aggregations in reef fishes: Ecological and evolutionary processes. In Reef Fish Spawning Aggregations: Biology, Research and Management; Sadovy de Mitcheson, Y., Colin, P.L., Eds.; Springer: New York, NY, NY, 2012; pp. 85–116. [Google Scholar]
  54. Lange, I.D.; Perry, C.T.; Morgan, K.M.; Roche, R.; Benkwitt, C.E.; Graham, N.A. Site-level variation in parrotfish grazing and bioerosion as a function of species-specific feeding metrics. Diversity 2020, 12, 379. [Google Scholar] [CrossRef]
  55. Goetze, J.S.; Langlois, T.J.; Egli, D.P.; Harvey, E. Evidence of artisanal fishing impacts and depth refuge in assemblages of Fijian reef fish. Coral Reefs 2011, 30, 507–517. [Google Scholar] [CrossRef]
  56. O’Farrell, S.; Harborne, A.R.; Bozec, Y.M.; Luckhurst, B.E.; Mumby, P.J. Protection of functionally important parrotfishes increases their biomass but fails to deliver enhanced recruitment. Mar. Ecol. Prog. Ser. 2015, 522, 245–254. [Google Scholar] [CrossRef]
  57. Fisheries Resources (Jurisdiction and Conservation) (Amendment) Act, 2020. 21 of 2020—Fisheries Resources (Jurisdiction and Conservation) (Amendment) Act. 2020. Available online: bahamas.gov.bs (accessed on 28 January 2022).
  58. AGRRA. Atlantic and Gulf Rapid Reef Assessment (AGRRA): An Online Database of AGRRA Coral Reef Survey Data. 2018. Available online: http://agrra.org (accessed on 3 August 2021).
  59. Loera-Padilla, F.J.; Piñeros, V.J.; Baldwin, C.C.; Cox, C.E.; Simoes, N.; Ribeiro, E.; Lasso-Alcalá, O.M.; Domínguez-Domínguez, O. Phylogeography, population connectivity and demographic history of the Stoplight parrotfish, Sparisoma viride (Teleostei: Labridae), in the Greater Caribbean. Coral Reefs 2022, 41, 753–765. [Google Scholar] [CrossRef]
  60. Velasco-Montoya, D.A.; Millán-Márquez, A.M.; Tavera, J. Genetic connectivity in Sparisoma aurofrenatum (redband parrotfish): An unexpected journey. Hydrobiologia 2022, 849, 1727–1741. [Google Scholar] [CrossRef]
Figure 1. Map of the reef sites (black symbols) surveyed around New Providence and Rose Island in The Bahamas between 2011 and 2019. The inset map shows the location of the study area—New Providence (highlighted in the black box) relative to other Bahamian islands. Reef zones are indicated as follows: patch = black squares and forereef = black crosses.
Diversity 14 00625 g001
Figure 2. (a) Mean densities (number of individuals per 100 m2) by site and reef zone averaged across all survey periods. Patch reef are in black and forereef sites are in grey. (b) The mean densities (number of individuals per 100 m2) of all parrotfish (Scarini) on coral reefs around New Providence for each survey period, with error bars showing the standard deviation (±SD) of the data. The red line denotes the regional mean value (24.3/100 m2) of parrotfish densities (AGRRA 2018). Significant differences across survey periods are denoted with an asterisk.
Diversity 14 00625 g002
Figure 3. Non-metric multidimensional scaling (NMDS) plots describing the assemblage-level variation of mean densities of parrotfish species from New Providence by survey period and zone. Points indicate parrotfish assemblages at individual sites, with species densities averaged for all transects from each survey group. Sites are labeled by zone and colored by survey group. Ellipses represent 95% confidence intervals for parrotfish assemblages associated with each survey group and the stress values indicate a measure of distortion due to the representation of ordinations in two-dimensional space of the assemblages. Species abbreviations are as follows: SCHR = Sp. Chrysopterum; SGUA = Sc. Guacamaia; SCEL = Sc. coelestinus; SRUB = Sp. rubripinne; STAE = Sc. taeniopterus; SVET = Sc. vetula; SAUR = Sp. aurofrenatum; SISE = Sc. iseri; SVIR = Sp. viride; SATO = Sp. Atomarium; and SCER = Sc. coeruleus.
Diversity 14 00625 g003
Figure 4. Mean (±SD) densities (number (#) of individuals per 100 m2) of parrotfish: SISE = Striped, SAUR = Redband, SVIR = Stoplight, STAE = Princess, SVET = Queen and SATO = Greenblotch, SRUB = Yellowtail, SCHR = Redtail, SGUA = Rainbow, SCER = Blue and SCEL = Midnight Parrotfish on reefs around New Providence across the three survey periods. Statistically significant differences between survey periods are denoted with an asterisk (p < 0.05 = *, p < 0.01 = ** and p < 0.001 = ***) and letters (e.g., A for differences between 2011–2012 and 2019 and B for differences between 2015–2016 and 2019).
Diversity 14 00625 g004
Figure 5. Percent changes in mean parrotfish densities (number of individuals per 100 m2) across survey sites in New Providence. Circle sizes represent the mean density of parrotfish in 2019. The colors denote the percent change in parrotfish densities for the given site since the 2011–2012 survey period. Site codes for patch reefs are italicized and forereef sites appear in normal font.
Diversity 14 00625 g005
Figure 6. Size frequency distribution showing the total number of all parrotfish in different size classes across each survey period for New Providence. Sites with dashed lines indicate zeros and those with completely blank spaces represent sites where no data were collected during that survey period.
Diversity 14 00625 g006
Figure 7. Size frequency distribution showing the total number of Stoplight Parrotfish (Sparisoma viride) in different size classes across each survey period for New Providence. Sites with dashed lines indicate zeros and those with completely blank spaces represent sites where no data were collected during that survey period.
Diversity 14 00625 g007
Figure 8. (a) Size frequency distribution showing the percentage of all parrotfish in different size classes across each survey period by reef zone and (b) corrplot illustrating the Pearson residuals for each size class contributing to the global chi-square statistic. The residual cutoff used to indicate a significant deviance from the expected standardized residuals of the global chi-square test is set at ±2.807. Color indicates the sign and magnitude of the residuals as follows: blue is significantly positive, red is significantly negative and white is non-significant.
Diversity 14 00625 g008
Figure 9. (a) Size frequency distribution showing the percentage of Stoplight Parrotfish (Sparisoma viride) in different size classes across each survey period by reef zone and (b) corrplot illustrating the Pearson residuals for each size class contributing to the global Chi-square statistic. The residual cutoff used to indicate a significant deviance from the expected standardized residuals of the global chi-square test is set at ±2.807. Color indicates the sign and magnitude of the residuals as follows: blue is significantly positive, red is significantly negative and white is non-significant.
Diversity 14 00625 g009
Table 1. Summary information for the number of fish transects, depth ranges and mean survey depth in meters and mean parrotfish density (number (#) of individuals per 100 m2) ± standard deviation (SD) for each site surveyed around New Providence and Rose Island between 2011 and 2019. The 10 sites repeatedly surveyed across all three survey periods are highlighted in bold.
Site NameSite CodeReef ZoneNo. TransectsSurvey Depth Range (m)Mean Survey Depth (m)Mean Density (# Indiv./100 m2)Years Surveyed
Jonsa ReefNP0010Patch146.1–7.66.938.8 (±26.7)2012; 2019
Tao ReefNP0011Patch144.6–7.65.836.5 (±20.0)2012; 2019
Pumpkin PatchNP1001Fore359.9–16.012.324.6 (±14.3)2011; 2016; 2019
BBCNP1002Fore1213.4–13.713.624.0 (±18.3)2011; 2019
Clifton WallNP1003Fore2212.2–15.713.822.1 (±12.0)2011; 2016; 2019
NariNP1004Fore256.1–8.47.126.3 (±18.9)2011; 2016; 2019
RazorbackNP1005Fore2012.6–20.416.015.7 (±11.5)2011; 2016; 2019
Runway WallNP1006Fore239.6–14.411.815.1 (±9.0)2011; 2016; 2019
WillaurieNP1007Fore2213.2–15.714.724.1 (±17.1)2011; 2016; 2019
Tunnel WallNP1008Fore209.6–15.212.910.9 (±11.5)2011; 2019
Elkhorn GardenNP1009Patch172.9–6.15.013.4 (±9.2)2011; 2016; 2019
Traveler’s WallNP1012Fore2513.6–19.216.914.8 (±11.4)2012; 2019
Schoolhouse ReefNP1013Patch232.5–4.63.732.1 (±19.5)2012; 2016; 2019
Trinity CavesNP1020Fore108.6–13.710.26.5 (±6.9)2015; 2019
Piece of CakeNP1021Fore94.0–9.85.117.1 (±19.7)2015; 2019
East End ReefNP1022Patch93.0–6.14.534.1 (±29.6)2015; 2019
Sand ChuteNP1023Fore412.2–13.712.65.4 (±2.1)2019
Wreck on the WallNP1024Fore416.8–16.816.87.9 (±4.2)2019
Nadia’s ReefRI0007Patch144.0–6.14.925.7 (±22.3)2012; 2019
Alex’s ReefRI0029Patch164.0–4.64.321.5 (±14.7)2012; 2019
Cannonball ReefRI1001Patch381.2–6.14.326.6 (±25.9)2011; 2012; 2015; 2016; 2019
Fan CityRI1002Fore297.9–9.48.619.6 (±13.7)2011; 2016; 2019
Lindy’s ReefRI1003Fore323.1–5.34.237.3 (±19.1)2011; 2015; 2016; 2019
Alpha ReefRI1004Fore214.8–11.07.530.2 (±14.2)2011; 2019
Athol IslandRI1005Patch162.7–3.73.233.8 (±26.7)2012; 2019
Shelley’s ReefRI1006Fore94.4–6.15.321.7 (±20.2)2015; 2019
TOTAL 483
Publisher’s Note: MDPI stays neutral with regard to jurisdictional claims in published maps and institutional affiliations.

