Article

Molecular Phylogeny of Selected Kenyan Eucalyptus Species Inferred from MatK, rbcL and TrnL-F Genes and Their Suitability for Power Transmission Poles

1
Department of Biological Sciences, University of Embu, P.O. Box 6, Embu 60100, Kenya
2
Department of Applied and Technical Biology, Technical University of Kenya, P.O. Box 52428, Nairobi 00200, Kenya
3
Kenya Forestry Research Institute, P.O. Box 20412, Nairobi 00200, Kenya
*
Author to whom correspondence should be addressed.
Diversity 2022, 14(7), 563; https://doi.org/10.3390/d14070563
Submission received: 6 April 2022 / Revised: 28 May 2022 / Accepted: 28 June 2022 / Published: 14 July 2022

Abstract

:
Genus Eucalyptus belongs to the family Myrtaceae and consists of more than 900 species, various hybrids and varieties. The major species that are grown in Kenya are Eucalyptus grandis, E. globulus, E. saligna and E. camaldulensis. Most Eucalyptus species are highly dependent on rainfall and this is challenged by climatic changes owing to global warming making it difficult to effectively match the availability of mature trees and the market demand especially for use as power transmission poles. With the widespread availability of other naturally occurring Eucalyptus species such as E. camaldulensis and E. globulus, it becomes important to determine the genetic diversity and to analyze the phenotypic traits of these species for suitability as power transmission poles in order to counter the overdependence on E. grandis. Phenotypic traits investigated included measuring total tree height and diameter at breast height (DBH), while molecular data were obtained from sequencing MatK, rbcL and TrnL-F genes from selected species and evolutionary analyses such as nucleotide substitution rates, base composition disparity indices, evolutionary divergence, nucleotide diversity indices and phylogeny construction were conducted in MEGA 11. Significant differences in DBH and height among Eucalyptus species were observed when the phenotypic data were subjected to ANOVA. In this study, E. robusta, E. paniculata, E. maculata, E. dunnii, E. camaldulensis and E. citriodora are fit to be used as power transmission poles but they are limited by their short height. However, E. tereticornis and E. glaucina have the desired DBH and height and hence can be used as substitutes for E.grandis. Generally, the molecular phylogeny study has shown that the studied Eucalyptus species are closely related and form various monophyletic clades which can be attributed to the short genetic distances, low substitution rates, low nucleotide bias disparity indices and low diversity scores. Further phylogenetic and gene expression studies involving more Eucalyptus species are needed to better understand Eucalyptus phylogeny, and diversity and identify species with similar genetic make-up to that of E. grandis which has been used extensively for the provision of electricity transmission poles.

1. Introduction

The genus Eucalyptus belongs to the family Myrtaceae and comprises more than 900 species with various hybrids and varieties globally [1]. They grow in different ecological zones; hardy species grow in semi-arid areas while others grow on marshy sites and under a variety of soils including infertile sands, fertile loam soils and heavy clays [2]. Eucalyptus are plantation trees that are widely cultivated in Kenya comprising mostly species of the subgenus Symphyomyrtus [3]. Plantations composed of Eucalyptus species have been estimated to be 20 million hectares worldwide [4]. Members of this genus are used as power transmission poles, construction, fuelwood, carbon sequestration, and alleviating climate change effects [5] as well as in paper and wood industries [6].
The most cultivated species in Kenya are; Eucalyptus grandis, E. saligna, E. camaldulensis and E. globulus alongside other species cultivated on a small scale such as E. regnans, E. paniculata, E. maculata and E. citriodora apart from Eucalyptus hybrids that are also broadly cultivated in the country [5]. Eucalyptus grandis trees grow into tall and straight stems; hence, they are exploited for plywood, sawn timber for furniture in industries and as power transmission poles [6]. E. grandis is majorly used because it can tolerate low soil fertility and has a high growth rate [7]. E. grandis also has a wide trunk that grows up to 45–65 m in height and is straight [8]. E. grandis can also be managed easily in the nursery [9]. Growing E. grandis for the provision of electricity transmission poles and firewood has been shown to be profitable in Kenya [4]. This is particularly due to the growing demand for power transmission poles and fuel wood for both domestic and industrial use.
Increased demand for treated poles is due to the government determination to link more individuals with electricity. This has been coordinated with increased investment in the growing of Eucalyptus species on both Kenya Forest Service (KFS) plantations and various private farms. Recent research has led to the development of a variety of hybrids of E. grandis and E. camaldulensis that are site-matched for different ecological zones including dry lands. Currently, wooden electricity transmission poles in Kenya are entirely from Eucalyptus species. The main consumers of poles include Kenya Power and Lightning Company (KPLC) and Rural Electrification and Renewable Energy Corporation (REREC), with an estimated annual demand of 400,000–500,000 poles per year. The domestic supply of poles has not been enough to fulfill the demand, and the consumers have been importing about 10% to cater to the deficit [10]. This demand has called for diversification in terms of where Eucalyptus is grown, further calling for enhancement of species identification and matching with different sites. There is a need, therefore, to understand the diversity of the Eucalyptus species in the country and their suitability for poles in order to help farmers to grow and adequately supply the right quality wood for poles.
Eucalyptus is best transformed by the use of transgenic technology due to its long breeding cycle, high level of heterozygosity, and incompatible barriers [6]. The conventional breeding approach has occasionally been used, such as the use of the ccr gene single nucleotide polymorphism markers to determine the reduced microfibril angle in E. nitens and there is insignificant information made by molecular breeding towards the improvement of Eucalyptus germplasm through the genomic approach [11]. Although a variety of scientific reports on the effective transformation of foreign genes into food crops, forest trees such as Eucalyptus species remain a challenge to transgenic technology [6]. Studying the phenotypic traits of Eucalyptus is thus important for effective tree breeding and in knowing the genetic progress of parental generation and its progeny [12]. In addition, analyzing the physical traits of plants is becoming more important so in the foundation of new industries to replace the use of organic chemicals and fossil hydrocarbons in industries [13]. Studying wood phenotypic traits is costly and time-consuming. However, the use of near-infrared reflectance spectroscopy (NIRS) that uses a calibration model has reduced the cost of studying wood phenotypic traits [14,15]. NIRS has been successfully used in predicting physical traits in species such as E. globulus, E. nitens and their hybrids which thrive in temperate zones [16]. Phenotypic traits such as DBH and height are affected by various biotic and abiotic factors and the same phenotypic trait in a species can be prominent or reduced with respect to the ecological zone where the species is growing [17]. Consequently, it is vital to determine if phenotypic differences among species are due to environmental factors or genetically influenced factors.
The demand for power transmission poles has risen over the last years [18]. Therefore, farmers and many companies have invested in the production and processing of power transmission poles to support distribution of electricity and take advantage of the associated high returns [19,20]. Although there is introduction of concrete poles, the production of concrete poles stands at less than 10% of the current annual demand for power transmission poles [21]. In Kenya, there has been a deficit of 200,000 transmission poles that have necessitated importation from various countries since 2006 [10,22]. There is a need, therefore, to venture into low-cost production of E. grandis and other alternative Eucalyptus species to increase the local supply of poles and reduce their importation.
Chloroplast DNA genes such as Maturase K (MatK), Ribulose biphosphate carboxylase large subunit (rbcL), and TrnL-F intergenic spacer (TrnL-F) are important in studies of population genetics and phylogeography in Eucalyptus. This is because most chloroplast genes evolve at a slower rate compared to nucleus genes and are considered the best genes for systematic studies [23]. Barthet et al. demonstrate that the MatK gene exists in most plant species, and the expression of this gene is influenced by light and development stage hence the importance of this gene in plant systematics, plant molecular biology, and gene evolution studies [24]. RbcL gene has also been exploited to understand plant systematics beyond the family level, and the TrnL-F gene is expressed in the leaves of plants and function in the first step of photosynthesis and photorespiration in plants and has also been used widely in plant phylogenetic studies [25].
Studying the current status of morphological and genetic diversity of Eucalyptus species and obtaining genetic data will provide a guide for their management, assessment and identification of economically and environmentally beneficial species [26]. Molecular data have been widely applied to understand the role of historical processes in shaping standing genetic diversity within species [27], but little is known about the phylogenetic relationships of most of the Kenyan Eucalyptus species. Eucalyptus is naturally protandrous and hence promotes outcrossing [28]. Consequently, for both natural and manipulated crosses, the offspring are morphological intermediates between the two parent taxa and show a high level of variability in the second generation and identification of the intermediate offspring is a challenge that could be addressed by molecular phylogenetic studies [28].

2. Materials and Methods

2.1. Sample Collection and Determination of Phenotypic Traits

Leaves of ten species of Eucalyptus aged between 8 and 12 years were collected from various Kenya Forest Service plantations and farms in Kakuzi in Nairobi and Londiani in Rift Valley in February 2021. They were positively identified by Magrate Kaigongi, a botanist at Kenya Forestry Research Institute (KEFRI) and selected for phenotypic study and as source samples for molecular analysis. Samples were sealed in plastic bags containing silica and transported in a cooler box to maintain viability of the cells and stored in the laboratory at −20 °C until DNA extraction was performed. Voucher specimens were deposited in KEFRI herbarium. The following are voucher specimen numbers of the specimens collected: E. grandis (MK2021/01), E. paniculata (MK2021/02), E. maculata (MK2021/03), E. robusta (MK2021/04), E. camaldulensis (MK2021/05), E. citriodora (MK2021/06), E. urophylla (MK2021/07), E.dunnii (MK2021/08), E.glaucina (MK2021/09) and E.tereticornis (MK2021/10). From the sampled species, two phenotypic traits were measured: total tree height (m), and diameter at breast height (DBH) (cm). Stems were assessed for straightness, and then stem diameter was determined using diameter tape and the total height of the tree measured by Suunto hypsometer [29]. Five observations were randomly obtained for each species under the two phenotypic traits investigated.

2.2. DNA Extraction, PCR, and Sequencing

DNA was extracted from fresh leaves of the collected Eucalyptus species using the cetyltrimethylammonium bromide (CTAB) DNA extraction method. Three chloroplast genes which are universal molecular markers suitable for phylogenetic studies in plants were targeted. These genes were MatK gene, rbcL and TrnL-F. Amplification of DNA was then carried out using primers of the three genes selected from previous phylogenetic studies (Table 1). Sequencing was performed at Inqaba Biotec East Africa (IBEA), South Africa. The obtained sequences of the three genes from the ten Eucalyptus species were then exported to MEGA 11 software (Molecular Evolutionary Genetics Analysis Version 11) for phylogenetic analysis [30].

2.3. Phylogenetic Analysis

Obtained DNA sequences were subjected to basic evolutionary analyses such as evolutionary distances and phylogenetic reconstructions recommended by Tamura et al. [30] and Kumar et al. [34]. All the MatK, rbcL and TrnL-F sequences from Eucalyptus species were exported and assembled in MEGA 11 and their ends edited manually to remove wrong bases at the ends, which could compromise the quality of the sequences, then aligned using Muscle-codon alignment method [35]. Multiple sequence alignment is important in identification of gaps, matches and mismatched nucleotides in the three genes which is a prerequisite for the construction of phylogenetic trees. Evolutionary analyses included measures of nucleotide substitution rates, base composition bias disparity index, evolutionary divergence and nucleotide diversity indices. Codon positions included in the analyses were 1st + 2nd + 3rd + Noncoding. During phylogenetic analysis of the three genes, Kimura 3 parameter and Jukes-Cantor evolutionary models were followed [36,37]. The models assumed the rates and patterns of substitution were uniform among the four nucleotide sites. The method of tree construction was maximum likelihood (ML) where for the ML tree, the heuristic approach was the nearest neighbor interchange and the test for phylogeny was bootstrap resampling where the number of bootstrap replications were set at 5000 for each ML tree constructed. The trees with the highest log likelihood were selected as the best trees to depict the phylogenetic relationships of Eucalyptus species under study.

3. Results

3.1. Phenotypic Traits of Eucalyptus Species

DBH and height means of Eucalyptus species under study aged between 8 and 12 years are shown in Figure 1. The mean DBH of E. camaldulensis (90.33 ± 2.31 cm) is higher than the mean DBH of other species which is followed by the mean DBH of E. grandis (71.0 ± 3.24 cm), while the others have a mean DBH of around 25 cm. The high mean DBH of E. camaldulensis could be because the height of E.camaldulensis is smaller compared to the other species, and it can be assumed that it increases in girth more than height. E. dunnii has the smallest mean DBH (18.0+1.2 cm). The preferred range of DBH according to Kenya Power and Lightning Company (KPLC), for wooden power transmission poles is 18.3–28.3 cm [22]. Hence E. glaucina (27.0 ± 1.81 cm), E. robusta (22.0 ± 1.73 cm), E. paniculata (30.67 ± 2.41 cm), E. tereticornis (26.0 ± 1.59 cm), E.urophylla (22.0 ± 2.81 cm), E. maculata (24.67 ± 1.57 cm), E. dunnii (18.0 + 1.2 cm) and E. citriodora (27.0 ± 1.22 cm) have prefered average DBH for power transmission poles. However, DBH mainly will depend on the age of the tree, and the climatic condition of the region where the trees are grown, and species such as E. grandis can attain high DBH. In wet areas, Eucalyptus will attain the desired size between 8 and 10 years, while in drier areas, the same species could reach the preferred size between 12 and15 years [10]. Data analysis was performed in SPSS version 23. Initially, data were assessed for normality using Shapiro–Wilk test, which is an appropriate method for small sample sizes. Shapiro-Wilk statistic (W) showed that data were normally distributed since all p values for the W statistic in all the 10 Eucalyptus samples were above 0.05. Similarly, Q-Q normal plots showed that the data points did not deviate significantly from the diagonal line suggesting that the samples were normally distributed. Levene’s test results for DBH and height were (F = 3.44, p = 0.061) and (F = 6.921, p = 0.072) respectively which indicated homogeneity of variance among the 10 Eucalyptus samples. A one-way ANOVA revealed that there was statistically significant difference in DBH (F (9, 40) = 33.356, p = 0.004) and height (F (9, 40) = 7.364, p = 0.007) among the 10 Eucalyptus species.
According to Figure 1, the mean height of E. grandis (34.0 ± 3.11 m) is slightly higher than the mean height of other species, followed by E. glaucina (31.67 ± 1.17 m) and E. territicornis (30 ± 1.52 m) while E. camaldulensis (19.67 ± 2.34 m), E. maculata (20 ± 1.43 m) and E.dunnii (20 ± 1.26 m) are among the species with the shortest height. E. grandis has a higher mean DBH and height and it is suitable for power transmission pole since the preferred height according to KPLC is 30–55 m [10]. Tukeys HSD test analysis was performed to compare the height of E. grandis with other Eucalyptus species. The results found that the mean height was not significantly different between E. grandis and E. tereticornis (p = 0.977, 95% C.I. = [−6.55, 14.56]). Similarly, mean height was not significantly different between E. grandis and E. glaucina (p = 0.931, 95% C.I. = [−7.22, 13.89]). Moreover, Tukey’s test confidence intervals (C.Is) include zero corroborating the fact that there are no differences between groups. Therefore, E. tereticornis and E. glaucina whose DBHs falls within the preferred KPLC size can be used to support the high demand for power transmission poles because their DBH and height meets the KPLC pole specifications as gazetted in Kenya Standard 516 of 2008 (KS 516: 2008).

3.2. Molecular Phylogeny of Eucalyptus Species

Twenty-four sequences (10 rbcL, 7 MatK and 7 TrnL-F sequences) of the three genes from the ten Eucalyptus species were successfully amplified and sequenced then deposited in NCBI Genbank and their accession numbers are tabulated below (Table 2).
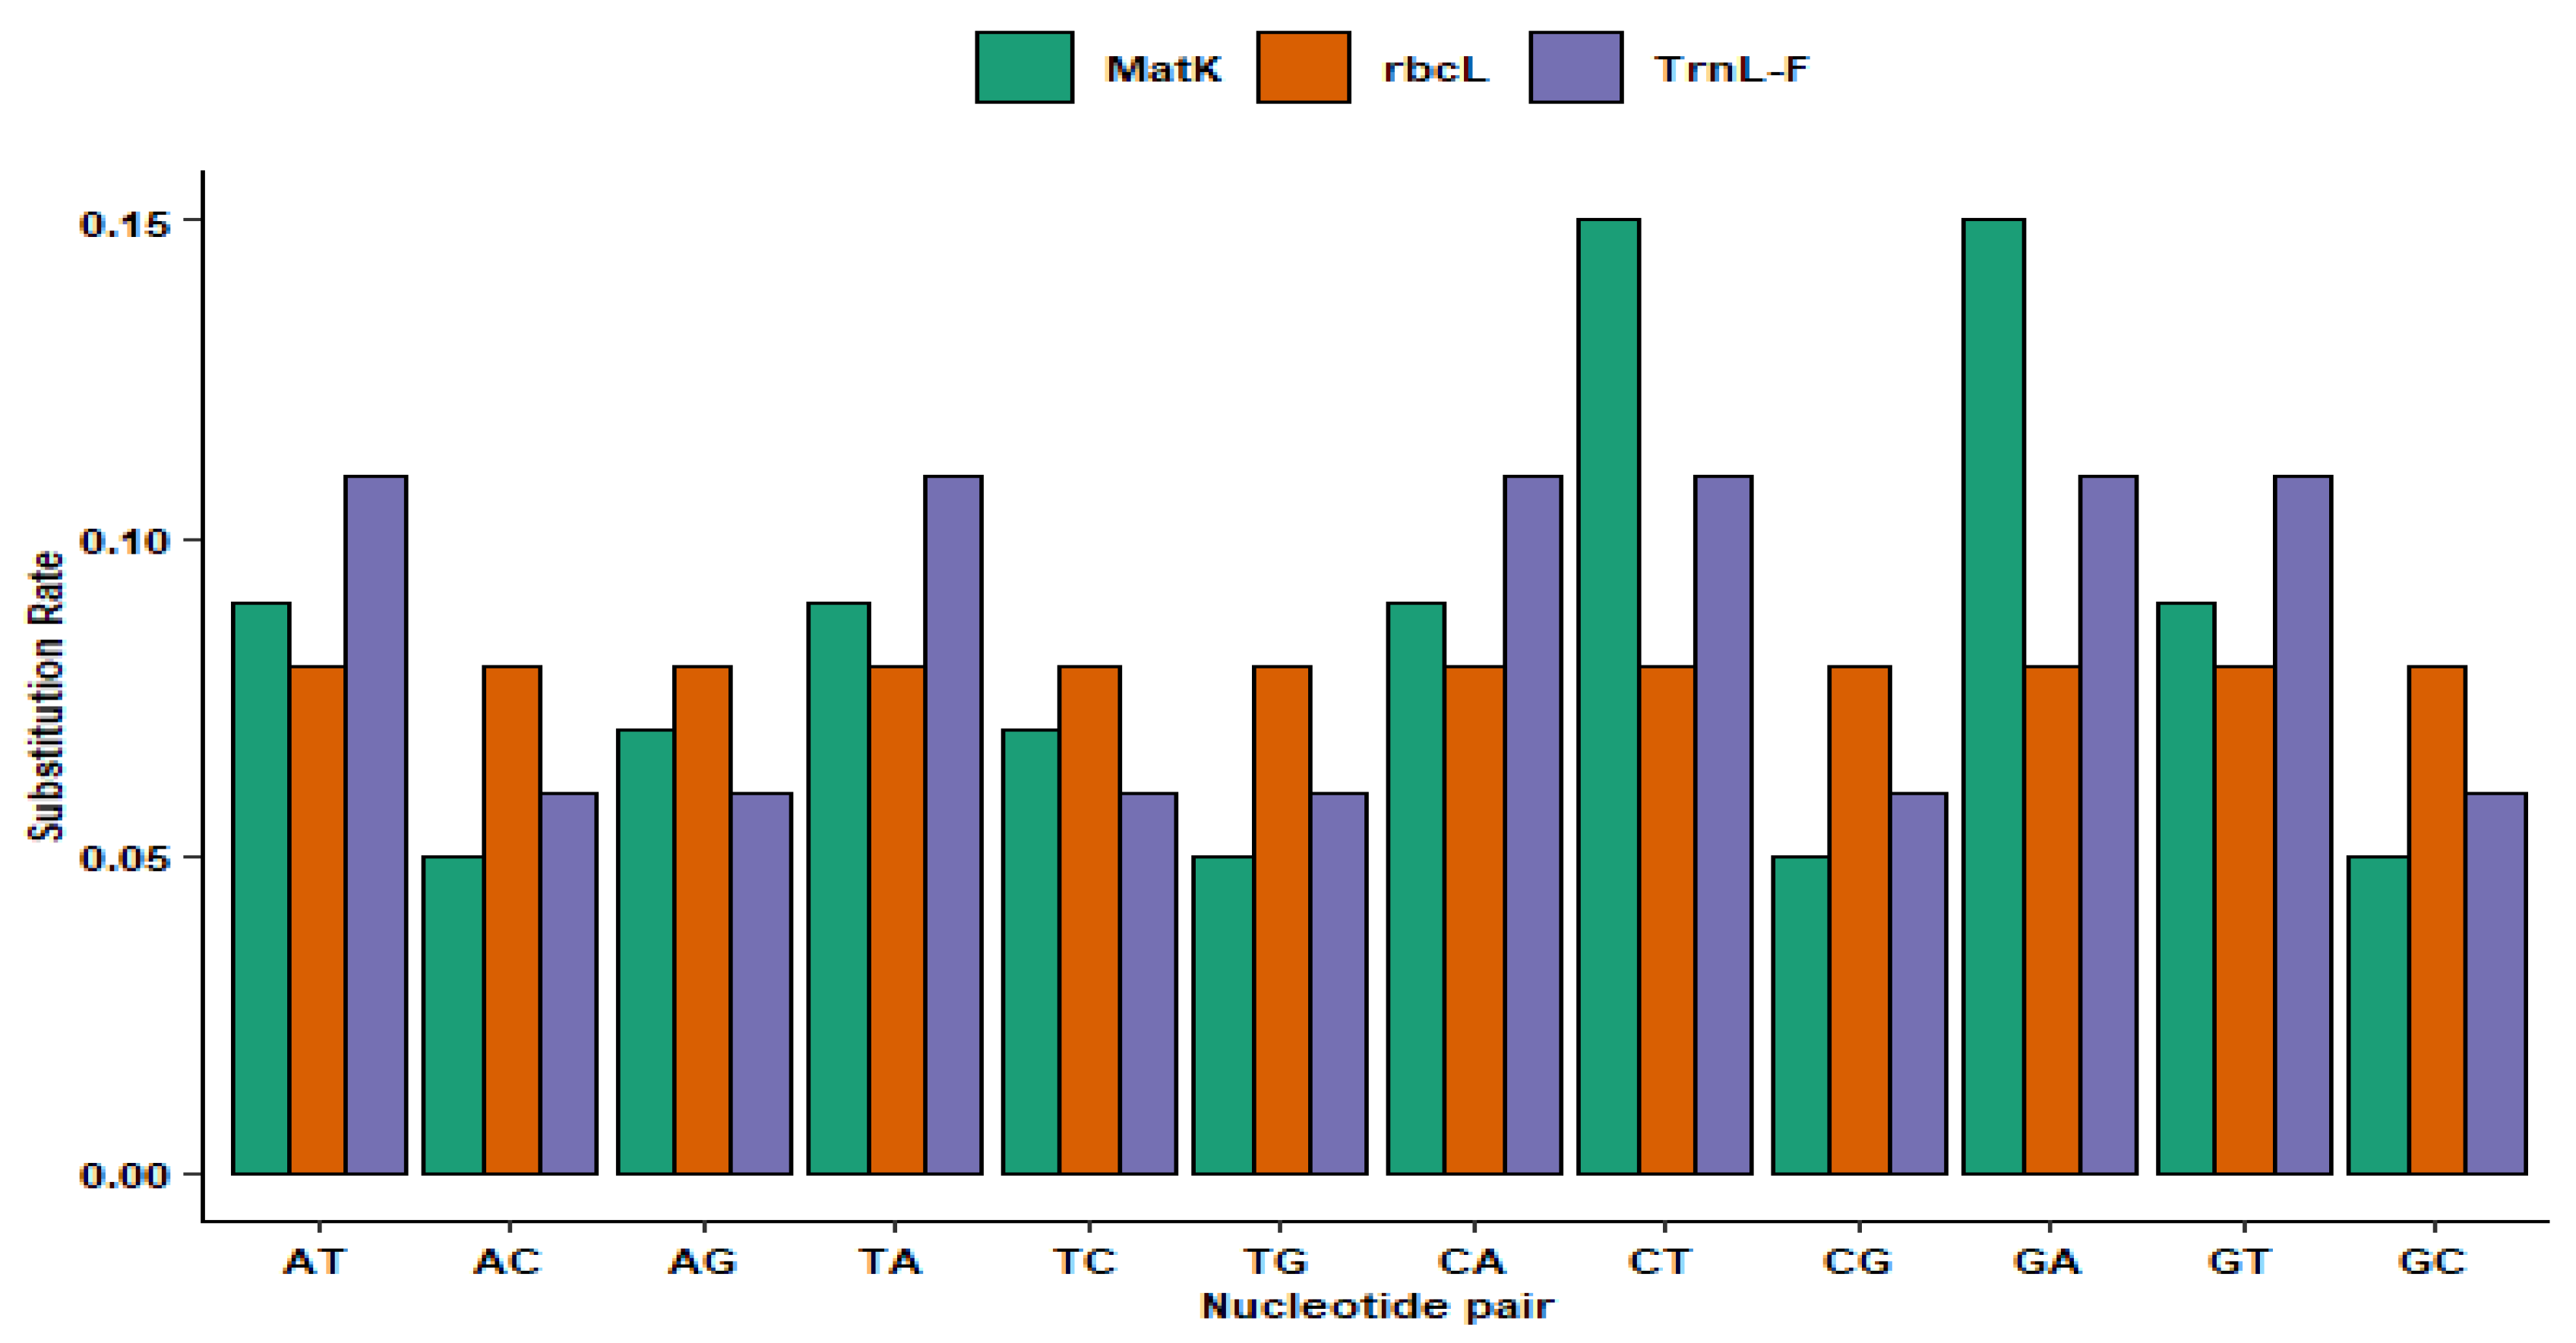
Evolutionary statistics were performed in MEGA 11 to find the best model for evolutionary distances and phylogeny based on the three genes under study. Models with the lowest Bayesian Information Criterion (BIC) scores are considered the best in describing nucleotide substitution pattern in the course of evolution according to Tamura et al. [30]. From the analyses, the best nucleotide evolutionary model for analysis of MatK sequences was Tamura 3 parameter [38] with the lowest BIC value of 3062.8906. For analysis of rbcL sequences, the best model with the lowest BIC score of 2703.96 was the Jukes-Cantor model [37], while for the TrnL-F, the model for phylogeny analysis and construction of trees with the lowest BIC score of 1749.10 selected was Tamura 3 parameter model. According to the Tamura 3 parameter model and taking into account the MatK sequences, the frequency of each nucleotide of adenine (A), cytosine (C), guanine (G), and thymine (T), was 0.33, 0.33, 0.16, and 0.16, respectively and the rate of nucleotide substitution in the MatK sequences ranged from 0.05 (CG) to 0.15 (CT and GA). While according to Jukes-Cantor model, frequency of nucleotides in the rbcL sequences was the same for four nucleotides with a value of 0.25 and the nucleotide substitution rate of 0.08 for all transversions and transitions. Based on Tamura 3 parameter model the frequency of adenine (A), cytosine (C), guanine (G), and thymine (T) in the TrnL-F sequences was 0.32, 0.32, 0.17, and 0.17, respectively and the substitution rate changed from 0.06 to 0.11 (Figure 2).
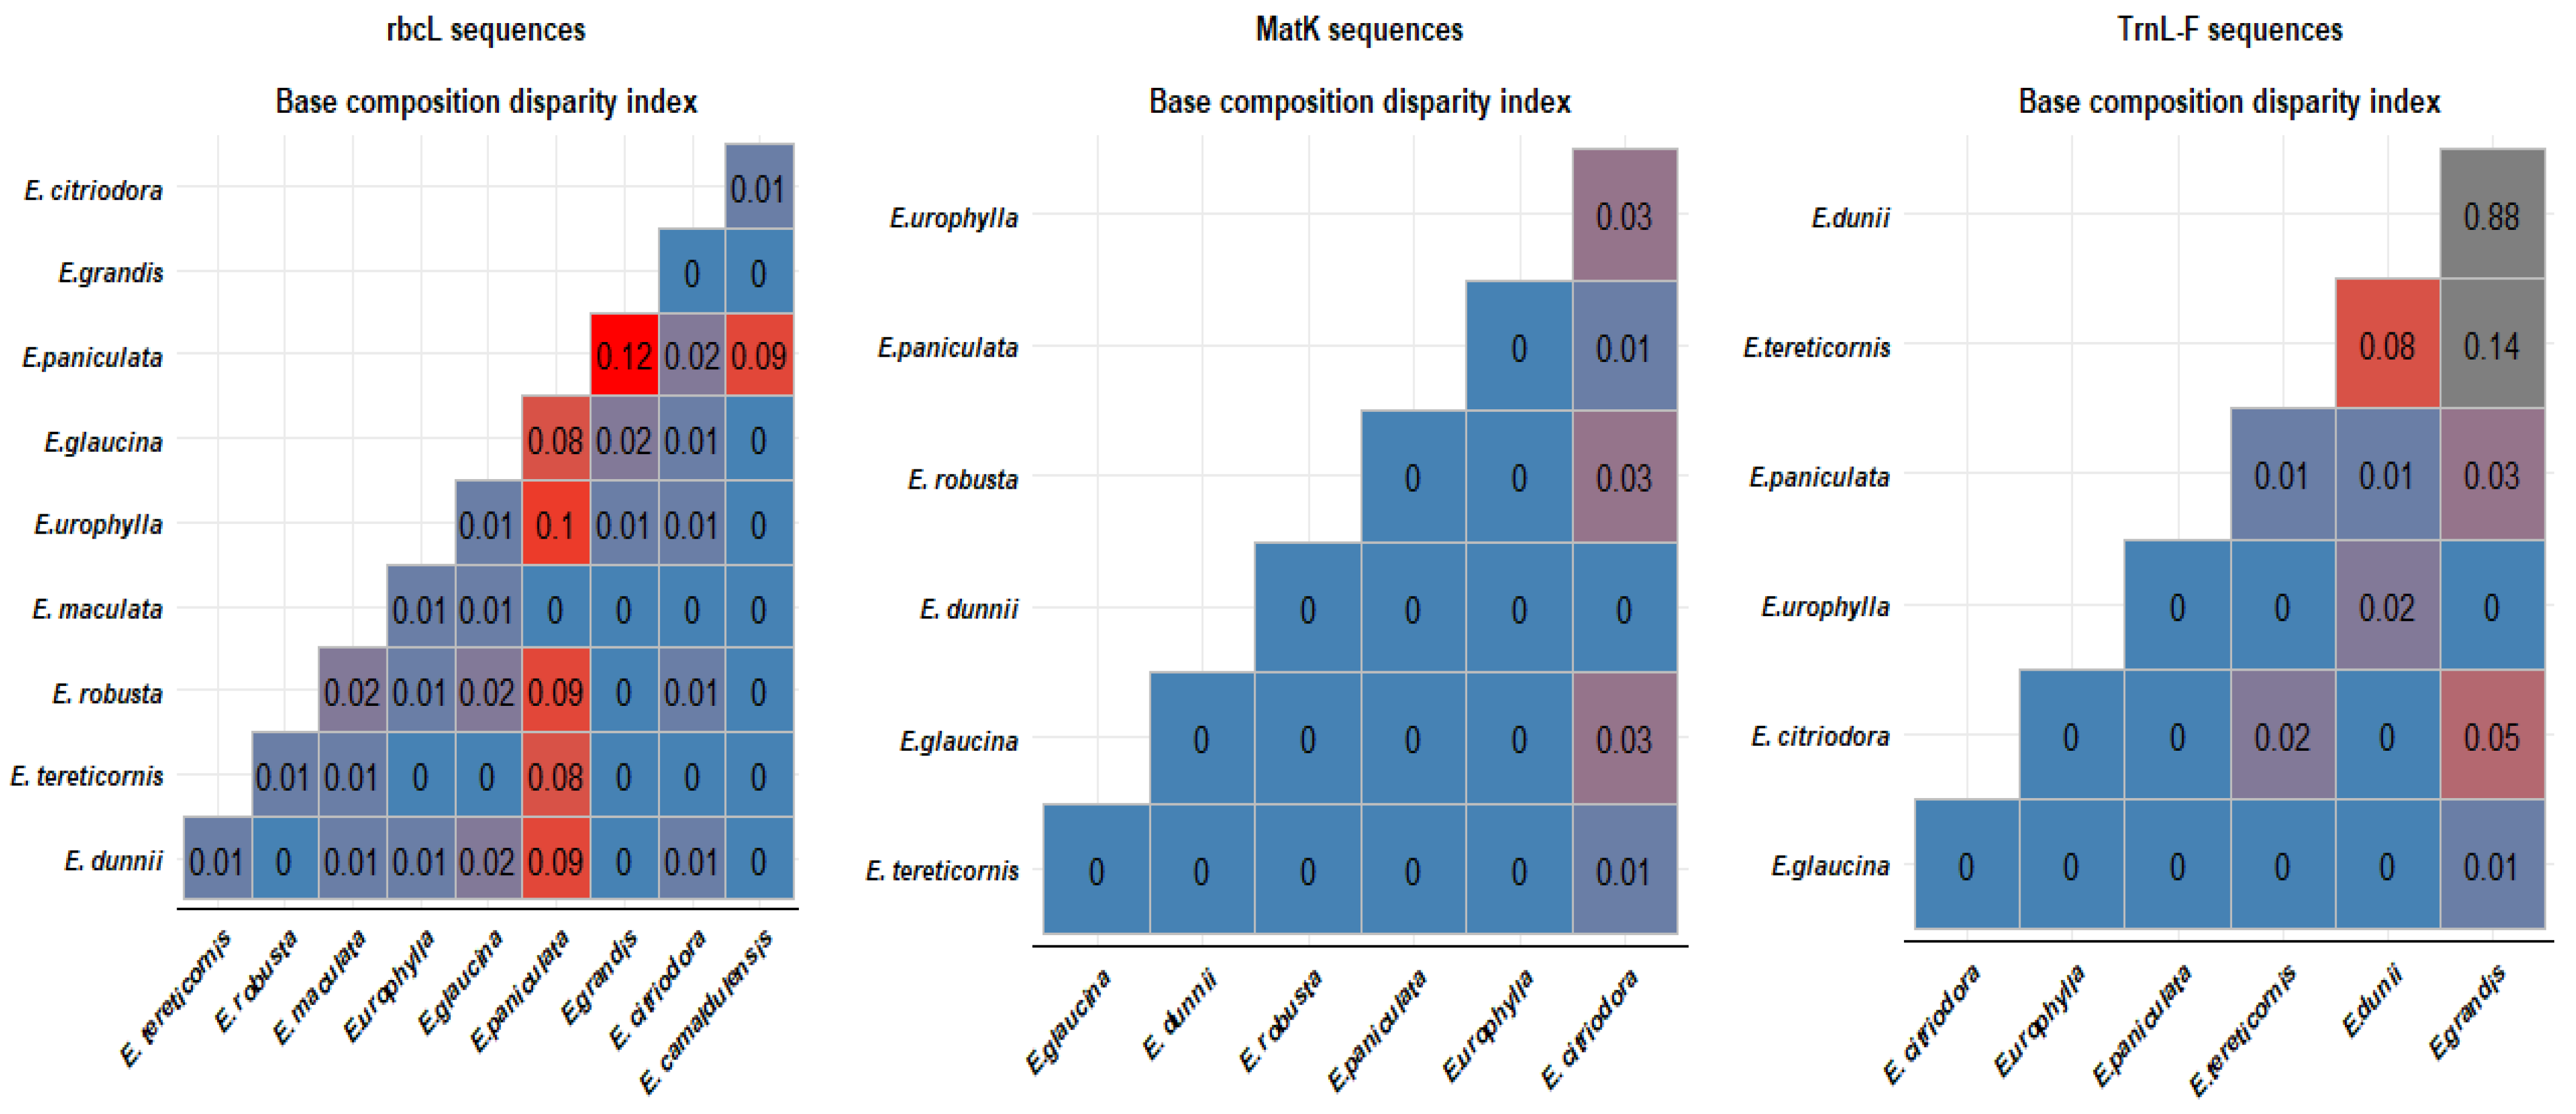
The base pattern disparity index, which measures the evenness of substitution patterns between sequences, was also determined. Figure 3, shows the values of the base composition bias disparity per site between sequence pairs in the species studied. Values greater than zero indicate larger differences in base composition biases than expected when evolutionary distances are measured between the sequence pairs [39]. Hence lower nucleotide disparity index is positively correlated to close relatedness. Based on the rbcL sequences, the highest value was observed between E. paniculata and E. grandis which suggested larger differences between them. Generally, E. paniculata, when compared to the other species, showed higher disparity scores. The base composition disparity index for the MatK sequences was higher between E. citriodora and E. glaucina, E. robusta, and E. urophylla, suggesting larger genetic differences between E. citriodora and the other three species. Based on the TrnL-F sequences, high disparity indices were observed between E. grandis and E. tereticornis (0.14) and also between E. grandis and E. dunnii (0.88).
Based on the rbcL sequences, transition/transversion rate ratios were; k1 = 1.806 for purines and k2 =1.36 for pyrimidines and the overall transition/transversion bias R was 0.777. Results from the selection test of the rbcL sequences based on Tajima’s neutrality test reported that the number of segregation sites was 78, with low nucleotide diversity of 0.029. With regard to MatK sequences, transition/transversion rate ratios were: k1 = 0.861 for purines and k2 = 1.51 for pyrimidines, and the overall transition/transversion bias R was 0.562, and the results of the selection test based on Tajima’s neutrality test reported that the number of segregation sites was 46 with low nucleotide diversity of 0.022. For the TrnL-F genes, the transition/transversion rate ratios were: k1 = 2.732 for purines and k2 = 1.334 for pyrimidines, and the overall transition/transversion bias R was 0.96 while Tajima’s neutrality test reported that the number of segregation sites was 84 with low nucleotide diversity of 0.0256.
Determination of evolutionary divergence is essential in molecular evolution studies and phylogenetic reconstructions, where it helps in the estimation of coalescence and divergence times [40]. The best way to measure the distance between a pair of sequences is to determine the number of nucleotide substitutions occurring between them. Figure 4 shows an evolutionary divergence between Eucalyptus species based on the three genes. Just like in base composition disparity indices, higher divergence suggests larger differences between sequences. Determination of evolutionary distances was conducted using the Maximum Likelihood method [30], and the number of base substitutions per site between sequence pairs showed reliable variations between the Eucalyptus species under study, with more substitutions per site implying a larger evolutionary distance.
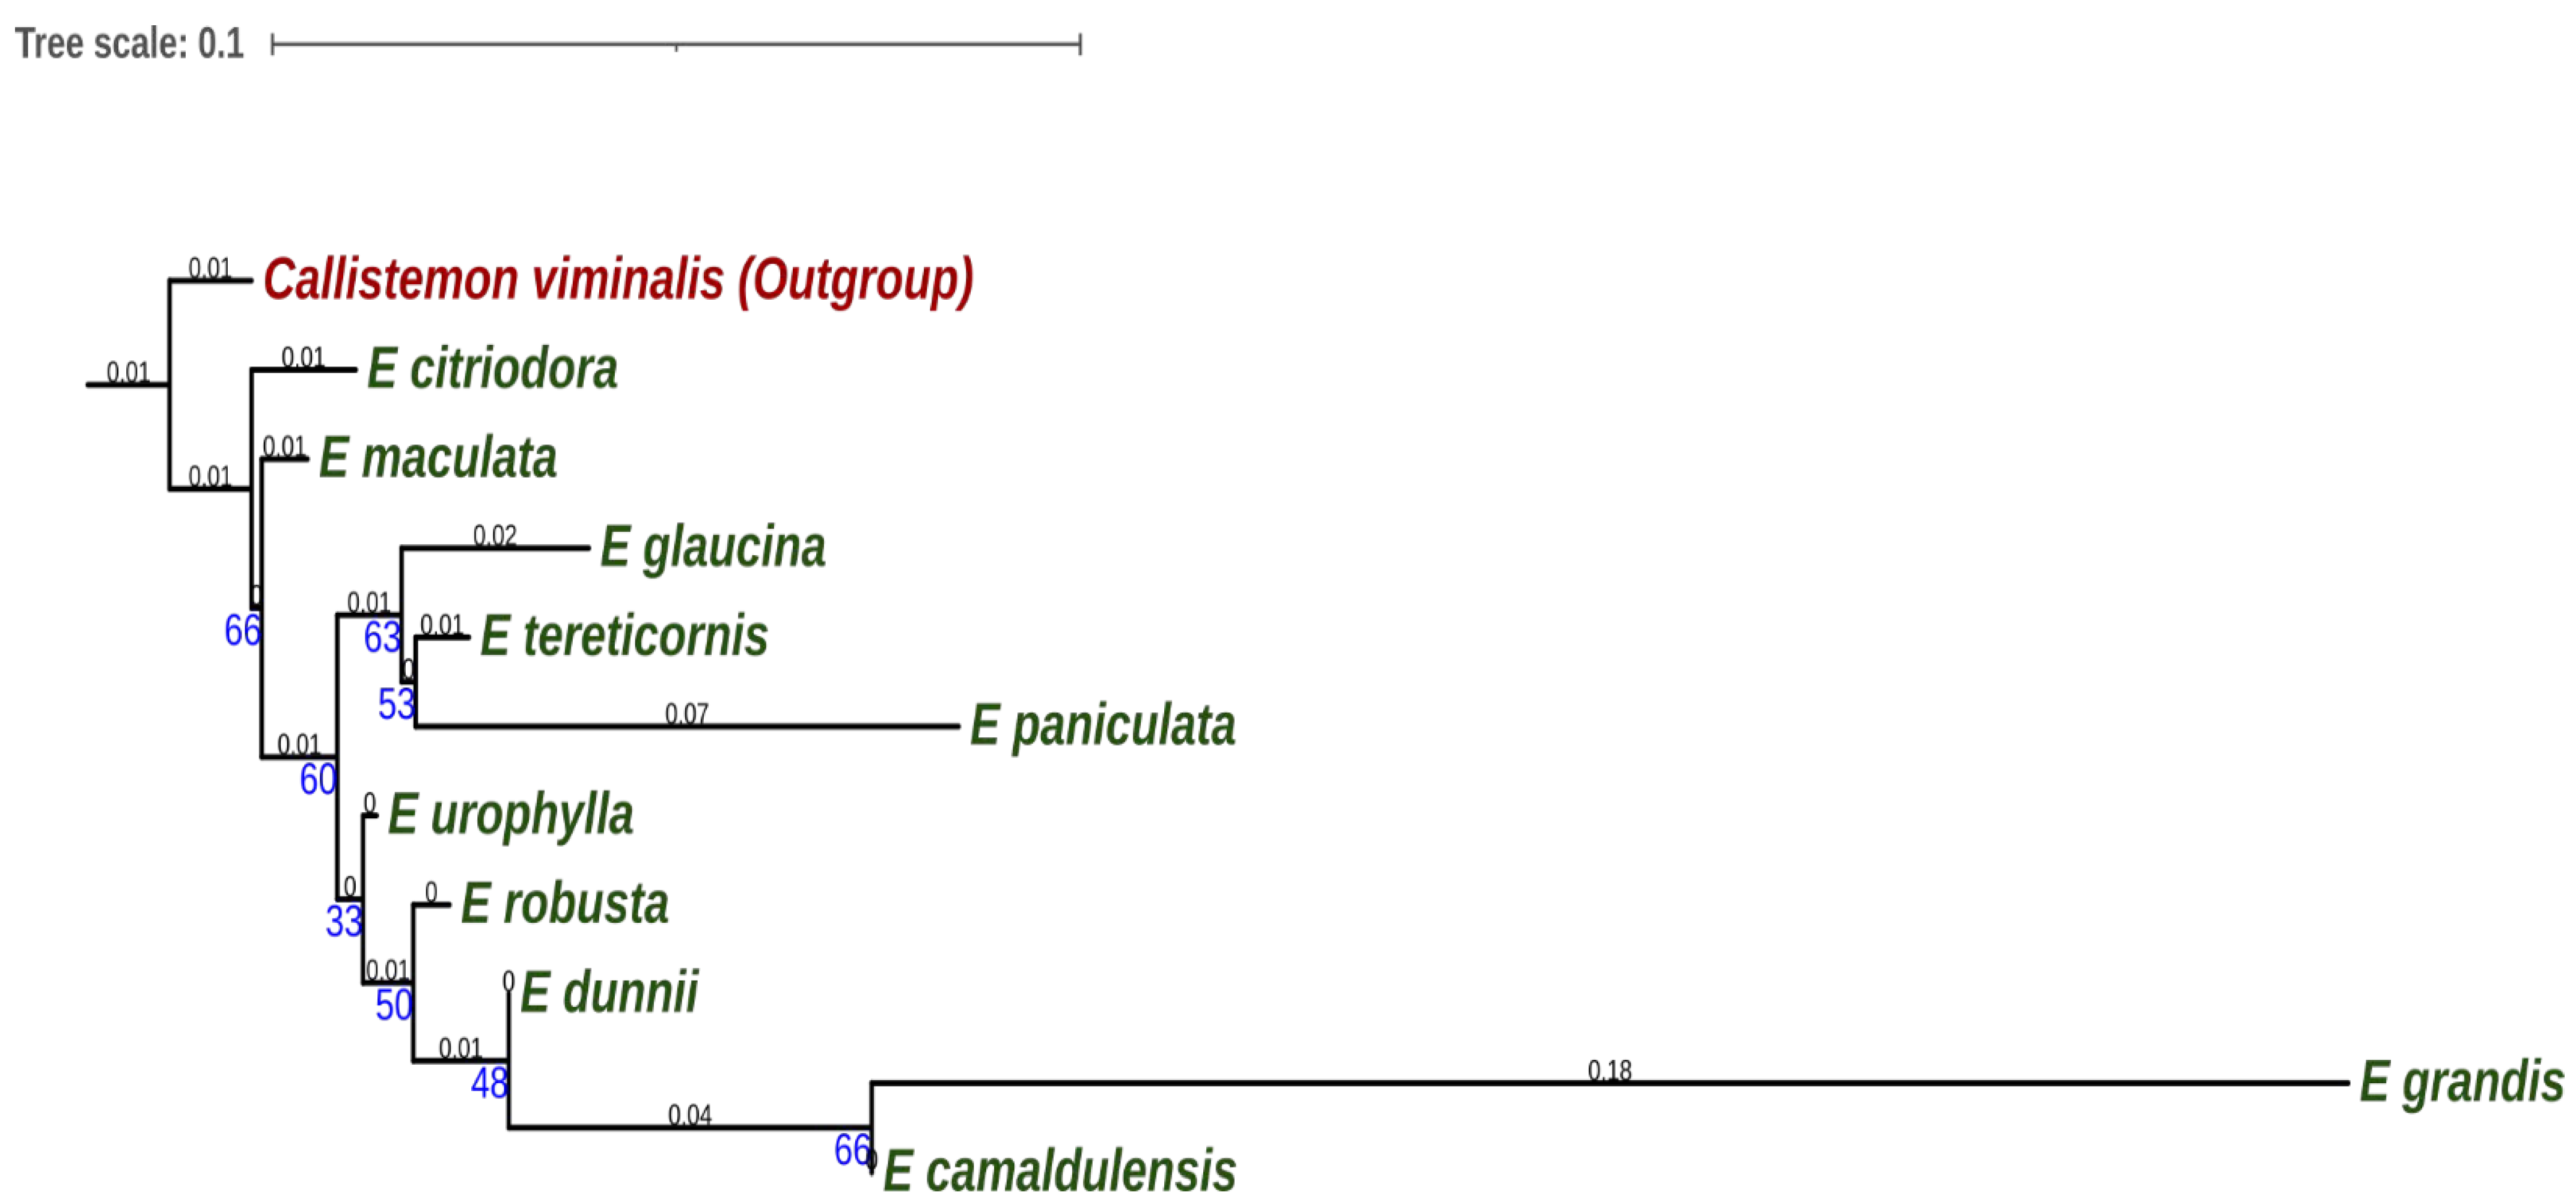
In the rbcL sequences, the longest genetic distance was between E. paniculata and other Eucalyptus species ranging from 0.12 to 0.13. This suggested that E. paniculata was distantly related to the other species, which had shorter divergence between any two of them, implying close genetic relations. On the other hand, a comparison between most species depicted lower divergence based on the MatK sequences ranging from 0.00 to 0.03, suggesting a close relationship. For the TrnL-F sequences, the largest genetic distance of 0.26 was seen in the comparison of E. dunnii and E. grandis implying that these two species may not be closely related. Phylogenetic tree constructed based on concatenated alignments from the three genes is shown in Figure 5, Partitioning of the concatenated dataset was done in PartitionFinder2 [41] to select the best-fit partitioning strategy and model for the concatenated sequences. The tree was rooted by including Callistemon viminalis to show the hypothetical last common ancestor of the Eucalyptus species under study. Calilistemon is a genus within the Myrtaceae family just like Eucalyptus genus.
Initial trees for the ML heuristic search were attained through the application of Neighbor-Join and BioNeighbor-Join algorithms to pairwise distances matrix generated from all the sequences from the three genes based on the two selected models of evolution. The final tree selected was the tree topology with a superior log likelihood value. Bootstrap resampling was selected as a test of phylogeny, and it measured the reliability of the tree generated [17]. Species close to each other based on the tree suggest a close genetic relationship, and those emanating from the same node show that they form a monophyletic clade. Bootstrap values at the node indicate how well the tree topology/monophyletic clade is supported and reliable. Bootstrap values of over 70 imply strong support, while values of around 50 indicate that the tree topology/monophyletic clade is moderately supported, and those below 50 indicate that the tree topology/monophyletic clade is poorly supported [17].

4. Discussion

4.1. Phenotypic Traits of Eucalyptus Species

Two phenotypic traits were analyzed among ten different species of Eucalyptus for suitability for use as power transmission poles. The traits analyzed were diameter at breast height and total tree height. The assessment was performed on mature Eucalyptus trees aged between 8 and 12 years that could easily be measured, as suggested by Marco de Lima et al. [12]. The requirements for a tree species to be used as a power transmission pole are reasonable strength, DBH ranging from 18–28 cm and a total height ranging 30–55 m, straightness, ability to withstand splitting and twisting and should be amenable to treatment by use of preservatives [42]. From the phenotypic results, E. robusta, E. paniculata, E. maculata, E. dunnii, E. camaldulensis and E. citriodora might be used as power transmission poles because they have the preferred DBH but they are limited in height. Among the species listed above, only E. tereticornis and E. galucina had both the desired DBH and height and hence can be used as substitutes for E. grandis for transmission poles and reduce importation of transmission poles. To combat pole shortage, one should compromise the ecological effects on the environment since species that mature fast need more water [7]. In Europe and USA, the use of wooden poles for power transmission is common, and for a long time, they have given satisfactory services, as steel poles are used only to carry lines of high tension in urban areas [42]. Other Eucalyptus species, such as E. saligna, are weak but have been used extensively for all kinds of poles because of their straightness and ability to absorb preservatives readily [43]. E. resinifera and E. globulus can also be used to some extent, but they are not readily available. E. paniculata, on the other hand, is one of the strongest pole timbers, but it cannot be used as a pole since it does not absorb preservatives easily; hence, its poles may not be durable [7].

4.2. Phylogeny of Eucalyptus Species

Genetic variation is important for the survival of the plant population since it leads to adaptation and evolution [44,45]. Genetic drift, migration, and a combination of mutations lead to genetic variation among the population [46]. Studying genetic diversity among plant species is important for conservation and breeding programs [47]. In this study, a total of ten species were analyzed in which three genes: MatK, rbcL and TrnL-F were amplified and sequenced and aligned. A species tree was constructed based on concatenated data from the three genes as shown in Figure 5. From the species tree, E. grandis is closely related to E. camaldulensis and the relationship between the two is supported by a moderate bootstrap support value of 66. In addition, E. robusta, E. dunnii, E. camaldulensis and E. grandis form a monophyletic clade which supported by a moderate bootstrap value of 50. The close relationship between E. robusta, and E. dunnii seen is also supported by De Araújo et al [48]. E. glaucina has also been shown to be closely related to E. paniculata and E. tereticornis and the monophyletic clade is supported by a moderate bootstrap support value of 63. Based on the concatenated tree, nine species which include E. maculata, E.glaucina, E. tereticornis, E. paniculata, E. urophylla, E. robusta, E. dunnii, E. grandis and E. camaldulensis have been shown to be closely related and form a monophyletic clade which is supported by a moderate boot strap support value of 66. Only E. citriodora is distantly related from the other species. The close relationship between some of the species such as E. citriodora and E. maculata seen also agrees with the results reported by De Araújo et al. [48] who grouped the two species together. Most of the branches are supported by moderate bootstrap values, this is because in a concatenated tree, the genes used could have conflicting phylogenetic signals causing poor consistency hence moderate to poor bootstrap support values. In most cases, species tree may not show exactly how species split apart due to incomplete lineage sorting, introgression between species, gene duplication, subsequent gene losses, and mis-assignment of paralogs as orthologs which may lead to phylogenetic incongruence; where phylogenies from individual genes differ from species phylogenies [49]. In Figure 5, the monophyletic clade which includes nine of the ten studied Eucalyptus species has a moderate bootstrap support value of 66 indicating a close phylogenetic relationship among the study Eucalyptus species. Indeed, by rooting the three trees through inclusion of a distantly related species such as C. viminalis, it was possible to show the hypothetical last common ancestor of all the Eucalyptus species under study. The close relationship observed can be attributed to low nucleotide substitution rates, low base disparity indices and shorter genetic distances among the species.
The findings from the study have been supported by findings from earlier morphological, molecular, and biochemical studies, which have reported that Eucalyptus species are closely related [48,50,51]. This close relationship of Eucalyptus species supports the use of E. tereticornis and E.glaucina as a substitute for E. grandis in the provision of transmission poles since they have the desired DBH and height. Eucalyptus species occurring in different geographical areas have different mutation rates [52], and this could explain why there are some differences in morphological and genetic diversity among the ten Eucalyptus populations. Genetic diversity within a population can also be caused by drought, diseases, and rain patterns [53]. However, according to Dawson et al., genetic diversity is impacted directly by the difference in flowering times within and among the populations [54]. Extensive gene flow causes low genetic differentiation among the population [55]. This could explain why there is low genetic variation among the ten Eucalyptus species studied due to alleles that are shared among the Eucalyptus species [56]. Hence comparison between the species showed low substitution rates, low base disparity index, low genetic distances, and low diversity scores, and the resulting phylogeny suggested that most species were closely related implying close relatedness of the species under study. This explains why most of the Eucalyptus species grown in Kenya are considered useful for poles, although only a few are highly used, particularly due to fast growth, strength and treatability.

5. Conclusions and Recommendations

Based on the phenotypic traits, E. robusta, E. paniculata, E. maculata, E. dunnii, E. camaldulensis and E. citriodora can be used as power transmission poles but they are limited due to their short height. However, E. tereticornis and E. glaucina have the desired DBH and height and hence can be used as substitutes for E.grandis. Generally, the molecular phylogeny study, has shown that the studied Eucalyptus species are closely related and form various monophyletic clades which can be attributed to the short genetic distances, low nucleotide substitution rates, low nucleotide bias disparity indices and low diversity scores. Since the current study worked on only ten Eucalyptus species, further research involving more Eucalyptus species is needed to better understand Eucalyptus phylogenetic relationships and diversity. Roughly, over a hundred Eucalypts have been identified in East Africa, comprising indigenous species, exotic ones, clones and hybrids [57]. Some of these species have specific growth requirements and will only grow in specific ecological zones. Investigations on molecular phylogeny and related studies of all the species can help researchers in dealing with Eucalyptus systematics pitfalls and identify species with similar genetic make-up to that of E. grandis, which has been used extensively for the provision of electricity transmission poles. Such studies will not only involve the use of MatK, Rbcl, and TrnL-F genes but can also involve the use of other molecular markers such as ndh-F, atpB, trnT–trnL, and atpB-Rbcl and employing methods that have been used to successfully study phylogenetics and gene expression in angiosperms. A comparison of phylogenetic trees based on two or three gene sequences can prove valuable in molecular phylogeny and diversity of Eucalyptus species.

Author Contributions

The following authors contributed to this study: conceptualization, D.C., F.M.M., S.N.K., G.M.M.; methodology, D.C., F.M.M., S.N.K., G.M.M. and M.M.K.; data analysis, D.C. and F.M.M.; writing-original draft preparation, D.C. and F.M.M.; writing—review and editing, S.N.K., G.M.M. and M.M.K. All authors have read and agreed to the published version of the manuscript.

Funding

This research was funded by National Research Fund (NRF) through KEFRI, Multidisciplinary Research Grant 2016/2017.

Institutional Review Board Statement

Not applicable.

Data Availability Statement

The data presented in this study are available on request from the corresponding author. In addition, DNA sequences from the three genes have been deposited in NCBI GenBank and accession numbers have been provided in Table 2 within this article.

Acknowledgments

The authors gratefully acknowledge Kenya Forestry Research Institute, Technical University of Kenya and University of Embu for provision of administrative and technical support for successful completion of the above study.

Conflicts of Interest

The authors confirm that they are no known conflicts of interest associated with this publication.

References

  1. Kluthe, B.G. Eucalyptus in Kenya; Impacts on Environment and Society; University of Arkansas: Fayetteville, AR, USA, 2016. [Google Scholar]
  2. Birhanu, S.; Kumsa, F. Review on expansion of Eucalyptus, its economic value and related environmental issues in Ethiopia. Int. J. Res. Environ. Sci. 2018, 4, 41–46. [Google Scholar]
  3. Brooker, M.I.H. A new classification of the genus Eucalyptus L’Her. (Myrtaceae). Aust. Syst. Bot. 2000, 13, 79–148. [Google Scholar] [CrossRef]
  4. Langat, D.; Muchiri, M.N. Power Transmission Poles and Firewood in Kenya Financial Analysis of GROWING Eucalyptus grandis for Production of Medium Size Power Transmission Poles and Firewood in Kenya. 2015. Available online: https://www.researchgate.net/publication/328567812_Financial_analysis_of_growing_Eucalyptus_grandis_for_production_of_medium_size_power_transmission_poles_and_firewood_in_Kenya (accessed on 5 April 2022).
  5. Oballa, P.O.; Muchiri, M.N.; Kigomo, B.N. Facts on Growing and Use of Eucalyptus; Kenya Forestry Research Institute: Nairobi, Kenya, 2010. [Google Scholar]
  6. Girijashankar, V. Genetic transformation of Eucalyptus. Physiol. Mol. Biol. Plants 2011, 17, 9–23. [Google Scholar] [CrossRef] [PubMed] [Green Version]
  7. Sivananthawerl, T.; Mitlöhner, R. Eucalyptus grandis and other important Eucalyptus species: A case study from Sri Lanka. In Silviculture in the Tropics; Springer: Berlin/Heidelberg, Germany, 2011; pp. 463–472. [Google Scholar]
  8. Luna, R.K. Eucalypts in agroforestry. In Eucalypts in India; ENVIS Centre on Forestry: Dehradun, India, 2009; p. 209. [Google Scholar]
  9. Turnbull, J.W.; Booth, T.H. Eucalypts in cultivation: An overview. In Eucalyptus Genus Eucalyptus; Taylor & Francis: London, UK, 2002; pp. 52–74. [Google Scholar]
  10. Muthike, G.; Ali, G. Concrete vs. Wooden Poles: Effects of the Shift to Concrete Poles on Tree Growers; Kenya Forestry Research Institute: Nairobi, Kenya, 2021. [Google Scholar]
  11. Thumma, B.R.; Nolan, M.F.; Evans, R.; Moran, G.F. Polymorphisms in cinnamoyl CoA reductase (CCR) are associated with variation in microfibril angle in Eucalyptus spp. Genetics 2005, 171, 1257–1265. [Google Scholar] [CrossRef] [PubMed] [Green Version]
  12. Marco de Lima, B.; Cappa, E.P.; Silva-Junior, O.B.; Garcia, C.; Mansfield, S.D.; Grattapaglia, D. Quantitative genetic parameters for growth and wood properties in Eucalyptus “urograndis” hybrid using near-infrared phenotyping and genome-wide SNP-based relationships. PLoS ONE 2019, 14, e0218747. [Google Scholar] [CrossRef] [PubMed] [Green Version]
  13. Alper, K.; Tekin, K.; Karagöz, S.; Ragauskas, A.J. Sustainable energy and fuels from biomass: A review focusing on hydrothermal biomass processing. Sustain. Energy Fuels 2020, 4, 4390–4414. [Google Scholar] [CrossRef]
  14. Sandak, J.; Sandak, A.; Meder, R. Assessing trees, wood and derived products with near infrared spectroscopy: Hints and tips. J. Near Infrared Spectrosc. 2016, 24, 485–505. [Google Scholar] [CrossRef] [Green Version]
  15. Schimleck, L.R.; Raymond, C.A.; Beadle, C.L.; Downes, G.M.; Kube, P.D.; French, J. Applications of NIR spectroscopy to forest research. Appita J. 2000, 53, 458–464. [Google Scholar]
  16. Hamilton, M.G.; Raymond, C.A.; Harwood, C.E.; Potts, B.M. Genetic variation in Eucalyptus nitens pulpwood and wood shrinkage traits. Tree Genet. Genomes 2009, 5, 307–316. [Google Scholar] [CrossRef]
  17. Musila, F.M.; Lukhoba, C.W.; Nguta, J.M.; Dossaji, S.F. Phylogeny of Ten Kenyan Plectranthus Species in the Coleus Clade Inferred from Leaf Micromorphology, Rbcl and MatK Genes. J. Bot. 2017, 2017, 4369029. [Google Scholar] [CrossRef] [Green Version]
  18. Cheboiwo, J.K. Modelling Future Production. Processing and Trade in Transmission Poles in Kenya and East Africa; Kenya Forestry Research Institute: Nairobi, Kenya, 2014. [Google Scholar]
  19. Cheboiwo, J.K. Unexploited possibilities: The Status of Forest Resources and Trade Opportunities in Wood Products in East and Central Africa; Kenya Forestry Research Institute: Nairobi, Kenya, 2009. [Google Scholar]
  20. Kagombe, J.K.; Kiprop, J.; Langat, D.; Cheboiwo, J.K.; Wekesa, L.; Ongugo, P.O.; Mbuvi, M.T.; Leley, N. Socio-Economic Impact of Forest Harvesting Moratorium in Kenya; KEFRI: Nairobi, Kenya, 2020. [Google Scholar]
  21. Muthike, G.M.; Githiomi, J. Review of the Wood Industry in Kenya; Technology Development, Challenges and Opportunities. Int. J. Res. Stud. Agric. Sci. 2017, 8, 44–52. [Google Scholar]
  22. Cheboiwo, J.K. The Status of the Poles Sector; Production, Processing and Trade in Transmission Posts in East Africa; Kenya Forestry Research Institute: Nairobi, Kenya, 2014. [Google Scholar]
  23. Steane, D.A. Complete nucleotide sequence of the chloroplast genome from the Tasmanian blue gum, Eucalyptus globulus (Myrtaceae). DNA Res. 2005, 12, 215–220. [Google Scholar] [CrossRef] [Green Version]
  24. Barthet, M.M.; Hilu, K.W.; Barthet, M.M.; Hilu, K.W. Expression of matK: Functional and Evolutionary Implications Linked references are available on JSTOR for this article: Expression of matK: Functional and evolutionary implications. Am. J. Bot. 2019, 94, 1402–1412. [Google Scholar] [CrossRef]
  25. Suzuki, Y.; Makino, A. Availability of Rubisco small subunit up-regulates the transcript levels of large subunit for stoichiometric assembly of its holoenzyme in rice. Plant Physiol. 2012, 160, 533–540. [Google Scholar] [CrossRef] [Green Version]
  26. Payn, K.G.; Dvorak, W.S.; Janse, B.J.H.; Myburg, A.A. Microsatellite diversity and genetic structure of the commercially important tropical tree species Eucalyptus urophylla, endemic to seven islands in eastern Indonesia. Tree Genet. Genomes 2008, 4, 519–530. [Google Scholar] [CrossRef]
  27. McCallum, M.L. Vertebrate biodiversity losses point to a sixth mass extinction. Biodivers. Conserv. 2015, 24, 2497–2519. [Google Scholar] [CrossRef]
  28. Assis, T.; Warburton, P.; Harwood, C. Artificially induced protogyny: An advance in the controlled pollination of Eucalyptus. Aust. For. 2005, 68, 27–33. [Google Scholar] [CrossRef]
  29. Andersen, H.-E.; Reutebuch, S.E.; McGaughey, R.J. A rigorous assessment of tree height measurements obtained using airborne lidar and conventional field methods. Can. J. Remote Sens. 2006, 32, 355–366. [Google Scholar] [CrossRef]
  30. Tamura, K.; Stecher, G.; Kumar, S. MEGA11: Molecular evolutionary genetics analysis version 11. Mol. Biol. Evol. 2021, 38, 3022–3027. [Google Scholar] [CrossRef]
  31. Heckenhauer, J.; Barfuss, M.H.J.; Samuel, R. Universal multiplexable matK primers for DNA barcoding of angiosperms. Appl. Plant Sci. 2016, 4, 1500137. [Google Scholar] [CrossRef] [Green Version]
  32. Chiang, T.-Y.; Schaal, B.A.; Peng, C.-I. Universal primers for amplification and sequencing a noncoding spacer between the atpB and rbcL genes of chloroplast DNA. Bot. Bull. Acad. Sin. 1998, 39, 249–250. [Google Scholar]
  33. McCouch, S.R.; Teytelman, L.; Xu, Y.; Lobos, K.B.; Clare, K.; Walton, M.; Fu, B.; Maghirang, R.; Li, Z.; Xing, Y.; et al. Development and mapping of 2240 new SSR markers for rice (Oryza sativa L. ). DNA Res. 2002, 9, 199–207. [Google Scholar] [CrossRef]
  34. Kumar, S.; Nei, M.; Dudley, J.; Tamura, K. MEGA: A biologist-centric software for evolutionary analysis of DNA and protein sequences. Brief. Bioinform. 2008, 9, 299–306. [Google Scholar] [CrossRef] [Green Version]
  35. Edgar, R.C. MUSCLE: Multiple sequence alignment with high accuracy and high throughput. Nucleic Acids Res. 2004, 32, 1792–1797. [Google Scholar] [CrossRef] [Green Version]
  36. Michałek, M.; Ventura, E. Phylogenetic complexity of the Kimura 3-parameter model. Adv. Math. 2019, 343, 640–680. [Google Scholar] [CrossRef] [Green Version]
  37. Erickson, K. The jukes-cantor model of molecular evolution. Primus 2010, 20, 438–445. [Google Scholar] [CrossRef]
  38. Tamura, K. Model selection in the estimation of the number of nucleotide substitutions. Mol. Biol. Evol. 1994, 11, 154–157. [Google Scholar]
  39. Al-Atiyat, R.M.; Aljumaah, R.S. Genetic distances and phylogenetic trees of different Awassi sheep populations based on DNA sequencing. Genet. Mol. Res. 2014, 13, 6557–6568. [Google Scholar] [CrossRef]
  40. Page, R.D.M.; Holmes, E.C. Molecular Evolution: A Phylogenetic Approach; John Wiley & Sons: Hoboken, NJ, USA, 2009. [Google Scholar]
  41. Lanfear, R.; Frandsen, P.B.; Wright, A.M.; Senfeld, T.; Calcott, B. PartitionFinder 2: New methods for selecting partitioned models of evolution for molecular and morphological phylogenetic analyses. Mol. Biol. Evol. 2017, 34, 772–773. [Google Scholar] [CrossRef] [Green Version]
  42. Scott, M.H. The Use of Chemically Treated Wooden Poles for Telephone and Power Transmission Lines in South Africa Poles for Telephone and Power Transmission. J. S. Afr. For. Assoc. 1946, 13, 21–34. [Google Scholar]
  43. de Nogueira, M.C.; deAlmeida, D.H.; de Araujo, V.A.; Vasconcelos, J.S.; Christoforo, A.L.; de Almeida, T.H.; Lahr, F.A.R. Physical and mechanical properties of Eucalyptus saligna wood for timber structures. Ambiente Constr. 2019, 19, 233–239. [Google Scholar] [CrossRef]
  44. Wiehle, M.; Prinz, K.; Kehlenbeck, K.; Goenster, S.; Mohamed, S.A.; Finkeldey, R.; Buerkert, A.; Gebauer, J. The African baobab (Adansonia digitata, Malvaceae): Genetic resources in neglected populations of the Nuba Mountains, Sudan. Am. J. Bot. 2014, 101, 1498–1507. [Google Scholar] [CrossRef] [Green Version]
  45. Jump, A.S.; Marchant, R.; Peñuelas, J. Environmental change and the option value of genetic diversity. Trends Plant Sci. 2009, 14, 51–58. [Google Scholar] [CrossRef]
  46. Ellegren, H.; Galtier, N. Determinants of genetic diversity. Nat. Rev. Genet. 2016, 17, 422–433. [Google Scholar] [CrossRef] [Green Version]
  47. Sreekumar, V.B.; Renuka, C. Assessment of genetic diversity in Calamus thwaitesii BECC. (Arecaceae) using RAPD markers. Biochem. Syst. Ecol. 2006, 34, 397–405. [Google Scholar] [CrossRef]
  48. De Araújo, E.S.N.N.; Gimenes, M.A.; Lopes, C.R. Phylogenetic relationships among genera Eucalyptus and Corymbia species based on rnDNA internal transcribed spacers sequences. Sci. For. Sci. 2002, 62, 75–85. [Google Scholar]
  49. Bryant, D.; Hahn, M.W. The Concatenation Question. No Commercial Publisher| Authors Open Access Book; 2020. Available online: https://hahnlab.sitehost.iu.edu/Publications/BryantHahn2020.pdf (accessed on 5 April 2022).
  50. Udovicic, F.; McFadden, G.I.; Ladiges, P.Y. Phylogeny of Eucalyptus and Angophora based on 5S rDNA spacer sequence data. Mol. Phylogenet. Evol. 1995, 4, 247–256. [Google Scholar] [CrossRef]
  51. Rozefelds, A.C. Eucalyptus phylogeny and history: A brief summary. Tasforests Hobart. 1996, 8, 15–26. [Google Scholar]
  52. Butcher, P.A.; McDonald, M.W.; Bell, J.C. Congruence between environmental parameters, morphology and genetic structure in Australia’s most widely distributed eucalypt, Eucalyptus camaldulensis. Tree Genet. Genomes 2009, 5, 189–210. [Google Scholar] [CrossRef]
  53. Dutkowski, G.W.; Potts, B.M. Genetic variation in the susceptibility of Eucalyptus globulus to drought damage. Tree Genet. Genomes 2012, 8, 757–773. [Google Scholar] [CrossRef]
  54. Dawson, J.C.; Goldringer, I. Breeding for genetically diverse populations: Variety mixtures and evolutionary populations. In Organic Crop Breeding; Wiley: Hoboken, NJ, USA, 2012; pp. 77–98. [Google Scholar]
  55. Acosta-Gallegos, J.A.; Kelly, J.D.; Gepts, P. Prebreeding in common bean and use of genetic diversity from wild germplasm. Crop Sci. 2007, 47, S-44. [Google Scholar] [CrossRef] [Green Version]
  56. Munthali, C.R.Y.; Chirwa, P.W.; Changadeya, W.J.; Akinnifesi, F.K. Genetic differentiation and diversity of Adansonia digitata L. (baobab) in Malawi using microsatellite markers. Agrofor. Syst. 2013, 87, 117–130. [Google Scholar] [CrossRef] [Green Version]
  57. Nakabonge, G.; Roux, J.; Gryzenhout, M.; Wingfield, M.J. Distribution of Chrysoporthe canker pathogens on Eucalyptus and Syzygium spp. in eastern and southern Africa. Plant Dis. 2006, 90, 734–740. [Google Scholar]
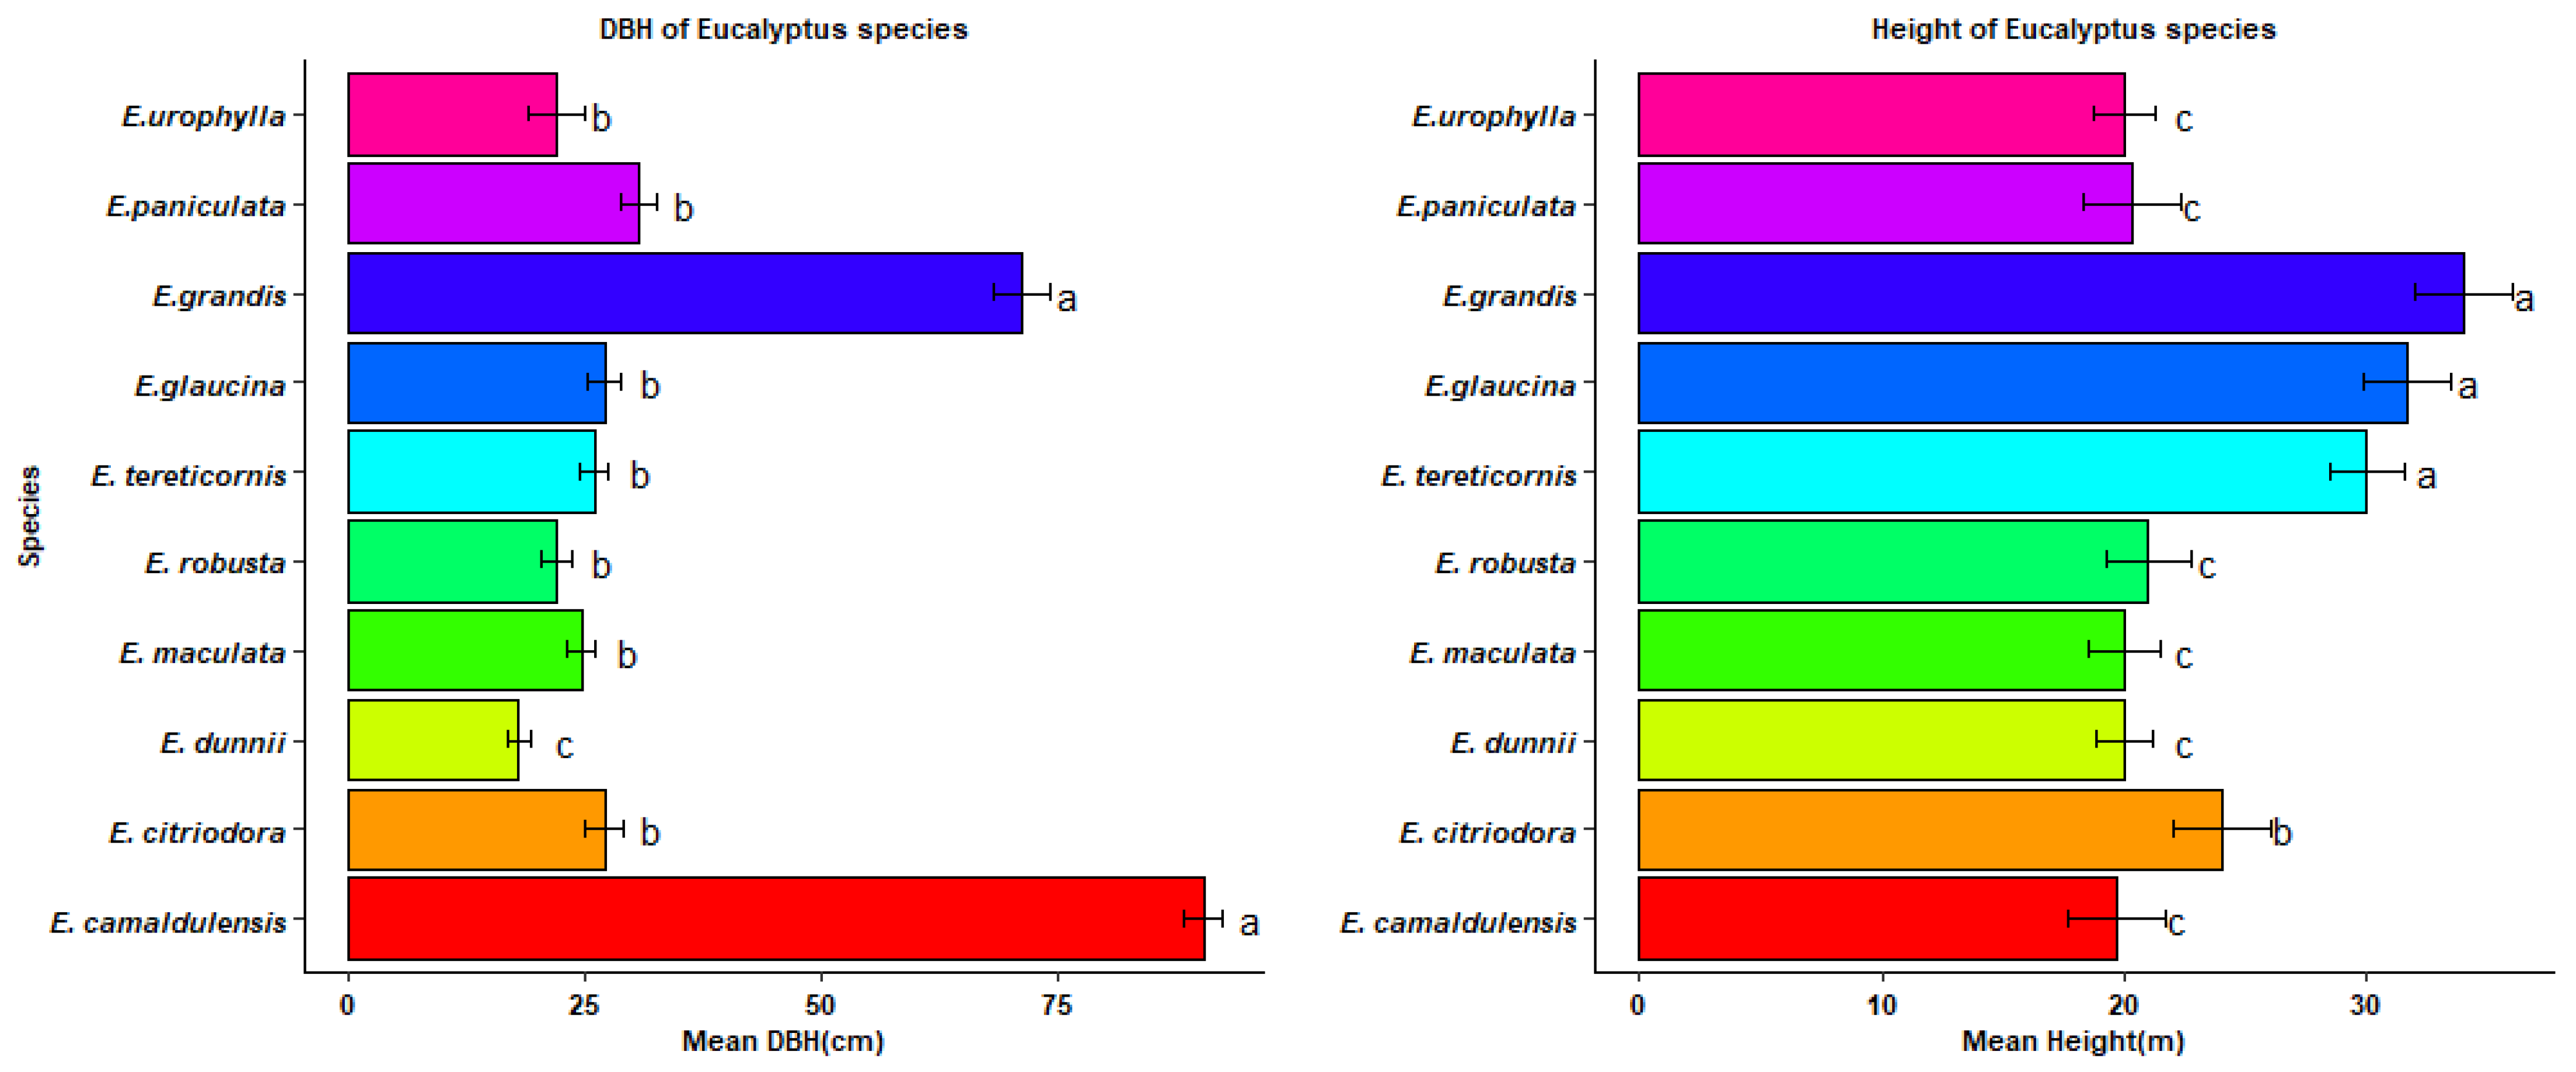
Figure 1. Mean and standard errors of DBH and Height of Eucalyptus species (same letters on the bars indicate that species means are not significantly different while different letters indicate significant differences in means at probabilty level of 0.05).
Diversity 14 00563 g001
Figure 2. Nucleotide Substitution rates (MatK: Maturase k gene, rbcL: Ribulose biphosphate carboxylase large subunit gene, TrnL-F: TrnL-TrnF intergenic spacer gene, X axis shows substitution of one nucleotide by another in the course of evolution. For instance, AT implies a mutation where Adenine is substituted by Thymine, AC: Adenine being substituted by Cytosine. Y-axis shows the rate at which such substitution can occur. Only 12 possible nucleotide pair substitutions are possible.
Diversity 14 00563 g002
Figure 3. Nucleotide composition bias disparity index.
Diversity 14 00563 g003
Figure 4. Evolutionary divergence between sequences.
Diversity 14 00563 g004
Figure 5. Concatenated sequence phylogenetic tree. (Bootstrap support values are shown at the nodes; values above 70 indicate that the tree topology/monophyletic clade is strongly supported; values around 50 indicate moderate support while value below 50 indicate poor support).
Diversity 14 00563 g005
Table 1. Primers used for PCR.
Gene SequenceReference
MatKForward5′-CCTATCCATCTGGAAATCTTA-3′ [31]
Reverse3′-GTTCTAGCACAAGAAAGTCG -5′
rbcLForward5′-ATGTCACCACAAACAGAGACTAAAGC-3′[32]
Reverse3′-GTAAAATCAAGTCCACCCG-5′
TrnL-FForward5′-ATCATGTTAATTAATGTCTAGAA-3′[33]
Reverse3′-CGGGATCCTCAAGGGCCACCAAAGCTGT-5′
Table 2. Eucalyptus species Genbank accession numbers.
Eucalyptus SpeciesGeneGenbank Accession NumberGeneGenbank Accession NumberGeneGenbank Accession Number
E.urophyllarbcLOM949975MatKOM949969TrnL-FOM949984
E.paniculatarbcLOM949976MatKOM949970TrnL-FOM949985
E. citriodorarbcLOM949977MatKOM949971TrnL-FOM949986
E. robustarbcLOM949978MatKOM949972TrnL-F-
E. maculatarbcLOM949979MatK-TrnL-F-
E. camaldulensisrbcLOM949980MatK-TrnL-F-
E. dunniirbcLOM949981MatKOM949973TrnL-FOM949987
E.grandisrbcLOM949982MatK-TrnL-FOM949988
E. tereticornisrbcLOM949983MatKOM949974TrnL-FOM949989
E.glaucinarbcLOM985042MatKOM985041TrnL-FOM985043
Publisher’s Note: MDPI stays neutral with regard to jurisdictional claims in published maps and institutional affiliations.