Article

Phylogeographic and Bioclimatic Determinants of the Dorsal Pattern Polymorphism in the Italian Wall Lizard, Podarcis siculus

by
Francesco Gallozzi
1,2,
Paolo Colangelo
2,
Gabriele Senczuk
3 and
Riccardo Castiglia
1,*
1
Dipartimento di Biologia e Biotecnologie “Charles Darwin”, Università degli Studi di Roma “La Sapienza”, Via Borelli 50, 00188 Roma, Italy
2
National Research Council, Research Institute on Terrestrial Ecosystems, Via Salaria km 29.300, 00015 Montelibretti, Italy
3
Department of Agricultural, Environmental and Food Sciences, University of Molise, 86100 Campobasso, Italy
*
Author to whom correspondence should be addressed.
Diversity 2022, 14(7), 519; https://doi.org/10.3390/d14070519
Submission received: 8 May 2022 / Revised: 18 June 2022 / Accepted: 24 June 2022 / Published: 28 June 2022
(This article belongs to the Special Issue Biodiversity in Italy: Past and Future Perspectives)

Abstract

:
The geographic variability of the dorsal pattern (DP) of the Italian wall lizard, Podarcis siculus, across its native range was studied with the aim of understanding whether the distributions of this phenotypic trait were more shaped by allopatric differentiation rather than adaptive processes. A total of 1298 georeferenced observations scattered across the Italian peninsula and the main islands (Sicily, Corsica and Sardinia) were obtained from citizen science databases and five DPs were characterized by different shapes of the dark pattern (“reticulated”, “campestris”, “reticulated/campestris” and “striped”) or by absence of it (“concolor”). Frequencies of different DP phenotypes differ between the two main mtDNA lineages settled in central-northern and in southern Italy, respectively. This pattern may be indicative of a role of long-term allopatric historical processes in determining the observed pattern. The analysis also identified a putative wide area of secondary contact, in central southern Italy, characterized by high diversity of the DP. Generalized Linear Models (GLMs), used to estimate a possible association between bioclimatic variables and the observed phenotypic variation, showed that each of the five DPs is correlated to different environmental factors and show a different distribution of areas with high probability of occurrence. However, for all but one of the DPs, the area with the greatest probability does not correspond exactly to the real distribution of the DP. Conversely, the “concolor” phenotype does not seem related to any particular mtDNA lineage and it shows a preference for areas with high temperature and low rainfall. This is in agreement with the expectation of low amount of melanin of the dorsal pattern that, in the study areas, is characterized by a light uniform coloration which could confer a better thermoregulation ability in high temperatures environments to avoid overheating.

1. Introduction

Geographic phenotypic variation within a species can be due to natural selection driven by different factors such as, for example, adaptive divergence to different environments or variation in sexual selection [1,2]. Alternatively, it may reflect a non-adaptive divergence of phenotypes in isolated lineages due to random drift or a combination of all these factors [3,4]. In general, when genetic variation overlaps with the phenotypic variation in similar environmental conditions and mating systems, a dominant role of allopatry and isolation might be evoked. On the other hand, if the phenotypic variability agrees with the environmental variables, natural selection might be most involved [2]. Within reptiles, the dorsal surface of lizard is frequently a polymorphic character, in color and pattern, and it is believed to evolve especially for adaptative purposes, probably to serve functions of crypsis and thermoregulation (e.g., [5,6,7]). Even so, a series of studies linked lizard dorsal morphs with different aspects of escape behavior and reproductive involvement [8,9]. Finally, DP polymorphism may also be related to sexual dimorphism, thus it is largely driven by sexual selection as an outcome of male–male competition [10].
In natural sciences, the Citizen Science [11] is playing an ever-increasing role in scientific research due to the possibility to obtain large datasets of species occurrence records across large geographic scales, at a significantly lower cost when compared to traditional scientific surveys [12,13,14]. These large datasets have been used successfully to model species distributions, abundances [15], phenology [16] and to quantify ecological interactions that affect animal fitness, as predation and parasitism [17]. Studies on the geographic phenotypic variation of populations are less common. In fact, these studies, despite their great potential, are applicable only to abundant species whose phenotypic characteristics under study are easily decipherable from photos (e.g., [18,19,20]). Only a small number of studies have dealt with vertebrates, but also in this case, it is possible to have results on the frequencies of the different phenotypes with unprecedent geographical details [21].
The Italian wall lizard, Podarcis siculus, represents a good model for studying phenotypic diversity with a citizen science approach since it is not elusive, and very abundant and present in anthropized areas. This species is widespread in peninsular Italy, also occurring in Sicily, Sardinia and Corsica, and along the northern part of the eastern Adriatic coast. The species exhibits a remarkable variability of the dorsal pigmentation pattern (dorsal pattern, DP) [22]. The two most widespread phenotypes are the “reticulated” one, with a brown or black dorsal reticulation overlying a lighter base color which can range from light brown to green (Figure 1e), and a phenotype (Figure 1b) in which the dark reticulation leaves room for two lighter parietal lines that run throughout the body. The situation is made more complex by the presence of numerous intermediate phenotypes between the two and the absence of a specific pattern observable in the case of the so-called “concolor” (Figure 1c) [23]. These DP phenotypes may reflect differences in the quantity or distribution of melanin on the back [24] and may have an impact on thermoregulation, for example with slower cooling rates, which may increase efficiency of thermoregulation in darker phenotypes [25,26].
The evolutionary history of P. siculus appears to have been strongly influenced by a series of historical fragmentation events due to severe cycles of glacial/interglacial periods during the Early-Middle Pleistocene with the onset of geographical barriers [27,28]. These events resulted in a complex phylogeographic structure characterized by strong mitochondrial discontinuities only partially in accordance with the nuclear signature [28,29]. In particular, there are two main parapatric lineages, corresponding to the “Siculo-Calabrian” (SC) lineage and the “Central-Northern” (CN) lineage (Figure 2). The boundary between these two lineages is settled in central Calabria, although there might be a sympatry area as shown in Figure 2 (see also 28). Within the Siculo-Calabrian lineage, three clades, two in Calabria (S1 and S2) and one in Sicily (S3), were identified, while the central-northern lineage splits into two main clades, the ‘Tyrrhenian’ (T) and the ‘Adriatic’ (A) parapatric clades. The latter can be divided into two subclades (A2 and A3). The T-clade is mainly distributed across the northern-central Tyrrhenian coast, while the A-clade is found along the Adriatic coast and in Croatia and extending in the Tyrrhenian coast in southern Italy (the distribution of mtDNA lineages and clades in Italy is indicated with their phylogeny in Figure 2).
In this study, photographs obtained from citizen science databases were used to analyze the overall geographic variability of the DPs in P. siculus. In order to better understand whether these phenotypic traits were more shaped by allopatric differentiation rather than adaptive processes, phenotypic frequencies were tested in relation to mtDNA clades. A correspondence between DP and mtDNA lineages may be indicative of an origin of the phenotypic variant following the allopatric events. Subsequently, Generalized Linear Models (GLM) were used to estimate the possible link between bioclimatic variables and the observed phenotypic variation for each DP pattern.
Thus, the GLMs were then used to predict the occurrence probability in the range of P. siculus: if GLM-based predictions result is reliable, this may indicate that each phenotype is adapted to different climatic conditions.

2. Material and Methods

2.1. Selection of Observations

Photo-vouchered observations of the Italian Wall Lizard (P. siculus) were sourced from iNaturalist (www.inaturalist.org, accessed on 5 April 2021). Over 4000 observations of this species had been uploaded online as of 5 April 2021 and they have been all checked. We only included in the analysis georeferenced observations of adult specimens with accuracy less than 5 km and in which the DPs (see below) of photographed animals were clearly identifiable. For observations less than 100 m apart, we visually compared the size, colour, and dorsal patterns of the lizards in the images to eliminate potential duplicates of the same individual. After pruning unusable observations, a total of 1298 observations were included in this study. As for most individuals (60%) we were not able to determine the sex, we decided not to consider it in the analysis (see Discussion).

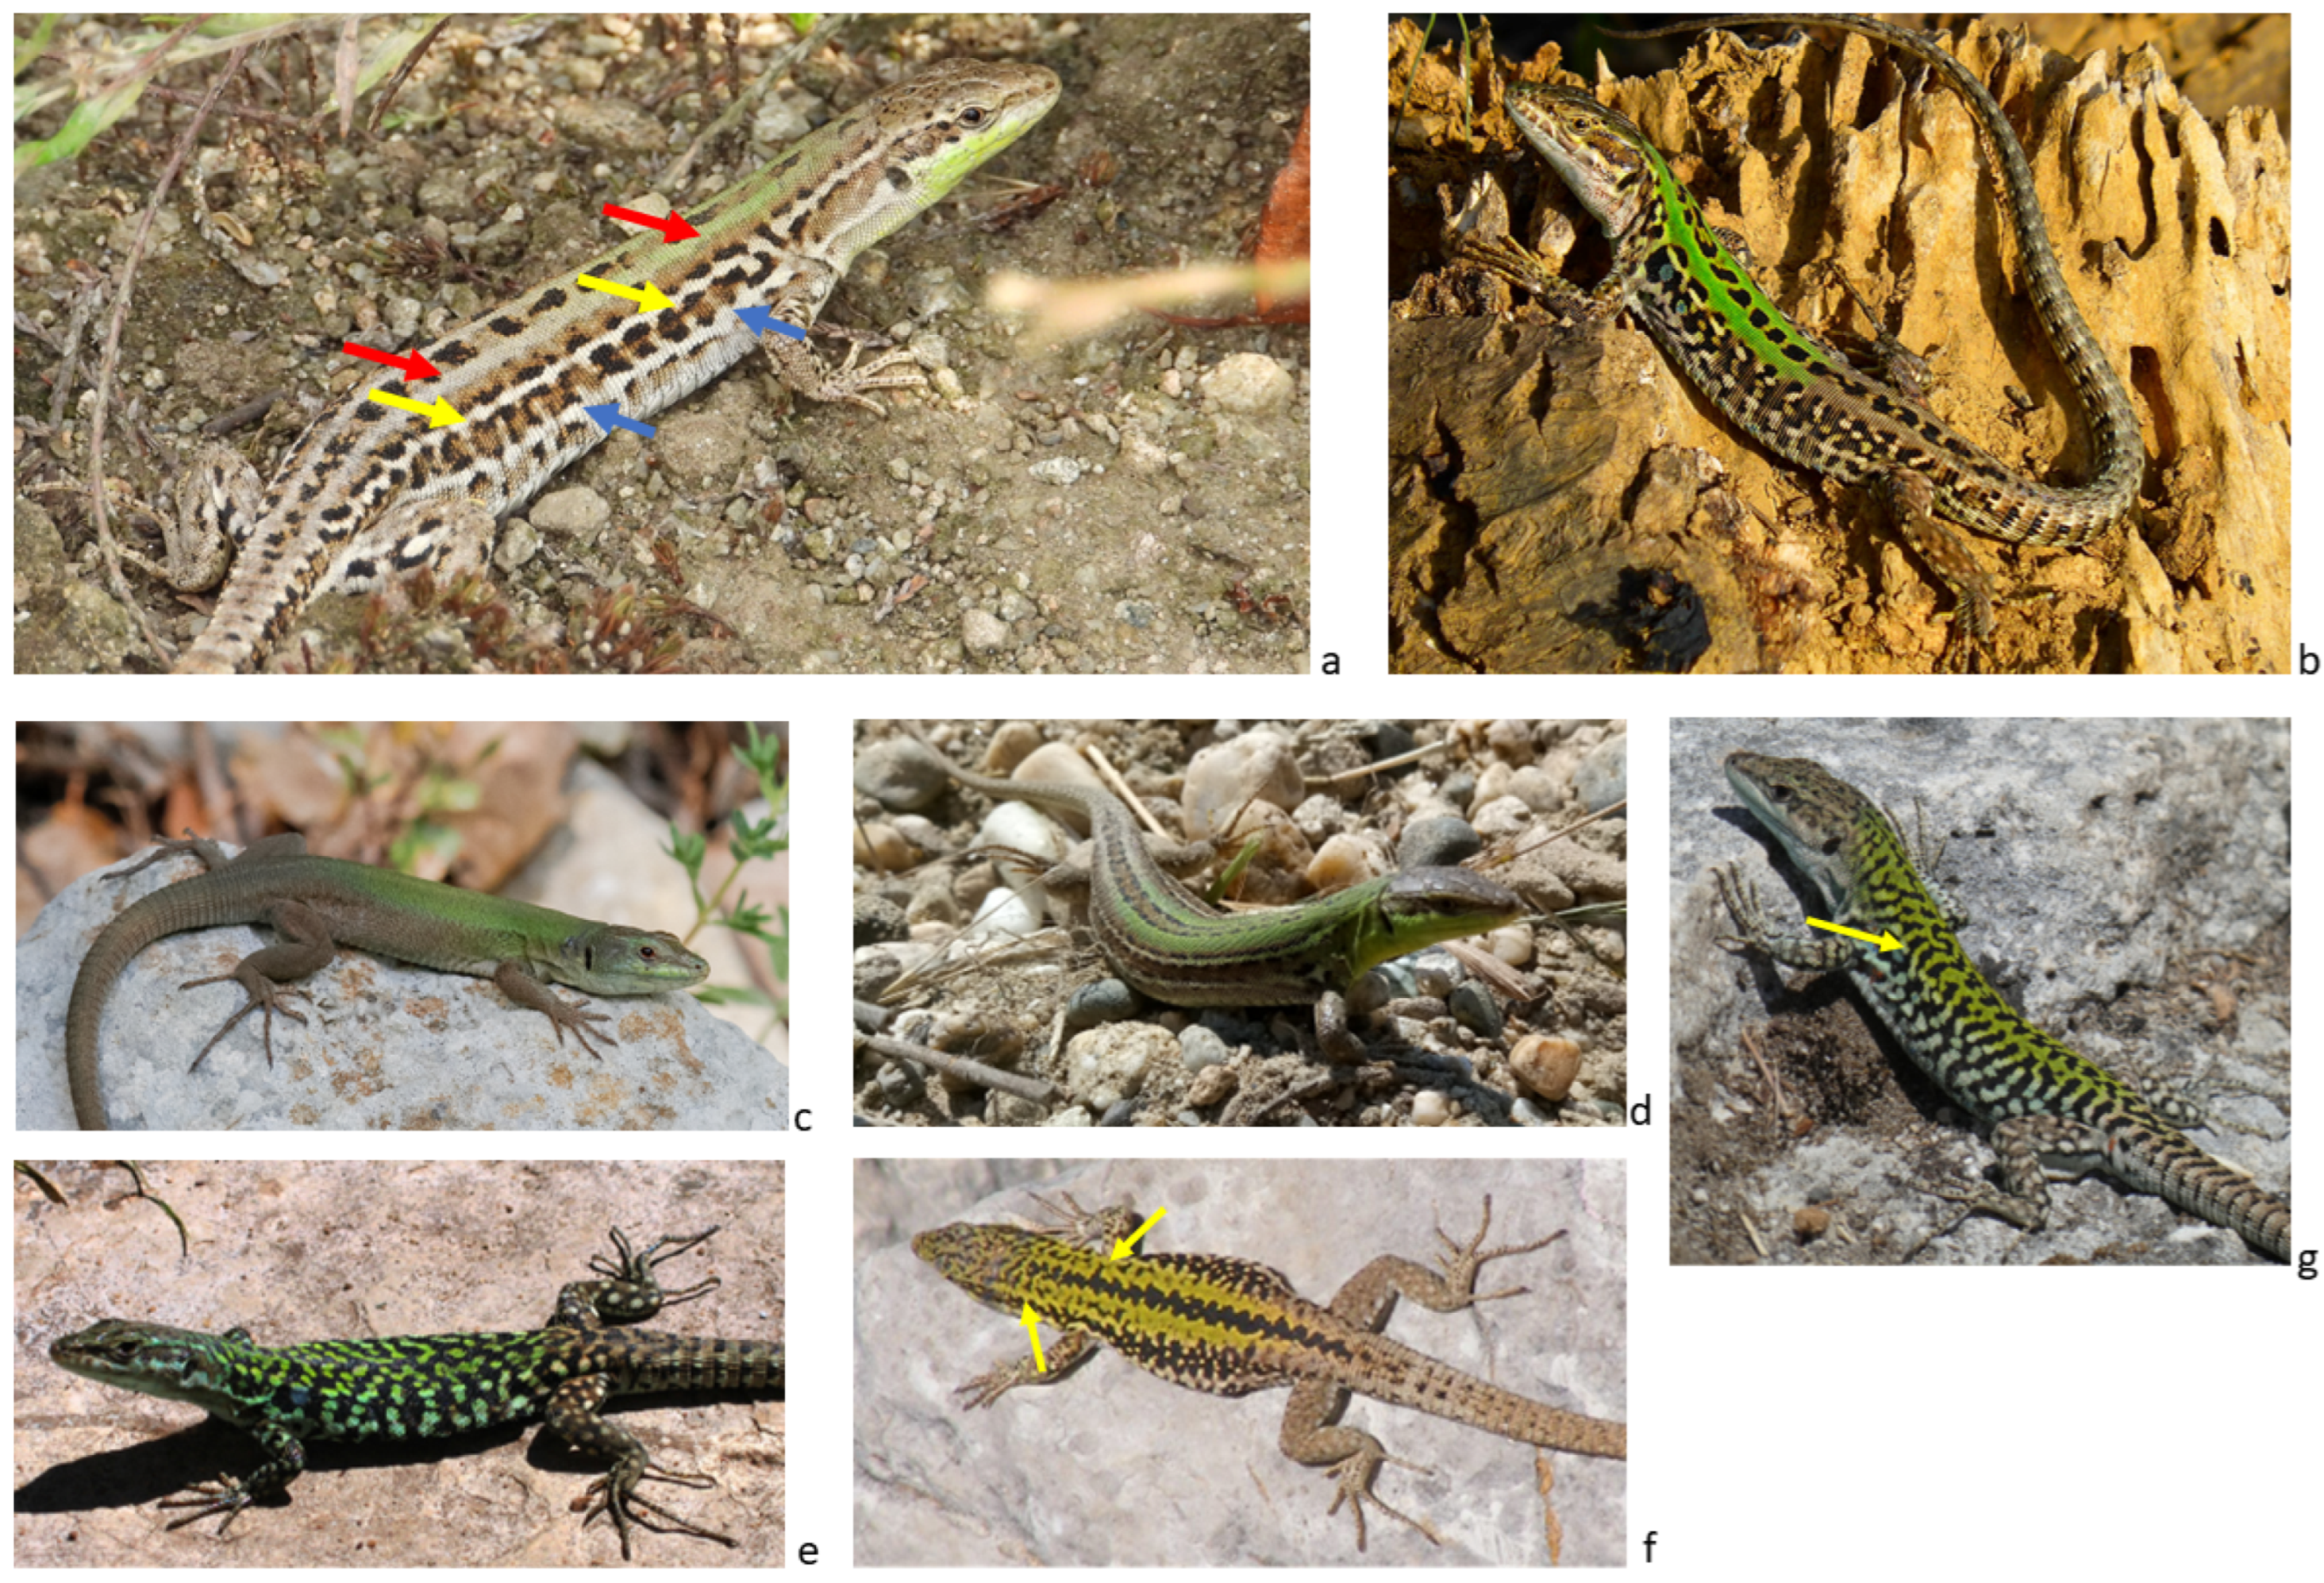
2.2. Character and Phenotype

Raw data used in this study are available in supplementary materials (Table S1), including the iNaturalist ID number of the observations and geographical coordinates. Six characters of the dorsal pattern were included in our study (Figure 1). For each observation, presence/absence of each character was evaluated and a presence/absence matrix was created (presence = 1, absence = 0). The six characters considered in this study include: (1) presence of anterior parietal bands (a double green or brownish dorsal stripe stretching dorsally from the parietal scales to the midbody); (2) presence of a posterior parietal band (a double green or brownish dorsal stripe stretching dorsally from the midbody to the tail); (3) presence of anterior supraciliar stripe (a usually light stripe stretching dorsolaterally from the supraciliary scales to the midbody); (4) presence of posterior supraciliar stripe (a usually light stripe stretching dorsolaterally from the midbody to the tail); (5) presence of a lateral stripe (a usually light lateral stripe from the forelimb to the hindlimb); (6) presence of a dorsal reticulation (a dorsal dark reticulum that interrupts a stripe or a band in at least one point). Bands and stripes were considered as present only when they were continuous and showed no interruption due to the darker dorsal pattern (Figure 1b,d).
Following the identification of the 6 characters, each individual was assigned to the following five phenotypic categories according to presence/absence combinations of the characters: “campestris” (presence of anterior and posterior parietal bands only, absence of other characters), “reticulated” (presence of complete dorsal reticulation, absence of other characters); “striped” (complete parietal bands with at least one between supraciliar or lateral stripe, absence of other characters); “concolor” (0 for all characters, i.e., absence of any dark pattern or stripe, uniform coloration). Although some individuals (n = 47; Figure 1f,g) showed parietal bands, they were very different from classical “campestris”, since their bands presented jagged edges or were interrupted in at least one point in the anterior or posterior portion of the body. These individuals were classified as “reticulated/campestris” (Figure 1f,g).

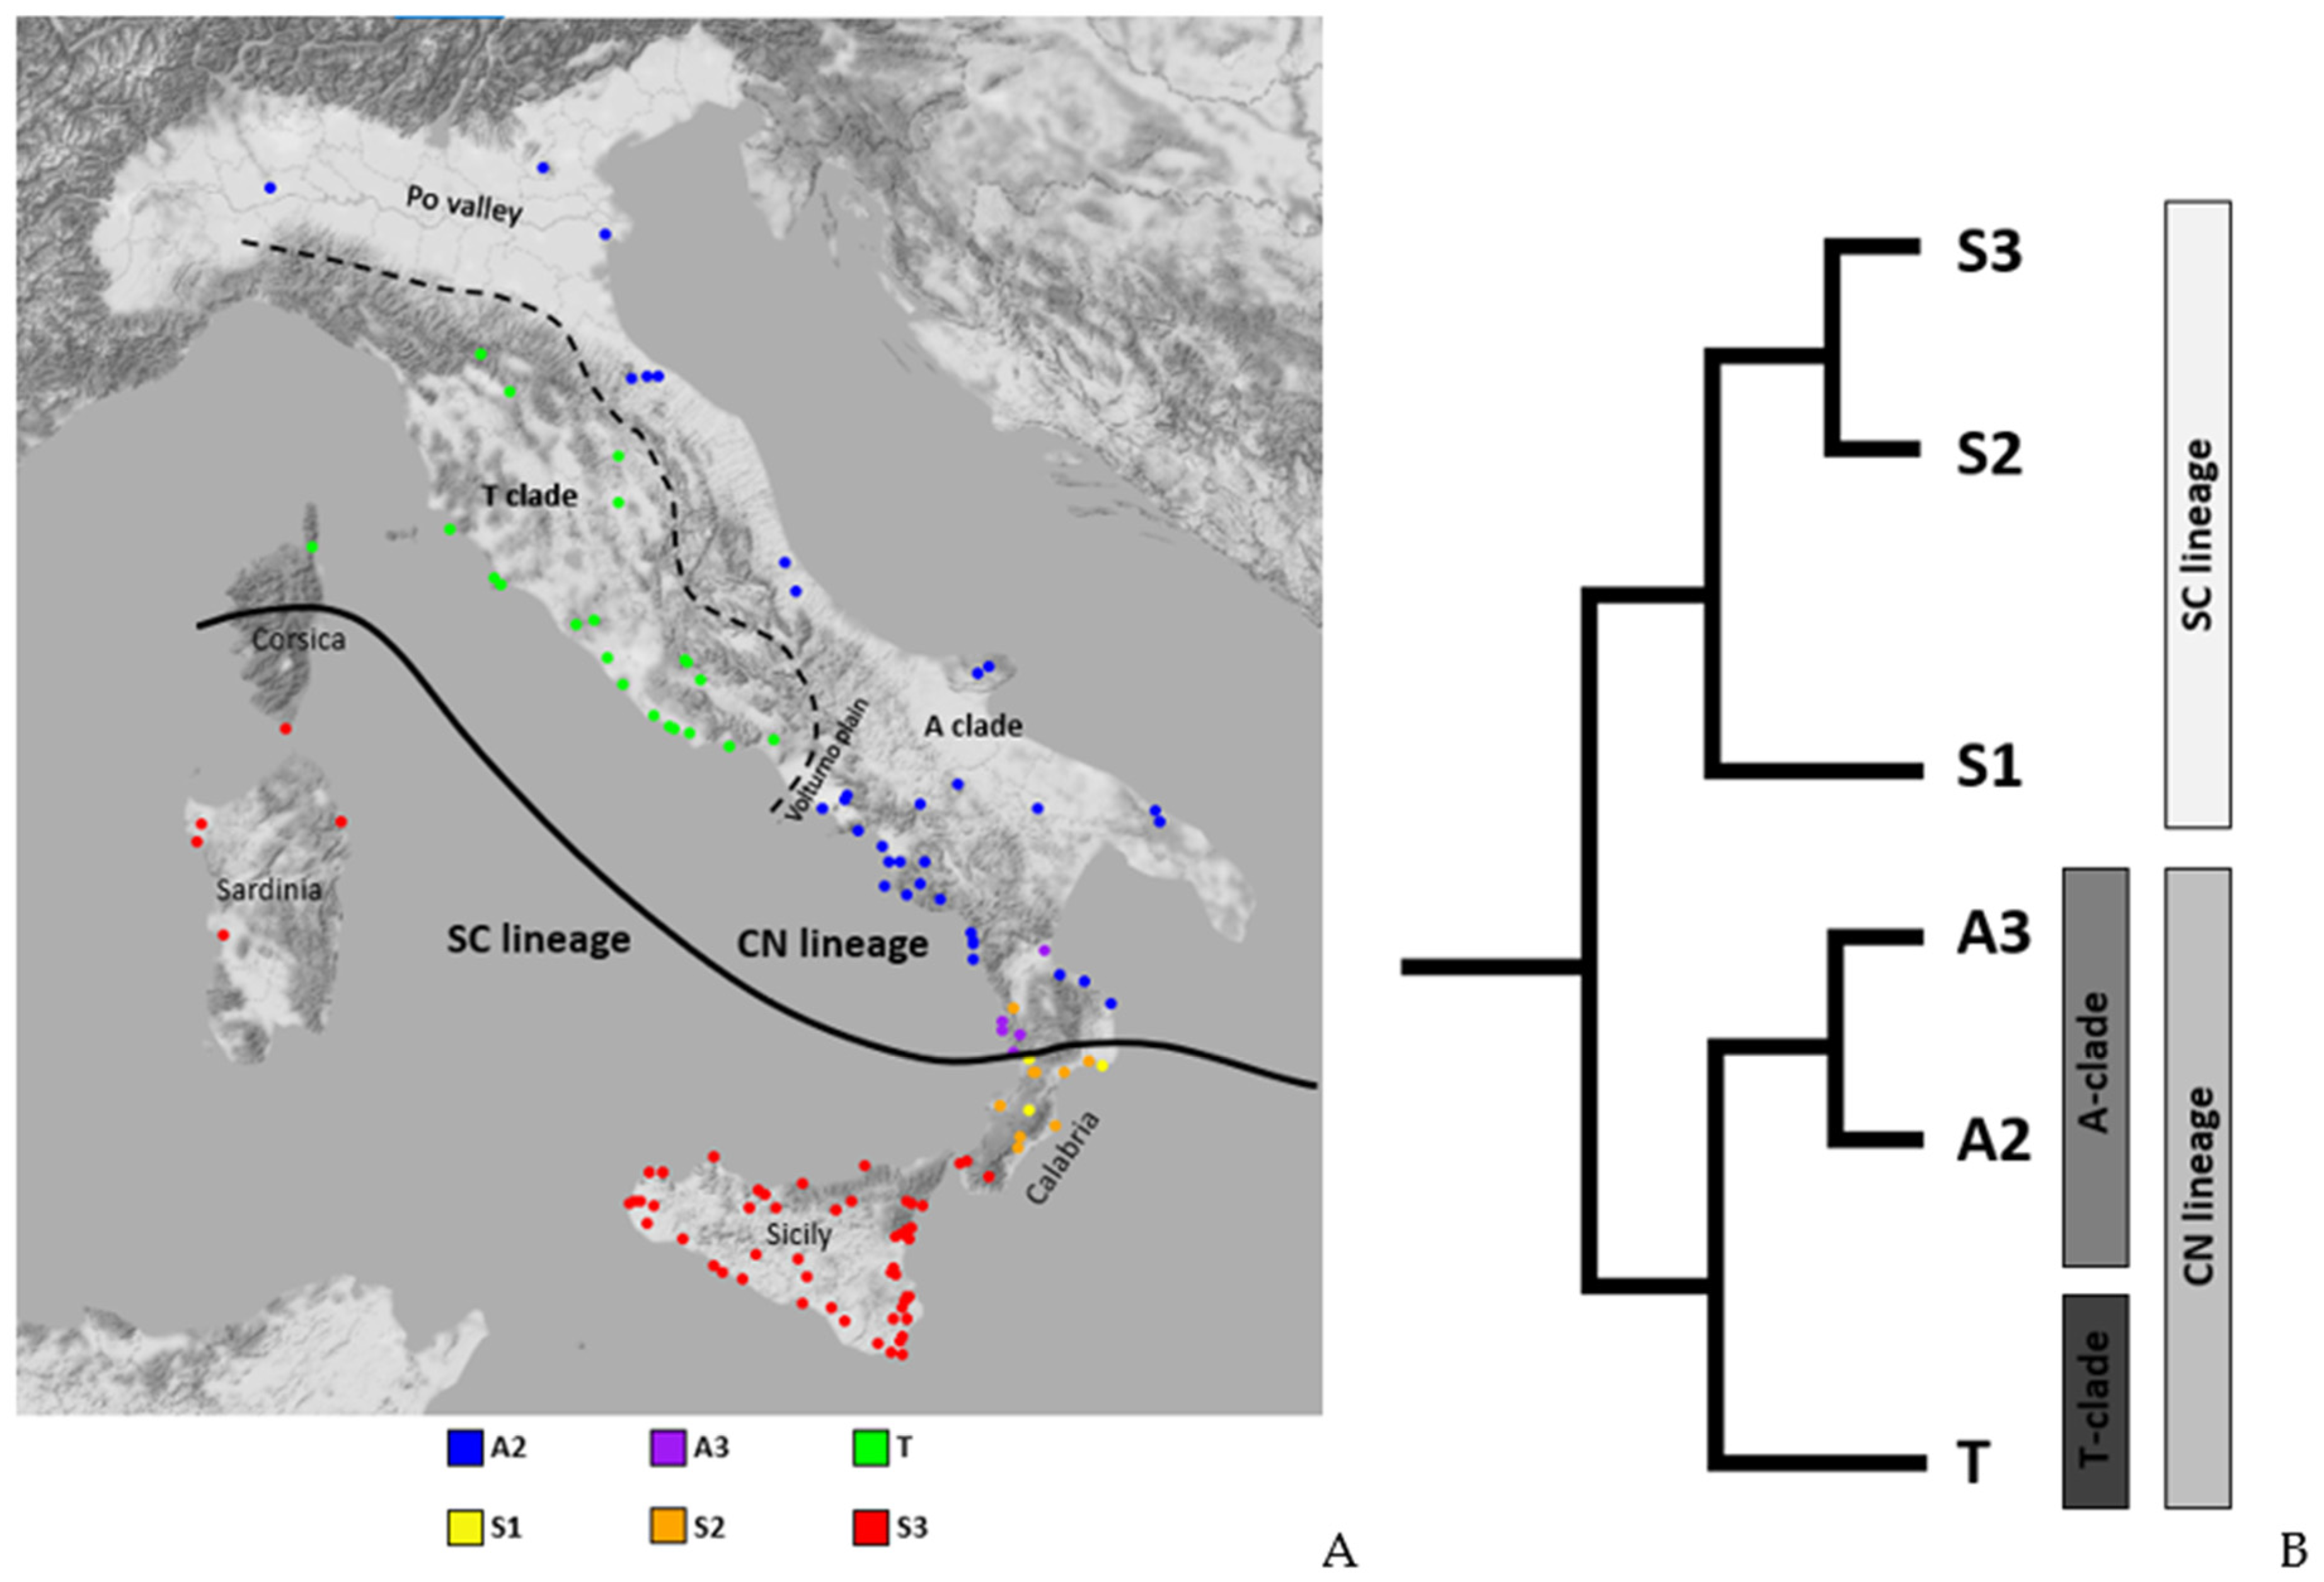
2.3. Distribution of Dorsal Pattern Phenotypes and mtDNA Lineages

Dorsal pattern phenotype distributions were plotted on a map using ggmap package in R [30]. The relative frequencies of the different DP phenotypes were estimated for twenty-two groups of nearby observation. Groups of populations were as follows: three groups for Sicily, two groups for Calabria, Puglia, Sardinia and Corsica, one group for each of the remaining Italian regions. The distribution of mtDNA clades and lineages has been extrapolated by data points extracted by [28,29] with a minimum convex polygon approach and according to the orographic characteristics of the study area (Figure 2). Therefore, according to their geographic origin, each observed individual was assigned to a lineage/clade. This method leads to a certain approximation in the correspondence between the observation on iNaturalist and their assignment to a specific lineage/clade. However, the lineages/clades have a very wide distribution and are parapatric/allopatric with no case of co-occurrence of lineages in the same population except for an isolated individual in Calabria (Figure 2 and [28]). Furthermore, we avoided comparing the frequencies of the DPs between the clades in Calabria as the available data cannot precisely identify their boundaries. For this reason, we were confident that, at the geographic scale considered in this work, the approximation in the assignment of the observations to the various lineages/clades does not significantly affect the results. To test differences in phenotypic frequencies in relation to mtDNA lineages/clades, the χ2 test was conducted to compare frequencies of different phenotypes between the two main lineages (CN and SC) and between the A and T clades. Moreover, we compared DP frequencies of pooled specimens of the S1 and S2 clades with specimens from the Sicilian S3-clade. Since we found two haplotypes belonging to the S3-clade in the very southern portion of Calabria, DP data from this area were pooled with other Calabrian samples.

2.4. GLM Modelling

To model the probability of encountering a phenotype across the range of the species, a set of GLMs (one for each phenotype) was estimated considering phenotypes’ presence/absence as a function of environmental heterogeneity. To describe environmental heterogeneity, we selected nine bioclimatic variables (Table S2) across the whole range of the species with a 0.86 km2 resolution (WorldClim database: https://www.worldclim.org accessed on 14 May 2021) among those considered as most affecting the presence of P. siculus and other related species and that are not highly autocorrelated (Pearson correlation coefficient r < 0.75) according to previous studies [28,31]. Selected variables were as follows: mean diurnal range (BIO2), isothermality (BIO3), temperature seasonality (BIO4), minimum temperature of the coldest month (BIO6), temperature annual range (BIO7), mean temperature of the driest quarter (BIO9), annual precipitation (BIO12), precipitation seasonality (BIO15), precipitation of the warmest quarter (BIO18). We performed a raster PCA using the rasterPCA function implemented in the raster package in R [32] on the selected bioclimatic variables. This function performs a PCA directly on raster data and we used principal components (PCs) as proxies for environmental heterogeneity. We then considered the highest loadings values to interpret PCs. This kind of approach was already successfully used to reduce the dimensionality of bioclimatic data in several studies [33,34,35,36]. A widely used method is to interpret only those components that contribute more than 5% of the total variance [37] and PC1 to PC4 meet this criterion. Since we wanted to select PCs that could explain more than 90% of the variations in the bioclimatic variables, we retained all the four of them to get 94.79% of the variation. PCA loadings, eigenvalues and importance of PCs are shown in supplementary materials (Tables S3 and S4). PC scores were extracted for each observation using the “extract” function of raster package in R [32]. Full GLMs were estimated for each phenotype using a binomial approach and considering the phenotype presence/absence as response variables and the first four PCs as predictors. All the models were compared to null models in which a constant (x~1) was fitted. For model estimation we used the glm function in the “stats” package in R [38]. Then, we compared full and null models through AIC to evaluate the actual effect of environmental heterogeneity on phenotypic frequencies. The probability of encountering a phenotype was then modelled by using the “predict” function of “stats” package in R [38] and we tested the actual prediction performances of our models by an area under the ROC curve (AUC) [39] with pROC package in R [40]. Our predictions were plotted with ggmap package in R and we obtained occurrence probability maps for each phenotype.

3. Results

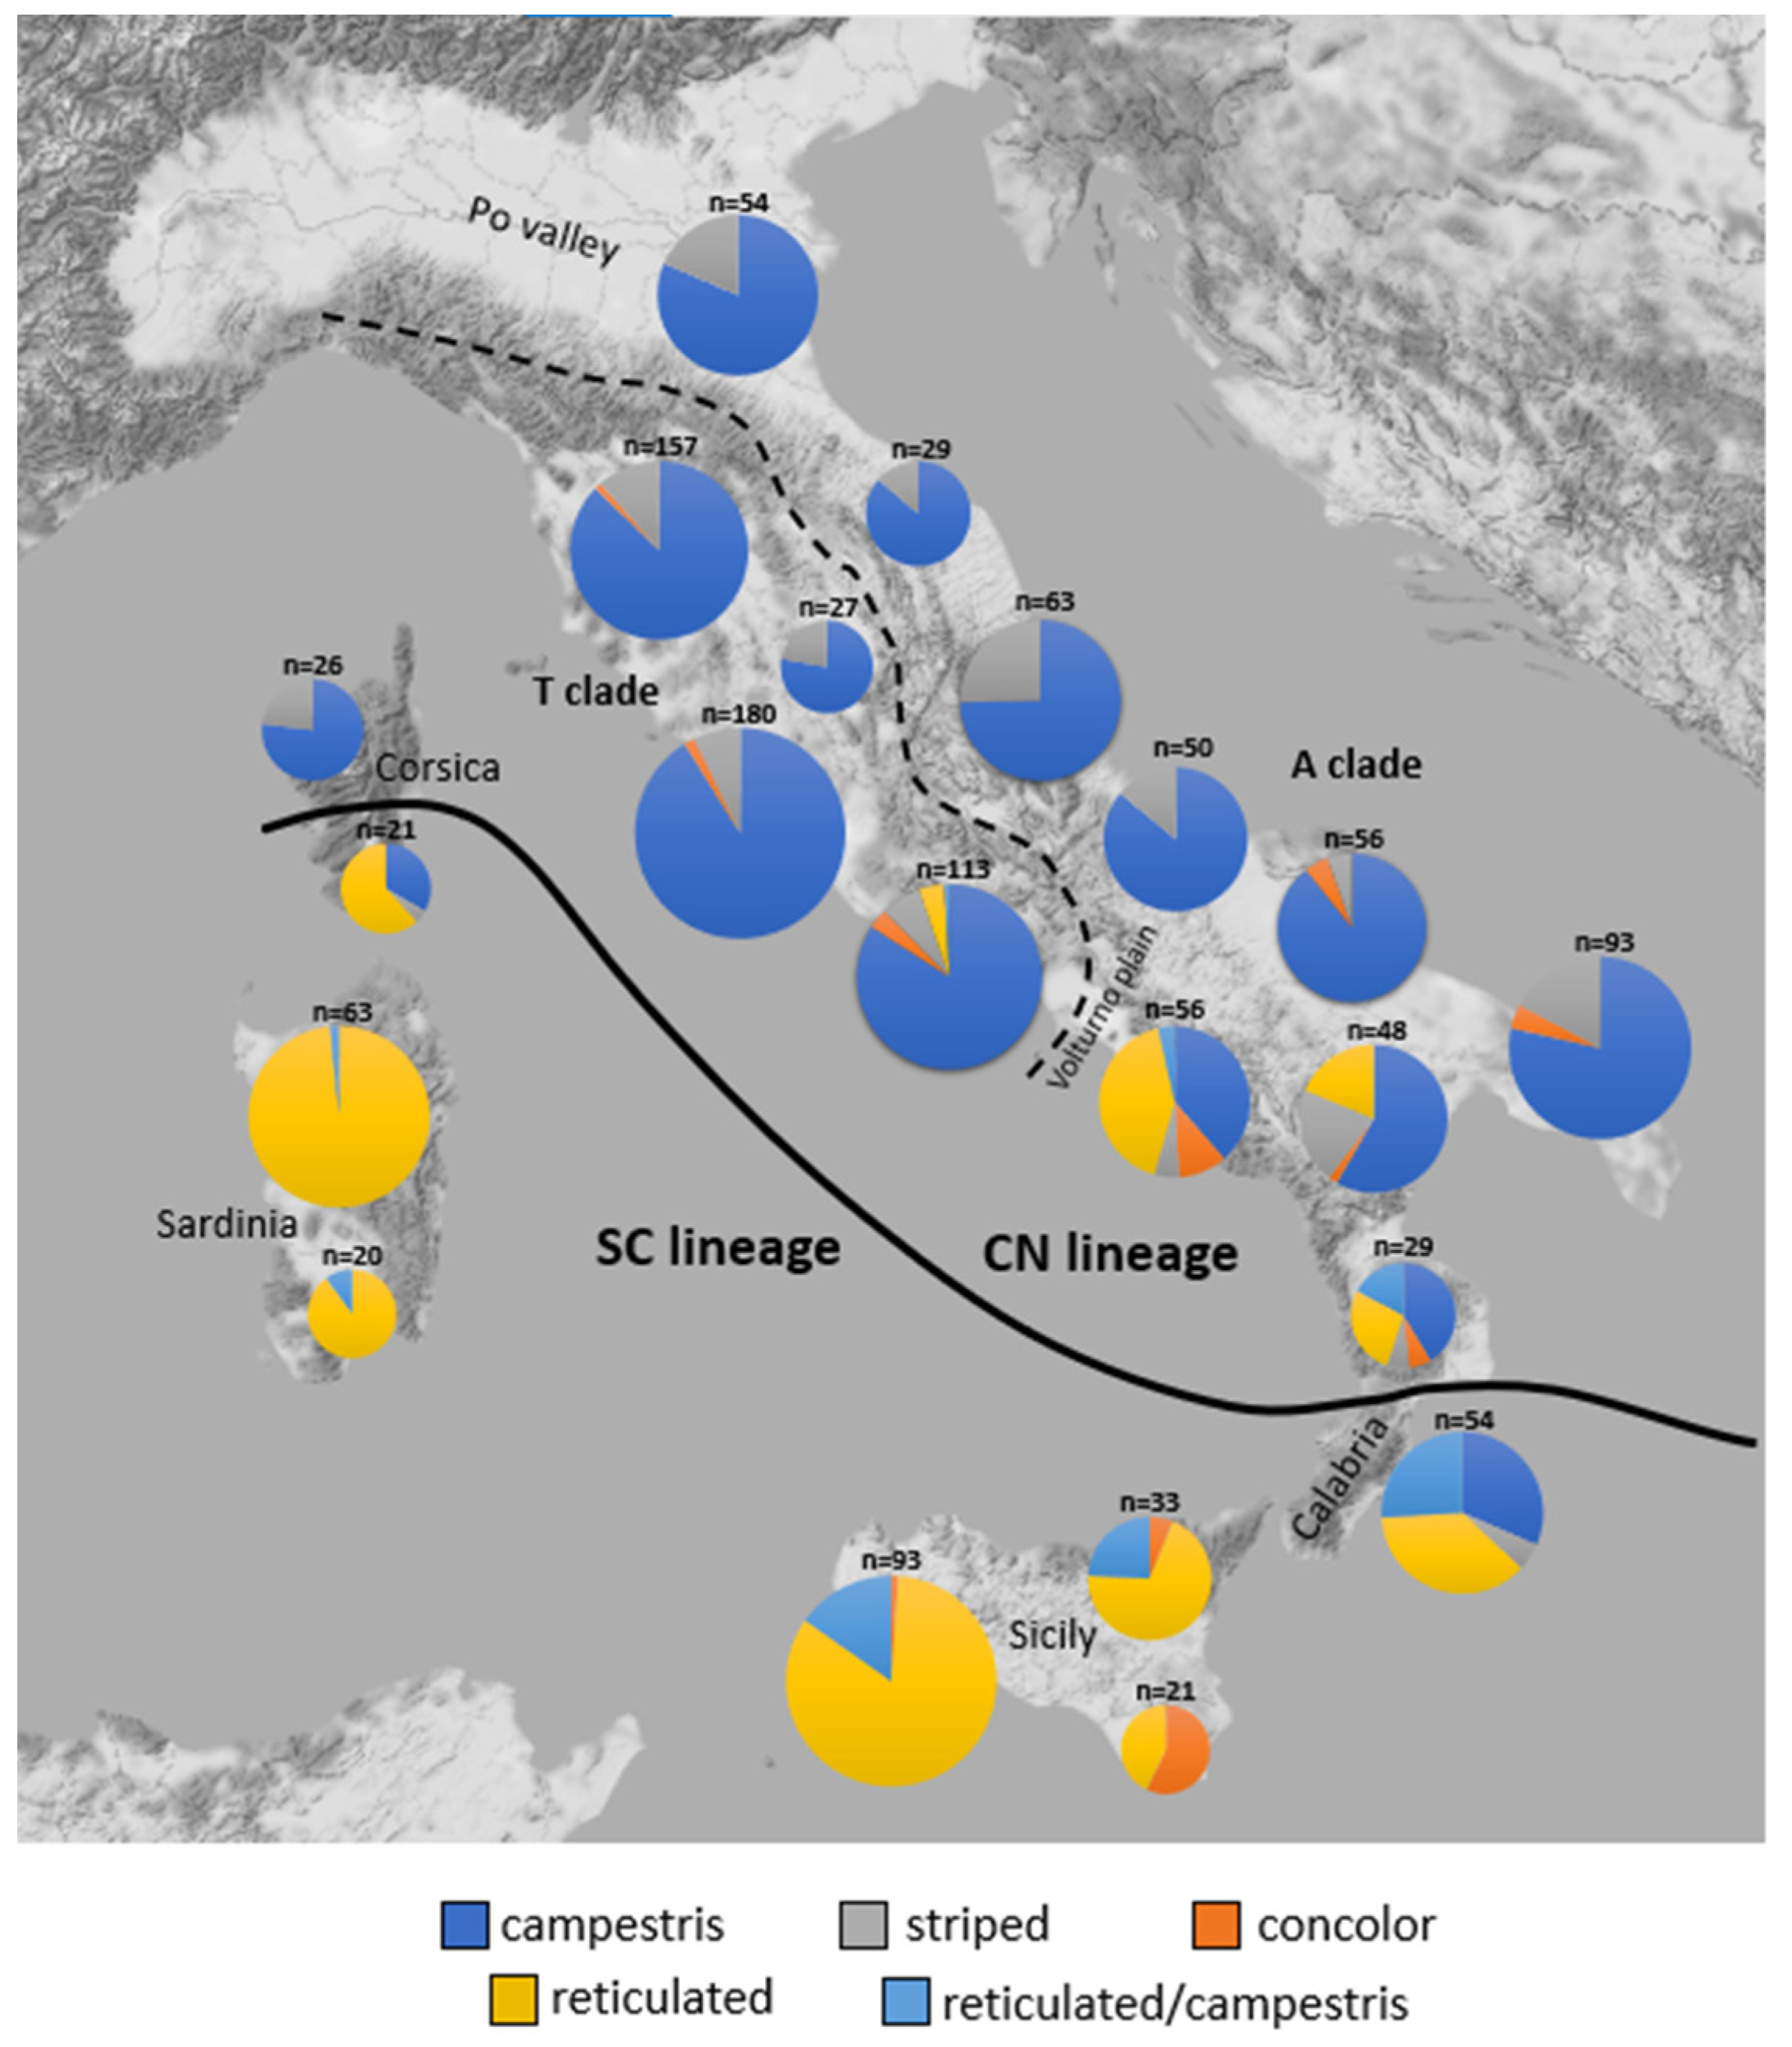
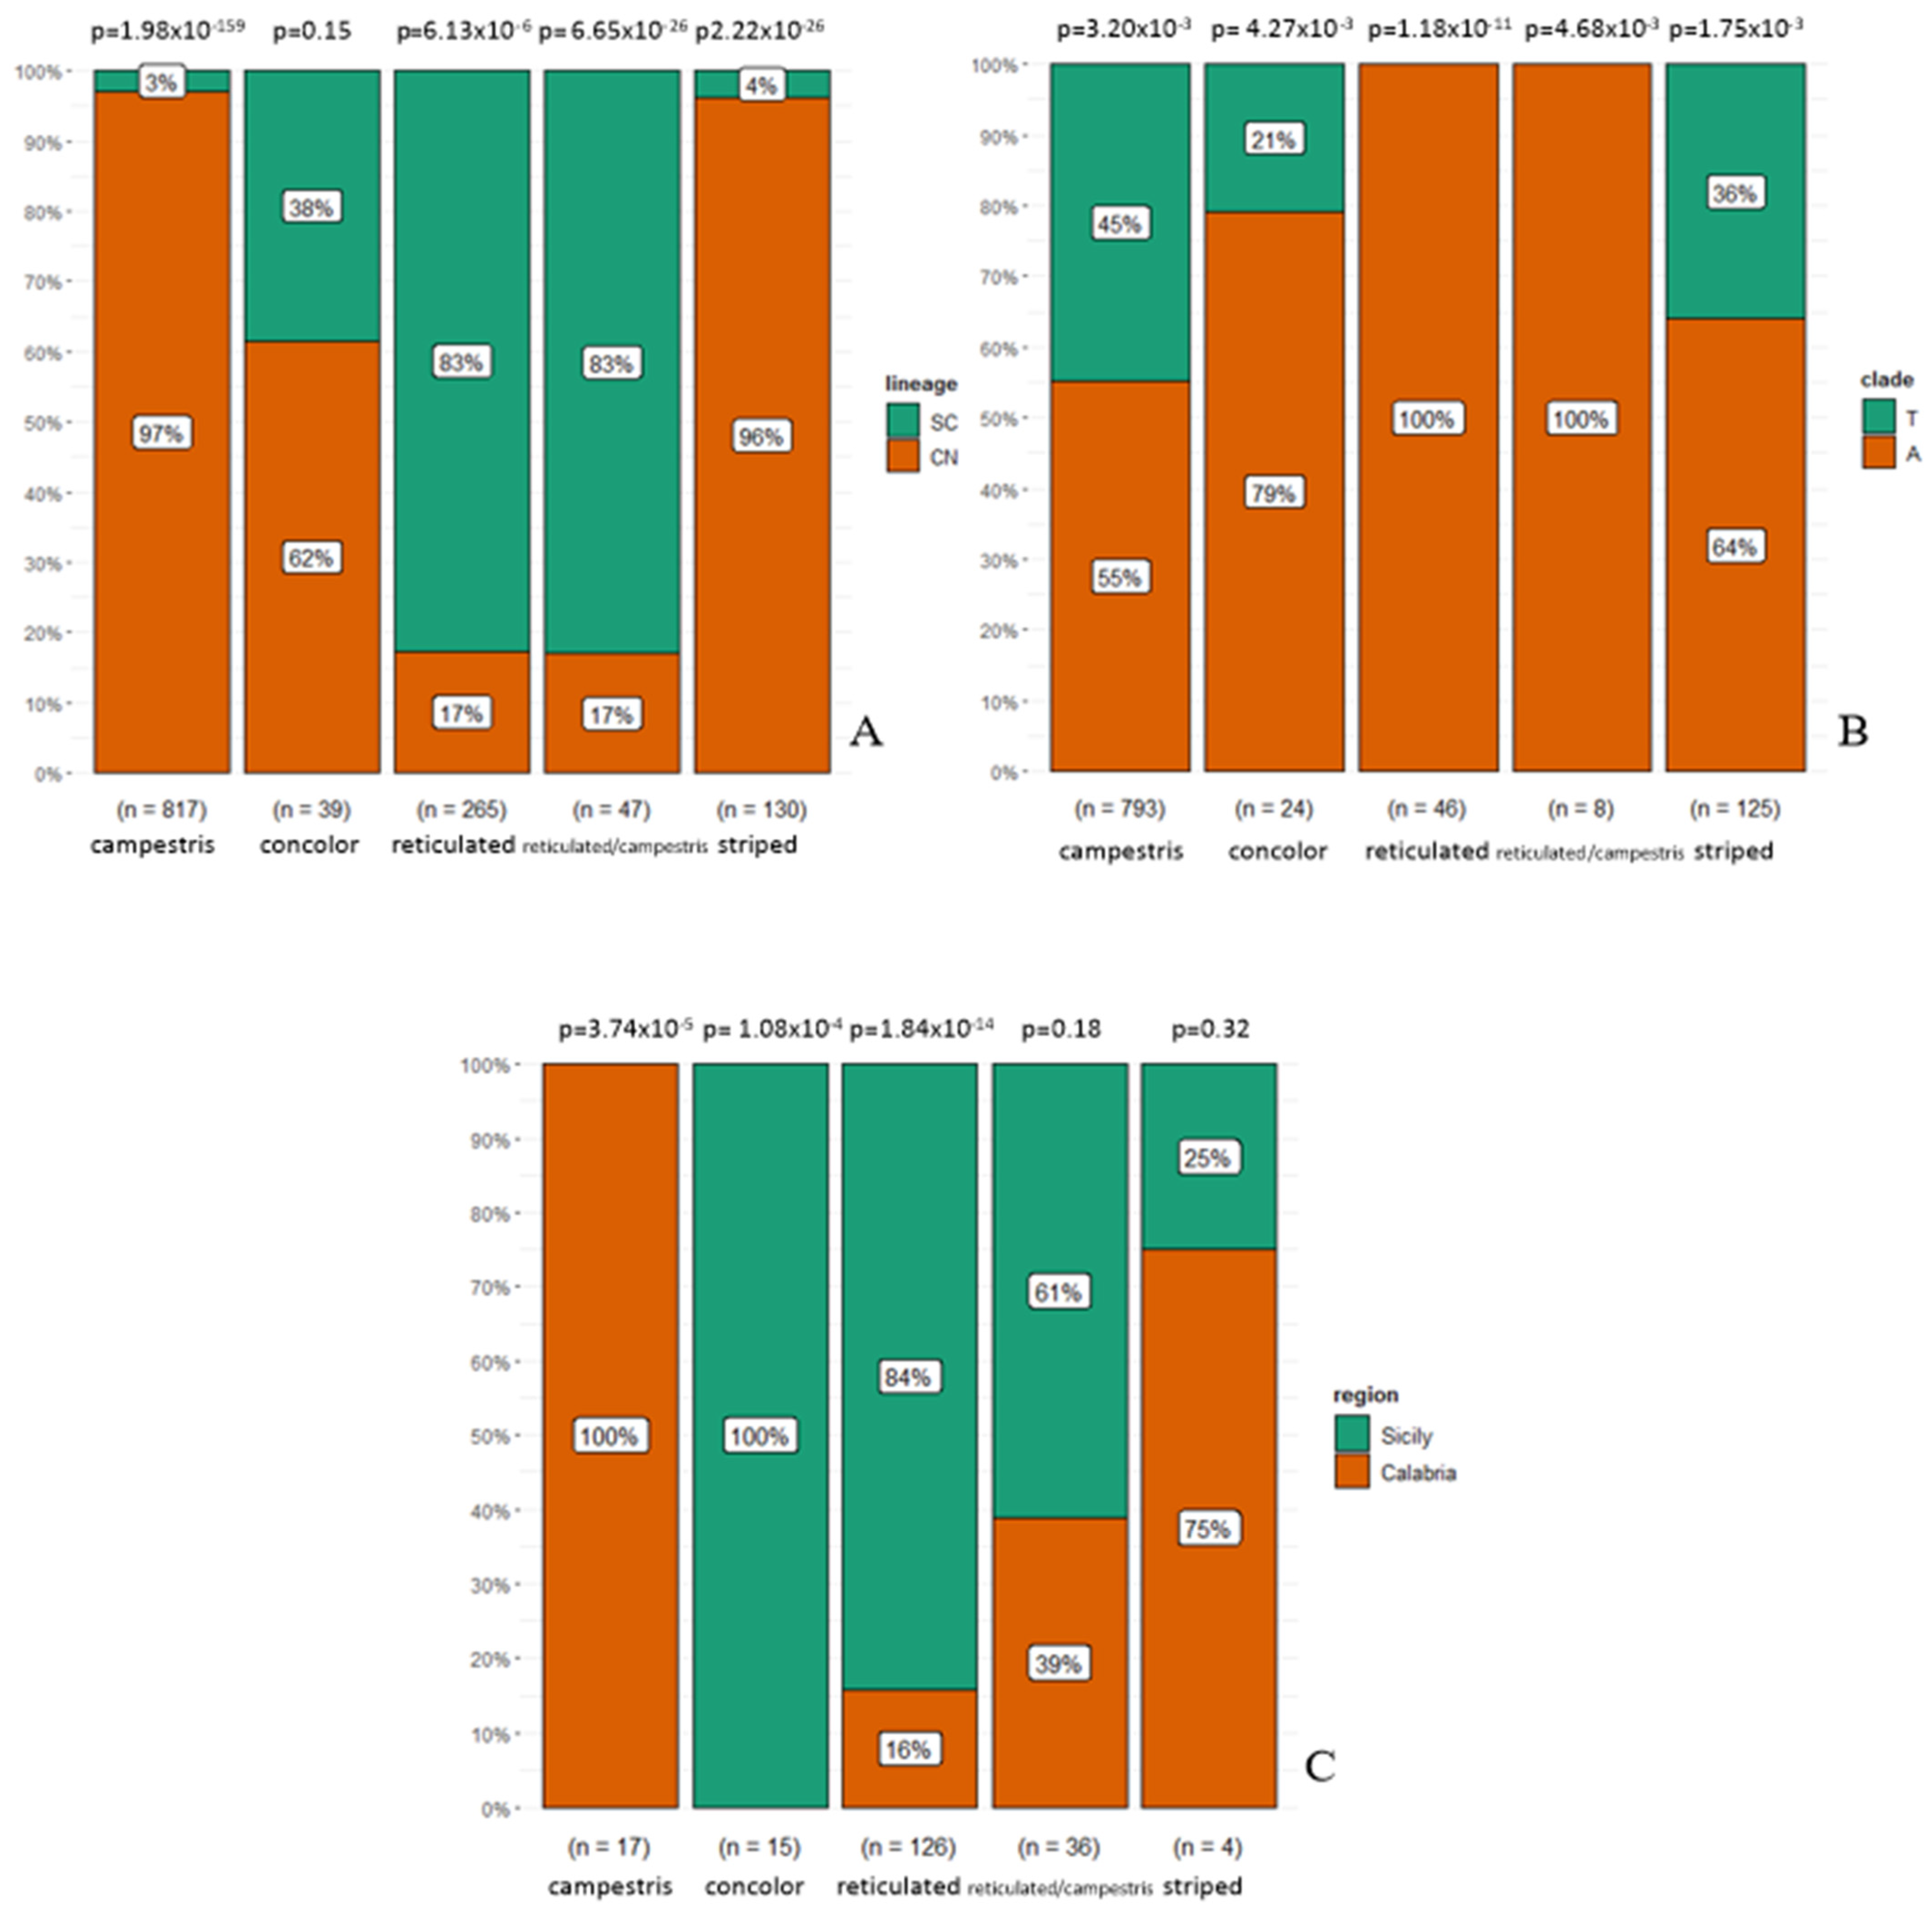
3.1. Phenotype Geographical Distribution and χ2 Test

Among 1298 individuals included in this study, 817 were categorized as “campestris”, 39 as “concolor”, 130 as “striped”, 265 as “reticulated” and 47 as “reticulated/campestris” (see Table S1 and Figure S1 for details). In Figure 3, the frequencies of the different phenotypes on selected groups of populations are indicated on the map. The “campestris” phenotype is widely distributed all along continental Italy and Northern Corsica. This phenotype is absent in Sicily. The “reticulated” phenotype is mainly distributed in Calabria and in other Southern Italian areas (Figure 3); it is also common in Sicily, Sardinia and in Southern Corsica. The distribution of the “striped” phenotype matches with that of “campestris”. However, its frequency is considerably lower in all the southern parts of the peninsular range corresponding to Calabria region. The intermediate “reticulated/campestris” phenotype is at low frequency with respect to the other phenotypes and its distribution overlaps the one of the “reticulated” phenotype. The “concolor” phenotype is distributed at a low frequency in different parts of the species range, especially in the southern region. It seems more frequent in one central Italian region (Campania) and very abundant in South-Eastern Sicily, as it is the most common phenotype and 20% of observations of this phenotype are found in this area.
The χ2 test confirmed the presence of statistically significant differences in the frequencies of various DPs between CN and SC lineages. “Campestris” and “striped” are more frequent in the CN lineage, whereas “reticulated” and “reticulated/campestris” are more frequent within the SC lineage and “concolor” showed no association with any lineage (Figure 4). Statistically significant differences were also detected between A and T clades, due to the higher frequencies of reticulated individuals in the latter, and between Calabria (S1 + S2) and Sicily (S3).

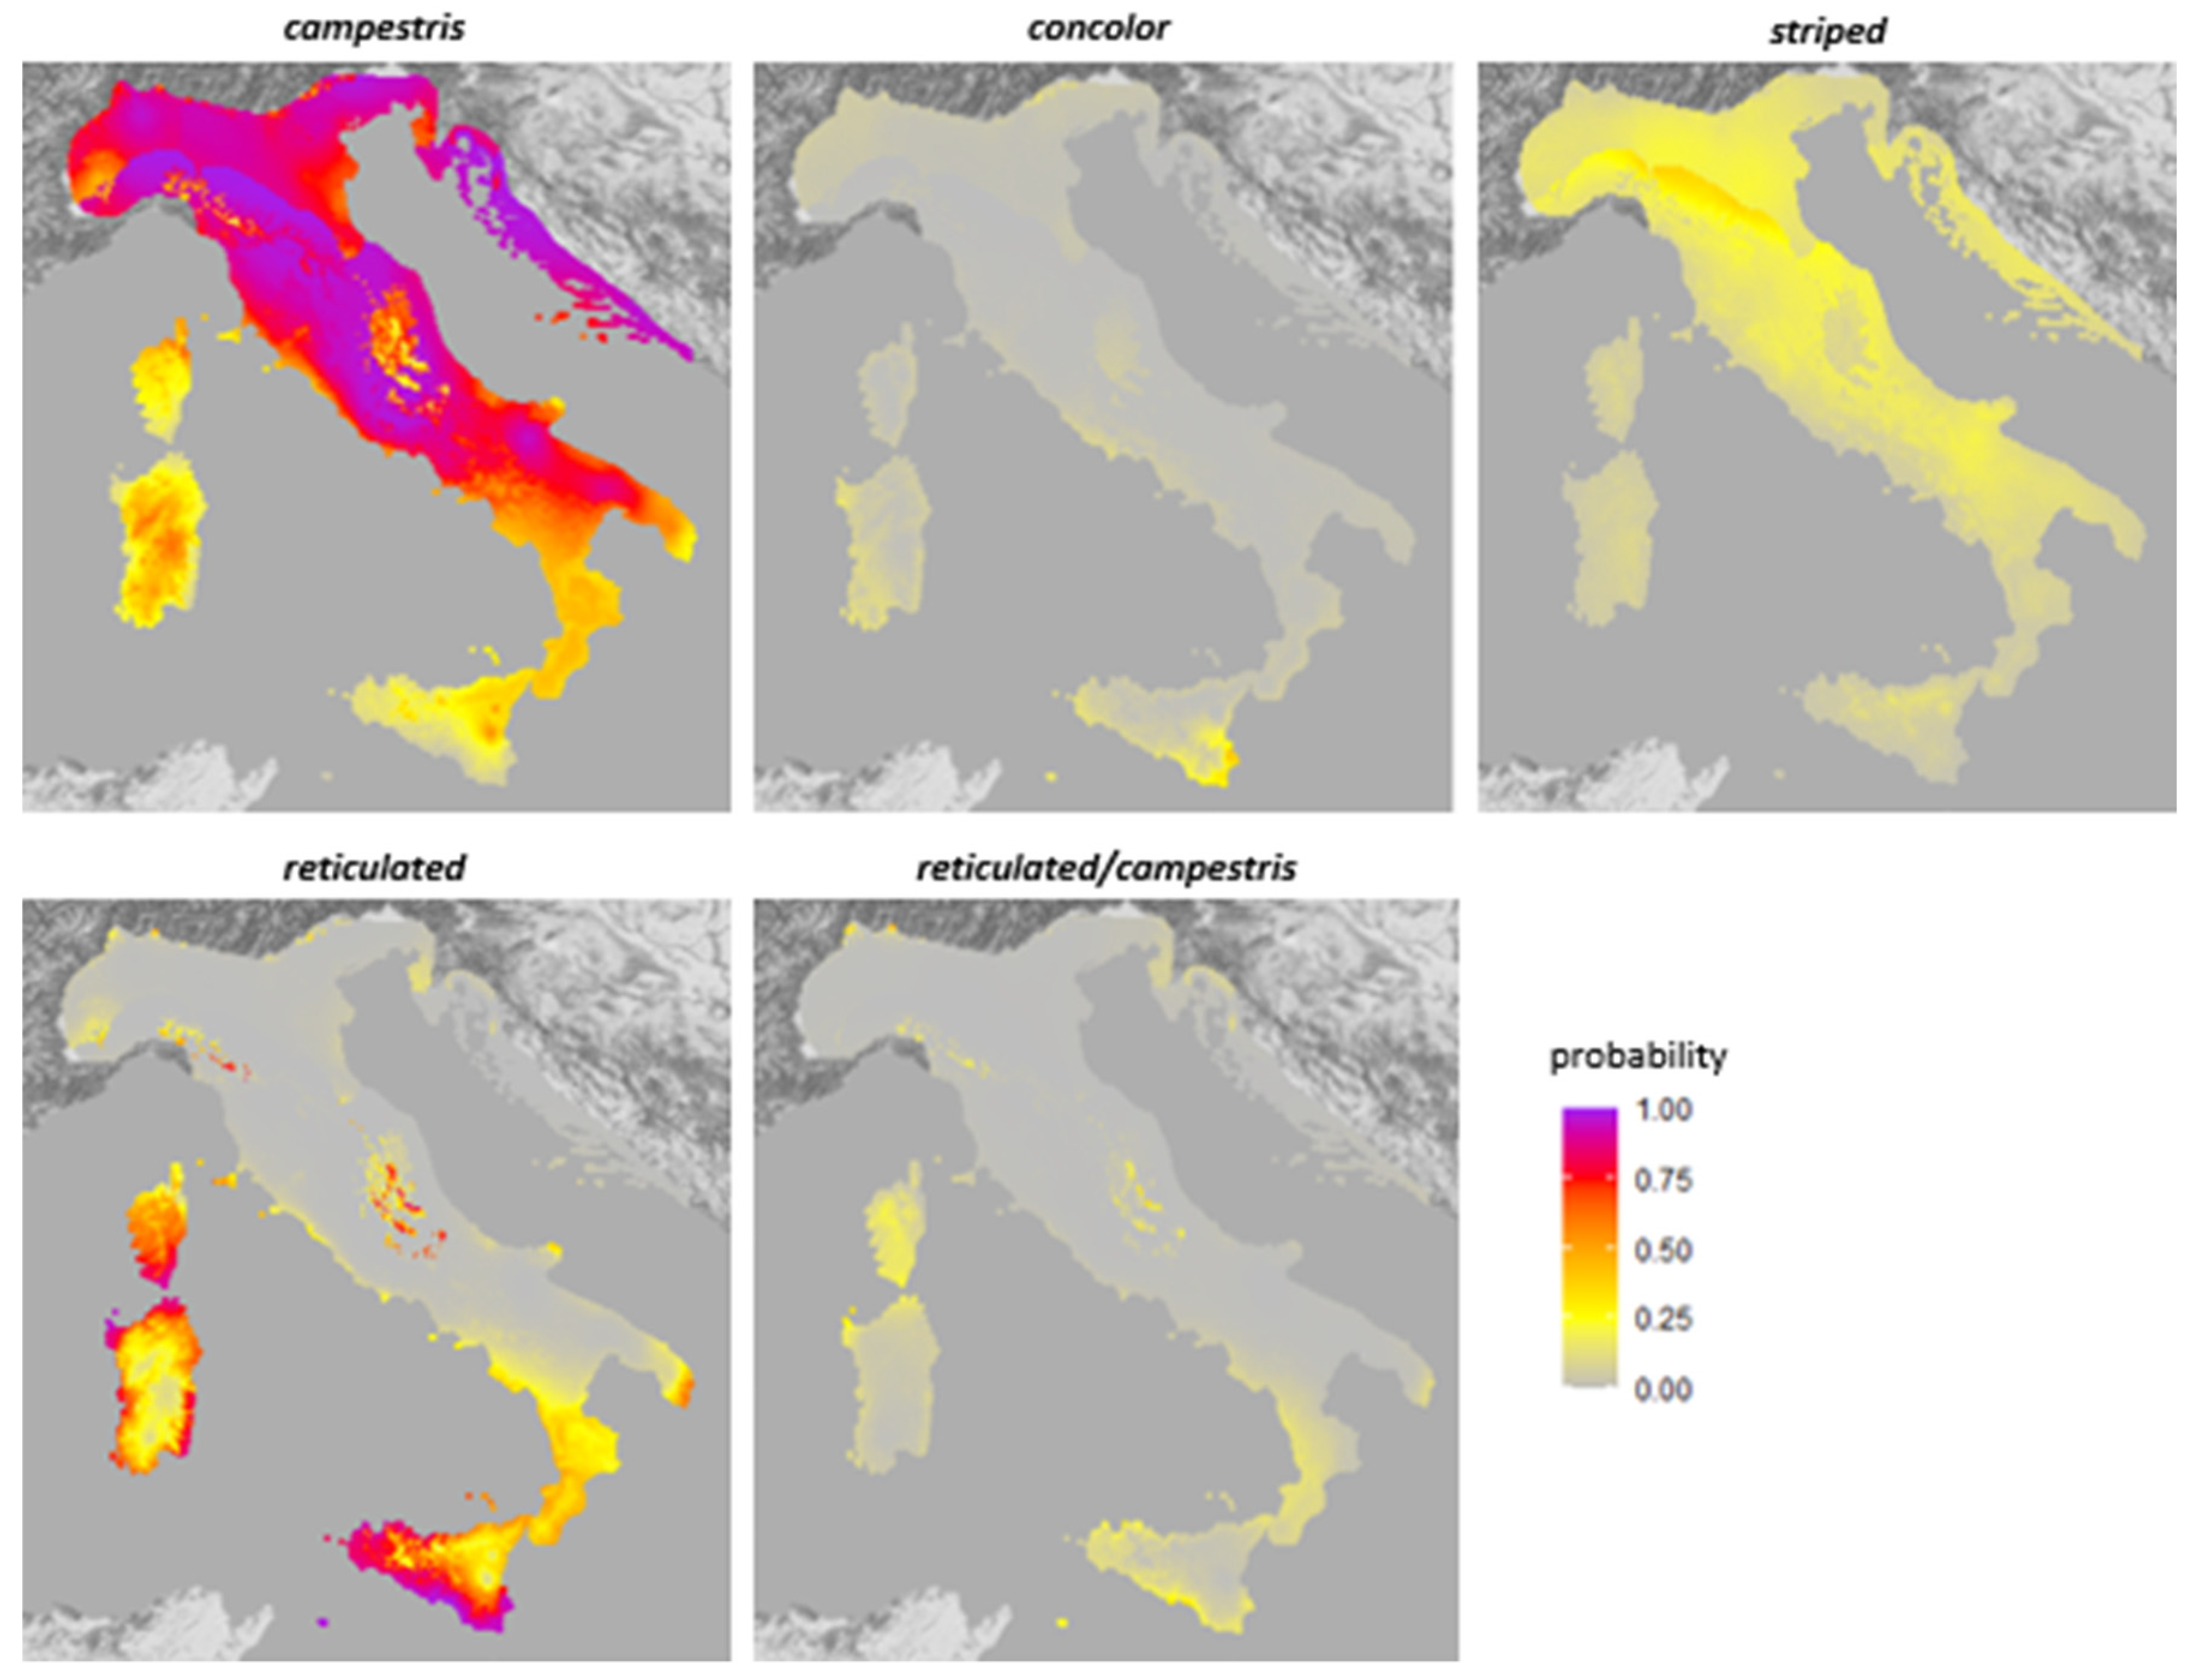
3.2. Generalized Linear Models

The AIC values for GLMs of each phenotype compared to the respective null model AIC are shown in Table 1. Every model shows always a better (lower) AIC value respect to the null models. Therefore, environmental heterogeneity-based models are better explainers of the observed phenotypic distributions rather than null models. This indicates that there probably is a bioclimatic determinant that can possibly drive phenotypic frequencies. GLM-based predictions have an AUC > 0.7 for every phenotype except for “striped” (AUC = 0.660). In particular, prediction performances are excellent for “reticulated” (AUC = 0.934), good for “campestris” and “reticulated/campestris” (AUC > 0.8) and moderately good for “concolor” (AUC = 0.713).
The “campestris” phenotype shows a positive correlation with PC1 (temperature seasonality, minimum temperature of the coldest month—negative loading), precipitation of the warmest quarter) and PC2 (mean diurnal range, isothermality) and a negative relation with PC3 (annual precipitation—negative loading) and PC4 (mean temperature of the driest quarter—negative loading). All these relations are statistically supported (p-values < 0.05, Table 2). Therefore, this phenotype appears to be associated to lower temperatures, higher precipitations and high seasonality. According to our predictive models based on environmental heterogeneity, the highest probability to find “campestris” individuals is in mountain areas of continental Italy with the exception of the highest altitude mountains, and in the Po valley at the northern part of the species range. Conversely, coastal areas, Sardinia, Corsica and southern region show lower probability values (Figure 5).
The “concolor” phenotype shows statistically supported relations (positive correlation) with PC4 only (mean temperature of the driest quarter—negative loading) (Table 2). The GLM predicts “concolor” individuals to be very uncommon in all P. siculus distribution range, except for south-eastern Sicily showing the highest probability, west Sardinia and a few more coastal areas (Figure 5).
The “striped” phenotype shows statistically supported relations with PC1 and PC4 (Table 2). There is a positive correlation with PC1 (temperature seasonality, minimum temperature of the coldest month—negative loading; precipitation of the warmest quarter) and a negative correlation with PC4 (mean temperature of the driest quarter—negative loading). As for “campestris”, this may represent an association to lower temperatures, higher precipitations and high seasonality. This phenotype is predicted to be mainly distributed in continental Italy but with lower probabilities values than “campestris” (Figure 5).
The “reticulated” phenotype shows a positive correlation with PC1 (temperature seasonality, minimum temperature of the coldest month—negative loading; precipitation of the warmest quarter) and PC3 (annual precipitation—negative loading) and a negative relation with PC2 (mean diurnal range, isothermality) and PC4 (mean temperature of the driest quarter—negative loading) (Table 2). All these relations seem to be statistically supported, except for PC3. Therefore, the “reticulated” phenotype appears to be associated to higher temperatures, low precipitations and seasonality and small temperature ranges. According to GLM predictions, the highest probability to find “reticulated” individuals is located in Sicily, Sardinia, Corsica and in some scattered areas in southern Italy and in the Apennines. Other areas with moderate probabilities are found along other coastal areas and all in Calabria (Figure 5).
The “reticulated/campestris” appears to be positively correlated with PC4 (mean temperature of the driest quarter—negative loading) and negatively correlated with PC1 (temperature seasonality, minimum temperature of the coldest month—negative loading; precipitation of the warmest quarter), PC2 (mean diurnal range, isothermality) and PC3 (annual precipitation—negative loading) but only the relationships with PC1, PC2 and PC4 are statistically supported (Table 2). As for “reticulated”, it seems to be associated with narrow temperature ranges and low precipitations. According to GLM, the probability to find this phenotype is higher in Southern Italy, specifically in some areas of Sicily, Sardinia, Corsica, Calabria and central Apennines (Figure 5).

4. Discussion

Among the genus Podarcis, the Italian wall lizard P. siculus shows one of the greatest genetic and phenotypic diversity, so much so that a species complex has been argued [28,41]. In this paper, frequencies and distributions of different DPs have been investigated in order to tentatively assess the relative role of historical (allopatric) and/or adaptive processes in driving their distributions. Other studies have investigated some characteristics of the dorsal surface of P. siculus in relation to environmental variables (e.g., [42,43]), but none in relation to the global genetic structure of the species. Here, data from a Citizen Science database (inaturalist.org) were obtained, allowing us to study the DPs distribution with an unprecedent level of detail.
Our results showed that the DP phenotypes, except the “concolor”, are significantly associated with the two main mitochondrial lineages (CN and SC lineages, Senczuk et al., 2017). Indeed, while the “campestris” and the “striped” phenotypes are mainly distributed within the CN lineage, the “reticulated” and the “reticulated/campestris” DP are mainly distributed within the range of the SC lineage (Figure 2 and Figure 3).
Despite this correspondence, a certain discrepancy between distribution of DPs and mitochondrial data can be noted. In fact, while the contact zone of the two mtDNA lineages is restricted to an area of about 50 km in central Calabria, where both lineages can be found (Figure 2), there is a mixture of DP phenotypes characterizing both lineages (“reticulated/campestris”, “campestris”, “striped” and “reticulated”) spanning from southern Calabria reaching the Volturno Plain (Campania) that is approximately 350 km north of the border of the two mtDNA lineages. This area was repeatedly flooded by Middle Pleistocene marine transgressions, thus constituting an effective geographic barrier between previously separated populations [44,45] and represents a contact zone for many taxa [46,47,48]. The overall pattern is congruent with a wide introgression area with ongoing gene flow between CN and SC lineages spanning from southern Calabria to Volturno plain and this is also supported by microsatellites analyses (Senczuk et al., unpublished data).
A similar pattern with different extent of cline variation between genetic and phenotypic traits has also been found in northern Italy in the common wall lizard [49,50,51]. In this case, differences in phenotypic traits seem to have triggered the asymmetric introgression via male–male competition, therefore a similar mechanism to explain our phenotype/genetic discordance cannot be excluded and future studies should be addressed in such a direction.
The match between phenotypes and phylogeographic structure is also observable within the SC lineage, where differences in the frequency of DP phenotypes between Sicily (S3-clade) and Calabria (S1 + S2 clades) were found. These differences are due to the absence of “campestris” DP phenotypes in Sicily and to the high frequency of “concolor” phenotype in the south-eastern part of the island. This distinction in DP frequencies between Sicily and mainland Italy likely corresponds to the ancient origin of the Italian wall lizard in the island. In fact, the so-called Sicilian clade [28] separated from the mainland clades around 1.54 Mya and it is almost exclusive to Sicily with only two haplotypes found in the most southern part of Calabria. Although in this work a very wide geographical scale has been considered, it cannot be excluded that similar differences may also be found on a regional scale. For example, there are seven partially geographically separated haplogroups in Sicily [28] that can be related to other characteristics of the DP.
The dorsal coloration of P. siculus is known to be sexually dimorphic with males being more conspicuous than females [43] and this observation also is extended to the DP pattern here considered [22,23,52]. Specifically, within the CN lineage, the “striped” phenotype is known to be characteristic of females while the “campestris” is often found in males. However, this is not a rule and it became clear to us from the photos on iNaturalist that many of the “striped” phenotypes are males and the “campestris” are females (data not shown). With regard to the other common phenotypes (“reticulated” and “reticulated/campestris”) it does not seem to us that they are related to sex but we have not analyzed in detail the issue. Not having considered the sex of the individuals, due to the Citizen science approach, can lead to erroneous estimates of morph frequencies if the data are sex-biased. Such biases can arise if there are more pictures of one sex than the other in the iNaturalist database or if the adult sex ratio varies among different populations. In P. siculus, the males are probably the most photographed as they have larger dimensions and more vivid colours. However, it seems very unlikely that this phenomenon varies with geographical areas as the greater conspicuousness of males seems to be a constant feature throughout the species range [53]. Concerning the different sex ratio in different populations, the issue is difficult to assess because there are very scant data, in literature, on sex ratio of mainland populations [54]. In other Podarcis species, the observed geographical variation in adult sex ratio among mainland populations provided contrasting results. It can be of negligible magnitude (or absent) in some studies [55,56]. In one study on Pyrenean populations of P. muralis, the sex-ratio was very variable [57]. However, significant departures from 1:1 were present in a low number of local populations across a wide area. In fact, the overall sample, pooling males and females from all the populations, was not sexually biased. For these reasons, we are confident that the large sample size used in this work can compensate for the presence of eventual local variations of the sex ratio.
The results of GLMs show that each of the five DP patterns is correlated to different bioclimatic factors. Thus, while “campestris” and “striped” DPs show a greater suitability in elevated areas with low temperature and high precipitation, “reticulated” and “reticulated/campestris” have their greatest suitability areas along coastal areas of southern Italy, characterized by high temperatures and low precipitation. However, for “striped” DP the predictions showed lower AUC and ΔAIC between the null and the environmental heterogeneity-based model. This suggests that the distribution of this DP phenotype is mainly shaped by the allopatric history of the genetic lineages rather than by bioclimatic factors.
It may also be noted that some of the areas with the greatest bioclimatic suitability for every phenotype, especially “campestris” and “reticulated”, do not correspond exactly to the actual distribution of these DPs. In fact, for these phenotypes there are highly suitable areas where they are absent/sporadic and non-suitable areas where they are present at high frequency (see Supplementary Materials Figure S1). Furthermore, given the correspondence between mtDNA and phenotypes, it is difficult to establish whether the environmental preferences highlighted by the GLMs are linked to have a specific DP pattern or to belong to a clade and then having any other clade-related phenotypic trait that we did not consider in this paper. In the meantime, an adaptive component of the dorsal pattern cannot be excluded since it also possible that a recent adaptation of the DP patterns to the bioclimatic condition occurred in allopatry [58].
In this context, an exception is the “concolor” phenotype that it is the only phenotype whose distribution better corresponds to what is indicated by the GLM model. The “concolor” is an “extreme” phenotype characterized by uniform coloration, without any dorsal pattern and, although it can be very dark on some islands, in the study area the amount of melanin on the back is less than in the other DPs (Figure 1). The GLM results for “concolor” indicate a preference for areas with high temperature and low rainfall. Based on these observations, it can be reasonably assumed that “concolor” is a positively selected phenotype in areas with these particular climatic conditions. This could be due to its low amount of melanin, which could confer a better thermoregulation ability in high temperature environments to avoid overheating [25,26].
It should be pointed out that we have considered only some characters of the dorsal pattern, those that are commonly used to distinguish the different “morphs” of P. siculus. It is rather clear now that other characteristics of the dorsal surface are more closely related to environmental variables. In fact, it is already known that P. siculus is capable of altering dorsal coloration, to improve crypsis during seasonal change varying from green at the onset of spring, to brownish in the middle of summer and to a greyish color in October [42]. Furthermore, we noticed in our dataset that the extension of the reticulation pattern in terms of amplitude of the dark area on the dorsal surface is variable and could be related to climate as well as to particular substrates [59].
To conclude, the association between the two main mtDNA lineages and DP phenotypes suggests a role of long-term allopatric historical processes in molding the characteristics of the DPs. An adaptative divergence is particularly evident for the “concolor” phenotype that is not related to any mtDNA lineage but cannot be excluded for the other DPs in an allopatric scenario. A limitation of this study is that we did not consider the sex of the individuals. However, it would be interesting to include the sex in the study of DP P. siculus as well as other characteristics of the DP that have not been here considered. Moreover, a possible role of sexual selection at a more local level is possible and further studies should focus on the contact area identified in central-southern Italy. Finally, given the obvious limitations, the potential of using Citizen Science databases in obtaining a large amount of information in a short time on aspects related to the phenotypic variability of vertebrate species was highlighted.

Supplementary Materials

The following supporting information can be downloaded at: https://www.mdpi.com/article/10.3390/d14070519/s1, Figure S1: Geographic distribution of each phenotype; Table S1: Coordinates, characters codification, phenotypes and mtDNA clades of each iNaturalist observation; Table S2: BioClim variables and related codes; Table S3: PCA loadings; Table S4: Importance of components of PCA.

Author Contributions

Conceptualization, R.C.; methodology, F.G., P.C., G.S. and R.C.; data acquisition, F.G., R.C.; formal analysis, F.G. and P.C.; writing—original draft preparation, F.G. and R.C.; writing—review and editing, F.G., P.C., G.S. and R.C.; funding acquisition, R.C. All authors have read and agreed to the published version of the manuscript.

Funding

This research and the APC was funded by “Progetti di Ricerca Sapienza”, grant numbers RP11916B6F67B141 and RP11816430E2E16A.

Institutional Review Board Statement

Not applicable since the study is based on data retrieved from public databases.

Informed Consent Statement

Not applicable.

Data Availability Statement

Publicly available datasets were analyzed in this study. This data can be found here: https://www.inaturalist.org/.

Acknowledgments

We thank Claudia Corti and three anonymous reviewers for the suggestions helping to improve the manuscript. Thanks are extended to Flavia Annesi for English revision.

Conflicts of Interest

The authors declare no conflict of interest.

References

  1. Camargo, A.; Sinervo, B.; Sites, J.W., Jr. Lizards as model organisms for linking phylogeographic and speciation studies. Mol. Ecol. 2010, 19, 3250–3270. [Google Scholar] [CrossRef] [PubMed]
  2. Zamudio, K.R.; Bell, R.C.; Mason, N.A. Phenotypes in phylogeography: Species’ traits, environmental variation, and vertebrate diversification. Proc. Natl. Acad. Sci. USA 2016, 113, 8041–8048. [Google Scholar] [CrossRef] [PubMed] [Green Version]
  3. Lande, R. Natural selection and random genetic drift in phenotypic evolution. Evolution 1976, 30, 314–334. [Google Scholar] [CrossRef] [PubMed]
  4. Barton, N.H.; Mallet, J. Natural selection and random genetic drift as causes of evolution on islands. Philos. Trans. R. Soc. B Biol. Sci. 1996, 351, 785–795. [Google Scholar]
  5. Marshall, K.L.A.; Philpot, K.E.; Damas-Moreira, I.; Stevens, M. Intraspecific colour variation among lizards in distinct island environments enhances local camouflage. PLoS ONE 2015, 10, e0135241. [Google Scholar] [CrossRef] [Green Version]
  6. Smith, K.R.; Cadena, V.; Endler, J.A.; Kearney, M.R.; Porter, W.P.; Stuart-Fox, D. Color Change for Thermoregulation versus Camouflage in Free-Ranging Lizards. Am. Nat. 2016, 188, 668–678. [Google Scholar] [CrossRef] [Green Version]
  7. Moreno-Rueda, G.; González-Granda, L.G.; Reguera, S.; Zamora-Camacho, F.J.; Melero, E. Crypsis Decreases with Elevation in a Lizard. Diversity 2019, 11, 236. [Google Scholar] [CrossRef] [Green Version]
  8. Ortega, J.; López, P.; Martín, J. Conspicuous blue tails, dorsal pattern morphs and escape behaviour in hatchling Iberian wall lizards (Podarcis hispanicus). Biol. J. Linn. Soc. 2014, 113, 1094–1106. [Google Scholar] [CrossRef] [Green Version]
  9. Ortega, J.; Pellitteri-Rosa, D.; López, P.; Martín, J. Dorsal pattern polymorphism in female Iberian wall lizards: Differences in morphology, dorsal coloration, immune response, and reproductive investment. Biol. J. Linn. Soc. 2015, 116, 352–363. [Google Scholar] [CrossRef] [Green Version]
  10. Pérez i de Lanuza, G.; Font, E.; Carazo, P. Color-assortative mating in a color-polymorphic lacertid lizard. Behav. Ecol. 2013, 24, 273–279. [Google Scholar] [CrossRef] [Green Version]
  11. Eitzel, M.V.; Cappadonna, J.L.; Santos-Lang, C.; Duerr, R.E.; Virapongse, A.; West, S.E.; Kyba, C.C.M.; Bowser, A.; Cooper, C.B.; Sforzi, A.; et al. Citizen Science Terminology Matters: Exploring Key Terms. Citiz. Sci. Theory Pract. 2017, 2, 1–20. [Google Scholar] [CrossRef] [Green Version]
  12. Crall, A.W.; Jordan, R.; Holfelder, K.; Newman, G.J.; Graham, J.; Waller, D.M. The impacts of an invasive species citizen science training program on participant attitudes, behavior, and science literacy. Public Underst. Sci. 2012, 22, 745–764. [Google Scholar] [CrossRef] [PubMed] [Green Version]
  13. Tulloch, A.I.; Possingham, H.P.; Joseph, L.N.; Szabo, J.; Martin, T.G. Realising the full potential of citizen science monitoring programs. Biol. Conserv. 2013, 165, 128–138. [Google Scholar] [CrossRef] [Green Version]
  14. Simoniello, C.; Jencks, J.; Lauro, F.M.; Loftis, J.D.; Weslawski, J.M.; Deja, K.; Forrest, D.R.; Gossett, S.; Jeffries, T.; Jensen, R.M.; et al. Citizen-Science for the Future: Advisory Case Studies from Around the Globe. Front. Mar. Sci. 2019, 6, 225. [Google Scholar] [CrossRef] [Green Version]
  15. Devictor, V.; Whittaker, R.J.; Beltrame, C. Beyond scarcity: Citizen science programmes as useful tools for conservation biogeography. Divers. Distrib. 2010, 16, 354–362. [Google Scholar] [CrossRef]
  16. Hurlbert, A.H.; Liang, Z. Spatiotemporal Variation in Avian Migration Phenology: Citizen Science Reveals Effects of Climate Change. PLoS ONE 2012, 7, e31662. [Google Scholar] [CrossRef] [Green Version]
  17. Putman, B.J.; Williams, R.; Li, E.; Pauly, G.B. The power of community science to quantify ecological interactions in cities. Sci. Rep. 2021, 11, 1–8. [Google Scholar] [CrossRef]
  18. Silvertown, J.; Cook, L.; Cameron, R.; Dodd, M.; McConway, K.; Worthington, J.; Skelton, P.; Anton, C.; Bossdorf, O.; Baur, B.; et al. Citizen Science Reveals Unexpected Continental-Scale Evolutionary Change in a Model Organism. PLoS ONE 2011, 6, e18927. [Google Scholar] [CrossRef] [Green Version]
  19. Kerstes, N.A.; Breeschoten, T.; Kalkman, V.J.; Schilthuizen, M. Snail shell colour evolution in urban heat islands detected via citizen science. Commun. Biol. 2019, 2, 1–11. [Google Scholar] [CrossRef] [Green Version]
  20. Drury, J.P.; Barnes, M.; Finneran, A.E.; Harris, M.; Grether, G.F. Continent-scale phenotype mapping using citizen scientists’ photographs. Ecography 2019, 42, 1436–1445. [Google Scholar] [CrossRef] [Green Version]
  21. Lehtinen, R.M.; Carlson, B.M.; Hamm, A.R.; Riley, A.G.; Mullin, M.M.; Gray, W.J. Dispatches from the neighborhood watch: Using citizen science and field survey data to document color morph frequency in space and time. Ecol. Evol. 2020, 10, 1526–1538. [Google Scholar] [CrossRef] [PubMed] [Green Version]
  22. Arnold, E.N.; Burton, J.A.; Ovenden, D. Field Guide to the Reptiles and Amphibians of Britain and Europe; Collins: New York, NY, USA, 1978. [Google Scholar]
  23. Corti, C.; Lo Cascio, P. Lacertidi Italiani; L’epos: Milan, Italy, 1999. [Google Scholar]
  24. Lepetz, V.; Massot, M.; Chaine, A.S.; Clobert, J. Climate warming and the evolution of morphotypes in a reptile. Glob. Chang. Biol. 2009, 15, 454–466. [Google Scholar] [CrossRef]
  25. Sherbrooke, W.C.; Castrucci, A.M.D.L.; Hadley, M.E. Temperature Effects on in vitro Skin Darkening in the Mountain Spiny Lizard, Sceloporus jarrovi: A Thermoregulatory Adaptation? Physiol. Zool. 1994, 67, 659–672. [Google Scholar] [CrossRef]
  26. Gabirot, M.; Balleri, A.; López, P.; José, M. Differences in Thermal Biology Between Two Morphologically Distinct Populations of Iberian Wall Lizards Inhabiting Different Environments. In Annales Zoologici Fennici; Finnish Zoological and Botanical Publishing Board: Helsinki, Finland, 2013; Volume 50, pp. 225–236. [Google Scholar]
  27. Podnar, M.; Mayer, W.; Tvrtković, N. Phylogeography of the Italian wall lizard, Podarcis sicula, as revealed by mitochondrial DNA sequences. Mol. Ecol. 2005, 14, 575–588. [Google Scholar] [CrossRef] [PubMed]
  28. Senczuk, G.; Colangelo, P.; De Simone, E.; Aloise, G.; Castiglia, R. A combination of long term fragmentation and glacial persistence drove the evolutionary history of the Italian wall lizard Podarcis siculus. BMC Evol. Biol. 2017, 17, 1–15. [Google Scholar] [CrossRef] [Green Version]
  29. Senczuk, G.; Havenstein, K.; Milana, V.; Ripa, C.; De Simone, E.; Tiedemann, R.; Castiglia, R. Spotlight on islands: On the origin and diversification of an ancient lineage of the Italian wall lizard Podarcis siculus in the western Pontine Islands. Sci. Rep. 2018, 8, 1–12. [Google Scholar] [CrossRef] [Green Version]
  30. Kahle, D.; Wickham, H. ggmap: Spatial Visualization with ggplot2. R J. 2013, 5, 144–161. [Google Scholar] [CrossRef] [Green Version]
  31. Senczuk, G.; Harris, D.J.; Castiglia, R.; Mizan, V.L.; Colangelo, P.; Canestrelli, D.; Salvi, D. Evolutionary and demographic correlates of Pleistocene coastline changes in the Sicilian wall lizard Podarcis wagleriana. J. Biogeogr. 2019, 46, 224–237. [Google Scholar] [CrossRef] [Green Version]
  32. Hijmans, R.J.; van Etten, J. Raster: Geographic Analysis and Modeling with Raster Data. R Package Version 2.0-12. 2012. Available online: http://cran.r-project.org/web/packages/raster/raster.pdf (accessed on 5 April 2021).
  33. Avramo, V.; Senczuk, G.; Corti, C.; Böhme, W.; Capula, M.; Castiglia, R.; Colangelo, P. Evaluating the island effect on phenotypic evolution in the Italian wall lizard, Podarcis siculus (Reptilia: Lacertidae). Biol. J. Linn. Soc. 2021, 132, 655–665. [Google Scholar] [CrossRef]
  34. Yoon, S.; Lee, W.-H. Methodological analysis of bioclimatic variable selection in species distribution modeling with application to agricultural pests (Metcalfa pruinosa and Spodoptera litura). Comput. Electron. Agric. 2021, 190, 106430. [Google Scholar] [CrossRef]
  35. Xie, C.; Zhang, G.; Jim, C.; Liu, X.; Zhang, P.; Qiu, J.; Liu, D. Bioclimatic Suitability of Actual and Potential Cultivation Areas for Jacaranda mimosifolia in Chinese Cities. Forests 2021, 12, 951. [Google Scholar] [CrossRef]
  36. Gusmão, A.C.; Evangelista-Vale, J.C.; Pires-Oliveira, J.C.; Barnett, A.A.; da Silva, O.D. New records and modelling the impacts of climate change on the black-tailed marmosets. PLoS ONE 2021, 16, e0256270. [Google Scholar] [CrossRef] [PubMed]
  37. Janžekovič, F.; Novak, T. PCA—A powerful method for analyze ecological niches. In Principal Component Analysis–Multidisciplinary Applications; Intech Open: Vienna, Austria, 2012; pp. 127–142. [Google Scholar]
  38. R Core Team. R: A Language and Environment for Statistical Computing; R Foundation for Statistical Computing: Vienna, Austria, 2015. [Google Scholar]
  39. Merow, C.; Smith, M.J.; Silander, J.A., Jr. A practical guide to MaxEnt for modeling species’ distributions: What it does, and why inputs and settings matter. Ecography 2013, 36, 1058–1069. [Google Scholar] [CrossRef]
  40. Robin, X.; Turck, N.; Hainard, A.; Tiberti, N.; Lisacek, F.; Sanchez, J.-C.; Müller, M. pROC: An open-source package for R and S+ to analyze and compare ROC curves. BMC Bioinform. 2011, 12, 77. [Google Scholar] [CrossRef] [PubMed]
  41. Speybroeck, J.; Beukema, W.; Dufresnes, C.; Fritz, U.; Jablonski, D.; Lymberakis, P.; Martínez-Solano, I.; Razzetti, E.; Vamberger, M.; Vences, M.; et al. Species list of the European herpetofauna–2020 update by the Taxonomic Committee of the Societas Europaea Herpetologica. Amphibia-Reptilia 2020, 41, 139–189. [Google Scholar] [CrossRef]
  42. Pellitteri-Rosa, D.; Gazzola, A.; Todisco, S.; Mastropasqua, F.; Liuzzi, C. Lizard colour plasticity tracks background seasonal changes. Biol. Open 2020, 9, bio052415. [Google Scholar] [CrossRef]
  43. Storniolo, F.; Zuffi, M.A.L.; Coladonato, A.J.; Di Vozzo, L.; Giglio, G.; Gini, A.E.; Leonetti, F.L.; Luccini, S.; Mangiacotti, M.; Scali, S.; et al. Patterns of variations in dorsal colouration of the Italian wall lizard Podarcis siculus. Biol. Open 2021, 10, bio058793. [Google Scholar] [CrossRef]
  44. Romano, P.; Santo, A.; Voltaggio, M. Evoluzione geomorfologica della piana del fiume Volturno (Campania) durante il tardo Quaternario (Pleistocene medio-superiore—Olocene). Il Quat. 1994, 7, 41–56. [Google Scholar]
  45. Barra, D.; Romano, P.; Santo, A.; Campajola, L.; Roca, V.; Tuniz, C. The versilian transgression in the Volturno River plain (Campania, Italy): Palaeoenvironmental evolution and chronological data. Il Quat. 1996, 9, 445–458. [Google Scholar]
  46. Canestrelli, D.; Cimmaruta, R.; Nascetti, G. Population genetic structure and diversity of the Apennine endemic stream frog, Rana italica–insights on the Pleistocene evolutionary history of the Italian peninsular biota. Mol. Ecol. 2008, 17, 3856–3872. [Google Scholar] [CrossRef]
  47. Bisconti, R.; Porretta, D.; Arduino, P.; Nascetti, G.; Canestrelli, D. Hybridization and extensive mitochondrial introgression among fire salamanders in peninsular Italy. Sci. Rep. 2018, 8, 1–10. [Google Scholar] [CrossRef] [PubMed]
  48. Chiocchio, A.; Arntzen, J.; Martinez-Solano, I.; de Vries, W.; Bisconti, R.; Pezzarossa, A.; Maiorano, L.; Canestrelli, D. Reconstructing hotspots of genetic diversity from glacial refugia and subsequent dispersal in Italian common toads (Bufo bufo). Sci. Rep. 2021, 11, 1–14. [Google Scholar]
  49. Michaelides, S.N.; While, G.M.; Zajac, N.; Uller, T. Widespread primary, but geographically restricted secondary, human introductions of wall lizards, Podarcis muralis. Mol. Ecol. 2015, 24, 2702–2714. [Google Scholar] [CrossRef] [PubMed]
  50. Yang, W.; While, G.M.; Laakkonen, H.; Sacchi, R.; Zuffi, M.A.L.; Scali, S.; Salvi, D.; Uller, T. Genomic evidence for asymmetric introgression by sexual selection in the common wall lizard. Mol. Ecol. 2018, 27, 4213–4224. [Google Scholar] [CrossRef] [PubMed]
  51. Yang, W.; Feiner, N.; Laakkonen, H.; Sacchi, R.; Zuffi, M.A.L.; Scali, S.; While, G.; Uller, T. Spatial variation in gene flow across a hybrid zone reveals causes of reproductive isolation and asymmetric introgression in wall lizards*. Evolution 2020, 74, 1289–1300. [Google Scholar] [CrossRef]
  52. Corti, C.; Capula, M.; Luiselli, L.; Razzetti, E.; Sindaco, R. (Eds.) Fauna d’Italia, Reptilia; Calderini De Il Sole: Bologna, Italy, 2010; Volume XLV. [Google Scholar]
  53. Di Matteo, N.; Cavigioli, L.; Luiselli, L.; Andreone, F. Anfibi e Rettili D’Italia; Edizioni Belvedere: Latina, Italy, 2019. [Google Scholar]
  54. Zuffi, M.A.L.; Casu, V.; Marino, S. The Italian wall lizard, Podarcis siculus, along the Tuscanian coast of central Italy: Biometrical features and phenotypic patterns. Herpetol. J. 2012, 22, 207–212. [Google Scholar]
  55. Dietvorst, P.J.M.; Strijbosch, H.; Bonnemayer, J.J.A.M. The Northernmost Population of Podarcis muralis (Lacertilia, Lacertidae). Amphibia-Reptilia 1980, 1, 161–172. [Google Scholar] [CrossRef]
  56. Chondropoulos, B.P.; Lykakis, J.J. Ecology of the Balkan Wall Lizard, Podarcis taurica ionica (Sauria: Lacertidae) from Greece. Copeia 1983, 4, 991–1001. [Google Scholar] [CrossRef]
  57. Perez i de Lanuza, G.; Carretero, M.A.; Font, E. Intensity of male-male competition predicts morph diversity in a color polymorphic lizard. Evolution 2017, 71, 1832–1840. [Google Scholar] [CrossRef]
  58. Díaz, J.A.; Verdú-Ricoy, J.; Iraeta, P.; Llanos-Garrido, A.; Pérez-Rodríguez, A.; Salvador, A. There is more to the picture than meets the eye: Adaptation for crypsis blurs phylogeographical structure in a lizard. J. Biogeogr. 2017, 44, 397–408. [Google Scholar] [CrossRef] [Green Version]
  59. Miñano, M.R.; While, G.M.; Yang, W.; Burridge, C.P.; Sacchi, R.; Zuffi, M.; Scali, S.; Salvi, D.; Uller, T. Climate Shapes the Geographic Distribution and Introgressive Spread of Color Ornamentation in Common Wall Lizards. Am. Nat. 2021, 198, 379–393. [Google Scholar] [CrossRef] [PubMed]
Figure 1. (a) Position of the characters used to define the dorsal pattern phenotypes; parietal, supraciliar, and lateral stripes are indicated by red, blue, and yellow arrows, respectively (observation by Mirko Tomasi https://www.inaturalist.org/observations/51132755, accessed on 5 April 2021). (b) “Campestris” phenotype (observation by Renato Franzi, https://www.inaturalist.org/observations/42845479, accessed on 5 April 2021). (c) “Concolor” phenotype (observation by Peter Kennerley, https://www.inaturalist.org/observations/76986247, accessed on 5 April 2021). (d) “Striped” phenotype (observation by Daniele Seglie, https://www.inaturalist.org/observations/12779595, accessed on 5 April 2021), (e) “Reticulated” phenotype (observation by Riccardo Castiglia, https://www.inaturalist.org/observations/42465364, accessed on 5 April 2021). The “reticulated/campestris” phenotypes, (f,g), (observation by Giorgio De Simone, https://www.inaturalist.org/observations/48902707, accessed on 5 April 2021 and “martind” https://www.inaturalist.org/observations/28726011, accessed on 5 April 2021); the interrupted parietal stripe can be noted in both specimens (yellow arrows, see text for explanations).
Diversity 14 00519 g001
Figure 2. The geographical distribution of the main clades (A) and their phylogeny (B). Each dot represents a genotyped sample. The map and the phylogenetic tree are redrawn from Senczuk et al., 2017. In the map, the geographical region cited in the text is shown. The boundaries of the distribution of the different lines and clades are also indicated.
Diversity 14 00519 g002
Figure 3. Geographical distribution of phenotypic frequencies and mtDNA lineages/clades of Podarcis siculus in Italy.
Diversity 14 00519 g003
Figure 4. χ2 test results. Bar charts indicate the percentage of association of each phenotype with lineages (A), clades (B) or regions (C).
Diversity 14 00519 g004
Figure 5. Maps of predicted probabilities to find each phenotype according to GLM estimation.
Diversity 14 00519 g005
Table 1. AIC values for null and environmental heterogeneity-based models and AUC values for each phenotype.
AIC
PhenotypeNullEnv. Het.AUC
campestris1713.41251.50.843
concolor352.21317.830.713
striped846.79817.840.660
reticulated1315.9694.460.934
reticulated/campestris406.21340.370.841
Table 2. GLM Estimated regression coefficients, standard errors, z-values and p-values for each variable for each phenotype.
EstimateStd. ErrorZ Valuep-Value
campestrisIntercept1.208360.1206610.015<0.001
PC10.498780.060128.297<0.001
PC20.435600.057187.617<0.001
PC3−0.198210.09257−2.141<0.05
PC4−1.356330.20879−6.496<0.001
concolorIntercept−4.388030.42049−10.436<0.001
PC1−0.188690.18397−1.026>0.05
PC20.201440.144341.396>0.05
PC3−0.051470.24937−0.206>0.05
PC41.667560.551623.023<0.01
stripedIntercept−2.0256140.142466−14.218<0.001
PC10.1749220.0757952.308<0.05
PC2−0.0014890.079173−0.019>0.05
PC30.2435980.1443481.688>0.05
PC4−0.5001970.237406−2.107<0.05
reticulatedIntercept−3.651420.28494−12.815<0.001
PC1−0.828990.12458−6.654<0.001
PC2−0.767920.09469−8.110<0.001
PC3−0.117270.13413−0.874>0.05
PC42.493720.425125.866<0.001
reticulated/campestrisIntercept−4.76510.5621−8.478<0.001
PC1−0.43450.2523−1.722>0.05
PC2−0.57340.1727−3.321<0.001
PC3−0.73130.2540−2.879<0.001
PC41.18700.79481.493>0.05
Publisher’s Note: MDPI stays neutral with regard to jurisdictional claims in published maps and institutional affiliations.

