Article

Soil Arthropod Community in Spruce Forests (Picea abies) Affected by a Catastrophic Storm Event

1
Department of Chemistry, Life Sciences and Environmental Sustainability, University of Parma, Viale delle Scienze 11/A, 43124 Parma, Italy
2
Research Center for the Soil-Plant System, Viticulture and Oenology, Council for Agricultural Research and Economics, Via Trieste 23, 34170 Gorizia, Italy
*
Author to whom correspondence should be addressed.
Diversity 2022, 14(6), 440; https://doi.org/10.3390/d14060440
Submission received: 7 April 2022 / Revised: 21 May 2022 / Accepted: 27 May 2022 / Published: 30 May 2022
(This article belongs to the Special Issue State-of-the-Art Mediterranean Soil Arthropods Diversity)

Abstract

:
At the end of October 2018, the “Vaia” storm hit the eastern sector of the Italian Alps, causing major damage to forests. The resulting changes in habitat and resource availability are expected to shape the structure and abundance of soil communities. In this research, a soil arthropod community is studied one year after the catastrophic Vaia event in forests affected by the storm (W: Windthrow) to highlight the shift in the soil faunal community in a Mediterranean area increasingly impacted by climate change. Intact forests (IF) close to W were studied as a control condition and meadows (M) were considered to understand if W is moving toward a conversion to M or if the wooded character still prevails. Soil organic matter content was higher in IF than in W and M. The arthropod community was different between M and forests, both W and IF, while no differences were detected between W and IF considering the whole soil arthropod community. The Vaia catastrophic event does not appear to have radically changed the soil arthropod community and biodiversity after one year, despite upheaval to the vegetation cover, but the response is partially OTU (operative taxonomic unit)-specific. Hymenoptera adults and Coleoptera and Diptera larvae appear to be the most affected OTUs, showing lower abundance in W than IF. Conversely, Chilopoda seemed to benefit from the habitat changes, the result strongly related with the W condition. The two most present OTUs, Collembola and Acarina, were not affected by the Vaia storm. We may conclude that the soil system needs longer time to show a clear shift in the soil arthropod community.

1. Introduction

Ongoing global warming is causing a clearly discernible rise in the intensity and frequency of heat extremes, including heatwaves, heavy precipitation, windthrow, and floods, as well as droughts, in many regions of the world [1,2]. Although Mediterranean forest and shrub ecosystems represent only 2% of the world’s forest cover (with the 76% located in the European side of the Mediterranean), this region represents an interesting model system for the study of global change effects on terrestrial ecosystems since, being a transition zone between arid and humid regions of the world, it is especially sensitive to climate change [3]. In European forests, disturbance events caused by windthrow are the prime cause of ecosystem alterations, followed by fire and biotic agents [4]. Between 1950 and 2000 an annual average of about 0.15% of the total forest area was damaged by disturbance events, and storms were responsible for 53% of total damage [4]. Recent studies estimated that forest disturbance damage is expected to increase further in coming decades, estimated at +0.91 × 10⁶ m3 of timber per year until 2030 [5]. Natural disturbances such as wind, flood, drought, and fire have shaped ecosystems and organisms within the biosphere for millennia, and their influence on the structure and function of ecosystems has long been recognized [6,7,8]. Together with economic-related impacts, a depletion of ecosystem services is expected because of disappearing forested areas, including protection against landslides, avalanches, and floods and the impairment of the carbon cycle (i.e., soil carbon storage capacity) in such areas [9].
Wind disturbances have profound and long-term effects on soil properties, resulting in structural changes to the physical environment. The removal of canopy materials (e.g., branches and leaves) and the depositing of these materials on the forest floor is the first obvious effect of this type of event, causing an increase in dead wood supply [10,11]. Wind-uprooted trees can produce upturned root systems, inverting volumes of mineral soil and organic layers, redistributing and mixing mineral and organic soil horizons down to bedrock, and exposing the forest floor to light penetration [12]. Subsequent changes in decomposer community composition and structure may influence multitrophic food webs, species-specific interactions, and ecosystem stability [13]. It is likely that the structure and abundance of soil communities change in response to changes to their habitat and resource availability [14]. Windthrow seems to cause an overall increase in biodiversity compared to the intact forest, but most studies to date have concentrated on the effects of catastrophic events on invertebrates that live on the soil surface or are closely involved in dead wood decomposition processes [15,16]. Ref. [15] observed a clear difference between the windthrow area and intact forest in terms of arthropod diversity; more species were found in the windthrow areas, but differences were observed among different taxa. For example, Coleoptera was more abundant in the intact forest, due primarily to the presence of Carabidae and Scolytinae. As is well known, soil arthropods are an important component of soil-living communities and play key roles in maintaining soil health [17,18]. Many soil arthropod groups are involved in several processes, such as mineral and organic matter translocation, the break-up and decomposition of organic matter, nutrient cycling, soil structure formation, and, consequently, water regulation [19,20,21]. Extreme climate events leading to changes in microarthropod communities can alter belowground biological processes, with potential consequences for ecosystem functions [22]. Moreover, certain representatives of soil mesofauna (e.g., Collembola and Oribatida) have been observed to be good bioindicators, for example regarding changes in the soil of climax spruce stands affected by different management practices [23]. Many researchers have highlighted the importance of a clear understanding of the mechanisms and pathways underlying catastrophic events to interpret the existing ecosystem structure, devise effective strategies of ecosystem management and restoration and predict ecosystem responses to future changes in the disturbance regime [24,25].
At the end of October 2018, an unprecedented catastrophic event, the Mediterranean storm “Vaia”, hit the eastern sector of the Italian Alps, causing severe damage to forest and infrastructure. The Sirocco currents, boosted by their passage over the Mediterranean Sea, hit northeastern Italy, and affected an estimated area of 2,306,968 ha, covered mainly by woods of spruce, spruce-fir, and spruce–fir–beech trees, resulting in major damage and the complete wood destruction of about 42,500 ha [26,27]. With the damage of more than 8 million cubic metres of standing trees and, more importantly, the sudden reduction of forest-related ecosystem services, including protection against landslides, avalanches, and floods, the storm had unprecedented regional consequences. Considering the area involved in the Vaia storm event, we expected a change in soil living community composition caused by the creation of new habitats characterized by open spaces, more insolation, and more herbaceous vegetation, as well as more potential erosion and the leaching of organic matter content.
Few studies have been conducted on the effects of catastrophic events on the entire arthropod community, most studies focusing on individual groups, typically Collembola and Acari. The primary aim of this study was to characterize differences in the soil arthropod community between forest areas affected by the Vaia storm compared to areas having the same plant species composition not damaged by the storm. Considering the strong change in vegetation cover caused by Vaia (no standing plants and the presence of developing herbaceous vegetation), we assume that: (i) pH, soil organic matter content, and soil organic carbon will be affected by the new condition; (ii) inside the soil arthropod community, only some groups will be strongly affected by Vaia’s passage in relation to their vulnerability and level of adaptation to soil, while other ones could be not or positively influenced by the new condition; and (iii) the soil arthropod community in affected woods will show a limited shift toward a meadow condition, in terms of the number of taxa and abundance of each of them.

2. Materials and Methods

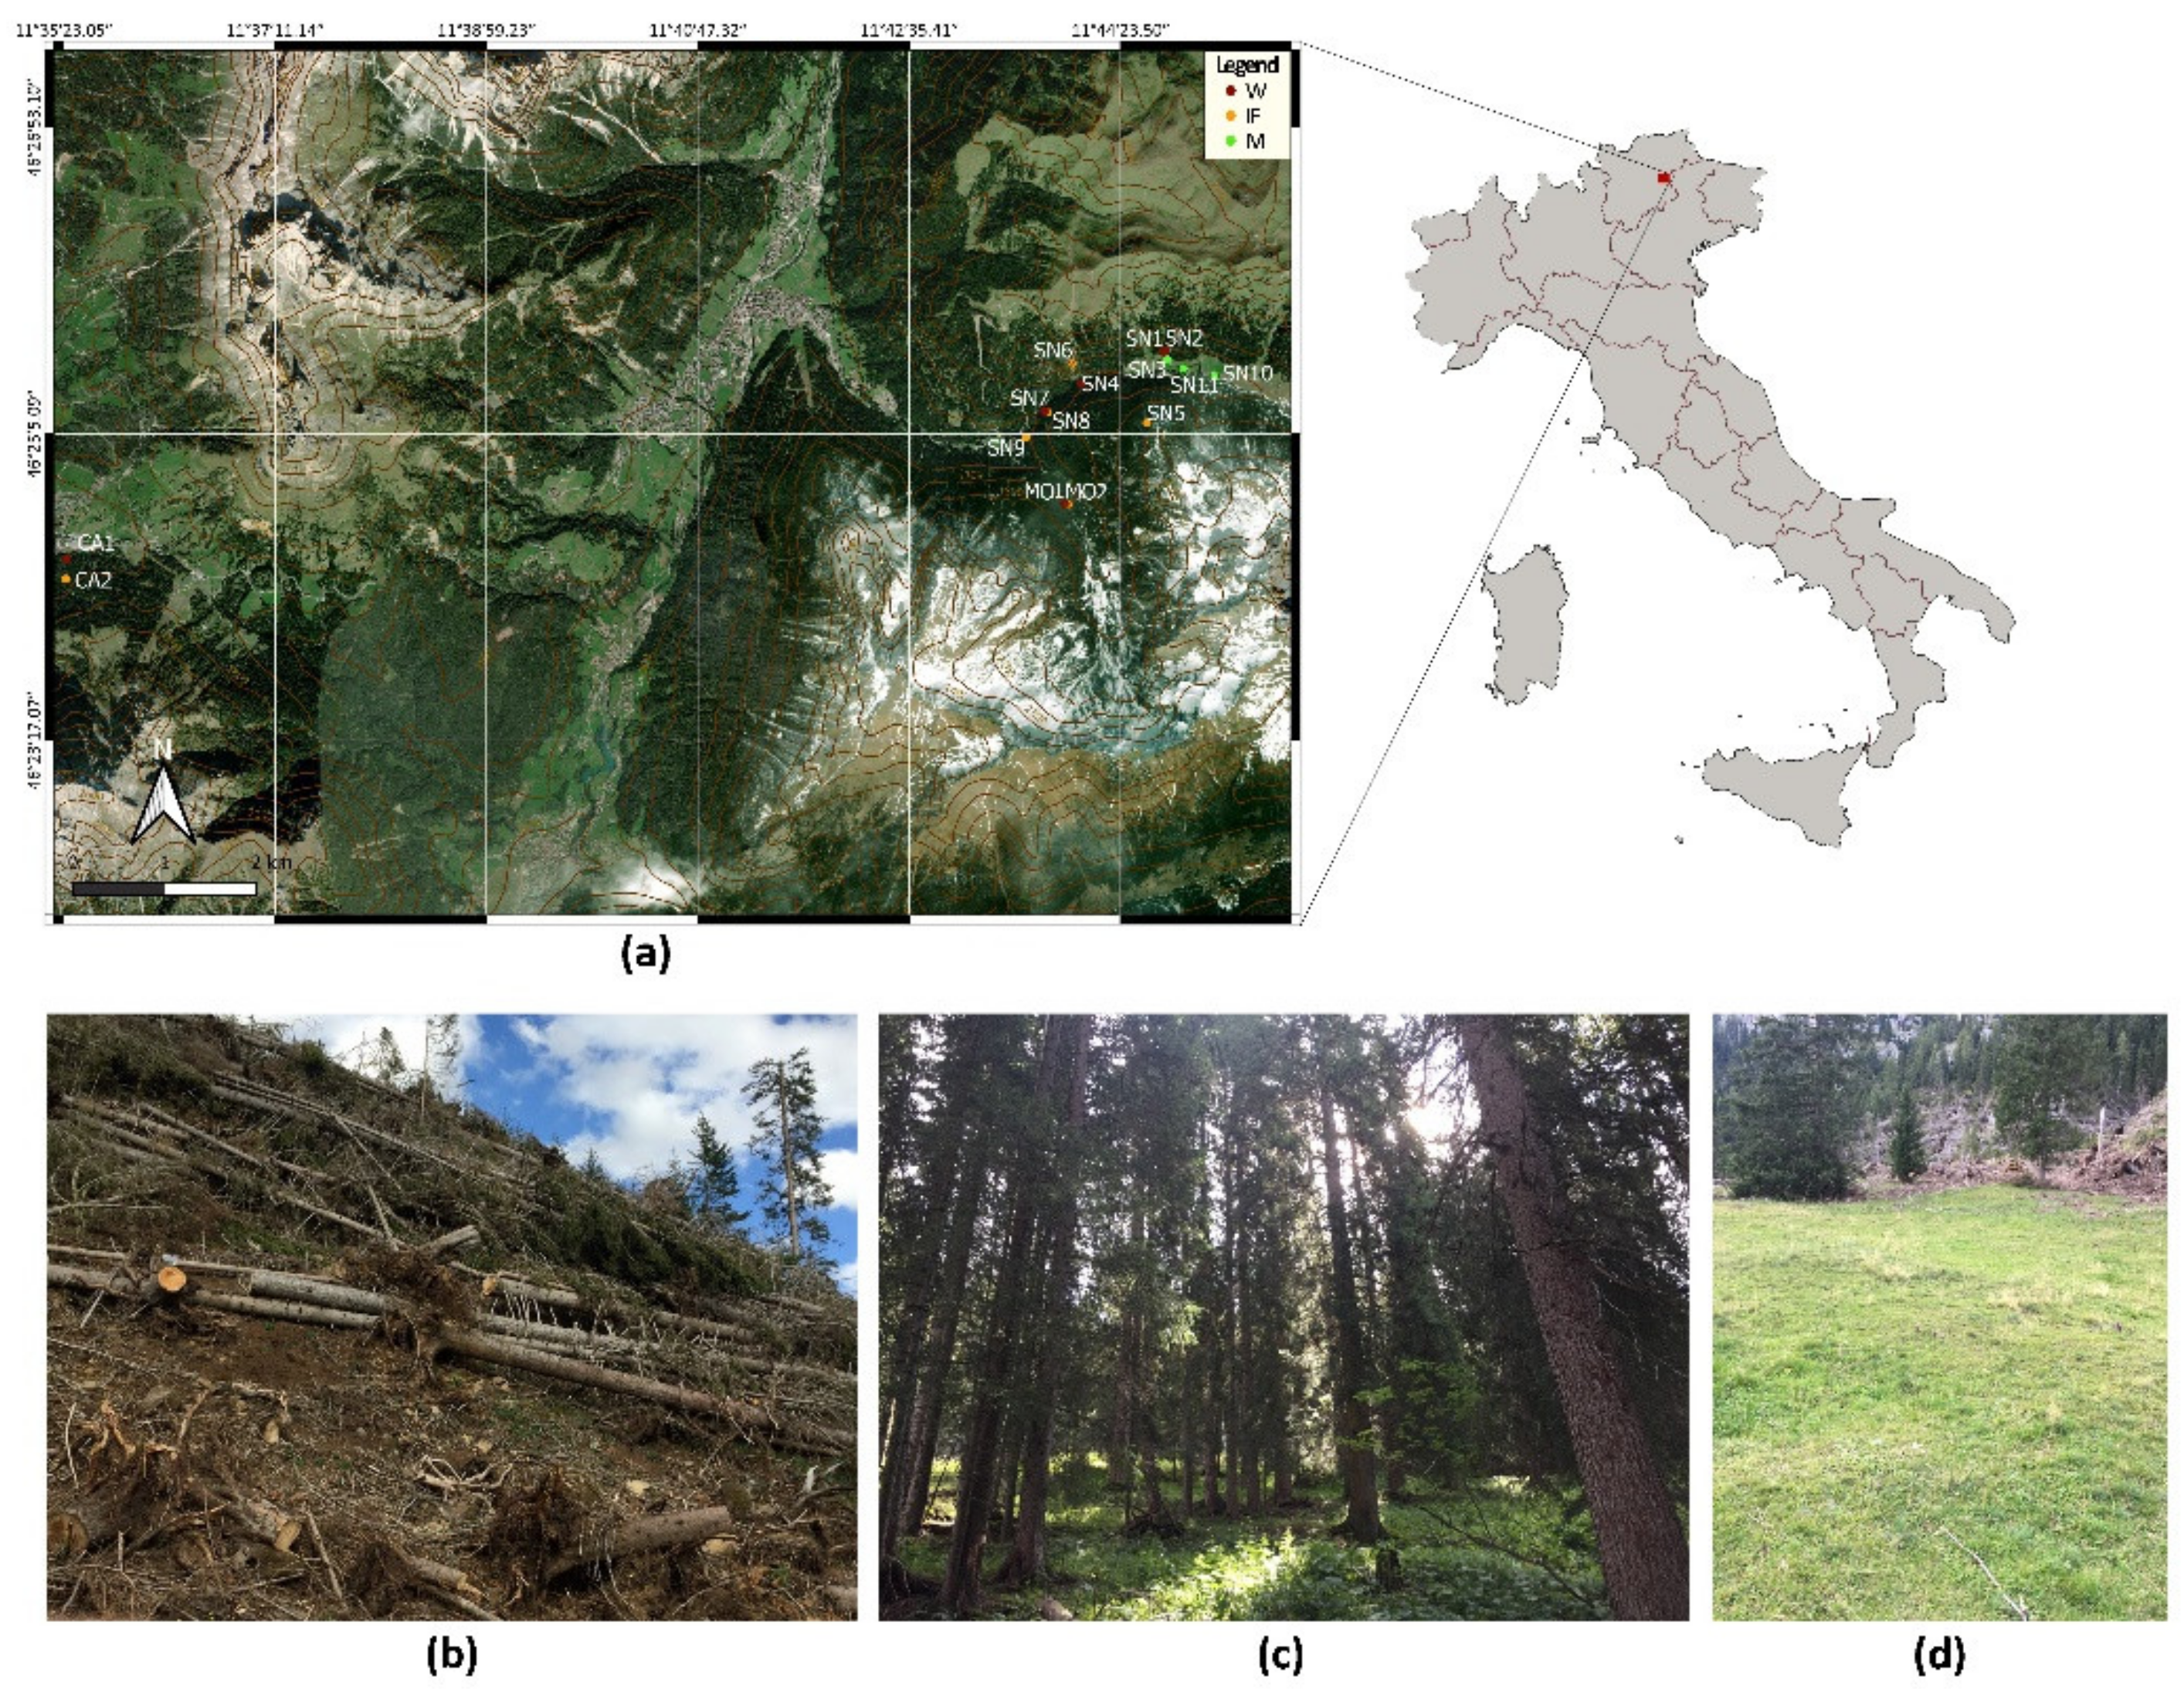
2.1. Study Area and Soil Collection

The Vaia storm affected the Italian regions of Trentino-Alto Adige and Veneto, followed by Lombardy, Friuli Venezia Giulia, and, marginally, Piedmont and Valle d’Aosta. The area under investigation is located in the Italian Dolomites, specifically in Val di Fassa, (Trentino-Alto Adige region), between 1500 and 2200 m a.s.l. (Figure 1a).
Geologically, the valley is formed by dolomite limestone. According to the Köppen–Geiger classification, the local climate is cold and temperate (Dfb). The average annual temperature is 2.4 °C, while annual precipitation is about 1885 mm. At an altitude of 2000 m, snow covers the soil surface from mid-November to the end of May. In the study area, vegetation is a managed forest of spruce (Picea abies) and larch (Larix decidua) at a higher elevation, which is set aside for wood production. Both vegetation strata show an understorey composed of fern. Meadow areas show alpine herbaceous vegetation mostly composed of Festuca genus, which is used as pasture for livestock. Soils in the forested areas are exposed to slopes varying from 20 to 45%. They are classified as Leptosols, showing a continuous hard rock between 25 and 100 cm, and the rock debris content is high. The A horizon is characteristic of Leptosols (i.e., high organic matter content and acid pH). Carbonate reactivity in the A horizon is found in the proximity of bedrock (determined using a 0.1 N HCl solution). Occasionally, an eluvial E horizon can be found over a cambic B horizon, which shows dissolved organic matter accumulation. On the other hand, meadow soils are typical of alpine valleys. In general, they are formed by the accumulation of sediments from adjacent peaks, and present soft slopes (5% max). They are classified as Umbrisols, which are variable in depth and often show a cambic B horizon. The concentration of organic matter in the A horizon is high because of the low temperature to which they are exposed, and pH is acid. Moreover, no carbonate activity was identified in the first 100 cm below the surface.
In this context, three conditions were evaluated in September 2019: (i) forests of P. abies affected by the Vaia storm (W: windthrow; six sites, Figure 1b); (ii) forests of P. abies not affected by the Vaia storm but adjacent to the forests impacted by the storm (IF: intact forest; six sites, Figure 1c); (iii) permanent meadows near the forests studied (M: meadows; three sites, Figure 1d). These 15 sites were distributed across three localities: Carezza, Val Monzoni, and Val San Nicolò (Figure 1a). At each study site three soil samples (3.5 dm3 at a depth of 0–10 cm, excluding leaf litter) were collected (for a total of 45 samples) 10 m from each other and, to avoid spatial autocorrelation, at least 20 m from the border of the condition to which the site belongs [29]. After sampling, soil samples were taken to the laboratory within 36 h for arthropod extraction and then chemical analyses.

2.2. Chemical Analyses

After arthropod extraction, each soil sample was homogenized and passed through a 2 mm sieve for chemical analyses (pH, soil organic matter (SOM), and carbonate analyses). pH was detected by placing a pH meter in a soil-distilled water–liquid mixture in a ratio 1:2.5 [30]. SOM and carbonate were determined by using LOI-loss on ignition, that is, through the ignition of 1 g of dried soil at 550 °C for 4 h (for SOM) followed by ignition at 950 °C for 2 h (for carbonate) [31].

2.3. Soil Arthropod Extraction

Arthropods were extracted using the Berlese–Tullgren funnel extractor (2 mm sieve mesh; extraction time 10 days), placing the specimens into vials containing a preservative solution (ethyl alcohol:glycerol in a ratio 3:1). The content of each vial was then analyzed using a 8×–50× stereomicroscope to sort specimens by operational taxonomic units (OTUs).
The OTU considered were: class level for Myriapoda and order level for Hexapoda, Chelicerata, and Crustacea. For mites, the OTUs were Oribatida and other Acarina, considered separately as a function of the close relationship of oribatids with soil organic matter. Moreover, within holometabolous insects (e.g., Coleoptera and Diptera), larvae were standalone OTUs considering the different trophic niches that they often occupy compared to adults. Based on these rules, the number of OTUs, and of specimens for each OTU, was counted, and abundance was expressed as ind./m2 (referring to the first 10 cm of topsoil). OTUs diversity (the Shannon diversity index and Simpson index of dominance) were calculated:
Shannon diversity index: H = −∑ Pi lnPi
Simpson diversity index: 1 − D = 1 − ∑ Pi2
where Pi = percentage of the individuals represented by OTU i on the total number of individuals. High diversity is indicated by high values of the Shannon index and Simpson index.

2.4. Statistical Analysis

The dataset consists of a community matrix, represented by the OTUs’ abundances (numerical data), and an environmental matrix, represented by soil sample background (condition, locality, and site; categorical data) and physicochemical parameters (pH, SOM, and carbonate concentration; numerical data).
The Durbin Watson test (in the car package [32], version 3.0-13) was applied to check the independence of the observations; then the homogeneity of variance and normality were checked using the Bartlett’s and Shapiro–Wilk tests, respectively. Considering that observation independence was assessed but data did not meet the other ANOVA assumptions, non-parametric analyses were carried out. The Kendall rank correlation coefficient between physicochemical parameters was calculated.
To test differences between conditions, the Kruskal–Wallis test, followed by the Mann–Whitney test, was applied to physicochemical parameters, arthropod abundances, number of OTUs, and diversity (Shannon and Simpson indices).
A distance matrix based on the Bray–Curtis dissimilarity was calculated using the vegan package (version 2.6-2) [33] on the community matrix (square-root transformed to minimize the influence of the most abundant OTUs). Then, a non-metric multidimensional scaling (NMDS) was performed to observe how conditions and physicochemical parameters influenced the grouping of arthropods communities. OTUs, referred to as intrinsic variables, and environmental variables, referred to as extrinsic variables, driving site distribution in NMDS were determined using the “envfit” function. The results were plotted in the NMDS ordination diagram, fitting them onto the first two axes. To support NMDS, a permutational multivariate analysis of variance (PERMANOVA) was used to test differences in arthropod assemblages determined by condition and physicochemical parameters, followed by a pairwise multilevel comparison for categorical factors using the pairwiseAdonis package (version 0.4) [34]. A strata option including sample locality and site was applied.
OTUs that are associated with a particular condition and the statistical significance of the association were determined using a permutation test between OTUs and conditions, using the “multipatt” function from the indicspecies package (version 1.7.12) [35].
For further analysis on soil fauna, only W and IF were considered to focus on the impact of windthrow on OTU behavior in forests.
To understand which data contributed most to overall variability, considering that our dataset contains both quantitative and qualitative variables, the factor analysis of mixed data (FAMD) was run [36]. FAMD data were computed and presented using the FactoMineR (version 2.4) and factoextra (version 1.0.7) packages, respectively [37,38].
Generalized additive models (GAMs), using the mgcv package (version 1.8-40) [39], were designed to investigate OTU abundance behavior in response to the environmental predictors contained in our data. Arthropod abundance and the number of OTUs, as well as the abundance of those OTUs that contributed most to the first two dimensions of FAMD, were used as dependent variables. To account for zero inflated count data and overdispersion, the “quasi-poisson” family was specified. Model parameters were chosen taking steps based on generalized cross validation scores (GCV), as an estimate of the mean square prediction error based on a leave-one-out cross validation estimation process [40]. The criterion for model selection of non-Gaussian families was based on the deviance explained (at least 50%), considering that is a preferred selection criterion for non-Gaussian families [39]. For all the models, a random effect (locality and site from which data belonged) was considered to seek spatial dependence of the response variables.
OTUs representing less than 0.02% of total individuals extracted were not considered for statistical models to avoid overfitting. A p-value ≤ 0.05 was considered significant. All analyses were performed using R (version 3.6.3) [41].

3. Results

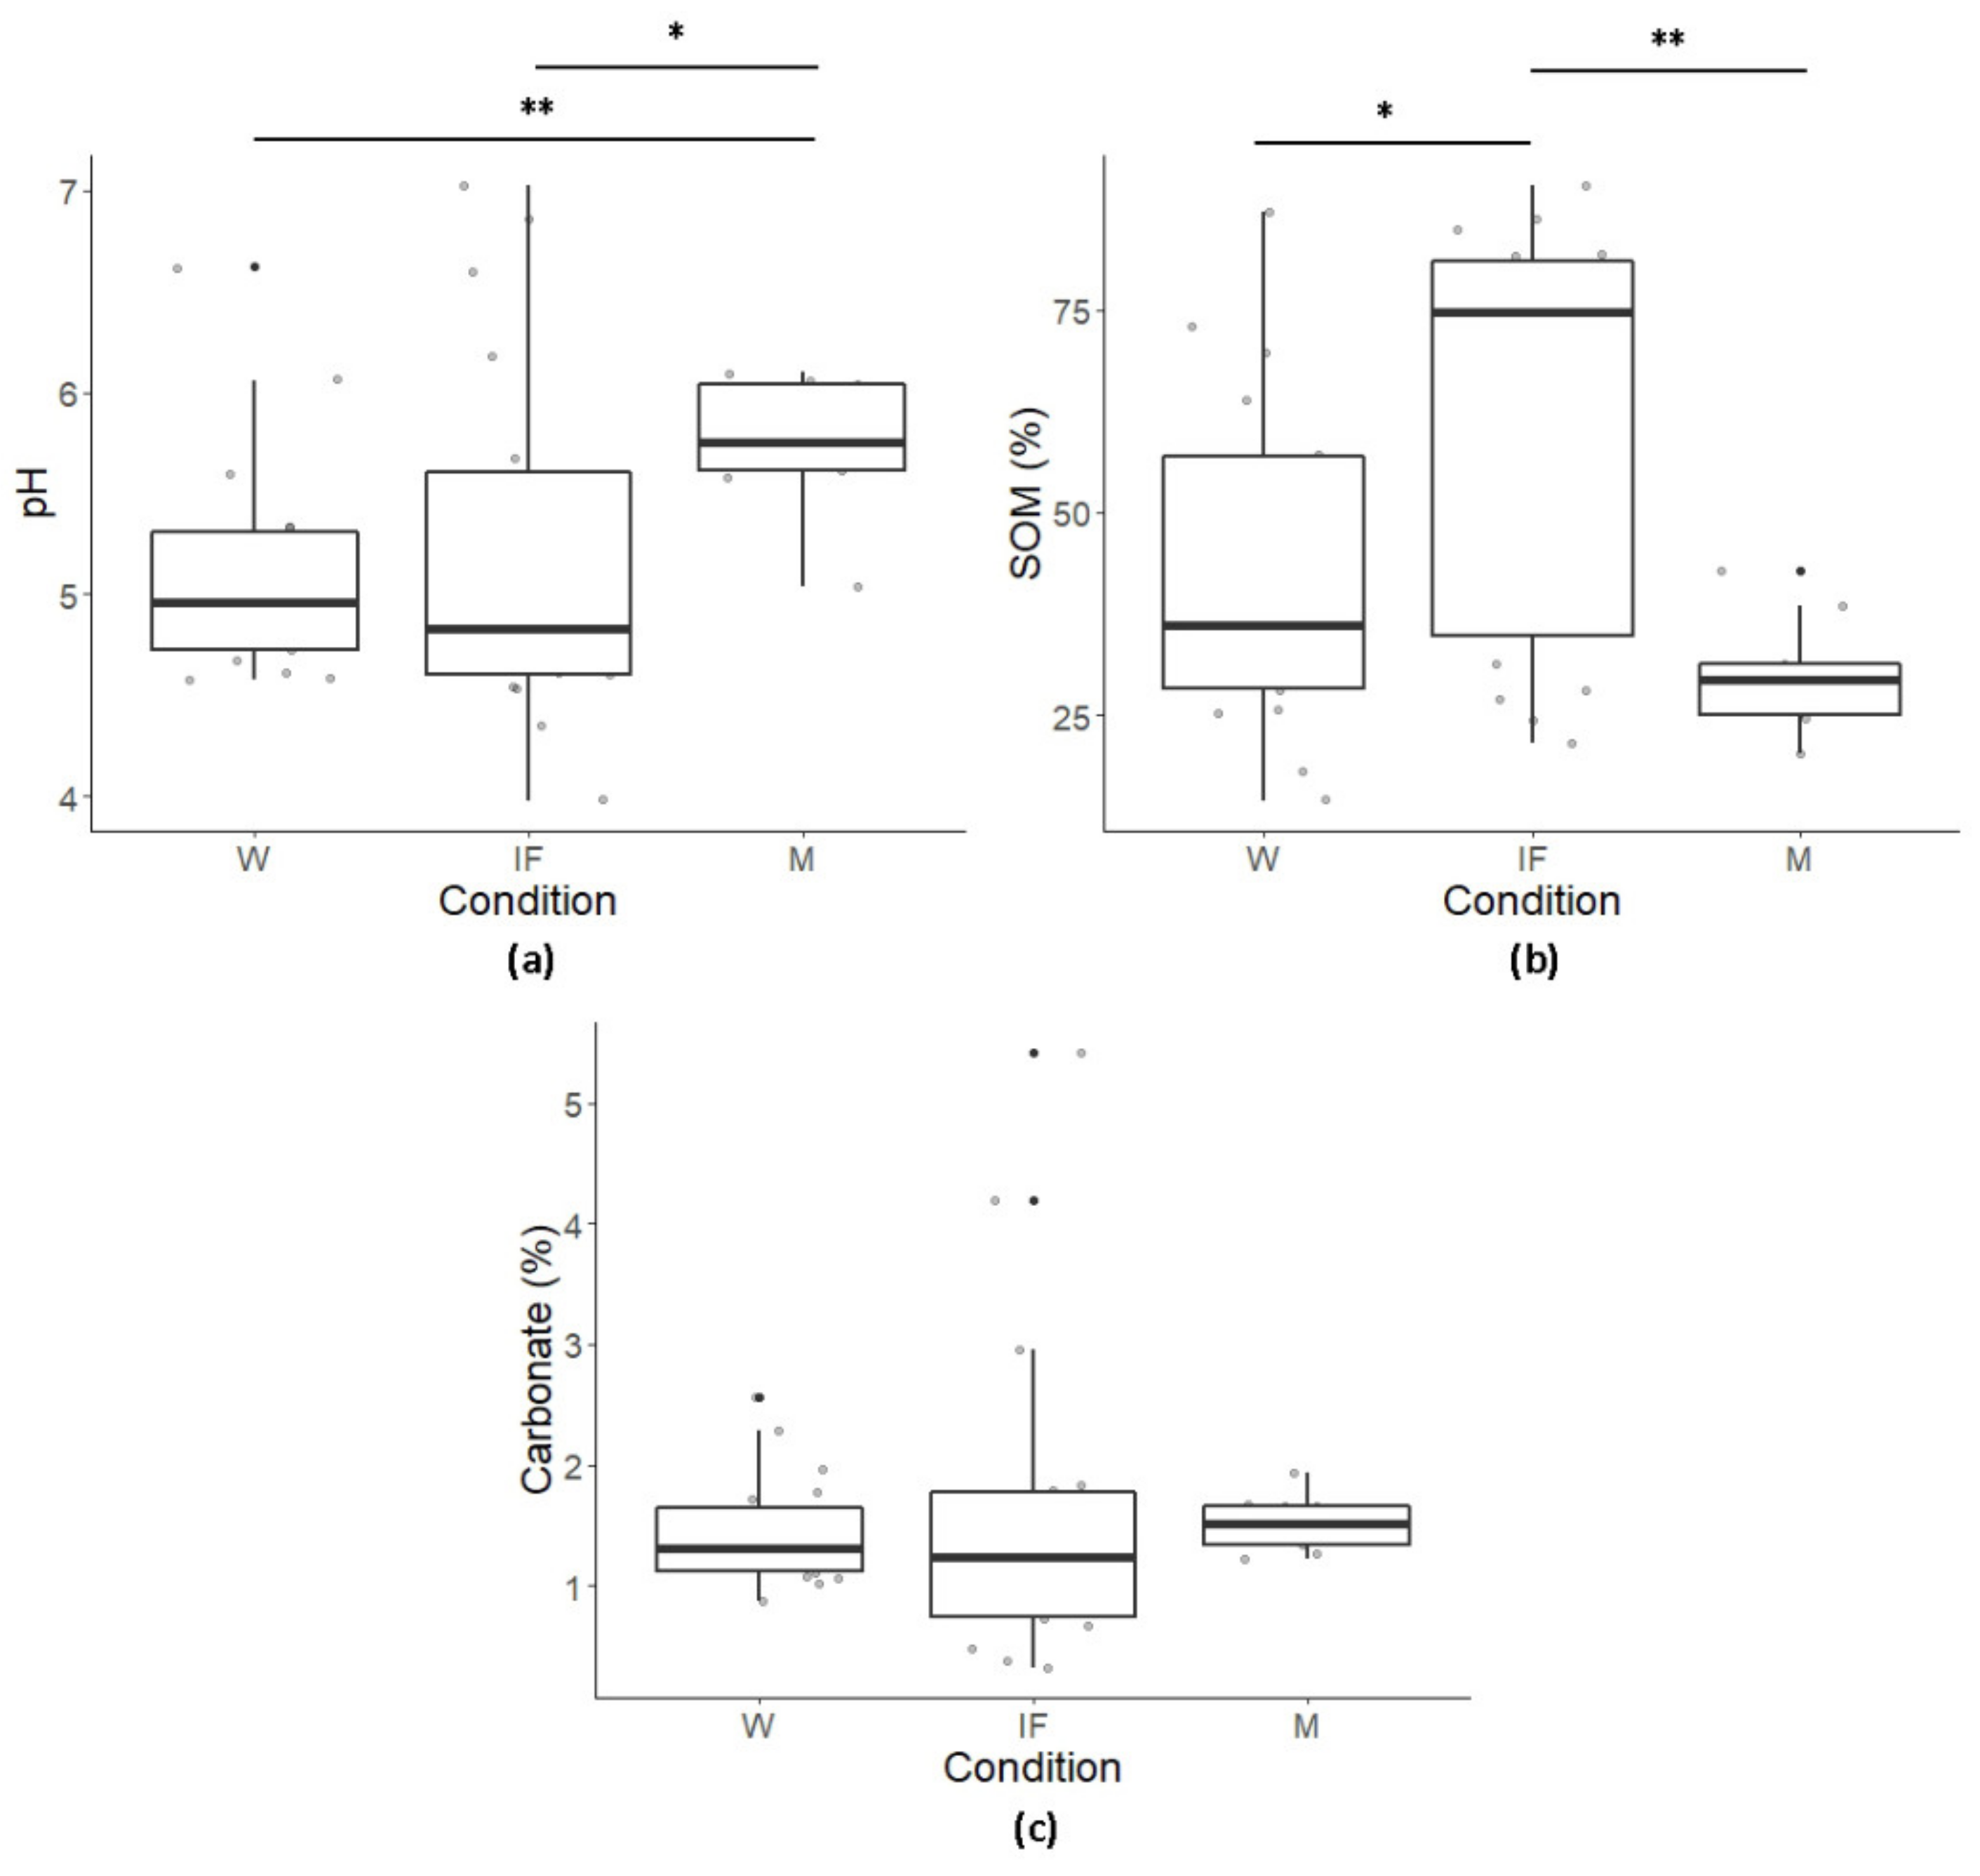
3.1. Chemical Parameters

The pH, ranging between 3.98 and 7.02, both in W, was classified as acid neutral (Figure 2a; the results for pH, SOM (%) and carbonate (%) at each site are given in Table S1 in Supplementary Materials).
The SOM content (%) in collected samples ranged between 14.57% and 87.12% in W, 21.55% and 90.21% in IF, and between 20.22% and 42.79% in M (Figure 2b; Table S1 for each site). Carbonate (%) showed the highest and the lowest values (5.42% and 0.32% respectively) both in IF (Figure 2c; Table S1 for each site).
Differences between conditions for both pH and SOM were highlighted (p ≤ 0.01 for both; Figure 2a,b), but not for carbonate (Figure 2c), showing more alkaline conditions in M than in forests (p < 0.01 when compared to W; p < 0.05 when compared to IF), and a higher SOM content in IF than in W and M (p < 0.05, and p < 0.01, respectively).
Correlations between physicochemical parameters were detected: positive relations between pH and carbonate (τ = 0.45 p < 0.001), and negative between pH and SOM (τ = −0.23 for p < 0.05), and SOM and carbonate (τ = −0.34 p < 0.001), were highlighted.

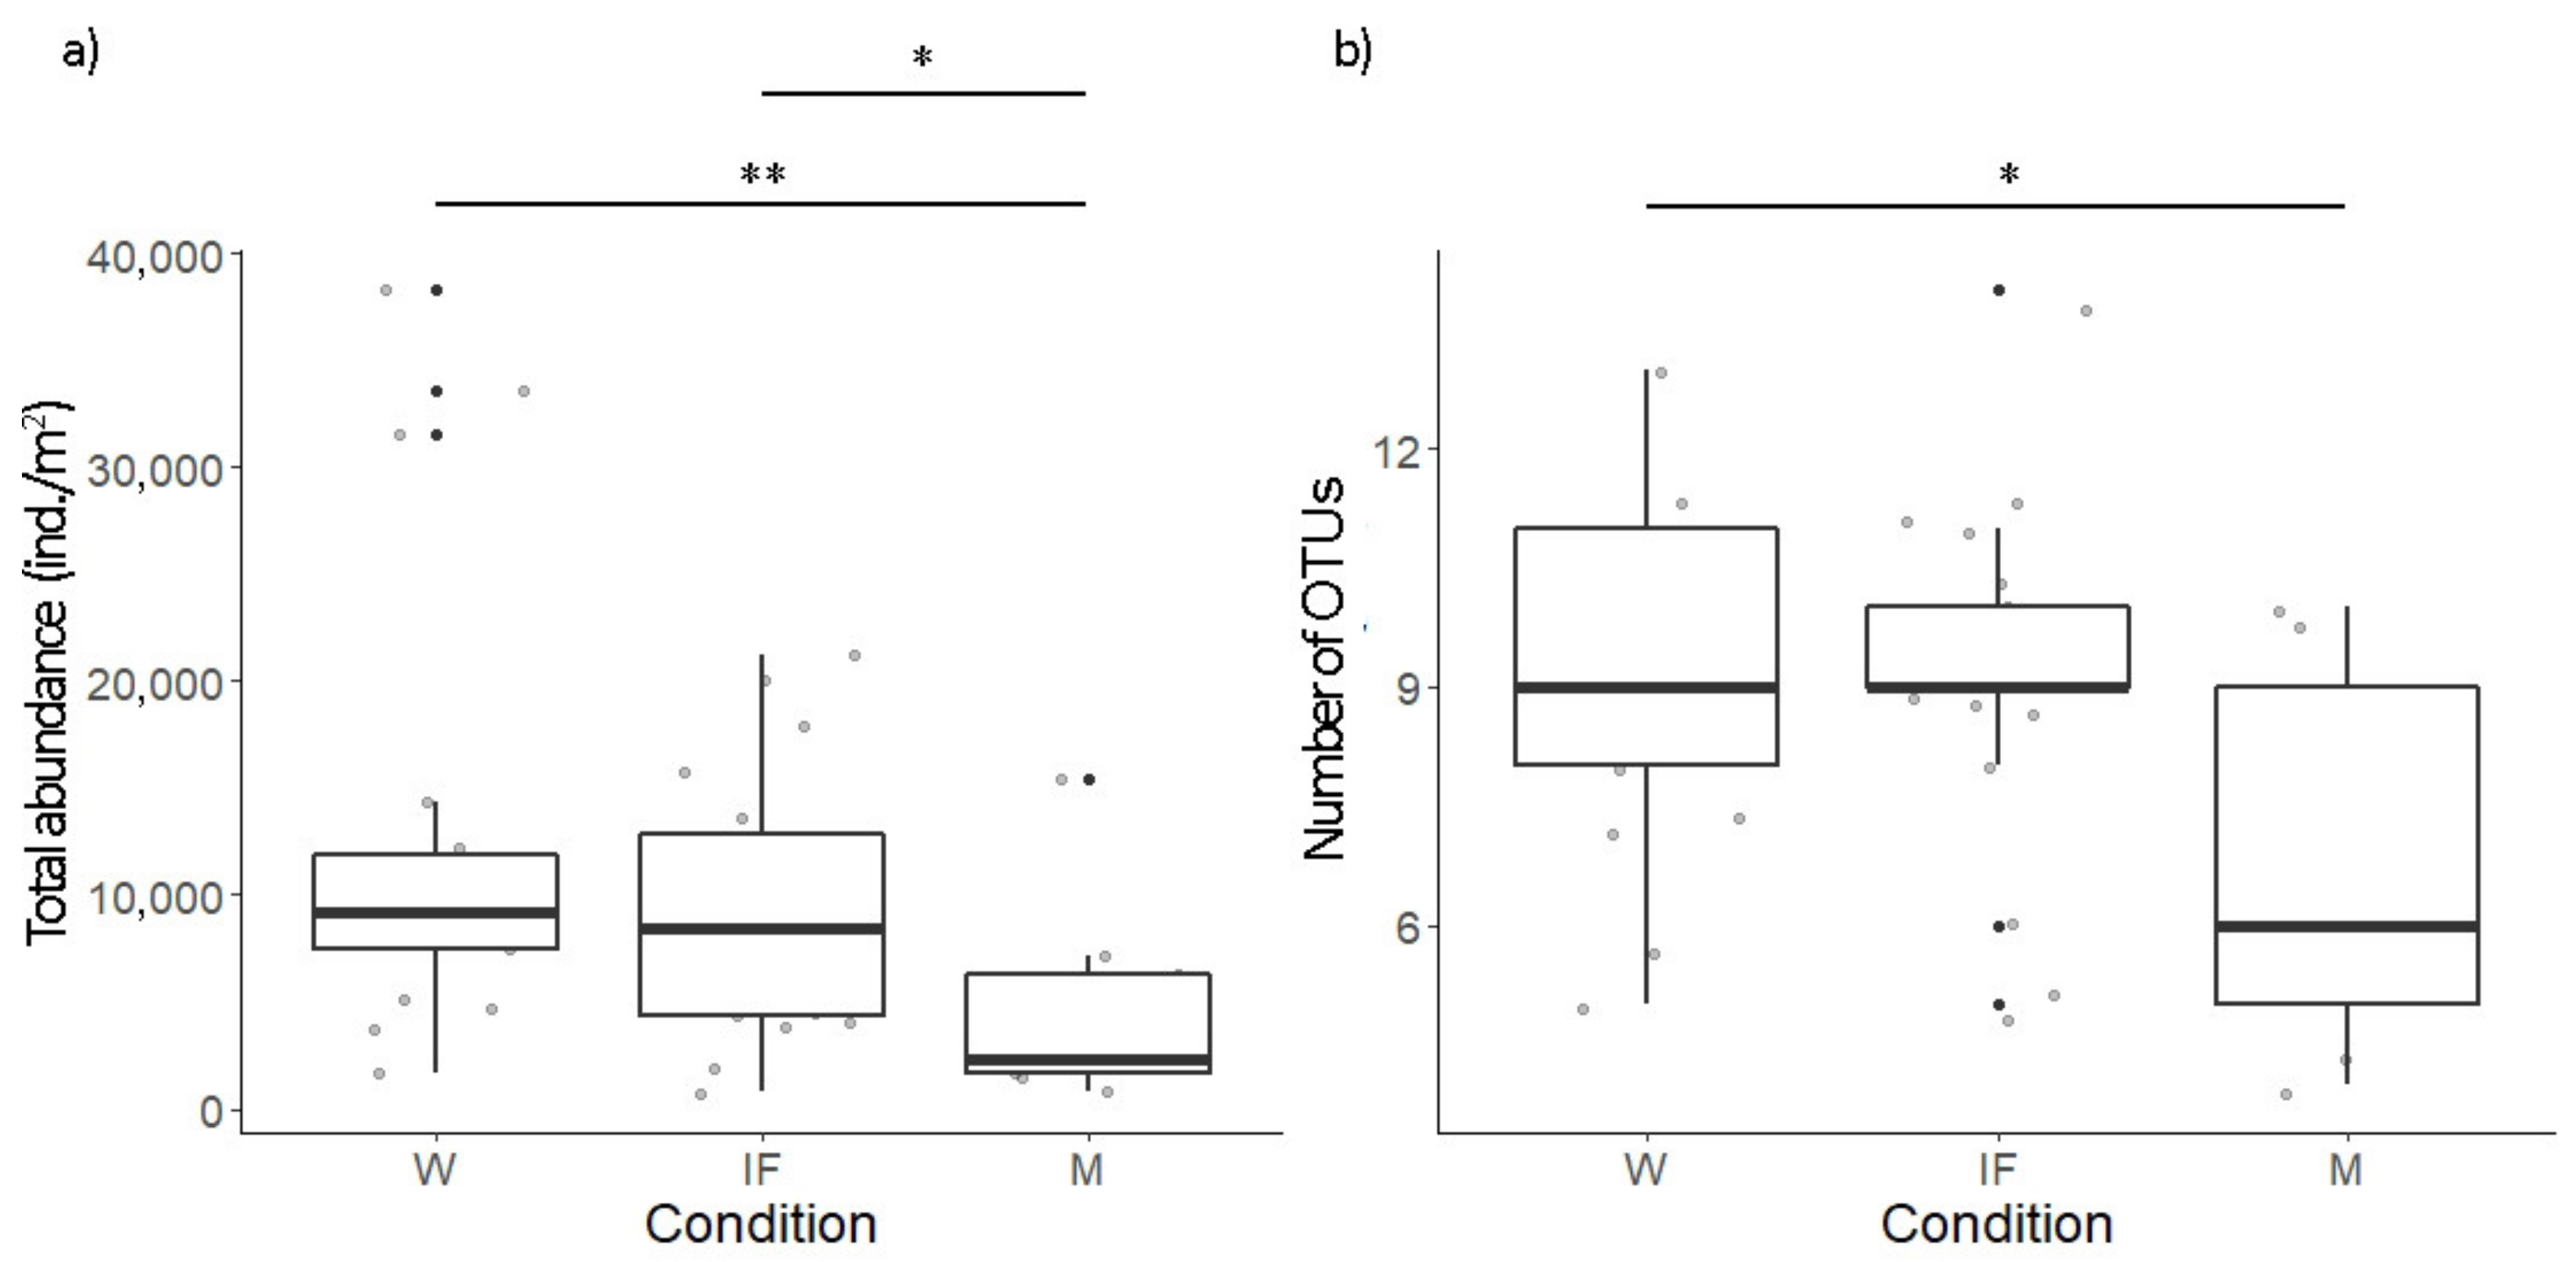
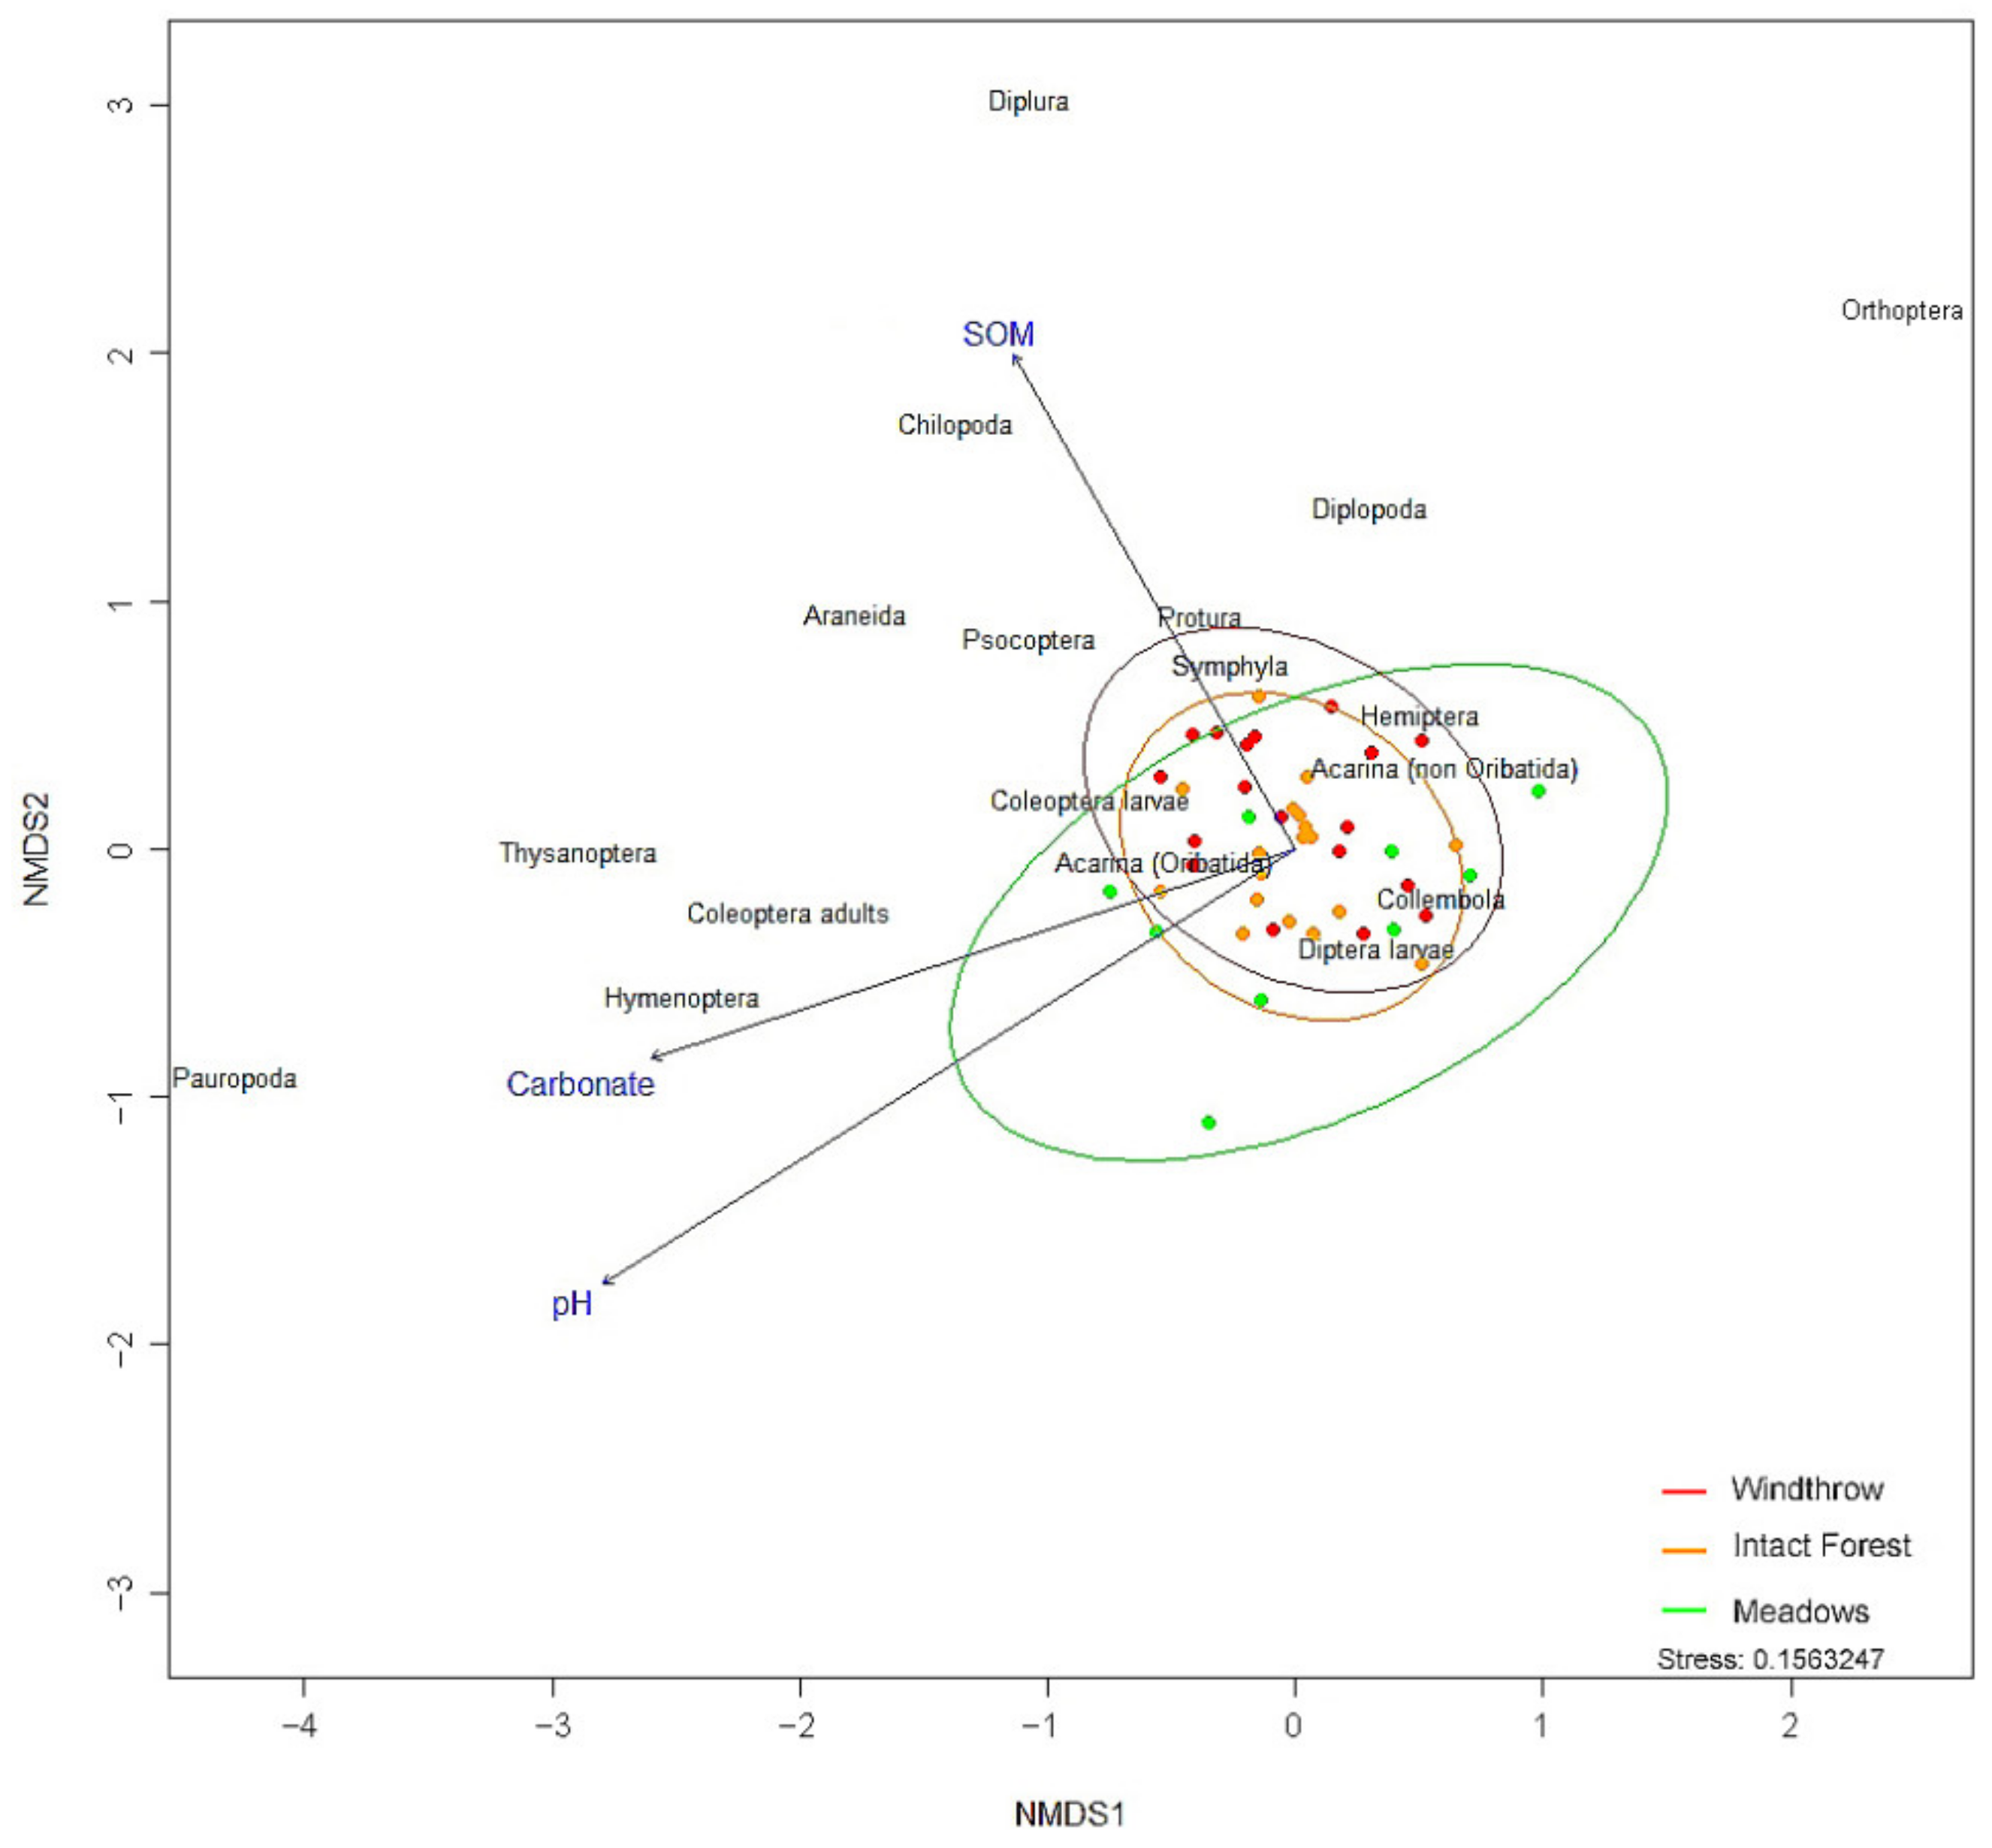
3.2. Soil Arthropods

Overall, 20,349 specimens were extracted from the 45 samples collected (Table 1).
The number of OTUs observed in the samples ranged between 3 in M and 12 in IF, and the abundance ranged between 764 and 38,256 ind./m2 in M and W, respectively. Acarina and Collembola were observed in all samples. Coleoptera, both adults and larvae, was the third most present OTU (in 34 samples and 39 samples, respectively), followed by Hemiptera and Diptera larvae (both in 28 samples) and Diplopoda (in 23 samples). Chilopoda, Symphyla, Araneae, Protura, and Thysanoptera were present in a range of 17 to 19 samples. Hymenoptera and Psocoptera were observed in 9 and 6 samples respectively, while Pauropoda, Diplura and Orthoptera were rare, observed only in 1 sample (Table S2).
In all conditions, Acarina and Collembola accounted for more than 50% of the total arthropod abundance. The abundance of mites was higher in the forested areas (both W and IF). In greater detail, Oribatida were higher than other Acarina groups, whereas the proportion was inverted in meadows. The abundance of Collembola reached 67% in meadows, compared with 26% for Acarina.
A difference in community structure between forests (W and IF) and meadows (Figure 3) is highlighted by NMDS.
The OTUs driving the NMDS distribution of the samples were Chilopoda and Coleoptera adults (p ≤ 0.001, both), Araneae (p < 0.01), Diplopoda, Hymenoptera, and Thysanoptera (p < 0.05, all three taxa). SOM drove the site distribution pattern differently from pH and carbonate along the second axis.
PERMANOVA confirmed that condition and SOM had a significant impact on community structure (p ≤ 0.001 and p < 0.05, respectively), and on their interaction (p < 0.05), whereas pH and carbonate concentration significantly shaped arthropod assemblages only when interacting with the condition and SOM simultaneously, or with the condition only, or one to another (p < 0.05, all). The arthropod community diverged between meadow and forests, for both W and IF (pairwise comparisons: p ≤ 0.001 and p < 0.01, respectively). OTUs statistically associated with conditions were: Thysanoptera with M (p ≤ 0.01), Oribatida and non-Oribatida with forests (p ≤ 0.001 and p < 0.05, respectively), Chilopoda with W (p < 0.01), and Coleoptera larvae and Diptera larvae with IF (p ≤ 0.001 and p < 0.05, respectively).
Both the total abundance and the number of OTUs differed between conditions (p < 0.05, both; Figure 4), showing lower values in M for both detected parameters; contrary to this, OTUs diversity did not differ between conditions (Table 1).
Moreover, at least for the total abundance parameter, W had a positive impact on forest soil in terms of soil arthropods, even though this impact is affected by the pH value, and a smooth effect is likely from the interaction between SOM and both W and IF conditions (Table 2), as shown by the GAM models.
As for the number of OTUs, slightly more than 50% of the deviance was explained by the model, but a positive effect related to SOM clearly emerged (Table 2).
Below, Myriapoda, Chelicerata, Entognatha, and Insecta are discussed separately.
GAM models, designed for forests only based on variables selected from FAMD results (Figure S1), and explaining at least 50% of the deviance of the dependent variable, are given in Table 2.
OTU responses, focusing on the ones with enough data and where the effects of explanatories were detected, are reported below.

3.2.1. Myriapoda

All four Myriapoda classes were found in the study area (Table 1). However, Pauropoda was extremely rare in these areas, while Diplopoda and Symphyla abundances did not show differences linked to condition. Only Chilopoda showed differences between conditions (p < 0.01), with the highest presence in W, and absence in M (Table 1). The GAM model showed up the expected positive effect from the interaction between W and carbonate content, together with a smooth effect of the SOM content in W (Table 2).

3.2.2. Chelicerata

Within the Chelicerata only Acarina and Araneae were found in the soil samples (Table 1). Acari were present in all soil samples, and both oribatid and other Acari showed differences between conditions (p < 0.001 and p < 0.01, respectively). M showed the lowest abundance (Table 1), while no difference was observed in forest areas between W and IF. The Oribatida/other Acari ratio was higher than 1 in W and IF, while it was less than 1 in M. Moreover, Oribatida made a higher contribution to principal dimensions (Figure S1), with an abundance that is expected to decline in response to an increasing carbonate content, and that is smoothly affected by pH in IF (Table 2). Araneae did not show a clear difference between conditions; however, their abundance is expected to be favorably influenced by W (Table 2).

3.2.3. Entognatha

Inside the Entognatha, Diplura were rare (Table S2), while neither Protura nor Collembola distribution showed a clear trend.

3.2.4. Insecta

Within Insecta, Orthoptera were the rarest OUT (Table S2). Thysanoptera and Psocoptera did not show differences between conditions. Hymenoptera were present with a high variability between replicates (Table S2). This group showed significant differences between conditions (p ≤ 0.05), especially within woodlands (Table 1). Hemiptera and Coleoptera adults’ abundance did not show differences between conditions or even a clear pattern. For Diptera larvae, no differences between conditions were observed; however, a negative impact of the windthrow condition and a smooth effect of pH on their abundance were observed (Table 2). Coleoptera larvae were present at all sites (Table S2) and differences between conditions were observed (p < 0.01, Table 1). The model showed up a negative impact of the windthrow condition and a smooth effect of pH on Coleoptera larvae abundance (Table 2).

4. Discussion

The principal aim of this study was to gauge how different arthropod taxa in forests of the Mediterranean area were affected by a catastrophic event (the Vaia storm) in terms of presence and abundance. Considering that they can be affected by changes in pH, organic matter, and carbonate in soil, this research also focused on the effects of the Vaia storm on those parameters, comparing forests affected by the storm with forests not impacted and with meadows; the latter to understand if W is moving toward a conversion to meadow or if the wooded character still prevails. It is important to highlight that, even if one year from the windthrow is a short time to observe its effects on soil attributes, as well as on edaphic fauna, it is a sufficiently long time to notice a significant reduction of SOM, and a variation, in terms of abundance and biodiversity, of some OTUs (e.g., Hymenoptera adults, Coleoptera, Diptera larvae, and Chilopoda).
The results obtained in this study highlighted differences in pH between meadows and woodlands. Our results tally with previous studies showing that afforested stands had a lower soil pH compared to grasslands in the top 20 cm of the soil [42]. Moreover, as observed by [43], pure spruce forests have generally higher soil acidity and consequently considerable environmental costs, such as soil acidification, leaching of nutrients, frequent pest outbreaks, and high windthrow susceptibility (e.g., [44,45]). Inside woodlands, no significant differences were observed between windthrow and intact forest in our study. This result tallies with [46], who found similar pH values between damaged and undamaged forest two years after the High Tatra Mountains windthrow. We can hypothesize that one year since the passage of the Vaia storm was not enough to detect differences in terms of pH. Indeed, [47], comparing soil pH from an undisturbed control stand with that of Höllengebirge windthrow areas from 2009 and 2007, observed differences in 2013 only in respect of the earlier event.
Soil pH can affect the input of both SOM and SOC following afforestation. Low pH inhibits the activities of soil microorganisms that decompose SOM, and consequently leads to the preservation of SOM inputs in soil [48]. Moreover, the reduction in soil pH often results in an increase in fungi abundance, concomitant with the reduced microbial biomass [49], which can consequently affect microbivores. Soil organic matter amounts may also be strongly influenced by windthrow, with the possible redistribution and mixing of mineral and organic soil horizons down to bedrock [50,51]. Our results showed a higher SOM percentage in intact forest when compared to windthrow forest and meadow. Meadow showed the lowest SOM content. On the one hand, differences between intact forest and meadow supported [52], who assumed a greater SOM content in forests than in meadow because of larger inputs and less intense decomposition. On the other hand, there is evidence that disturbance processes strongly influence SOM formation and loss [50]. Our results supported the hypothesis that SOM amounts may indeed be strongly affected by windthrow, in agreement with some authors [12,51]. In addition, a negative relationship between carbonate and pH was found in our study. This result confirmed that soil carbonate is generally present in low content in acidic soils, like those considered in our study [53,54]. A negative relationship between carbonate and SOM was observed in our study, supporting other analyses by [55].
In our research, differences between forests and meadows emerged not only in pH and SOM but also in arthropod community structure. In general, a higher abundance and number of OTUs were observed in forests than in meadows, especially in windthrow, following the same pattern of epigeic invertebrates, for which biodiversity in windthrow is likely to increase compared to that in intact forests [15,16]. In our study, we found that Thysanoptera were specifically linked to meadows. Indeed, since these arthropods are mostly phytophagous, they are expected to be found predominantly in grassland, in accordance with [56]. In our study, Collembola reached 67% in meadows compared with 26% for Acarina. Mites showed a higher abundance in forested areas (both W and IF) compared to meadows, with a majority of Oribatida compared to other Acarina. A prevalence of oribatid mites in forested areas might be explained by their feeding habits; indeed, they are mainly decomposers, feeding on dead organic material and fungi, and litter consumption by oribatid mites can be considerable in woodland [57]. The ratio of Oribatida to other Acarina was inverted in meadows, in accordance with [57], who showed that oribatids tended to be less abundant in grassland, where the more active predatory Mesostigmata are usually the dominant acarine group in terms of energy metabolism. In this study, no differences were observed in Oribatida abundance within forested areas. This apparently contrasts with the observations of [58] who, comparing oribatid mite communities in different microhabitats (bare soil, dead wood, litter, and moss) before and after the effects of drought, thunderstorm, and human forest operations in temporal succession, highlighted that species richness and abundance were reduced in a variety of ways in all studied microhabitats after natural events and human activity. However, the authors suggested that, of those disturbances considered, drought is often decisive for the drop in oribatid richness and abundance, so the effects of windthrow alone cannot be inferred. Moreover, the four microhabitats showed different responses in terms of the oribatid mite community: moss showed the strongest contraction, while litter hosted the richest community when compared with the other microhabitats, and acted as a buffer against disturbances.
Catastrophic events in a forest, such as windthrow or fire, changes the habitat dramatically, and the alteration in microclimatic conditions and supply of dead wood can modify soil community drastically [14,15,22,59]. In our study, differences between windthrow and intact forest did not emerge in terms of total abundance and number of OTUs. Reference [60], studying the post-fire arthropod communities after different intensities of fire events, remarked on the little differences between communities in the lowest intensity of ground fire and the control. Based on this, we can surmise that a period of one year after a catastrophic event is not sufficient time for detecting differences in these parameters, even though windthrow presented greater variability when compared to intact forest in terms of number of OTUs. This can be related to the creation of more heterogeneous microhabitats because of the non-uniform distribution of dead wood on soil and the consequent alteration of microclimatic conditions [61]. Our results are in partial discordance with [62], who found that ground-dwelling invertebrate activity-abundance was higher one year after a tornado but was similar to nearby undisturbed forest two and three years post-disturbance, while their diversity was lower one year after the tornado, was higher during the second year, and similar to undisturbed forest by the third year. Nevertheless, as suggested by [16], the forest condition might be expected to become determinant in shaping community structure in the long term. In fact, the authors observed some taxonomic groups that gradually grew more dissimilar to those of the forest control plot over the years. Some studies showed differences between groups in the reaction to a catastrophic event, demonstrating that the various groups could show different sensitivity to changes in habitat conditions [16,62].
Our results highlighted clear differences between windthrow and intact forest only for Hymenoptera, Chilopoda, and Coleoptera larvae. Diptera larvae, on the other hand, seemed to be influenced by forest condition, too. The Hymenoptera group was more abundant in intact forest when compared to the windthrow zone, as observed by [62]. Reference [63] observed the dynamics of ant communities in post-fire areas at different times after the disturbance. Their results showed that ant’s abundance was independent of the closeness in time to the fire event, results that were not in accordance with ours. However, the number of natives species was higher in intact areas compared to disturbed areas, which showed higher numbers of invasive exotic species. To disentangle such facts, more studies should be conducted in this topic since we did not track the Hymenoptera taxa to the species level. On the other hand, Chilopoda showed an opposite trend, supporting [64], who highlighted that the presence of dead wood contributes to the increase in Chilopoda abundance, an increase that could be also attributed to a higher abundance of prey and to their being principally predators. Another study showed that Coleoptera and Diptera, both larvae, were negatively affected by this condition, probably because larval stages are often susceptible to desiccation, and windthrow forest floor is more exposed to sun irradiation [65]. We confirmed the same trend for Coleoptera larvae, showing themselves to prefer intact forest where the presence of wood on the soil surface limits light penetration. Reference [16], in studies aimed at investigating the effect of the windthrow caused by the Vivian storm on fauna biodiversity, pointed out that some epigeal arthropods (e.g., spiders, carabids, and staphylinid beetles) showed a higher species richness in windthrow areas than in the intact forest, which coincides with conclusions obtained by [66], who observed that coleopterans tend to colonize post-fire areas. Accordingly with the aforementioned studies, we found that Araneae abundance seemed to increase in windthrow areas, perhaps because they are predators of the forest floor and may have profited from both microclimatic conditions and the aggregation of potential prey, causing the increase in arthropod abundance. In our study, the other OTUs did not show a clear trend, suggesting that the storm passage did not appear to have created significantly different soil features between the two conditions only one year after the storm’s passage. In a study focusing on the succession of Collembola communities in spruce forests five years after a windthrow, [67] assumed that a period of five years was not enough for Collembola communities to recover completely, and the authors reported some species-specific differences. In our study, Collembola did not show a clear trend between the two forest conditions, but this result could be due to the fact that the overall collembolan community has been evaluated, and this high taxonomic level can mask the differences between the two conditions in terms of collembolan species composition.

5. Conclusions

Our results showed that windthrow only partially affected soil arthropod community abundance and structure one year after the catastrophic event, with no evident shift toward a meadow condition. However, due to the strong link between arthropods and SOM, and the decrease of the latter under windthrow conditions, changes in soil chemical parameters will probably shape community structure in the long term. Soil arthropod groups reacted only partially differently to the storm’s passage, and the larvae phase (Coleoptera and, to a lesser extent, Diptera) was the most sensitive stage, showing an abundance reduction in damaged forests. Predators such as Chilopoda found more favorable conditions in windthrow, while meadows proved to be a good hotspot for Thysanoptera.
Despite the drastic changes in vegetation cover that was due to the uprooting of trees and accumulation of dead wood on the ground, the soil arthropod community was not significantly affected by the storm impact in the short term. Presumably, more time would be required to react to this radical change. We can conclude by stating that soil fauna shows a delay in response to the catastrophic event. This aspect should be carefully monitored and considered when attempting to combat global warming and climate change, which are leading to an increase in catastrophic events in the Mediterranean area.

Supplementary Materials

The following supporting information can be downloaded at https://www.mdpi.com/article/10.3390/d14060440/s1: Table S1. Mean ± st.err. of pH, SOM (%) and carbonate (%) in each site, Table S2. Mean ± st.err. (ind./m2) of OTUs in each site, Figure S1. FAMD output.

Author Contributions

Conceptualization, C.M.; methodology, C.M., C.L.F. and S.R.; software, S.R.; validation, C.M. and S.R.; formal analysis, S.R.; investigation, C.M.; resources, C.M.; data curation, C.M. and S.R.; writing—original draft preparation, C.M., C.L.F. and S.R.; writing—review and editing, C.M. and S.R.; visualization, S.R.; supervision, C.M.; project administration, C.M.; funding acquisition, C.M. All authors have read and agreed to the published version of the manuscript.

Funding

This research received no external funding.

Data Availability Statement

The data presented in this study are available on request from the corresponding authors.

Acknowledgments

We would like to thank G. Ferrari, D. Passera, A. Ferrari, and F. Ferrari in the soil-sample collecting phases. We wish to thank the Italian Forest Police (Fassa section) for allowing us to go into areas not open to tourists and for their interest in the study.

Conflicts of Interest

The authors declare no conflict of interest.

References

  1. Coumou, D.; Rahmstorf, S. A decade of weather extremes. Nat. Clim. Chang. 2012, 2, 491–496. [Google Scholar] [CrossRef]
  2. IPCC. 2021 Summary for Policymakers. In Climate Change 2021: The Physical Science Basis. Contribution of Working Group I to the Sixth Assessment Report of the Intergovernmental Panel on Climate Change; IPCC: Geneva, Switzerland, 2021. [Google Scholar]
  3. Matteucci, G.; Cammarano, M.; Dezi, S.; Mancini, M.; Mugnozza, G.S.; Magnani, F. Climate Change Impacts on Forests and Forest Products in the Mediterranean Area. In Advances in Global Change Research; Springer International Publishing: Cham, Switzerland, 2013; Volume 51, pp. 71–100. [Google Scholar] [CrossRef]
  4. Schelhaas, M.-J.; Nabuurs, G.-J.; Schuck, A. Natural disturbances in the European forests in the 19th and 20th centuries. Glob. Chang. Biol. 2003, 9, 1620–1633. [Google Scholar] [CrossRef]
  5. Seidl, R.; Schelhaas, M.-J.; Rammer, W.; Verkerk, P.J. Increasing forest disturbances in Europe and their impact on carbon storage. Nat. Clim. Chang. 2014, 4, 806–810. [Google Scholar] [CrossRef] [PubMed] [Green Version]
  6. Franklin, J.F.; Spies, T.A.; Van Pelt, R.; Carey, A.B.; Thornburgh, D.A.; Berg, D.R.; Lindenmayer, D.B.; Harmon, M.E.; Keeton, W.S.; Shaw, D.C.; et al. Disturbances and structural development of natural forest ecosystems with silvicultural implications, using Douglas-fir forests as an example. For. Ecol. Manag. 2002, 155, 399–423. [Google Scholar] [CrossRef]
  7. Thom, D.; Seidl, R. Natural disturbance impacts on ecosystem services and biodiversity in temperate and boreal forests. Biol. Rev. 2016, 91, 760–781. [Google Scholar] [CrossRef]
  8. Graham, E.B.; Averill, C.; Bond-Lamberty, B.; Knelman, J.E.; Krause, S.; Peralta, A.L.; Shade, A.; Smith, A.P.; Cheng, S.J.; Fanin, N.; et al. Toward a Generalizable Framework of Disturbance Ecology through Crowdsourced Science. Front. Ecol. Evol. 2021, 9, 76. [Google Scholar] [CrossRef]
  9. IPCC. 2019 Summary for Policymakers. In Climate Change and Land: An IPCC Special Report on Climate Change, Desertification, Land Degradation, Sustainable Land Management, Food Security, and Greenhouse Gas Fluxes in Terrestrial Ecosystems; IPCC: Geneva, Switzerland, 2019. [Google Scholar]
  10. Lugo, A.E. Effects and outcomes of Caribbean hurricanes in a climate change scenario. Sci. Total Environ. 2000, 262, 243–251. [Google Scholar] [CrossRef]
  11. Shiels, A.B.; Gonzalez, G. Understanding the key mechanisms of tropical forest responses to canopy loss and biomass deposition from experimental hurricane effects. For. Ecol. Manag. 2014, 332, 1–10. [Google Scholar] [CrossRef] [Green Version]
  12. Kramer, M.G.; Sollins, P.; Sletten, R.S. Soil carbon dynamics across a windthrow disturbance sequence in southeast Alaska. Ecology 2004, 85, 2230–2244. [Google Scholar] [CrossRef] [Green Version]
  13. Coyle, D.R.; Nagendra, U.J.; Taylor, M.K.; Campbell, J.H.; Cunard, C.E.; Joslin, A.H.; Mundepi, A.; Phillips, C.A.; Callaham, M.A. Soil fauna responses to natural disturbances, invasive species, and global climate change: Current state of the science and a call to action. Soil Biol. Biochem. 2017, 110, 116–133. [Google Scholar] [CrossRef]
  14. Meehan, M.L.; Song, Z.; Lumley, L.; Cobb, T.P.; Proctor, H. Soil mites as bioindicators of disturbance in the boreal forest in northern Alberta, Canada: Testing taxonomic sufficiency at multiple taxonomic levels. Ecol. Indic. 2019, 102, 349–365. [Google Scholar] [CrossRef]
  15. Wermelinger, B.; Duelli, P.; Obrist, M.K. Windthrow Stimulates Arthropod Biodiversity in Forests. Dead wood: A key to biodiversity. In Proceedings of the International Symposium, Mantova, Italy, 29–31 May 2003; pp. 79–82. [Google Scholar]
  16. Duelli, P.; Obrist, M.K.; Wermelinger, B. Windthrow-Induced Changes in Faunistic Biodiversity in Alpine Spruce Forests. For. Snow Landsc. Res 2002, 77, 117–131. [Google Scholar]
  17. Doran, J.W.; Zeiss, M.R. Soil Health and Sustainability: Managing the Biotic Component of Soil Health and Sustainability: Managing the Biotic Component of Soil Quality Soil Quality Soil Health and Sustainability: Managing the Biotic Component of Soil Quality. Appl. Soil Ecol. 2000, 15, 3–11. [Google Scholar] [CrossRef] [Green Version]
  18. Kibblewhite, M.G.; Ritz, K.; Swift, M.J. Soil Health in Agricultural Systems. Philos. Trans. R. Soc. Biol. Sci. 2008, 363, 685–701. [Google Scholar] [CrossRef] [Green Version]
  19. Wall, D.H.; Bradford, M.A.; John, M.G.S.; Trofymow, J.A.; Behan-Pelletier, V.; Bignell, D.E.; Dangerfield, J.M.; Parton, W.J.; Rusek, J.; Voigt, W.; et al. Global decomposition experiment shows soil animal impacts on decomposition are climate-dependent. Glob. Chang. Biol. 2008, 14, 2661–2677. [Google Scholar] [CrossRef] [Green Version]
  20. Soong, J.L.; Vandegehuchte, M.L.; Horton, A.J.; Nielsen, U.N.; Denef, K.; Shaw, E.A.; de Tomasel, C.M.; Parton, W.; Wall, D.H.; Cotrufo, M.F. Soil microarthropods support ecosystem productivity and soil C accrual: Evidence from a litter decomposition study in the tallgrass prairie. Soil Biol. Biochem. 2016, 92, 230–238. [Google Scholar] [CrossRef] [Green Version]
  21. Neher, D.A.; Barbercheck, M.E. Soil Microarthropods and Soil Health: Intersection of Decomposition and Pest Suppression in Agroecosystems. Insects 2019, 10, 414. [Google Scholar] [CrossRef] [Green Version]
  22. Lakshmi, G.; Beggi, F.; Menta, C.; Kumar, N.K.; Jayesh, P. Dynamics of soil microarthropod populations affected by a combination of extreme climatic events in tropical home gardens of Kerala, India. Pedobiologia 2021, 85–86, 150719. [Google Scholar] [CrossRef]
  23. Farská, J.; Prejzková, K.; Rusek, J. Management intensity affects traits of soil microarthropod community in montane spruce forest. Appl. Soil Ecol. 2014, 75, 71–79. [Google Scholar] [CrossRef]
  24. Johnstone, J.; Chapin, F.S. Effects of Soil Burn Severity on Post-Fire Tree Recruitment in Boreal Forest. Ecosystems 2006, 9, 14–31. [Google Scholar] [CrossRef]
  25. Čuchta, P.; Miklisová, D.; Kováč, Ľ. A three-year study of soil Collembola communities in spruce forest stands of the High Tatra Mts (Slovakia) after a catastrophic windthrow event. Eur. J. Soil Biol. 2012, 50, 151–158. [Google Scholar] [CrossRef]
  26. Zanella, A.; Ponge, J.-F.; Andreetta, A.; Aubert, M.; Bernier, N.; Bonifacio, E.; Bonneval, K.; Bolzonella, C.; Chertov, O.; Costantini, E.A.C.; et al. Combined forest and soil management after a catastrophic event. J. Mt. Sci. 2020, 17, 2459–2484. [Google Scholar] [CrossRef] [PubMed]
  27. Chirici, C.; Giannetti, G.; Travaglini, T.; Nocentini, N.; Francini, F.; D’Amico, D.; Calvo, C.; Fasolini, F.; Broll, B.; Maistrelli, M.; et al. Stima Dei Danni Della Tempesta “Vaia” Alle Foreste in Italia. For. J. Silvic. For. Ecol. 2019, 16, 3. [Google Scholar] [CrossRef] [Green Version]
  28. QGIS Development Team. QGIS Geographic Information System. Open Source Geospatial Foundation. Map Tiles by Google Satellite. Available online: http://qgis.org (accessed on 17 November 2021).
  29. Klironomos, J.N.; Rillig, M.; Allen, M.F. Designing belowground field experiments with the help of semi-variance and power analyses. Appl. Soil Ecol. 1999, 12, 227–238. [Google Scholar] [CrossRef]
  30. S.I.S.S. Metodi Normalizzati di Analisi del Suolo; Edagricole: Bologna, Italy, 1986. [Google Scholar]
  31. Heiri, O.; Lotter, A.F.; Lemcke, G. Loss on ignition as a method for estimating organic and carbonate content in sediments: Reproducibility and comparability of results. J. Paleolimnol. 2001, 25, 101–110. [Google Scholar] [CrossRef]
  32. John, F.; Weisberg, S.; Price, B. An {R} Companion to Applied Regression; Sage: New York, NY, USA, 2019; Volume 58. [Google Scholar] [CrossRef] [Green Version]
  33. Oksanen, J.; Blanchet, F.G.; Friendly, M.; Kindt, R.; Legendre, P.; Mcglinn, D.; Minchin, P.R.; O’hara, R.B.; Simpson, G.L.; Solymos, P.; et al. Package “vegan”. Title Community Ecol. Package Version 2.5-7 2020, 9, 295. [Google Scholar]
  34. Martinez Arbizu, P. PairwiseAdonis: Pairwise Multilevel Comparison Using Adonis. Available online: https://github.com/pmartinezarbizu/pairwiseAdonis/tree/master/pairwiseAdonis (accessed on 23 September 2020).
  35. De Cáceres, M.; Jansen, F.; Noah, D. Relationship between Species and Groups of Sites. Package ‘Indicspecies’. Available online: https://cran.r-project.org/web/packages/indicspecies/indicspecies.pdf (accessed on 6 March 2022).
  36. Pagès, J. Analyse Factorielle de Données Mixtes; Société Française De Statistique: Paris, France, 2004; Volume 52. [Google Scholar]
  37. Husson, F.; Josse, J.; Le, S.; Maintainer, J.M. Multivariate Exploratory Data Analysis and Data Mining. Available online: https://cran.r-project.org/web/packages/FactoMineR/FactoMineR.pdf (accessed on 12 December 2020).
  38. Kassambara, A.; Mundt, F. Extract and Visualize the Results of Multivariate Data Analyses. Available online: https://cran.r-project.org/web/packages/factoextra/factoextra.pdf (accessed on 13 April 2020).
  39. Wood, S.N. Generalized Additive Models: An Introduction with R, 2nd ed.; Chapman and Hall/CR: London, UK, 2017; ISBN 9781498728348. [Google Scholar]
  40. Marra, G.; Wood, S.N. Coverage Properties of Confidence Intervals for Generalized Additive Model Components. Scand. J. Stat. 2012, 39, 53–74. [Google Scholar] [CrossRef] [Green Version]
  41. R Core Team. R: A Language and Environment for Statistical Computing 2021; Foundation for Statistical Computing: Vienna, Austria, 2021. [Google Scholar]
  42. Jobbágy, E.G.; Jackson, R.B. Patterns and mechanisms of soil acidification in the conversion of grasslands to forests. Biogeochemistry 2003, 64, 205–229. [Google Scholar] [CrossRef]
  43. Brandtberg, P.-O.; Lundkvist, H.; Bengtsson, J. Changes in forest-floor chemistry caused by a birch admixture in Norway spruce stands. For. Ecol. Manag. 2000, 130, 253–264. [Google Scholar] [CrossRef]
  44. Binkley, D.; Valentine, D. Fifty-year biogeochemical effects of green ash, white pine, and Norway spruce in a replicated experiment. For. Ecol. Manag. 1991, 40, 13–25. [Google Scholar] [CrossRef]
  45. Binkley, D.; Giardina, C. Why do tree species affect soils? The Warp and Woof of tree-soil interactions. Biogeochemistry 1998, 42, 89–106. [Google Scholar] [CrossRef]
  46. Lóšková, J.; Ľuptáčik, P.; Miklisová, D.; Kováč, Ľ. Community structure of soil oribatida (acari) two years after windthrow in the high tatra mountains. Biologia 2013, 68, 932–940. [Google Scholar] [CrossRef]
  47. Mayer, M.; Sandén, H.; Rewald, B.; Godbold, D.L.; Katzensteiner, K. Increase in heterotrophic soil respiration by temperature drives decline in soil organic carbon stocks after forest windthrow in a mountainous ecosystem. Funct. Ecol. 2017, 31, 1163–1172. [Google Scholar] [CrossRef]
  48. Tonon, G.; Sohi, S.; Francioso, O.; Ferrari, E.; Montecchio, D.; Gioacchini, P.; Ciavatta, C.; Panzacchi, P.; Powlson, D. Effect of soil pH on the chemical composition of organic matter in physically separated soil fractions in two broadleaf woodland sites at Rothamsted, UK. Eur. J. Soil Sci. 2010, 61, 970–979. [Google Scholar] [CrossRef]
  49. Bardgett, R.D.; Hobbs, P.J.; Frostegård, Å. Changes in soil fungal:bacterial biomass ratios following reductions in the intensity of management of an upland grassland. Biol. Fertil. Soils 1996, 22, 261–264. [Google Scholar] [CrossRef]
  50. Kramer, M.G. Maritime Windstorm Influence on Soil Process in a Temperate Rainforest; Oregon State University: Corvallis, OR, USA, 2001. [Google Scholar]
  51. Schaetzl, R.J. Complete soil profile inversion by tree uprooting. Phys. Geogr. 1986, 7, 181–189. [Google Scholar] [CrossRef]
  52. Tolimir, M.; Kresović, B.; Životić, L.; Dragović, S.; Dragović, R.; Sredojević, Z.; Gajić, B. The conversion of forestland into agricultural land without appropriate measures to conserve SOM leads to the degradation of physical and rheological soil properties. Sci. Rep. 2020, 10, 13668. [Google Scholar] [CrossRef]
  53. Batjes, N.H. Total carbon and nitrogen in the soils of the world. Eur. J. Soil Sci. 1996, 47, 151–163. [Google Scholar] [CrossRef]
  54. Wang, X.; Wang, J.; Xu, M.; Zhang, W.; Fan, T.; Zhang, J. Carbon accumulation in arid croplands of northwest China: Pedogenic carbonate exceeding organic carbon. Sci. Rep. 2015, 5, 11439. [Google Scholar] [CrossRef] [Green Version]
  55. Lal, R.; Kimble, J.M.; Stewart, B.A.; Eswaran, H. Global Climate Change and Pedogenic Carbonates; U.S. Department of Energy: Washington, DC, USA, 1999.
  56. Ananthakrishnan, T.N. Biosystematics of Thysanoptera. Annu. Rev. Èntomol. 1979, 24, 159–183. [Google Scholar] [CrossRef]
  57. Berthet, P. Mesure de La Consummation d’oxygene Des Oribates (Acariens) de La Litieredesforêts. In Soil Organisms; Doeksen, J., van der Drift, J., Eds.; North-Holland Publishing Co: Amsterdam, The Netherlands, 1963; pp. 18–31. [Google Scholar]
  58. Wehner, K.; Simons, N.K.; Blüthgen, N.; Heethoff, M. Drought, windthrow and forest operations strongly affect oribatid mite communities in different microhabitats. Glob. Ecol. Conserv. 2021, 30, e01757. [Google Scholar] [CrossRef]
  59. Kazeev, K.S.; Poltoratskaya, T.A.; Yakimova, A.S.; Odobashyan, M.Y.; Shkhapatsev, A.K.; Kolesnikov, S.I. Post-Fire Changes in the Biological Properties of the Brown Soils in the Utrish State Nature Reserve (Russia). Nat. Conserv. Res. 2019, 4, 93–104. [Google Scholar] [CrossRef]
  60. Ruchin, A.B.; Egorov, L.V.; MacGowan, I.; Makarkin, V.N.; Antropov, A.V.; Gornostaev, N.G.; Khapugin, A.A.; Dvořák, L.; Esin, M.N. Post-fire insect fauna explored by crown fermental traps in forests of the European Russia. Sci. Rep. 2021, 11, 21334. [Google Scholar] [CrossRef] [PubMed]
  61. Gandhi, K.J.; Spence, J.R.; Langor, D.W.; E Morgantini, L. Fire residuals as habitat reserves for epigaeic beetles (Coleoptera: Carabidae and Staphylinidae). Biol. Conserv. 2001, 102, 131–141. [Google Scholar] [CrossRef]
  62. Perry, K.I.; Herms, D.A. Dynamic Responses of Ground-Dwelling Invertebrate Communities to Disturbance in Forest Ecosystems. Insects 2016, 10, 61. [Google Scholar] [CrossRef] [PubMed] [Green Version]
  63. Atchison, R.A.; Hulcr, J.; Lucky, A. Managed Fire Frequency Significantly Influences the Litter Arthropod Community in Longleaf Pine Flatwoods. Environ. EÈntomol. 2018, 47, 575–585. [Google Scholar] [CrossRef] [PubMed]
  64. Jabin, M.; Topp, W.; Kulfan, J.; Zach, P. The distribution pattern of centipedes in four primeval forests of central Slovakia. Biodivers. Conserv. 2007, 16, 3437–3445. [Google Scholar] [CrossRef]
  65. Topp, W. Seasonal time partitioning and polymorphism in the developmental cycles of sympatric Staphylinoidea (Coleoptera) living in an unstable environment. In Insect Life-Cycle Polymorph; Springer: Dordrecht, The Netherlands, 1994; pp. 277–312. [Google Scholar] [CrossRef]
  66. Ruchin, A.B.; “Smolny”, J.D.O.T.M.S.N.R.A.N.P.; Alekseev, S.K.; Khapugin, A.; Ecological club «Stenus». Tyumen State University Post-fire fauna of carabid beetles (Coleoptera, Carabidae) in forests of the Mordovia State Nature Reserve (Russia). Nat. Conserv. Res. 2019, 4, 11–20. [Google Scholar] [CrossRef] [Green Version]
  67. Čuchta, P.; Kaňa, J.; Pouska, V. An important role of decomposing wood for soil environment with a reference to communities of springtails (Collembola). Environ. Monit. Assess. 2019, 191, 222. [Google Scholar] [CrossRef]
Figure 1. Study area location, with: (a) distribution of the 15 sites across the three localities (CA: Carezza, MO: Val Monzoni, SN: Val San Nicolò) [28]; photos indicative of the three conditions: (b) windthrow and (c) intact forest, and (d) meadow (SN2, CA2, and SN3, respectively).
Diversity 14 00440 g001
Figure 2. Boxplots of (a) pH, (b) SOM (%), and (c) carbonate (%) under each condition. The bottom and top of each box represent the lower and upper quartiles, respectively; the line inside each box shows the median, and whiskers indicate minimal and maximum observations. Asterisks mean: * p ≤ 0.05, ** p ≤ 0.01.
Diversity 14 00440 g002
Figure 3. Bray–Curtis-based NMDS plot of arthropod community composition. Points represent samples.
Diversity 14 00440 g003
Figure 4. Boxplots of (a) total abundance (ind./m2) and (b) number of OTUs under each condition. The bottom and top of each box represent the lower and upper quartiles, respectively; the line inside each box shows the median and whiskers indicate minimal and maximum observations. Asterisks mean: * p ≤ 0.05, ** p ≤ 0.01.
Diversity 14 00440 g004
Table 1. Relative abundance (%) and mean ± st.err. of the OTU abundances (ind./m2) and diversity in each condition (W: windthrow, IF: intact forest, M: meadows). Different letters mean significant differences (p ≤ 0.05) between conditions.
WIFM
OTUs%Mean±St.err.%Mean±St.err.%Mean±St.err.
Hexapoda Entognatha
Collembola36.814611.63±1610.39a22.782097.05±520.18a67.933078.35±1532.93a
Protura0.1417.69±7.33a0.3531.84±18.18a0.104.72±3.12a
Hexapoda Insecta
Coleoptera adults0.3138.92±11.29a0.6560.15±10.47a1.0447.18±19.31a
Coleoptera larvae0.3949.54±9.56b1.56143.89±28.59a0.6830.67±11.79b
Diplura- -a0.011.18±1.18a- -a
Diptera larvae0.2633.02±8.95a0.9082.56±19.33a0.5725.95±9.21a
Hemiptera0.83103.79±65.56a6.67614.49±450.13a0.6228.31±16.21a
Hymenoptera0.022.36±2.36b0.2623.59±12.95a0.6830.67±30.66ab
Orthoptera0.011.18±1.18a- -a- -a
Psocoptera0.079.44±8.27a0.065.90±3.35a0.052.36±2.36a
Thysanoptera0.079.44±4.92a0.043.54±1.92a1.2054.25±31.87a
Arachnida
Acarina (non Oribatida)27.883492.33±1058.89a27.522533.45±463.97a14.37651.05±314.51b
Acarina (Oribatida)31.773980.62±739.83a38.233519.46±705.94a11.76533.11±297.17b
Araneae0.4253.07±18.02a0.2321.23±12.96a0.4721.23±18.72a
Myriapoda
Chilopoda0.4050.72±13.96a0.1816.51±6.55b- -c
Diplopoda0.4455.44±26.76a0.3531.84±14.07a0.3114.15±10.01a
Pauropoda- -a- -a0.052.36±2.36a
Symphyla0.1518.87±6.40a0.2220.05±7.17a0.167.08±3.54a
Diversity indices
H 1.19±0.06a 1.26±0.06a 0.97±0.17a
1-D 0.62±0.02a 0.63±0.02a 0.48±0.09a
Table 2. Generalized additive model (GAM) results for total arthropod abundance variation, number of out, and OTU selected from the FAMD. edf = effective degrees of freedom. Asterisks mean: * p ≤ 0.05, ** p≤ 0.01.
Dependent VariableParametric CoefficientsSmooth TermsR2 AdjustedDeviance Explained
TermsEstimateTermsedf
AbundanceCondition|W5.25 *SOM:Condition|IF1.94 *0.4764.5%
Carbonate−3.08SOM:Condition|W4.64 **
Condition|IF:pH0.06
Condition|W:pH−0.90 *
N° of OTUsCondition|W0.05Carbonate7.370.3151.4%
SOM0.95 **
pH0.08
Acarina (Oribatida)Condition|W−0.23SOM3.620.5262.4%
Carbonate−47.82 *pH: Condition|IF2.35 *
pH: Condition|W3.42
AraneaeCondition|W3.58 **Carbonate2.380.6871.8%
SOM8.57
pH3.94
Chilopoda Condition|W−2.59SOM:Condition|IF2.830.8375.4%
Carbonate−164.63SOM:Condition|W7.55 *
pH1.04
Condition|W:Carbonate337.81 **
Coleoptera larvaeCondition|W−0.78 *SOM7.390.6671.7%
Carbonate−27.98pH3.89 *
Diptera larvaeCondition|W−1.11 *Carbonate4.620.6665.9%
SOM1.33
pH6.63 *
Publisher’s Note: MDPI stays neutral with regard to jurisdictional claims in published maps and institutional affiliations.

