Article

Genomic Characterization of SNPs for Genetic Differentiation and Selection in Populations from the American Oil Palm [Elaeis oleifera (Kunth) Cortés] Germplasm Bank from Brazil

by
André Pereira Leão
1,†,
Jaire Alves Ferreira Filho
2,†,
Valquiria Martins Pereira
2,
Alexandre Alonso Alves
1 and
Manoel Teixeira Souza Júnior
1,2,*
1
Embrapa Agroenergia, Brasilia CEP 70770-901, Brazil
2
Universidade Federal de Lavras—UFLA—PGBV, Lavras CEP 37200-000, Brazil
*
Author to whom correspondence should be addressed.
These authors contributed equally to this work.
Diversity 2022, 14(4), 270; https://doi.org/10.3390/d14040270
Submission received: 3 March 2022 / Revised: 23 March 2022 / Accepted: 25 March 2022 / Published: 1 April 2022
(This article belongs to the Section Plant Diversity)

Abstract

:
In this study, we used SNP markers to access the genetic components occurrence of genetic differentiation resulting from the selection processes applied to collect and maintain the germplasm bank of Elaeis oleifera (Kunth) Cortés from the Brazilian Amazon rainforest. A set of 1667 higher quality SNPs—derived from a previous GBS study—was used for genomic characterization and calculation of genetic parameters. There is differentiation in the distribution of alleles between populations for 78.52% of the tested loci. Genotypic diversity test results indicated strong evidence of genotypic differentiation between populations. Sixteen out of the nineteen tested deviated significantly from the expected allele frequencies in HWE, reinforcing the hypothesis that there was maybe a selection in the evaluated populations. A group of 568 loci with a higher probability of being under selection effects were selected, both directional and stabilizing. In total, 1546 and 1274 SNPs aligned in the genomes of E. oleifera and E. guineensis Jacq., respectively. These markers showed a wide distribution throughout the genome of the two species. In conclusion, the E. oleifera GB from the Brazilian Amazon rainforest has specific genetic structures and good genetic variability within populations.

1. Introduction

Elaeis guineensis Jacq. and Elaeis oleifera (Kunth) Cortés comprise the two only species of this genus. The first one is the African oil palm, a crop of great commercial importance and source of the largest share of vegetable oil consumed in the world [1,2]. The second one is the American oil palm, native to and widely distributed in the Central and Northern regions of South America [3]. Caiaué is the common name given to the American oil palm in Brazil.
These two species are monoecious (male and female reproductive organs on different parts of the same plant), producing male and female flowers during distinct sexual cycles [4,5]. There are no differences in the development of inflorescence structures between the two species [6]. Entomophilous pollination is the primary method of pollination in this genus, although manually assisted pollination is a common agronomic practice in some countries; however, there are some differences in the flowers of E. oleifera and the interspecific hybrids when compared with E. guineensis, which reduces the effectiveness of insect pollination [7].
Although not a commercially attractive species due to its low productivity—an oil to bunch ratio of 5%, compared to 25% of oil palm—caiaué has pronounced importance to oil palm breeding programs in Brazil and elsewhere for the development of superior interspecific hybrids by crossing with the African oil palm. Among the characteristics that proved to be superior to African oil palm and, therefore, subject to introgression via breeding programs, the following stand out: (i) resistance to fatal yellowing, a disease of unknown etiology severely affecting oil palm plantations in Brazil [8]; (ii) smaller plant size and slower growth, which facilitates cultivation and prolongs the time of commercial exploitation; (iii) the quality of the oil, which has a higher content of carotenoids and more unsaturated oil than palm oil; (iv) lower lipase activity in the fruits’ mesocarp, allowing more time between harvesting and processing; and (v) wide genetic variability, allowing genetic gain through the production of hybrids.
To have better access to the genetic variability, providing consequently higher genetic gains in developing economically sustainable interspecific hybrids, proper maintenance of the germplasm bank (GB) followed by genetic and morphological characterization is a must. The great commercial importance of E. guineensis has encouraged the publication of many studies reporting the genetic variability of different populations and their genetic differentiation [9,10,11]. On the other hand, the information available for E. oleifera is scarcer, mainly those involving the use of molecular markers in large numbers. In the last 20 years, only a few studies have applied DNA markers (RFLP, AFLP, RAPD, microsatellites, and SNPs) to characterize genetic and phenotypic diversity, population structure, or even design a core collection of the American oil palm [3,12,13,14,15,16,17]. The E. oleifera collection at Embrapa has a moderate degree of genetic diversity and a high interpopulation genetic differentiation [17].
The current study adds to a previous one carried out by our group on identification, selection, and use of SNP markers to characterize the genetic diversity and population structure and to design a core collection of the E. oleifera Germplasm Bank (GB) maintained in Brazil by Embrapa [17]. Using a set of 1667 SNPs allowed the identification and characterization of possible markers under the effect of selection; these markers were characterized at the genomic level in E. oleifera and E. guineensis, seeking to understand their distribution and organization. Our approach allows us to select those with a high probability of transferability between species, aiming, above all, to underpin decisions related to the conservation of the species as well as to breeding programs of the African oil palm through the conscious and efficient use of the American oil palm germplasm available in Brazil.

2. Materials and Methods

2.1. Plant Materials

Plants used in this study belong to the Brazilian E. oleifera Germplasm Bank (GB) and are maintained in vivo at the Rio Urubu Experimental Station—Embrapa Western Amazon, located 140 km from Manaus, in the municipality of Rio Preto da Eva, Amazonas, Brazil, latitude 2°35′ S, longitude 59°28′ W, and altitude 200 m. This GB was established based on a series of expeditions in the Brazilian Amazon rainforest organized by Embrapa and CIRAD in the early 1980s [18]. These plants are from 206 different half-sibling families (subsamples) out of the 246 subsamples that make up the entire GB. Each half-sibling family is a group of 10 plants originated from seeds collected from a plant. The number of subsamples per locality varied considerably (Table 1). There are 19 populations in the GB; each one is composed of all subsamples from that locality. These distinct localities spread throughout six geographic regions in the States of Amazonas and Roraima (Table 1). For this study, we collected and used leaves from three plants per subsample.

2.2. Genotyping by Sequencing and SNP Selection

Leaves from individual trees, collected fresh in the field, were stored at −80 °C until DNA extraction. Total DNA was extracted according to a modified CTAB protocol [19] and sent to DArT Pty® to perform genotyping by sequencing (GBS) using the DArTseq Technology. At DArT Pty®, due to quality problems in some DNA samples, 65 out of the 618 initial plants were discarded and the GBS performed using the remaining 553. After removing the barcodes, the resulting sequences underwent trimming at 69 bp (5 bp restriction site plus 64 bases with a minimum Q score of 10), and virtually identical reads (i.e., less than three polymorphisms) were combined so that one or more SNPs in the read did not confuse the analysis. A low coverage consensus sequence was generated and used as a reference in the discovery of SNPs by aligning the 69 bp reads using the Bowtie v0.12 program [20].
The DArT Pty® pipeline generated 7461 SNP markers, divided into 5365 higher, 146 high, and 1950 lower quality SNPs. After filtering the higher quality SNPs based on a Call Rate higher than 0.90 and Minor Allele Frequency (MAF) higher than 0.05, a set of 1667 SNP markers was generated and used to run the genetic analysis.

2.3. Genetic Analysis

The Genepop software version 4.2, a population genetics software package, was used to analyze the following genetic parameters: the number of migrants (Nm), percentage of polymorphic loci (criterion 0.95), expected and observed heterozygosity (He and Ho), and Wright’s F statistics (Fis and Fst—[21]). Chi-square tests were performed for each locus for deviation of genotypes concerning the Hardy–Weinberg equilibrium.
Genotypic differentiation was tested by evaluating the distribution of genotypes across the population, using an unbiased estimator of the p-value of an exact test (G test). The tested nullity hypothesis is that the genotypic distribution is identical across all tested populations. The estimates of the exact p-values for the tests of conformity with the expectations of the Hardy–Weinberg equilibrium were calculated using the Monte Carlo randomization method via Markov chains (MCMC) [22] and the expected number of heterozygotes was computed using Levene’s test [23].
To identify adaptive SNP (putative loci under selection) and the neutral loci, we used a coalescent simulation processed by the LOSITAN software, a workbench to detect molecular adaptation based on a Fst-outlier method [24]. A simulation was first performed with the gross degree of genetic differentiation values calculated for each one of the 1667 SNPs, aiming to obtain the neutral degree of genetic differentiation for the data set not biased by extreme values. The LOSITAN software was also used to separate SNP loci possibly under the selection from neutral loci. For this, a coalescent simulation was initially performed through obtaining a neutral Fst value, based on all 1667 analyzed SNP loci. Then, this average neutral Fst was used to perform a new simulation to identify loci outliers, which are possibly under selection effect.

2.4. Alignment of SNPs Sequences to Elaeis guineensis and E. oleifera Genomes

SNP sequences were aligned to: (a) the African oil palm reference genome [25]—files downloaded from the National Center for Biotechnology Information (BioProject PRJNA192219; BioSample SAMN02981535) on April 2021; and (b) a local preliminary assembly (version 1.0) of the genome of E oleifera access from the Amazon rainforest, Manicoré, belonging to the E. oleifera Germplasm Bank of Embrapa [26].

2.5. Genomic Characterization and Functional Annotation

The 1667 SNPs were mapped against the reference genome of E. guineensis and E. oleifera by means of a Blastn (blastn-task blastn-short-max_target_seqs 3), the alignments were filtered based on e-value (less than e-10) and alignment coverage (greater than 90). Based on the GFF (General Feature Format) genome file, intragenic and intergenic SNPs were identified in the analyzed set (only those aligned with 97–100% identity to the reference). The distribution of SNPs in the chromosomes of E. guineensis and the synteny analysis were visualized using the chromoMap R package. Functional annotations of genes containing SNPs (intragenic) were performed using the Blast2go software implemented in the OmicsBox package [27].

3. Results

3.1. Genetics Analysis—Genotypic Differentiation in E. oleifera

The genetic parameters were calculated based on the 1667 selected SNP markers. By calculating the average frequency of private alleles [28,29] in the populations evaluated (p = 0.05) and the average sample size (N = 21.54), the estimated number of migrants (Nm)—the gene flow in the Brazilian GB of E. oleifera—was 2.65. This Nm value estimated indicates that the frequency of private alleles is inversely proportional to the migration rate in the GB used in this study.
To investigate whether the alleles in various genotypes are generated from the same distribution for all populations, we applied the test for allelic differentiation. A total of 1309 (78.52%) SNP loci were significant at 5% by the Fisher method when tested for allelic differentiation, indicating that there is differentiation in the distribution of alleles among populations for the vast majority of the loci tested. Genotypic diversity test, which analyzes the distribution of diploid genotypes in various populations, was also applied to test the differentiation of populations. A total of 1613 (96.76%) SNP loci were significant, indicating strong evidence of genotypic differentiation between individuals in the populations tested. The results from allelic differentiation and genotypic diversity tests indicated the occurrence of population structure, even though the number of migrants was estimated at 2.65. Therefore, there is evidence of the occurrence of selection in the populations evaluated.
Another complementary strategy to analyze population differentiation consists of investigating whether the allele frequencies within populations and the total population match the frequencies expected in the Hardy–Weinberg equilibrium. Deviations from this equilibrium indicate the occurrence of inbreeding, selection, migration, or even a combination of these factors. When considering the 19 populations as a single population, the results indicated a complete deviation from the Hardy–Weinberg equilibrium towards the excess of heterozygotes (p-value = 0). On the other hand, tests within populations resulted in three populations in Hardy–Weinberg equilibrium (4, 9, and 14), while the other 16 (1, 2, 3, 5, 6, 7, 8, 10, 11, 12, 13, 15, 16, 17, 18, and 19) deviated significantly (p = 0.01) from the expected allele frequencies in equilibrium (Table 1). These results reinforce the hypothesis that maybe there was a selection in the evaluated populations, which would justify the occurrence of a population structure even with Nm = 2.65.
The analysis carried out using the Genepop software to calculate the genetic variance between and within the sub-populations returned significantly high and negative inbreeding coefficient (Fis) values on all populations (from −0.62 to −0.82), indicating a high rate of outbreeding among individuals within a population and an excessive number of heterozygotes (Table 2). These data may seem contradictory at first, but the high occurrence of inbreeding and the number of heterozygotes in excess can be explained by a recent genetic drift so that the total population has not yet had time to re-balance itself.
Another parameter associated with Fis that can help clarify the genetic relationships between the populations studied is the fixation index (Fst). It measures the influence of the relationship between drift and gene flow in the population structure. Genomic loci or regions with high Fst values and highly variable between populations are potentially associated with selection processes. Since selection—whether natural or artificial—tends to increase genetic differentiation, the higher the Fst value, the stronger the evidence of differentiation is [30]. The gross results of the Fst values assigned to each SNP ranged from −0.097 to 0.343, with an average of 0.031. The average neutral Fst was then used to perform a new simulation to identify loci outliers, possibly under selection effect (Figure 1). A list with the top 50 loci under positive selection and the 50 loci under negative selection is presented in the Table S1.
Obtaining a neutral Fst value from a coalescent simulation performed in the LOSITAN software allowed the identification and segregation of potential loci under selection. Based on the distance from their Fst value to the neutral Fst calculated in the coalescent simulation, we identified SNP loci with different potentials of selection intensity. The outlier loci were then identified one by one, with information on their distribution in the different genotypes. In this way, 568 loci with a higher probability of being under selection effect were selected, both directional and stabilizing, and characterized regarding the location in the genome (Table S2).

3.2. Genomic Characterization of SNPs in E. oleifera and E. guineensis

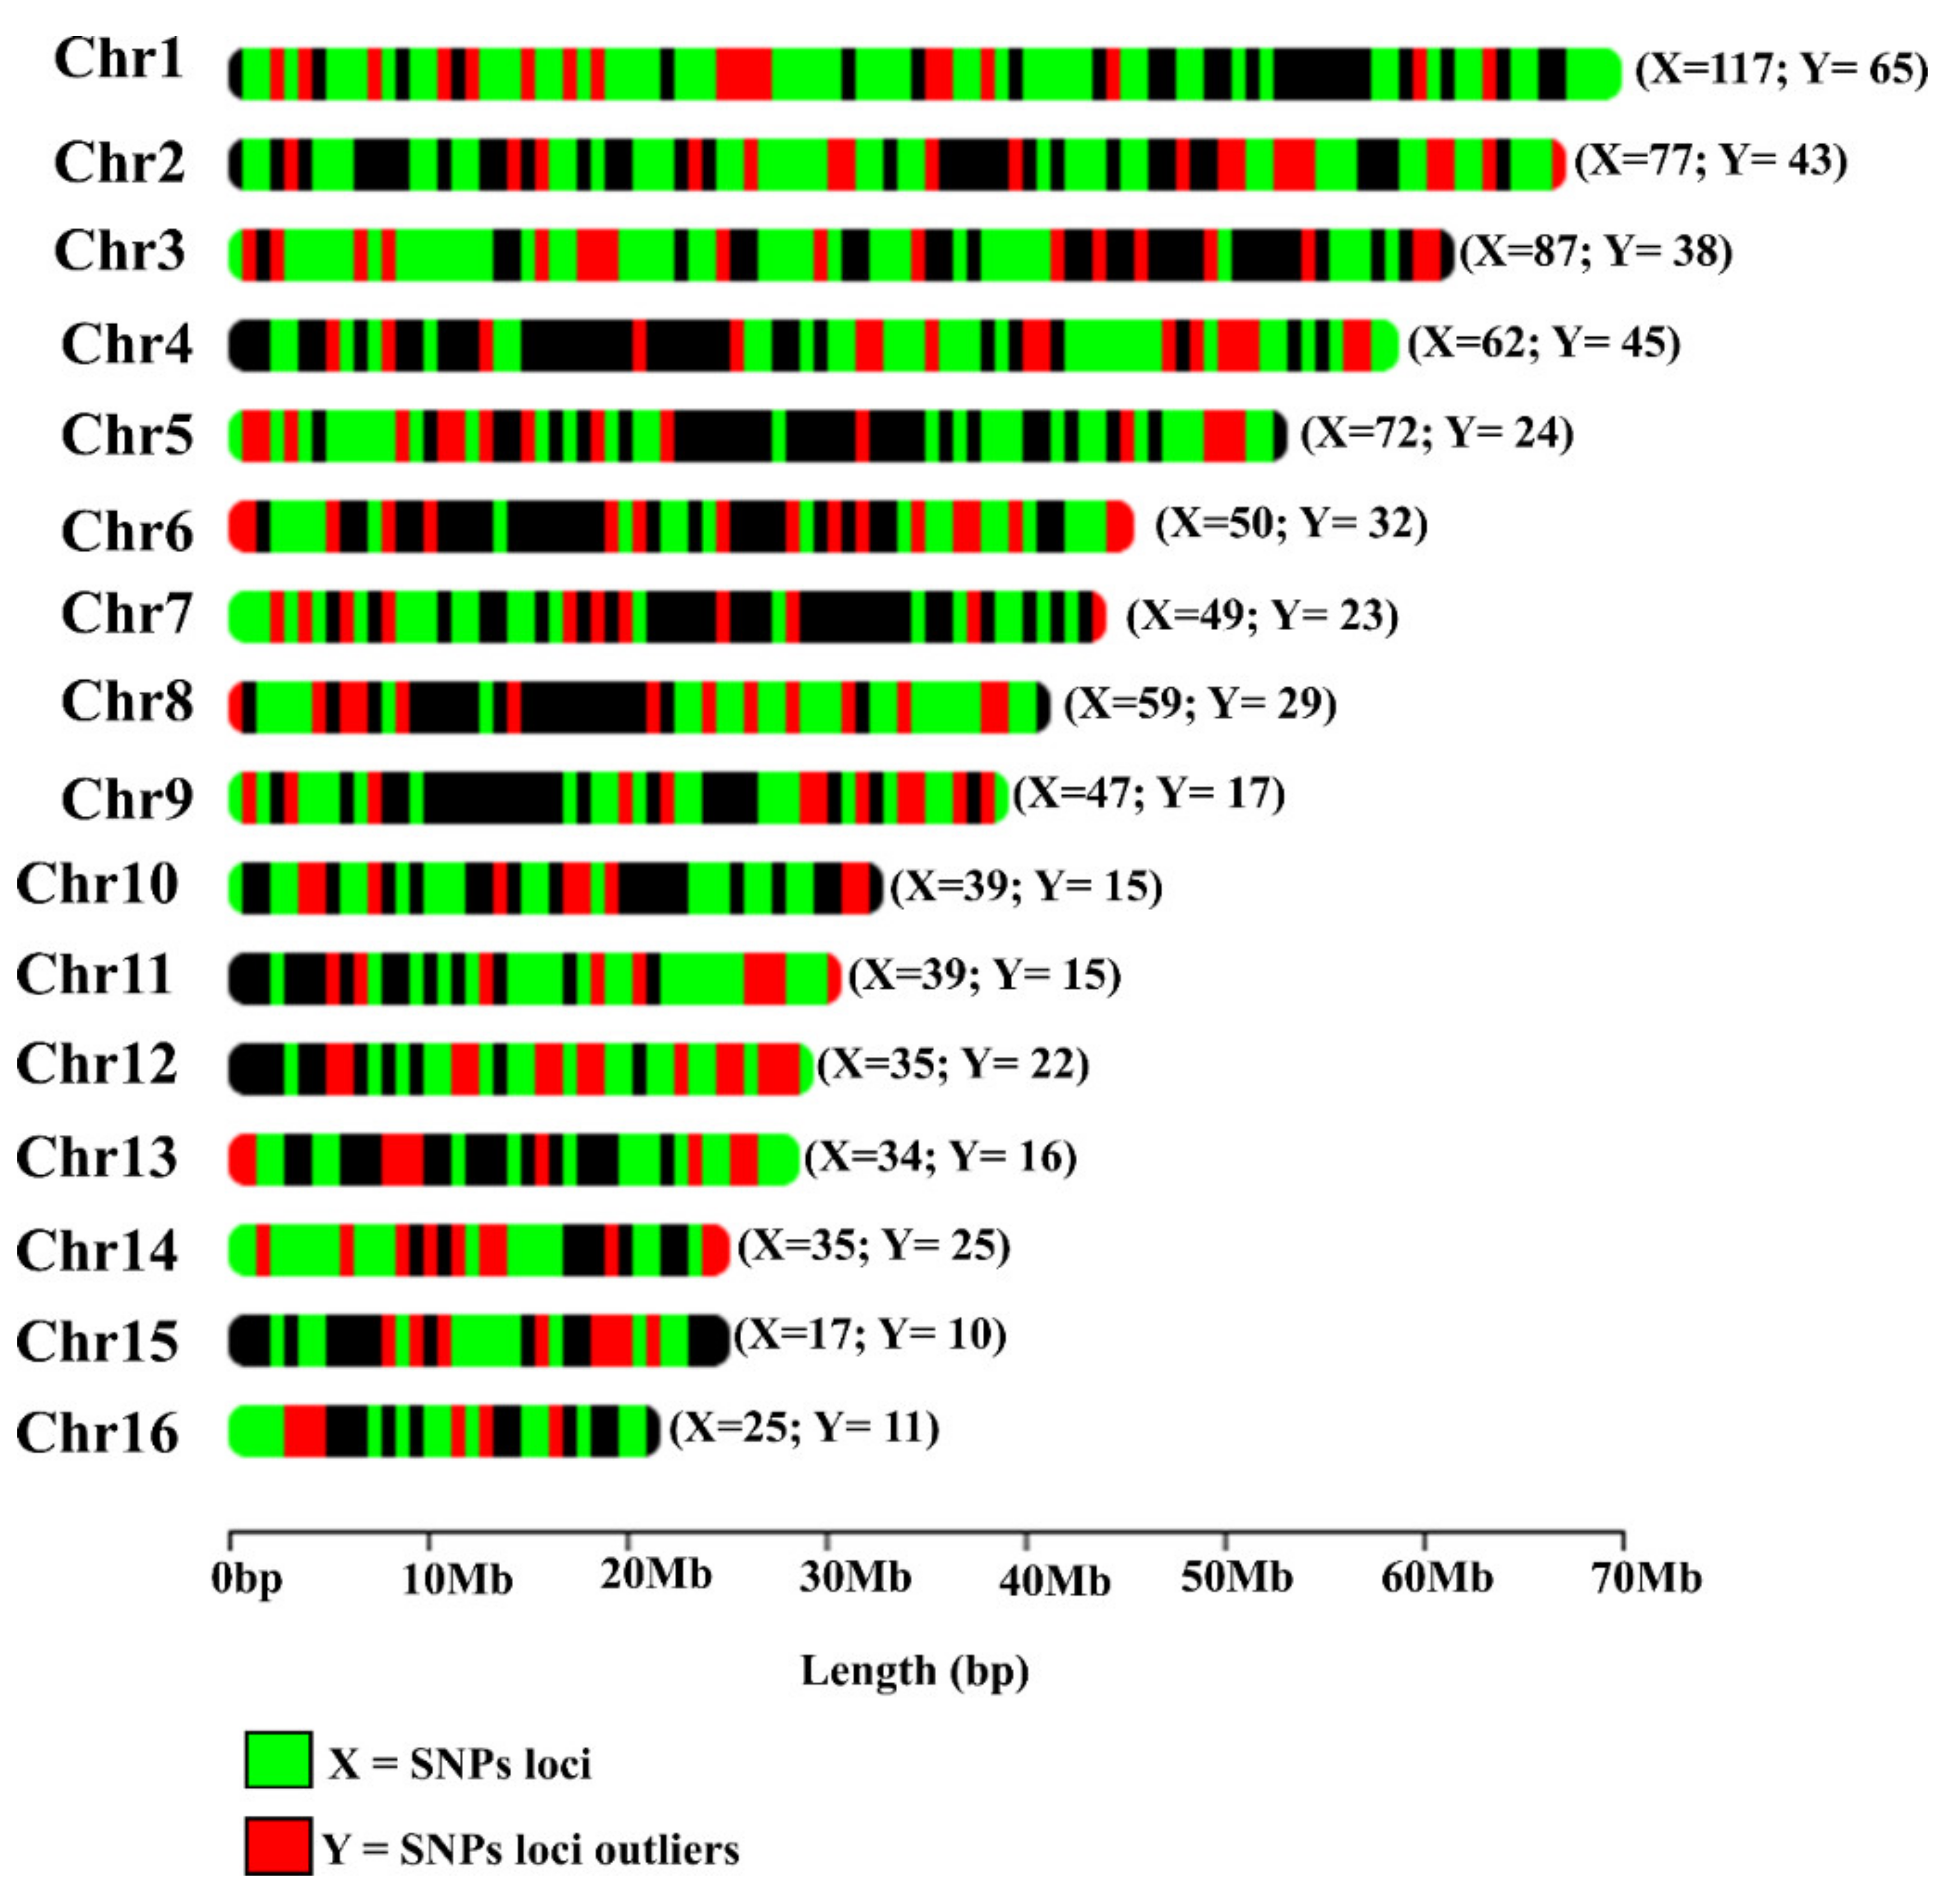
From a total of 1667 SNPs, it was possible to align 1546 and 1274 SNPs loci in the genomes of E. oleifera and E. guineensis, respectively. When searching for intragenic SNPs, 261 and 222 SNPs were identified in E. oleifera and E. guineensis, respectively. SNPs are distributed homogeneously along all 16 chromosomes of E. guineensis (Figure 2); however, for the E. oleifera draft, SNPs were found over 1208 scaffolds (Table S3).
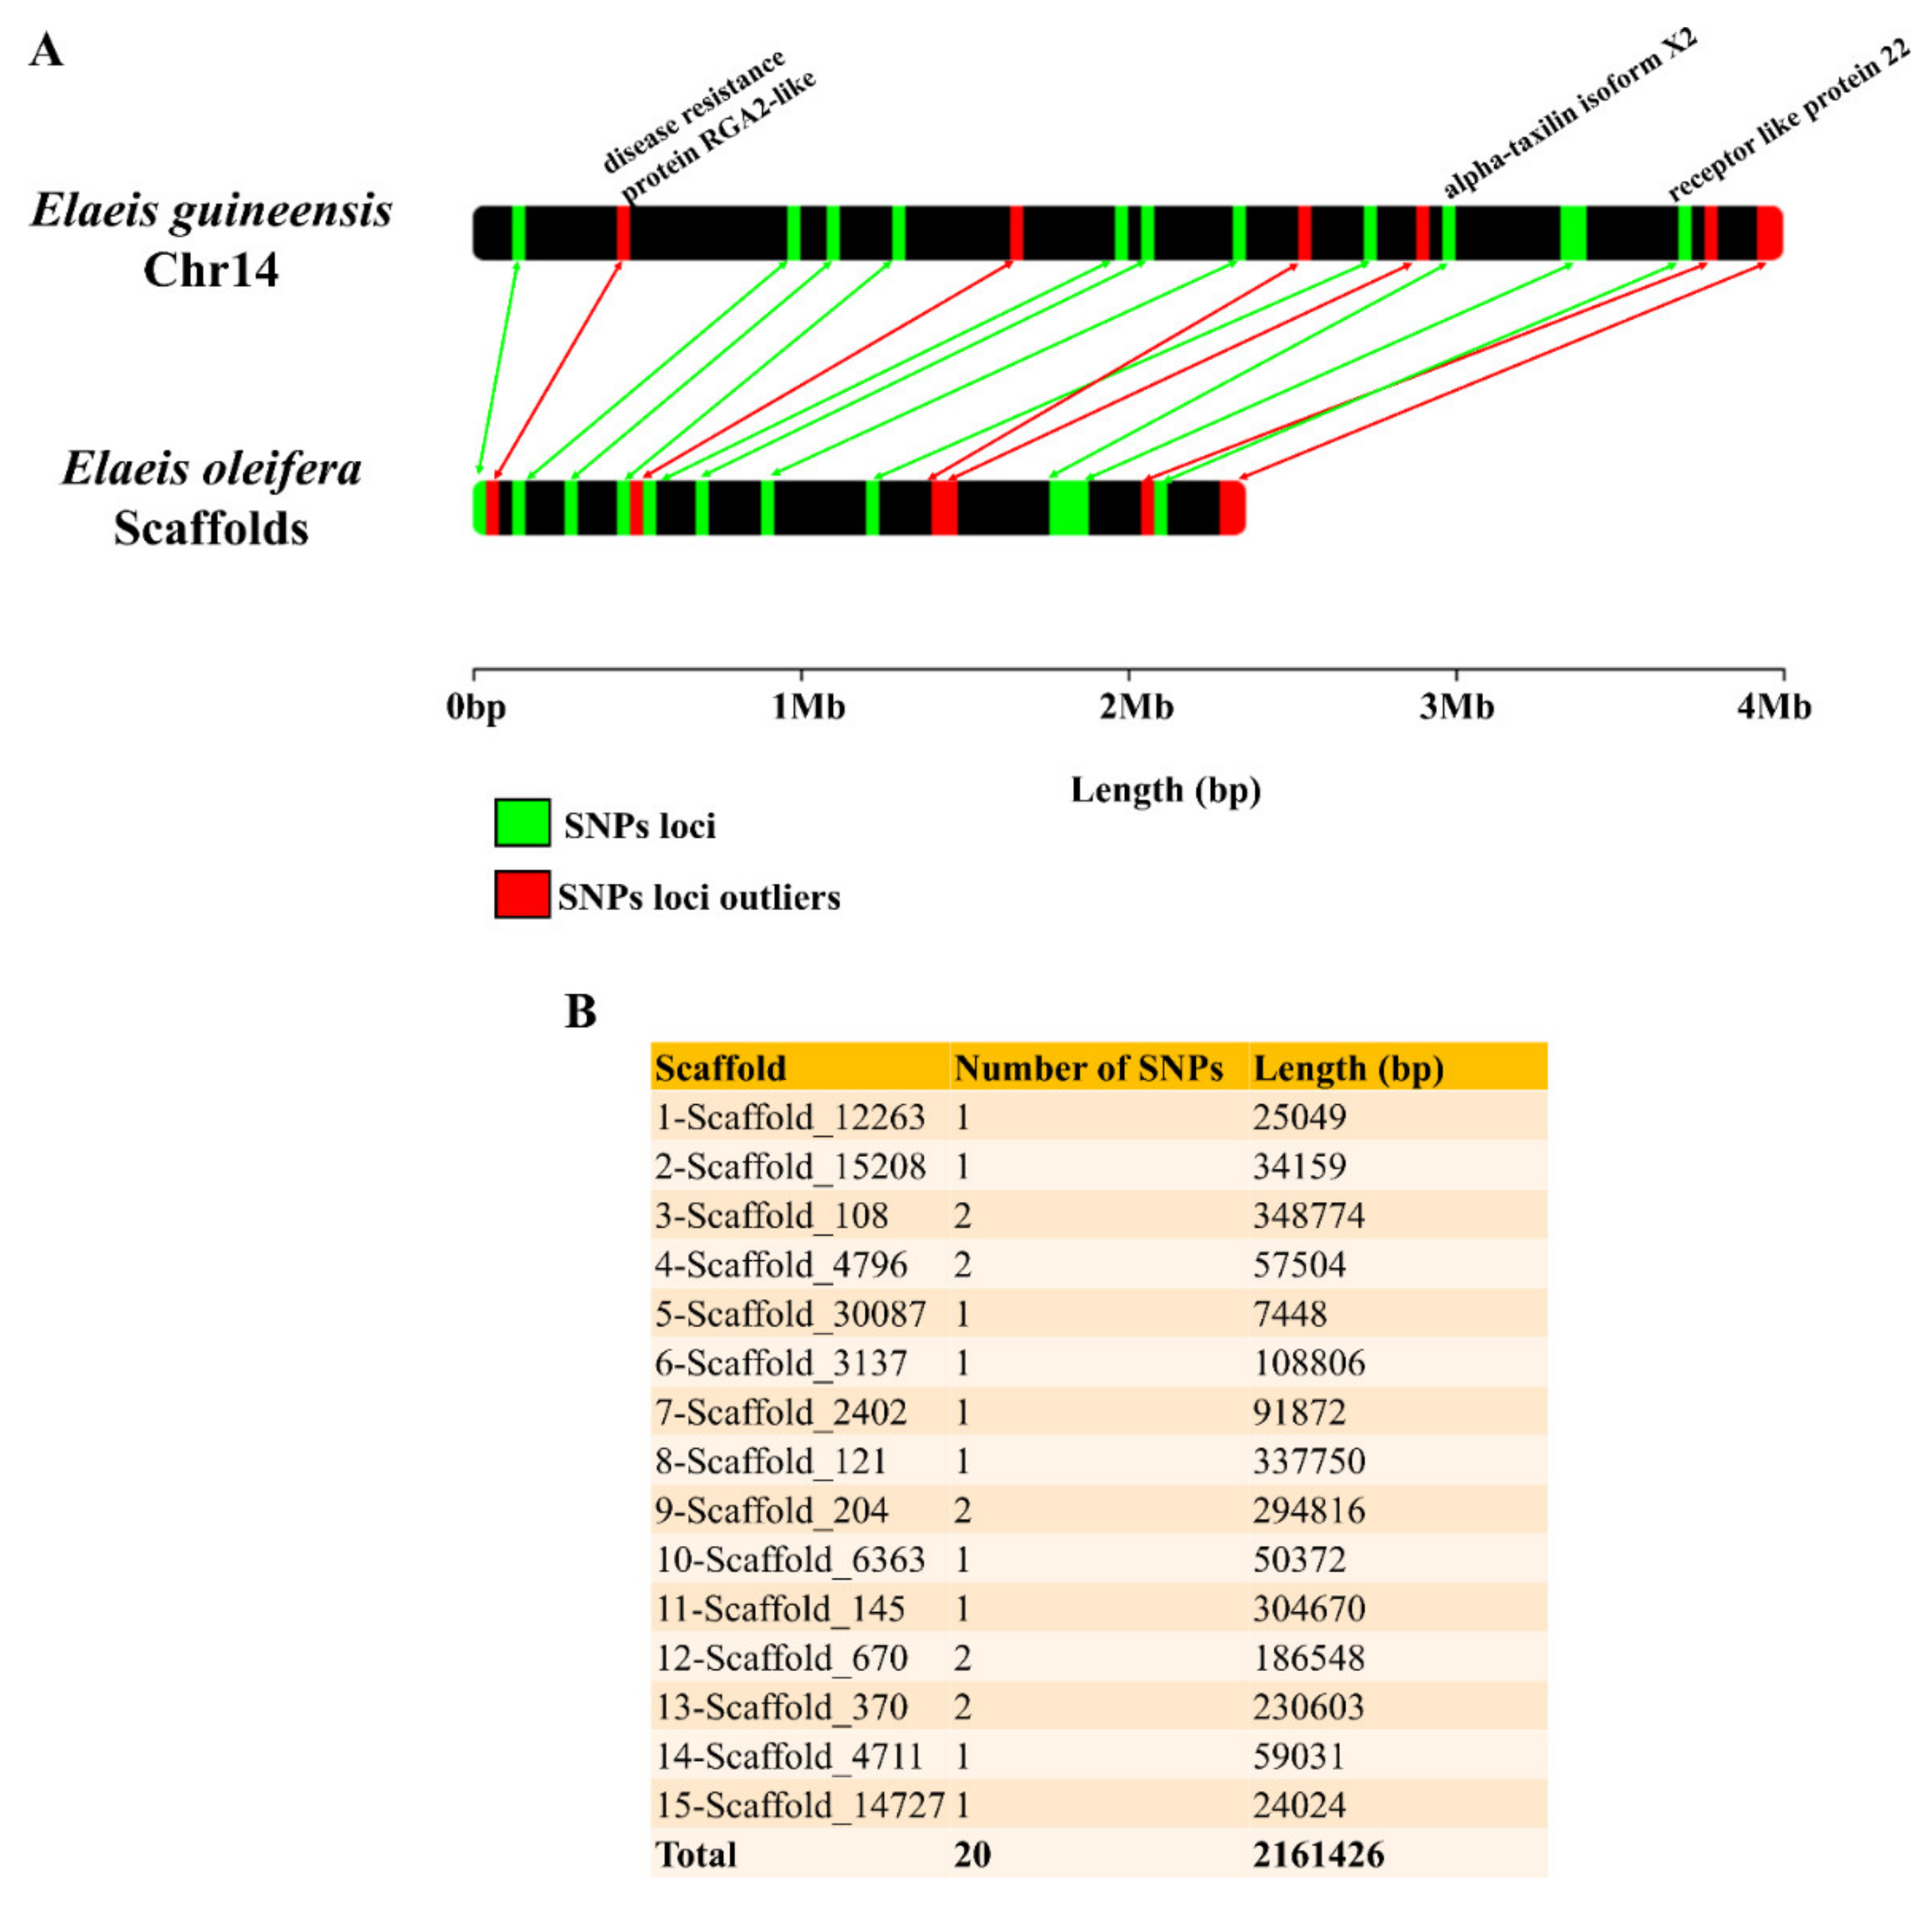
To investigate the SNP collinearity between these two species, we analyzed a region of Eg chromosome 14 (4 Mb) containing 20 SNPs which is corresponding to 15 E. oleifera scaffolds (2.1 Mb) (Figure 3A). The E. oleifera scaffolds have a variation of 1 to 2 SNPs, where the smallest one had a size of 7448 bp and the largest one, 304,670 bp (Figure 3B). Based on this analysis, it is possible to observe collinearity between the SNPs of the two species and a probable transferability between these markers.
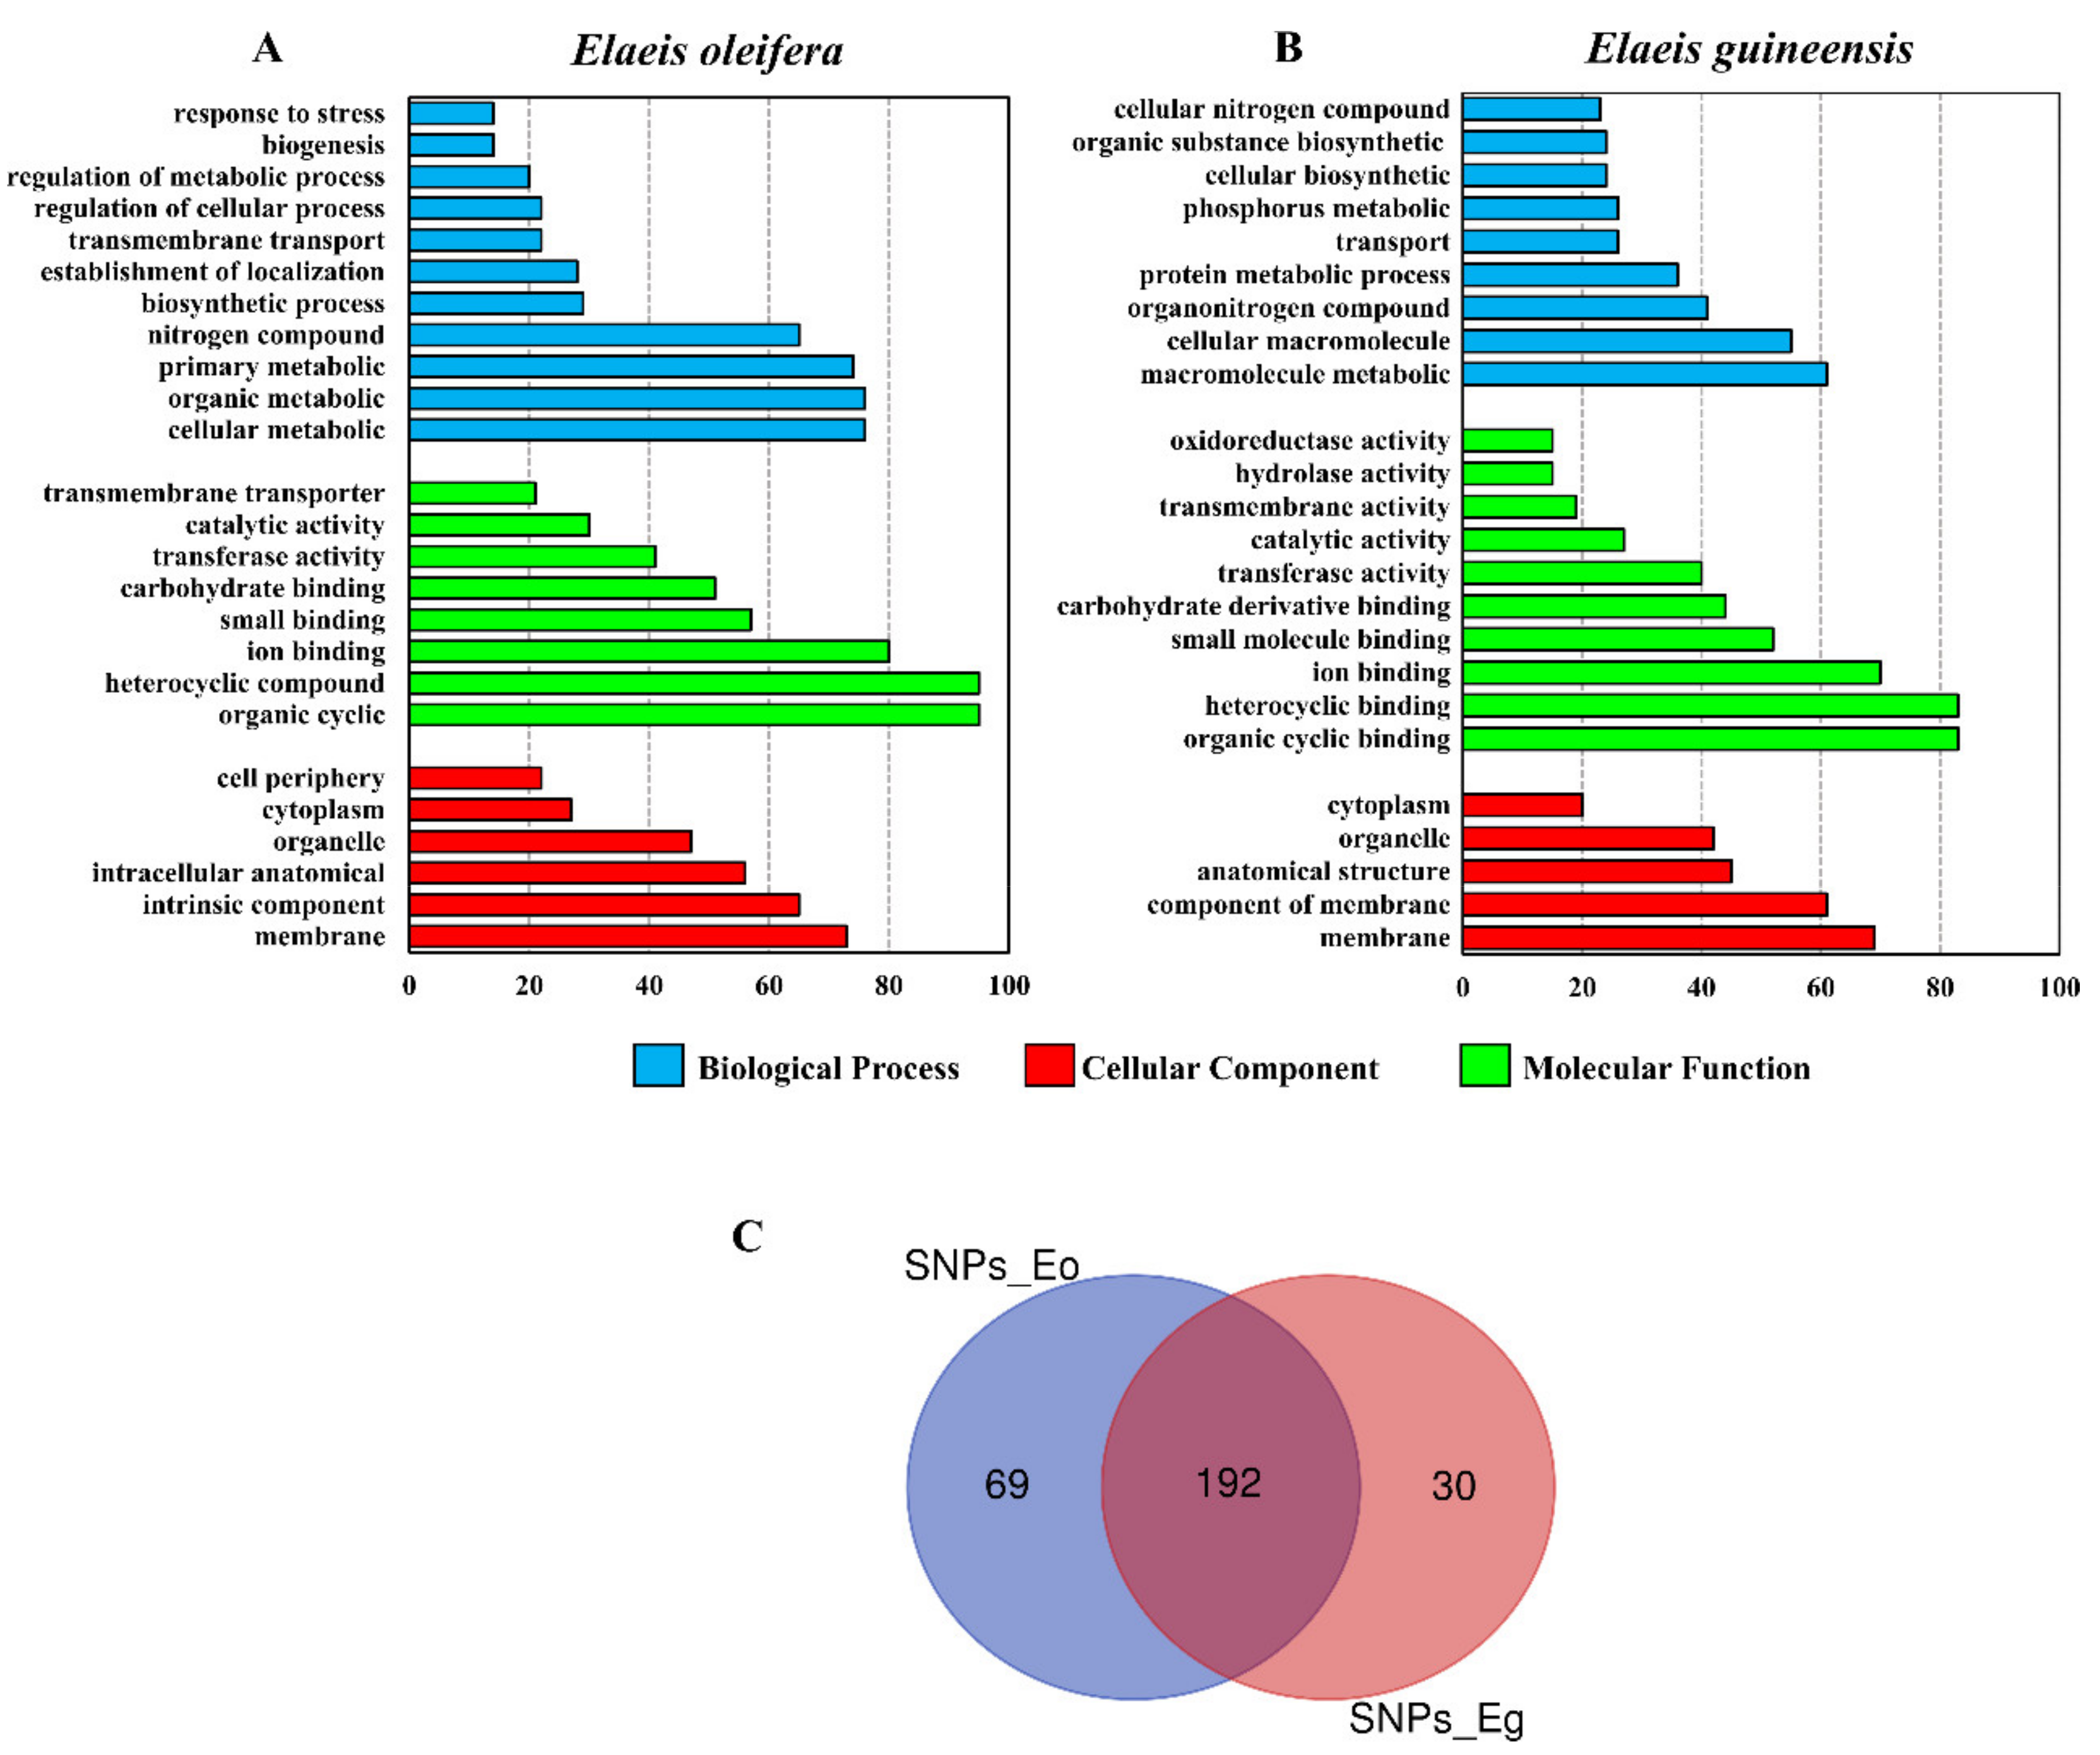
Genes containing intragenic SNPs from both species were functionally annotated according to the three main ontologies (cellular component—CC; molecular function—MF; and biological process—BP). For E. oleifera, terms such as intracellular component (CC), intrinsic component (CC), catalytic activity (MF), carbohydrate-binding (MF), and response to stress (BP) were identified (Figure 4A). For E. guineensis, terms such as hydrolase activity (MF) and catalytic activity (MF) were found (Figure 4B). When comparing the two species, it was possible to identify 69 genes containing intragenic SNPs unique to E. oleifera (Figure 4C and Table S4).

4. Discussion

The GBS technique has been successfully used in SNP discovery, mapping genome-wide markers, genomic diversity study, genetic linkage analysis, and genomic selection in a wide range of crop species [31], such as rice [32], soybean [33], maize [34,35], and wheat [36,37]. In this study, a GBS approach was applied to select a set of 1667 SNP markers and use it to access the genetic components of the E. oleifera Germplasm Bank (GB) maintained in Brazil by Embrapa, as well as to investigate the genomic distribution of these markers and occurrence of genetic differentiation resulting from the selection processes used to establish this GB.
According to Slatkin and Barton [38], gene flow values determine whether genetic drift is the only cause of high genetic variability between different sites. Nm values greater than 1.0 indicate that the gene flow is acting against the forces of genetic drift and, as a consequence, the populations that are exchanging individuals will be homogenized. Values below 1.0 indicate the occurrence of genetic drift and consequent population differentiation. However, the occurrence of selection can lead to population differentiation even with Nm values greater than 1.0. For this reason, other tests for population differentiation were carried out to investigate the possibility of occurrence of selection and population structure even with values of migration rate greater than 1.0.
The dispersion of alleles between different populations is called gene flow and can be caused by the dispersion of pollen and seeds, among other types of dispersion mechanisms. A high level of gene flow causes a reduction in genetic differentiation between the populations involved [39]. Thus, gene flow throughout evolutionary history was responsible for the greater homogenization of populations, minimizing the effects of selection and genetic drift [40]. As an economically important crop, cultivated in many countries, oil palm does not have genetic differentiation concerning the place of origin due to the continued expansion and commercialization of its seeds. Conversely, the dispersion of E. oleifera seeds is more restricted, due to its low level of commercialization [14,41]. When a small portion of a population separates from the parental population, the gene frequencies of the new population can be quite different from the one that gave rise to it [42]. Some authors support the hypothesis that these populations have experienced drift effects and recent bottleneck events [3,43].
The few previous genetic studies using molecular markers in E. oleifera available observed lower genetic diversity of E. oleifera [12,15,44,45], compared to E. guineensis [46], with greater genetic differentiation between populations. Arias, González, Prada, Ayala-Diaz, Montoya, Daza and Romero [42] analyzed the genetic diversity of natural populations of caiaué from four countries (Brazil, Colombia, Ecuador, and Peru), and all samples were grouped according to their country of origin. The grouping associated with the geographic origin and location-specific alleles is consistent with the results obtained by Barcelos, Amblard, Berthaud and Seguin [3], who discriminated groups between populations of E. oleifera from French Guiana, Suriname, and Peru, through specific alleles. Moretzsohn, Ferreira, Amaral, Coelho, Grattapaglia and Ferreira [12] also pointed out that the distribution of genotypes along the Amazon River is more determinant in the grouping of caiaué plants than their geographical distances, indicating that Rio acts as a seed disperser. In a previous work, the set of SNPs used in this study was applied in the analysis of genetic diversity and defined a core collection model for the germplasm bank of caiaué, the genetic diversity found was moderate, with greater interpopulation differentiation [17].
Among the advantages of the GBS technique, the sampling of markers along the entire genome is highlighted, thus it is possible to use these markers for studies of linkage disequilibrium and genomic selection [47,48,49]. Based on our results, it was possible to observe a wide distribution of markers along the genomes of E. oleifera and E. guineensis, thus, together with phenotypic data, these markers can be used for genomic association studies. E. oleifera and E. guineensis are phylogenetically closely related species [25]. Based on our analysis, it was possible to observe a wide synteny and collinearity of SNPs markers in the genomes of the two species and a high similarity in the annotation of genes containing SNPs (intragenic SNPs), these results indicate a potential transferability of these markers that can also be applied in breeding genetic of E. guineensis. The intergenic and intragenic SNPs identified were used for the analysis of genetic diversity and population structure of these genotypes [17] and in-depth analysis through genomic re-sequencing can better clarify the genetic and genomic differences between these genotypes.
The analysis of synteny and collinearity between the SNPs highlights the difficulty of comparing complete genomes (E. guineensis) and drafts (E. oleifera). This small number of SNPs was used due to the difficulty of comparing in the correct order between the E. oleifera draft assembled in 85612 scaffolds [26] and the E. guineensis genome assembled in 16 scaffolds (chromosomes) [25]. This approach can be computationally optimized and automated in order to correctly order small scaffolds and improve the assembly of genome drafts, especially complex plant genomes.
Understanding genetic diversity and distribution are essential for the conservation and use of E. oleifera. These results demonstrate that this species has a specific genetic structure and good genetic variability within the 19 populations that make up for the Brazilian GB of caiaué. In this way, the ex situ conservation strategy to be applied must prioritize a larger number of individuals rather than a large number of populations. The identification of genes associated with SNP loci under strong selection will subsidize decisions for conservation or use in breeding programs.

5. Conclusions

The E. oleifera populations from the Brazilian Amazon rainforest evaluated in this study have specific genetic structures and good genetic variability within and between them. There is evidence of selection occurring in these populations. We have selected 568 loci most likely to be under selection effect (both directional and stabilizing), these SNPs have a wide distribution along the genomes of E. oleifera and E. guineensis, and many of them are intragenic; thus, they are markers that can be selected for further studies of linkage disequilibrium, transferability, and genomic selection.

Supplementary Materials

The following supporting information can be downloaded at: https://www.mdpi.com/article/10.3390/d14040270/s1, Supplementary Table S1: List of the 568 SNP loci outliers identified with the greatest significance, both for stabilizing and directional selection; from a set of 1667 SNP loci previously identified in the Brazilian E. oleifera Germplasm Bank via a sequencing genotyping approach. Supplementary Table S2: Mapping of SNP loci in the reference genomes of Elaeis oleifera and Elaeis guineensis. Supplementary Table S3: (A). Intragenic SNPs present in both species (E. oleifera and E. guienenis); (B). Intragenic SNPs present exclusively in E. oleifera, and (C). Intragenic SNPs present exclusively in E. guineensis. Supplementary Table S4: Top 100 outlier loci (50 under positive selection and 50 under negative selection) for neutral Fst, performed in the LOSITAN software using the set of 1667 SNP loci analyzed in E. oleifera plants from half-sibling families, which make up for a group of 19 populations sampled in six major geographic regions of the Brazilian Amazon rainforest.

Author Contributions

M.T.S.J., A.A.A. and A.P.L. conceived the experiment(s); A.P.L. and V.M.P. conducted the experiment(s); M.T.S.J., V.M.P., A.P.L. and J.A.F.F. analyzed the results; M.T.S.J., A.P.L. and J.A.F.F. wrote the manuscript. All authors have read and agreed to the published version of the manuscript.

Funding

This research was funded by the grant (01.13.0315.00 DendêPalm Project) for this study was awarded by the Brazilian Ministry of Science, Technology, and Innovation (MCTI) via the Brazilian Innovation Agency FINEP.

Institutional Review Board Statement

Not applicable.

Informed Consent Statement

Informed consent was obtained from all subjects involved in the study.

Data Availability Statement

The data-sets used and/or analyzed during the current study are available from the corresponding author on reasonable request.

Acknowledgments

The authors acknowledge funding to V.M.P. by the Coordination for the Improvement of Higher Education Personnel (CAPES), a Foundation within the Ministry of Education in Brazil, via the Graduate Program in Plant Biotechnology, Federal University of Lavras (UFLA).

Conflicts of Interest

The authors declare no conflict of interest.

References

  1. Meyer, R.S.; DuVal, A.E.; Jensen, H.R. Patterns and processes in crop domestication: An historical review and quantitative analysis of 203 global food crops. New Phytol. 2012, 196, 29–48. [Google Scholar] [CrossRef] [PubMed]
  2. Murphy, D.J. The future of oil palm as a major global crop: Opportunities and challenges. J. Oil Palm Res. 2014, 26, 1–24. [Google Scholar]
  3. Barcelos, E.; Amblard, P.; Berthaud, J.; Seguin, M. Genetic diversity and relationship in American and African oil palm as revealed by RFLP and AFLP molecular markers. Pesqui. Agropecu. Bras. 2002, 37, 1105–1114. [Google Scholar] [CrossRef] [Green Version]
  4. Dransfield, J.; Uhl, N.W.; Asmussen, C.B.; Baker, W.J.; Harley, M.M.; Lewis, C.E. A new phylogenetic classification of the palm family, Arecaceae. Kew Bull. 2005, 60, 559–569. [Google Scholar]
  5. Cunha, R.D.; Lopes, R.; Rocha, R.; Lima, W.; Teixeira, P.; Barcelos, E.; Rodrigues, M. Domesticação e melhoramento de caiaué. In Domesticação e Melhoramento: Espécies Amazônicas; Editora da Universidade de Viçosa: Viçosa, Brazil, 2009; pp. 275–296. [Google Scholar]
  6. de Farias, M.P.; de Capdeville, G.; Falcão, R.; de Moraes, P.B.; Leão, A.P.; Camillo, J.; da Cunha, R.N.V.; Alves, A.A.; Júnior, M.T.S. Microscopic characterization of American oil palm (Elaeis oleifera (Kunth) Cortés) floral development. Flora 2018, 243, 88–100. [Google Scholar] [CrossRef]
  7. Meléndez, M.R.; Ponce, W.P. Pollination in the oil palms Elaeis guineensis, E. oleifera and their hybrids (OxG), in tropical America. Pesqui. Agropecu. Trop. 2016, 46, 102–110. [Google Scholar] [CrossRef] [Green Version]
  8. Bittencourt, C.B.; de Castro Lins, P.; de Jesus Boari, A.; Quirino, B.F.; Teixeira, W.G.; Junior, M.T.S. Oil Palm Fatal Yellowing (FY), a Disease with an Elusive Causal Agent; IntechOpen: London, UK, 2021. [Google Scholar]
  9. Okoye, M.; Bakoumé, C.; Uguru, M.; Singh, R.; Okwuagwu, C. Genetic relationships between elite oil palms from Nigeria and selected breeding and germplasm materials from Malaysia via Simple Sequence Repeat (SSR) Markers. J. Agric. Sci. 2016, 8, 159. [Google Scholar] [CrossRef] [Green Version]
  10. Cardona, C.C.C.; Coronado, Y.M.; Conronado, A.C.M.; Ochoa, I. Genetic diversity in oil palm (Elaeis guineensis Jacq) using RAM (Random Amplified Microsatellites). Bragantia 2018, 77, 546–556. [Google Scholar] [CrossRef]
  11. Budiman, L.F.; Apriyanto, A.; Pancoro, A.; Sudarsono, S. Genetic diversity analysis of Tenera × Tenera and Tenera × Pisifera Crosses and D self of oil palm (Elaeis guineensis) parental populations originating from Cameroon. Biodivers. J. Biol. Divers. 2019, 20, 937–949. [Google Scholar] [CrossRef] [Green Version]
  12. Moretzsohn, M.d.C.; Ferreira, M.; Amaral, Z.; Coelho, P.J.d.A.; Grattapaglia, D.; Ferreira, M.E. Genetic diversity of Brazilian oil palm (Elaeis oleifera HBK) germplasm collected in the Amazon Forest. Euphytica 2002, 124, 35–45. [Google Scholar] [CrossRef]
  13. Araya, E.; Alvarado, A.; Escobar, R. Use of DNA markers for fingerprinting compact clones and determining the genetic relationship between Elaeis oleifera germplasm origins. In Proceedings of the International Society for Oil Palm Breeders (ISOPB), Kuala Lumpur, Malaysia, 9–12 November 2009; pp. 4–5. [Google Scholar]
  14. Arias, D.; Montoya, C.; Romero, H. Molecular characterization of oil palm Elaeis guineensis Jacq. materials from Cameroon. Plant Genet. Resour. 2013, 11, 140–148. [Google Scholar] [CrossRef]
  15. Ithnin, M.; Teh, C.-K.; Ratnam, W. Genetic diversity of Elaeis oleifera (HBK) Cortes populations using cross species SSRs: Implication’s for germplasm utilization and conservation. BMC Genet. 2017, 18, 1–12. [Google Scholar] [CrossRef] [Green Version]
  16. Natawijaya, A.; Ardie, S.W.; Syukur, M.; Maskromo, I.; Hartana, A.; Sudarsono, S. Genetic structure and diversity between and within African and American oil palm species based on microsatellite markers. Biodivers. J. Biol. Divers. 2019, 20, 3365. [Google Scholar] [CrossRef] [Green Version]
  17. Pereira, V.M.; Filho, J.A.F.; Leão, A.P.; Vargas, L.H.G.; de Farias, M.P.; Rios, S.d.A.; da Cunha, R.N.V.; Formighieri, E.F.; Alves, A.A.; Souza, M.T. American oil palm from Brazil: Genetic diversity, population structure, and core collection. Crop Sci. 2020, 60, 3212–3227. [Google Scholar] [CrossRef]
  18. Rios, S.d.A.; da Cunha, R.; Lopes, R.; da Silva, E. Recursos Genéticos de Palma de Óleo (Elaeis guineensis Jacq.) e Caiuaé (Elaeis oleifera (HBK) Cortes); Embrapa Amazônia Ocidental-Documentos (INFOTECA-E): Itacoatiara, Brazil, 2012. [Google Scholar]
  19. Doyle, J.J. Isolation of plant DNA from fresh tissue. Focus 1990, 12, 13–15. [Google Scholar]
  20. Langmead, B.; Trapnell, C.; Pop, M.; Salzberg, S.L. Ultrafast and memory-efficient alignment of short DNA sequences to the human genome. Genome Biol. 2009, 10, 1–10. [Google Scholar] [CrossRef] [Green Version]
  21. Wright, S. Evolution and the Genetics of Populations: Vol. 2. The Theory of Gene Frequencies; The University of Chicago Press: Chicago, IL, USA, 1969. [Google Scholar]
  22. Hastings, W.K. Monte Carlo sampling methods using Markov chains and their applications. Biometrika 1970, 57, 97–109. [Google Scholar] [CrossRef]
  23. Levene, H. Robust tests for equality of variances. In Contributions to Probability and Statistics: Essays in Honor of Harold Hotelling; Olkin, I., Ghurye, S.G., Hoeffding, W., Madow, W.G., Mann, H.B., Eds.; Stanford University Press: Redwood City, CA, USA, 1960. [Google Scholar]
  24. Antao, T.; Lopes, A.; Lopes, R.J.; Beja-Pereira, A.; Luikart, G. LOSITAN: A workbench to detect molecular adaptation based on a F ST-outlier method. BMC Bioinform. 2008, 9, 1–5. [Google Scholar] [CrossRef] [Green Version]
  25. Singh, R.; Ong-Abdullah, M.; Low, E.-T.L.; Manaf, M.A.A.; Rosli, R.; Nookiah, R.; Ooi, L.C.-L.; Ooi, S.E.; Chan, K.-L.; Halim, M.A. Oil palm genome sequence reveals divergence of interfertile species in Old and New worlds. Nature 2013, 500, 335–339. [Google Scholar] [CrossRef] [Green Version]
  26. Filho, J.A.F.; de Brito, L.S.; Leão, A.P.; Alves, A.A.; Formighieri, E.F.; Souza, M.T. In silico approach for characterization and comparison of repeats in the genomes of oil and date palms. Bioinform. Biol. Insights 2017, 11, 1177932217702388. [Google Scholar] [CrossRef] [Green Version]
  27. Götz, S.; García-Gómez, J.M.; Terol, J.; Williams, T.D.; Nagaraj, S.H.; Nueda, M.J.; Robles, M.; Talón, M.; Dopazo, J.; Conesa, A. High-throughput functional annotation and data mining with the Blast2GO suite. Nucleic Acids Res. 2008, 36, 3420–3435. [Google Scholar] [CrossRef]
  28. Slatkin, M. Rare alleles as indicators of gene flow. Evolution 1985, 39, 53–65. [Google Scholar] [CrossRef]
  29. Barton, N.; Slatkin, M. A quasi-equilibrium theory of the distribution of rare alleles in a subdivided population. Heredity 1986, 56, 409–415. [Google Scholar] [CrossRef] [Green Version]
  30. Nielsen, R. Molecular signatures of natural selection. Annu. Rev. Genet. 2005, 39, 197–218. [Google Scholar] [CrossRef] [Green Version]
  31. Kim, C.; Guo, H.; Kong, W.; Chandnani, R.; Shuang, L.-S.; Paterson, A.H. Application of genotyping by sequencing technology to a variety of crop breeding programs. Plant Sci. 2016, 242, 14–22. [Google Scholar] [CrossRef] [Green Version]
  32. Steele, K.A.; Quinton-Tulloch, M.J.; Amgai, R.B.; Dhakal, R.; Khatiwada, S.P.; Vyas, D.; Heine, M.; Witcombe, J.R. Accelerating public sector rice breeding with high-density KASP markers derived from whole genome sequencing of indica rice. Mol. Breed. 2018, 38, 1–13. [Google Scholar] [CrossRef] [Green Version]
  33. Heim, C.B.; Gillman, J.D. Genotyping-by-sequencing-based investigation of the genetic architecture responsible for a∼ sevenfold increase in soybean seed stearic acid. G3 Genes Genomes Genet. 2017, 7, 299–308. [Google Scholar] [CrossRef] [PubMed] [Green Version]
  34. Gouesnard, B.; Negro, S.; Laffray, A.; Glaubitz, J.; Melchinger, A.; Revilla, P.; Moreno-Gonzalez, J.; Madur, D.; Combes, V.; Tollon-Cordet, C. Genotyping-by-sequencing highlights original diversity patterns within a European collection of 1191 maize flint lines, as compared to the maize USDA genebank. Theor. Appl. Genet. 2017, 130, 2165–2189. [Google Scholar] [CrossRef] [PubMed]
  35. Su, C.; Wang, W.; Gong, S.; Zuo, J.; Li, S.; Xu, S. High density linkage map construction and mapping of yield trait QTLs in maize (Zea mays) using the genotyping-by-sequencing (GBS) technology. Front. Plant Sci. 2017, 8, 706. [Google Scholar] [CrossRef] [PubMed] [Green Version]
  36. Eltaher, S.; Sallam, A.; Belamkar, V.; Emara, H.A.; Nower, A.A.; Salem, K.F.; Poland, J.; Baenziger, P.S. Genetic diversity and population structure of F3: 6 Nebraska winter wheat genotypes using genotyping-by-sequencing. Front. Genet. 2018, 9, 76. [Google Scholar] [CrossRef]
  37. Hussain, W.; Baenziger, P.S.; Belamkar, V.; Guttieri, M.J.; Venegas, J.P.; Easterly, A.; Sallam, A.; Poland, J. Genotyping-by-sequencing derived high-density linkage map and its application to QTL mapping of flag leaf traits in bread wheat. Sci. Rep. 2017, 7, 1–15. [Google Scholar] [CrossRef]
  38. Slatkin, M.; Barton, N.H. A comparison of three indirect methods for estimating average levels of gene flow. Evolution 1989, 43, 1349–1368. [Google Scholar] [CrossRef]
  39. Slatkin, M. Gene flow and the geographic structure of natural populations. Science 1987, 236, 787–792. [Google Scholar] [CrossRef]
  40. Ridley, M. Evolução; Artmed Editora: São Paulo, Brazil, 2009. [Google Scholar]
  41. Arias, D.; González, M.; Prada, F.; Restrepo, E.; Romero, H. Morpho-agronomic and molecular characterisation of oil palm Elaeis guineensis Jacq. material from Angola. Tree Genet. Genomes 2013, 9, 1283–1294. [Google Scholar] [CrossRef]
  42. Arias, D.; González, M.; Prada, F.; Ayala-Diaz, I.; Montoya, C.; Daza, E.; Romero, H.M. Genetic and phenotypic diversity of natural American oil palm (Elaeis oleifera (HBK) Cortés) accessions. Tree Genet. Genomes 2015, 11, 1–13. [Google Scholar] [CrossRef]
  43. Billotte, N.; Risterucci, A.-M.; Barcelos, E.; Noyer, J.-L.; Amblard, P.; Baurens, F.-C. Development, characterisation, and across-taxa utility of oil palm (Elaeis guineensis Jacq.) microsatellite markers. Genome 2001, 44, 413–425. [Google Scholar] [CrossRef]
  44. Zaki, N.M.; Ismail, I.; Rosli, R.; Chin, T.N.; Singh, R. Development and characterization of Elaeis oleifera microsatellite markers. Sains Malays. 2010, 39, 909–912. [Google Scholar]
  45. Zaki, N.M.; Singh, R.; Rosli, R.; Ismail, I. Elaeis oleifera genomic-SSR markers: Exploitation in oil palm germplasm diversity and cross-amplification in Arecaceae. Int. J. Mol. Sci. 2012, 13, 4069–4088. [Google Scholar] [CrossRef]
  46. Bakoumé, C.; Wickneswari, R.; Siju, S.; Rajanaidu, N.; Kushairi, A.; Billotte, N. Genetic diversity of the world’s largest oil palm (Elaeis guineensis Jacq.) field genebank accessions using microsatellite markers. Genet. Resour. Crop Evol. 2015, 62, 349–360. [Google Scholar] [CrossRef]
  47. Niu, S.; Song, Q.; Koiwa, H.; Qiao, D.; Zhao, D.; Chen, Z.; Liu, X.; Wen, X. Genetic diversity, linkage disequilibrium, and population structure analysis of the tea plant (Camellia sinensis) from an origin center, Guizhou plateau, using genome-wide SNPs developed by genotyping-by-sequencing. BMC Plant Biol. 2019, 19, 1–12. [Google Scholar] [CrossRef]
  48. Thurow, L.B.; Gasic, K.; Raseira, M.d.C.B.; Bonow, S.; Castro, C.M. Genome-wide SNP discovery through genotyping by sequencing, population structure, and linkage disequilibrium in Brazilian peach breeding germplasm. Tree Genet. Genomes 2020, 16, 1–14. [Google Scholar] [CrossRef]
  49. Delfini, J.; Moda-Cirino, V.; dos Santos Neto, J.; Ruas, P.M.; Sant’Ana, G.C.; Gepts, P.; Gonçalves, L.S.A. Population structure, genetic diversity and genomic selection signatures among a Brazilian common bean germplasm. Sci. Rep. 2021, 11, 1–12. [Google Scholar] [CrossRef]
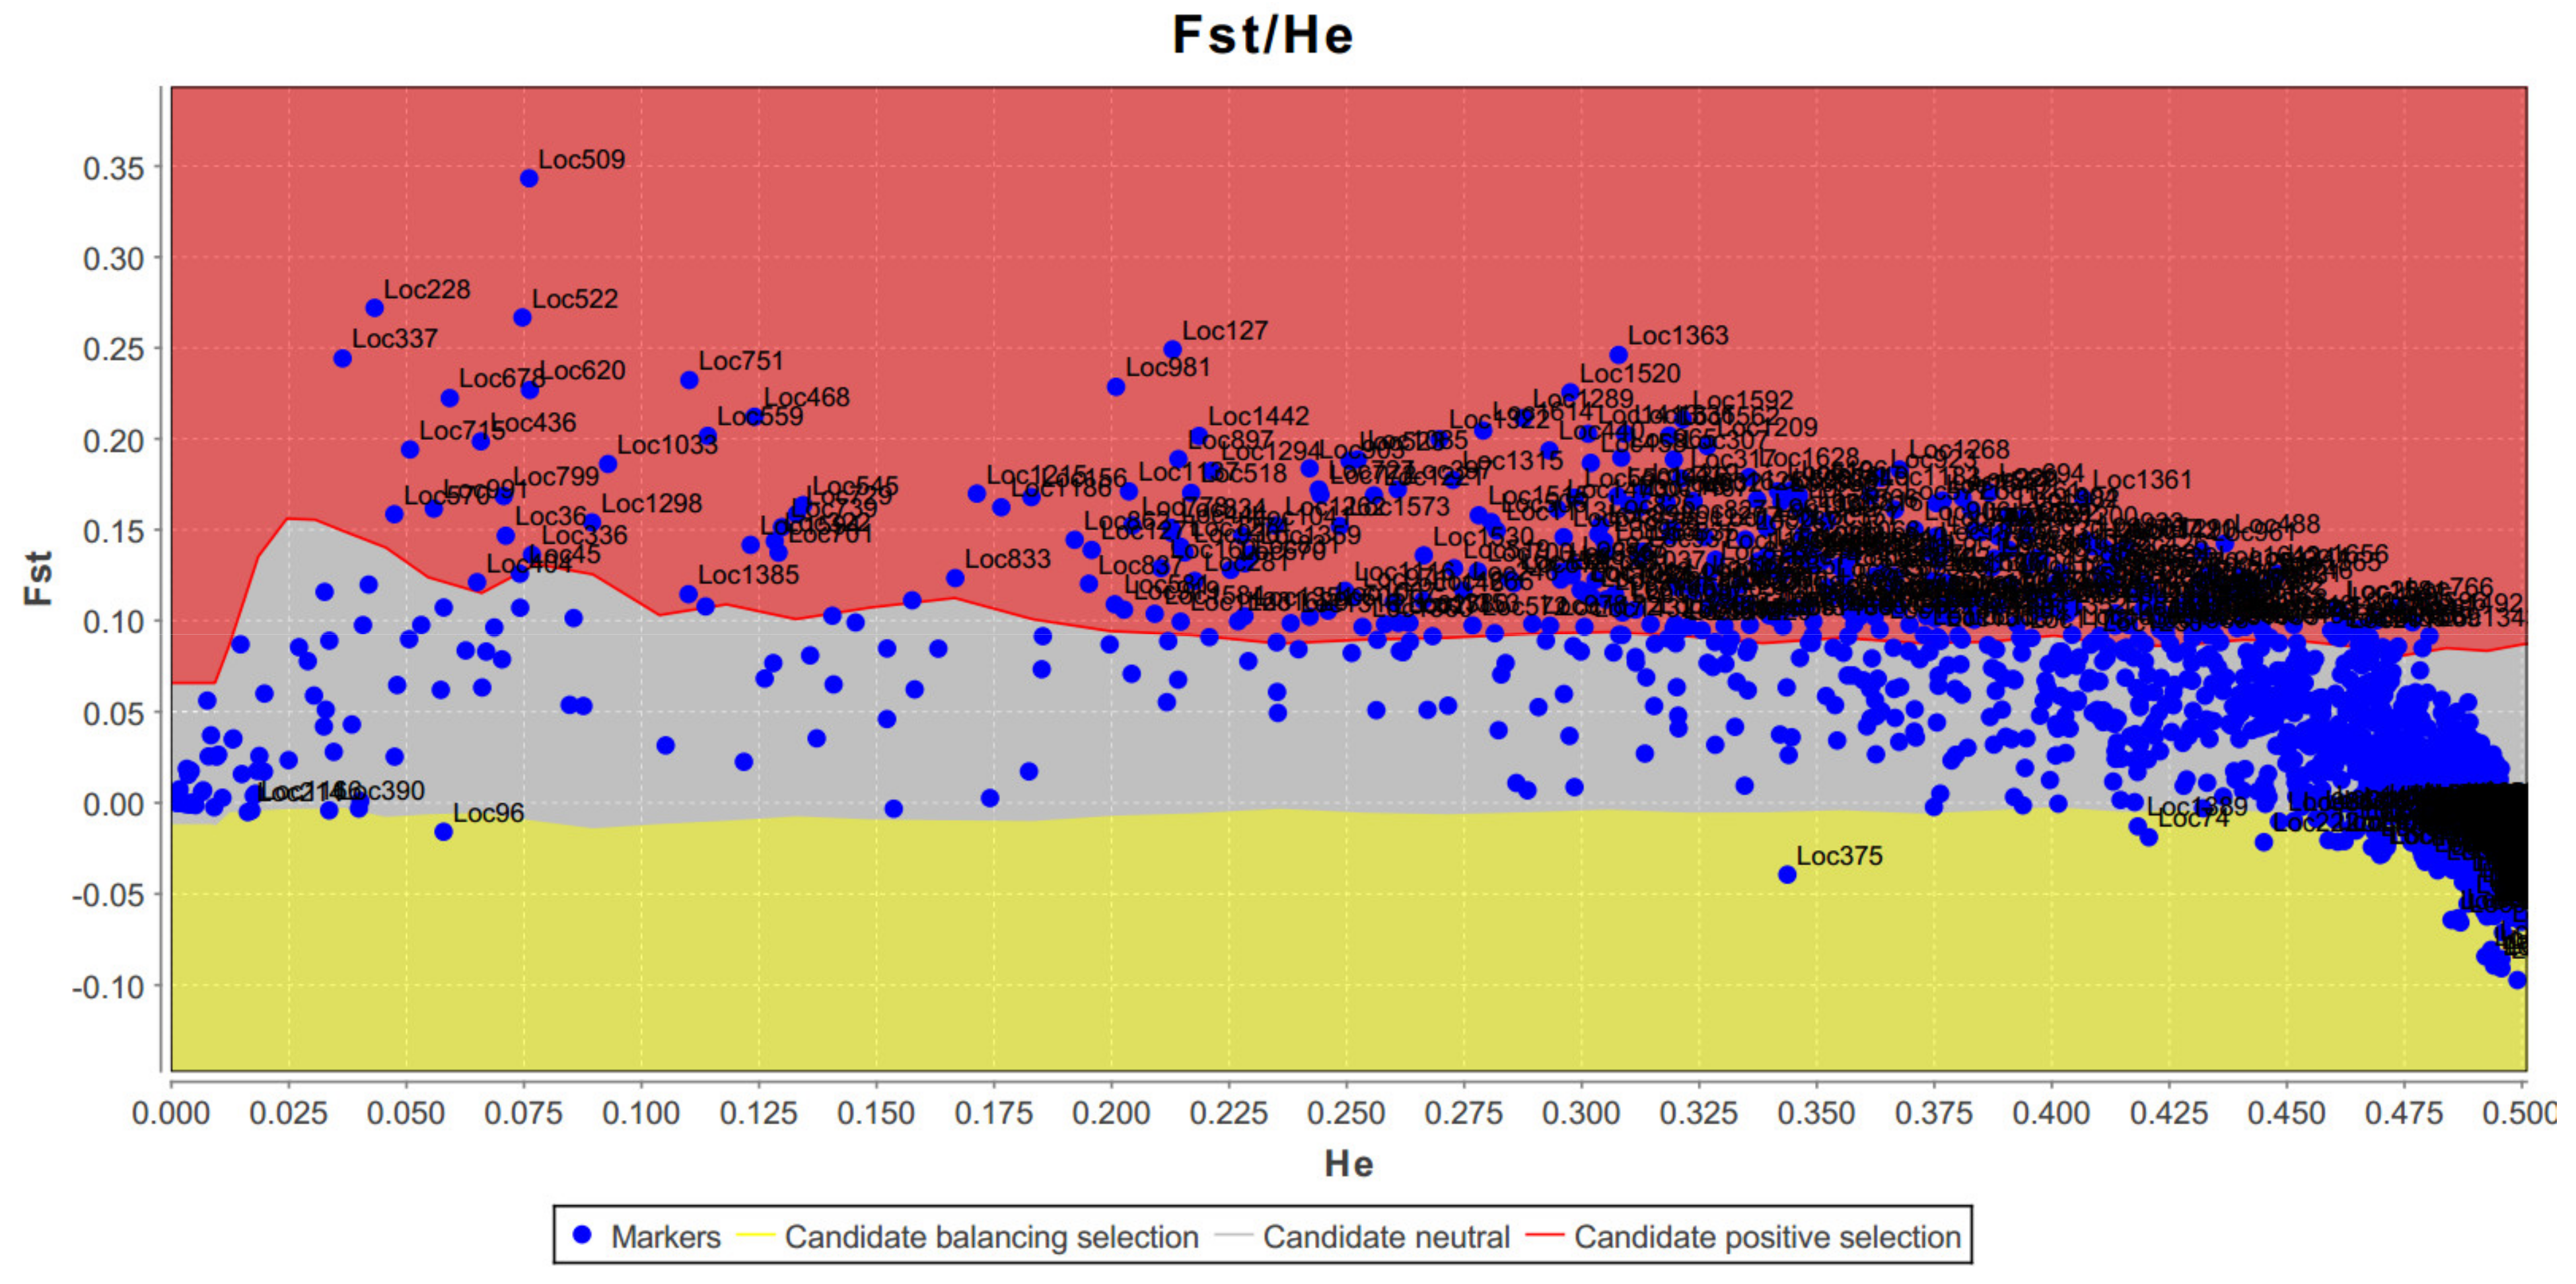
Figure 1. Identification of outlier loci for neutral Fst, performed in the LOSITAN software using the set of 1667 SNP loci analyzed in 553 E. oleifera plants from 206 half-sibling families, which make up for a group of 19 populations sampled in six major geographic regions of the Brazilian Amazon rainforest.
Diversity 14 00270 g001
Figure 2. Distribution of 1274 SNPs loci aligned against E. guineensis chromosomes (PRJNA192219), visualized through the R package chromoMap. X = SNPs loci; Y = SNPs loci outliers.
Diversity 14 00270 g002
Figure 3. Synteny and collinearity of 20 SNPs loci between E. guineensis and E. oleifera (A). Table with the sizes of scaffolds of E. oleifera used for the comparative analysis (B). Visualized through the R package chromoMap.
Diversity 14 00270 g003
Figure 4. Functional annotation of genes containing SNPs in E. oleifera (A) and E. guineensis (B). Venn diagram comparing genes containing intragenic SNPs in E. oleifera and E. guineensis (C). Functional annotation was performed on the OmicsBox package.
Diversity 14 00270 g004
Table 1. Origin and number of 553 plants, representing 206 subsamples (half-sibling families) collected from the Elaeis oleifera Germplasm Bank at Embrapa Western Amazon (CPAA). Plants from 19 different populations (localities) originally collected at six distinct geographic regions in the Brazilian Amazon rainforest (Manaus, Rio Amazonas, Rio Solimões, Rio Negro, Caracaraíe Rio Madeira).
PopulationGeographic RegionLocalityNumber of
Subsamples
Number of
Plants
1ManausCaldeirão718
2Careiro2568
3Manacapuru13
4Iranduba26
Subtotal3595
5Rio AmazonasAmatari1131
6Autazes1128
7Maués1132
Subtotal3391
8Rio SolimõesAnori39
9B. Constant13
10Coari1954
11Tefé514
12Tonantins412
Subtotal3292
13Rio NegroAcajatuba1029
14Barcelos22
15Moura1132
Subtotal2363
16CaracaraíBR1741235
17Vila Moderna618
Subtotal1853
18Rio MadeiraManicoré58140
19Novo Aripuanã719
Subtotal65159
TOTAL206553
Table 2. Genetic variances (inter- and intra-population) and fixation index (Fis) per population from the Brazilian E. oleifera Germplasm Bank for the set of 1667 SNP loci. 1-Qintra: intrapopulation allelic diversity. 1-Qinter: interpopulation allele diversity. Fis: diversity measure.
Population1-Qintra1-QinterFis
10.6170.353−0.745
20.6290.378−0.665
30.6290.382−0.645
40.6290.380−0.655
50.6340.384−0.650
60.6110.377−0.619
70.5940.361−0.644
80.6230.376−0.656
90.6130.369−0.661
100.6290.378−0.663
110.6000.365−0.647
120.6320.367−0.720
130.6490.357−0.820
140.6470.372−0.741
150.6670.378−0.765
160.6510.365−0.785
170.6120.357−0.713
180.5910.366−0.617
190.6360.375−0.727
Publisher’s Note: MDPI stays neutral with regard to jurisdictional claims in published maps and institutional affiliations.