Article

Flower-Visiting Insect Assemblages on Fall-Blooming Native California Sage Scrub Shrubs

by
Sofia Dartnell
1,*,
Andre R. O. Cavalcanti
1,
Ayame Misaki Bluebell
2,
Nancy V. Hamlett
3,
Edward J. Crane III
1 and
Wallace M. Meyer III
1,*
1
Department of Biology, Pomona College, Claremont, CA 91711, USA
2
Department of Molecular Biology, Pomona College, Claremont, CA 91711, USA
3
Robert J. Bernard Field Station, Claremont, CA 91711, USA
*
Authors to whom correspondence should be addressed.
Diversity 2022, 14(11), 958; https://doi.org/10.3390/d14110958
Submission received: 19 September 2022 / Revised: 26 October 2022 / Accepted: 26 October 2022 / Published: 9 November 2022
(This article belongs to the Special Issue Ecology and Conservation of the Endangered Sage Scrub Ecosystem)

Abstract

:
Pollinator studies in the endangered California sage scrub ecosystem have focused on spring insect assemblages, when most plant species bloom. Consequently, the insect assemblages using common fall-blooming sage scrub shrubs Lepidospartum squamatum, Ericameria pinifolia, and Baccharis pilularis remain undescribed. Our study aimed to: (1) document flower-visiting insect assemblages on fall-blooming shrubs, (2) assess the efficacy of three sampling techniques in inventorying insect assemblages, and (3) explore, using DNA metabarcoding, which plants are utilized and the extent to which surrounding suburban habitats’ plants are also used. While elevated sampling is required to inventory flower-visiting insects, we describe a diverse assemblage consisting of 123 species. Insect assemblages differed between L. squamatum and B. pilularis, as well as, E. pinifolia and B. pilularis, but not between L. squamatum and E. pinifolia. Direct sampling approaches (netting and photo documentation) collected 115 species not collected by passive malaise traps, highlighting that active observations are required to describe flower-visiting insect assemblages. Sequencing the ITS2 region of pollen from abundant visitors revealed that a majority of pollen is from the sage scrub ecosystem, highlighting its value. Our results indicate that the presence of fall-blooming shrubs may be critical for maintaining diverse sage scrub insect and pollinator assemblages.

1. Introduction

California is a recognized biodiversity hotspot and home to one of the richest bee faunas in the world, with an estimated 1200 species [1,2,3,4,5]. However, within southern California, studies have primarily focused on spring pollinator assemblages, when the majority of plants are in bloom [4,6,7]. For example, Hung et al. [6] intended to analyze seasonal bee assemblages, but only included data collected between April and August. While this approach may address how transitions from the cool-moist to hot-dry Mediterranean seasons impact bee assemblages, it ignores that some common southern California shrubs flower during the late summer and fall months (August to November). Without understanding fall pollinator and fall flower-visiting insect assemblages, conservation practitioners are poorly equipped to make informed decisions regarding the importance of native fall-blooming shrubs. For instance, native bees with long flight durations may require fall-blooming shrubs to procure enough resources for successful nesting, and some native bee species may only fly in the fall. Therefore, examining southern California flower-visiting insect assemblages in the fall season can provide additional insights vital to protecting native insect and pollinator diversity.
Within southern California, the endangered California sage scrub habitat (hereafter, CSS) has declined by more than 85% in area over the past century and has undergone severe fragmentation from urbanization and agricultural densification [8,9,10,11]. Fragmented areas harbor fewer pollinators than areas of continuous habitat [4,6,12,13,14], as fragmentation leads to loss of forage patches and nesting habitat [15,16]. Lepidospartum squamatum (scale-broom), Ericameria pinifolia (pine-bush), and Baccharis pilularis (coyote brush) are common CSS shrubs that bloom during the fall season [17,18]. While the life history of these plants is well documented [17,19], the specific communities of insects visiting their flowers remain largely unknown. Literature acknowledges that a variety of arthropods visit L. squamatum but provides few details apart from highlighting the importance of native bees, particularly those from Halictidae [19,20,21]. More broadly, Perdita and Xylocopa bees, Sphecidae and Vespidae wasps, and butterflies are listed as important bee pollinators for genus Lepidospartum in California [5]. For B. pilularis, a variety of studies have been conducted on the plant’s herbivore community (stem and leaf gall-formers) and predators (parasitoid wasps) [22], as well as the effects of the crab spider population on pollinator foraging [23,24]. However, pollinator information appears to exist only for California Baccharis plants in general, with Mordellidae beetles, Muscoidea flies, and a variety of wasps (Sphecidae, Vespidae, and Ichneumonoidea) listed as major pollinators, alongside Dialictus, Hylaeus, Bombus, and Perdita bees [5]. However, some Baccharis species are not fall-blooming, meaning we cannot assume these pollinators also visit B. pilularis. For E. pinifolia, very little is documented. A Google Scholar™ search using the input “Ericameria pinifolia pollinator” yielded only 14 results, none of which provided details on the shrub’s pollinator or flower-visiting insect community. Genus Ericameria was also not included in efforts to broadly define the pollinators visiting California plants [5]. To the best of our knowledge, no study has documented fall pollinator or flower-visiting insect assemblages of the specific CSS fall flowering shrub species L. squamatum, B. pilularis, and E. pinifolia. This information is critical to making informed recommendations for both the native shrubs and the flying insect assemblages visiting their flowers.
Adjacent to most CSS fragments, suburban gardens host different plant assemblages. Non-native plants comprise a large portion of garden flora, selected for their aesthetic value [25]. These ornamental plants often bloom at different times than native assemblages because of their phenology and access to additional water subsidies [26]. In this way, non-native plants in suburban gardens have been found to be beneficial to pollinators, providing nesting habitat and potential pollen resources in times of low native plant blooms [27,28,29]. Consequently, suburban plants may be beneficial in maintaining pollinator and other insect populations in CSS fragments surrounded by urban/suburban habitat, particularly when native plant pollen and nectar resources are low or unavailable [30]. Within California, non-native garden plants appear to increase opportunities for pollinator species and support a diverse bee community. However, certain genera of bees within California are thought to only visit native plants, including Calliopsis, Chelostoma, Conanthalictus, Melecta, Parnurginus, and Perdita [31].
This study is the first to describe flower-visiting insect assemblages of fall-blooming CSS shrubs (L. squamatum, E. pinifolia and B. pilularis) and examine insect use of native plants in CSS fragments and non-native plants present in adjacent suburban gardens. Because certain behavioral and structural traits are required to remove and transfer pollen in a way that results in effective pollination [32] and because collected pollen may not be transferred to a plant, we use the term “flower-visiting insect” to refer to any insect visiting a flower for pollen or nectar resources and only use the term “pollinator” when we are referring to insects that are known to effectively pollinate plants. Describing the insect assemblages that visit fall-blooming shrubs L. squamatum, E. pinifolia and B. pilularis is the first step in identifying hypotheses on which insect species may be important pollinators within the CSS ecosystem. Our research aimed to: (1) begin to describe the diversity of flower-visiting insects that utilize native sage scrub shrubs for pollen and nectar resources during the fall season, (2) understand best methods for effectively inventorying fall flower-visiting insect assemblages, and (3) explore, using DNA metabarcoding, which plants common fall flower visitors utilize, and if these insects also utilize plants in surrounding suburban habitats. This information sets a baseline for understanding the importance of fall-blooming shrubs for conserving insect and pollinator biodiversity in the endangered CSS habitat.

2. Materials and Methods

2.1. Study Site

Sampling took place at the Robert J. Bernard Field Station (BFS) in Claremont, California (34°06′34″ N 117°42′46″ W). The BFS is a 35-hectare field station located in Claremont, California, situated at the foot of the San Gabriel Mountains in eastern Los Angeles County (elevation 348 m). Average annual rainfall is 44.3 cm (1894–2016) [33], with the vast majority of rainfall occurring during the cool-wet season (November to May).
While the BFS features five distinct habitat types (see [34]), this study was restricted to the CSS habitat, which comprises ~25 ha, and an area of recovering sage scrub (7 ha) following a fire in 2013, where the native fall-blooming shrubs are most commonly found. Flower-visiting insects may also access adjacent properties, which include suburban yards. At the BFS, approximately ~35% of the perimeter is directly adjacent to suburban homes and associated gardens, and approximately 18% of the perimeter is adjacent to the California Botanic Garden, which hosts native California plants and uses water subsidies. While plants at the California Botanic garden may be native to the state, many are not native to southern California or the CSS ecosystem.
Study species L. squamatum and E. pinifolia are scattered throughout the CSS habitat. Despite being drought tolerant, B. piularis is concentrated next to an artificial research lake with both CSS plants and other species that require more water. Lepidospartum squamatum and E. pinifolia feature small yellow flowers whereas B. piularis blooms are white. Within the BFS, the majority of B. pilularis plants are pistillate. While it has not been quantified, observations by the authors here, supported by descriptions of other southern California habitat fragments by Caspi et al. [35] suggest that fall-blooming shrubs L. squamatum and E. pinifolia are often missing from or rare in CSS fragments. Caspi et al. [35] visited 9 fragments within southern California and found two locations, the BFS and Crafton Hills College, contained E. pinifolia, while only the BFS harbored L. squamatum.

2.2. Sampling

We utilized data from three sampling methods at the BFS: hand netting, photography, and malaise trapping. Active sampling methods (i.e., hand netting and photography) were used to describe the flower-visiting insect assemblages on B. pilularis, L. squamatum, and E. pinifolia. We only included insect species that we observed visiting flowers. Specifically, we captured insects we observed visiting flowers for pollen or nectar resources and excluded predatory taxa (e.g., mantids and damselflies). Passive sampling via malaise traps was used to capture the wider fall-flying insect community and to explore if this passive trapping method collected insect species similar to those found using active sampling methods.

2.2.1. Hand Netting

Hand netting for flower-visiting insects of L. squamatum, E. pinifolia, and B. pilularis took place over 14 days throughout the bloom season of these shrubs (Table 1). Each sample consisted of continuous (15 min) hand netting at one individual plant. The timer was not stopped when insects were captured. Once netted, collected arthropods were placed into 95% EtOH for sample sorting and pollen processing. Each plant species was sampled eleven times during their respective blooming periods, six in the morning (between 8 a.m. and 12 p.m.) and five in the afternoon (between 12 p.m. and 5 p.m.) to account for time of day as a potential confounding variable and potential differences in the diurnal activity patterns of flower-visiting insects [36]. A total of 33 samples were collected, resulting in a total sampling effort of 8.25 h. Our focus was to collect the diversity of insects visiting flowers on the plants without attempting to assess the relative abundance of each species. Large shrubs were preferentially selected for sampling to ensure insect visitors during each fifteen-minute time interval. Shrubs observed to have fewer than five flying insects upon arrival were not sampled. Repeat sampling of some individual plants occurred, but the same individuals were never surveyed on the same day. Repeated sampling occurred more frequently on B. pilularis, which has lower abundance at the BFS than L. squamatum and E. pinifolia. Effort was made to evenly sample plants throughout their blooming period and range at the BFS until the end of season when the flowers dried out.

2.2.2. Photo Sampling

Photos were collected via several methods between 2010 and 2021. Beginning in 2010, photography was used to document invertebrate diversity at the BFS (http://bfs.pomona.edu/biota/inverts/, accessed on 1 April 2022). While this effort was initially haphazard and opportunistic, photographic insect surveys were carried out once or twice a month between 2013–2016, focusing systematically on different areas of the BFS. A large variety of insects were photographed, with emphasis on novel species (e.g., those not previously recorded at the BFS), but sampling was not solely focused on flower-visiting insects or pollinators. A total of 56 h of effort was expended on these surveys during the period when B. pilularis, E. pinifolia, and L. squamatum were blooming.
In addition to these photographic surveys, we also examined photos taken during systematic monthly butterfly surveys conducted from February 2015 through December 2021 [34]. A total of 47 h of effort was expended on surveys during the bloom period of the three shrubs of interest (September–November).
Additional insect photographs were taken opportunistically from 2010–2021. The vast majority of photographs were taken by N.V. Hamlett, but some were taken by Hartmut Wisch and Jonathan Wright. Altogether insects were photographed on the shrubs in our study on 54 different days. We compared these photographs to specimens captured via hand netting to supplement our description of the insect assemblages visiting the flowers of B. pilularis, E. pinifolia, and L. squamatum. Many of the photos can be found on the BFS website (http://bfs.pomona.edu/biota/inverts/, accessed on 1 April 2022).

2.2.3. Malaise Trap Sampling

Malaise trap sampling was conducted throughout the study period to compare each shrub’s flower-visiting insect assemblage to the fall season’s general flying insect assemblage. Our effort totaled 42 trap days of malaise sampling from 24 September 2021 to 12 November 2021. We utilized a Townes-style malaise trap (BioQuip™) with 95% EtOH in the collection bottle to trap and preserve insects. For the first month, the malaise trap was located near blooming L. squamatum. For the following three weeks, it was moved to be closer to the E. pinifolia and B. piularis that had come into bloom (Table 1), allowing the trap to be situated near each native shrub during their peak bloom period. The trap’s collection bottle was replaced every week with new EtOH. Collected arthropods were brought back to the laboratory to be sorted and identified.

2.3. Insect Sorting and Identification

All arthropods collected from hand netting of L. squamatum, E. pinifolia, and B. pilularis and malaise sampling were first sorted to morphospecies or as honeybees, Apis mellifera, which could be readily identified. One individual of each morphospecies from each sample (15-min timed netting sample or weekly malaise trap) was pinned for identification and to create reference specimens for the BFS insect collection. The abundance of each morphospecies in each sample was recorded. Insects were then identified to the lowest taxonomic level possible, most often genus. These identifications were made with the assistance of local experts and via photographs uploaded to community forums iNaturalist and BugGuide. Likewise, for our photo data, all pictures were identified to the lowest taxonomic level possible using the help of local experts and online forum identifications. We did our best to effectively compare specimens collected using hand netting and malaise traps to pictures.
In malaise trap samples, insects that were too small to be pinned or pointed (<1 mm in body length) were left in ethanol and not included in our analyses. Given the size bias of hand netting and photo data to collect species that are readily observable by the human eye, this protocol helps standardize the malaise trap specimens to be of similar size as our other sampling methods.

2.4. Analysis of Flower-Visiting Insect Assemblages

We recorded flower-visiting insects, i.e., an insect that we observed visiting flowers to utilize nectar or pollen resources, during hand netting and photo sampling. We intentionally did not use the term “pollinator” as we may have captured insects that visit the fall-blooming shrubs without providing pollination services (e.g., pollen and nectar robbers) [37,38,39]. Known predatory insect taxa (e.g., mantids and damselflies) were excluded from analyses, though individuals were captured. To begin describing the fall flower-visiting insect community, we documented all species observed on our three target shrub species that were collected using either our hand netting or photo sampling efforts. We also reported if we collected flower-visiting insect species using the malaise trapping to explore the efficacy of passive trapping in documenting fall flower-visiting insect assemblages.
To examine if flower-visiting insect assemblages differ among the three fall-blooming shrub species, we created a sample-by-species matrix using presence-absence data for each morphospecies netted on each shrub (L. squamatum, E. pinifolia, or B. pilularis). All statistical analyses were conducted using PRIMER-E with the PERMANOVA+ add on [40]. We used presence-absence data as hand-netting was focused on collecting insect diversity, not abundances. To examine if richness and assemblages varied among L. squamatum, E. pinifolia, and B. pilularis, we created a species accumulation curve for each shrub. We utilized the S-curve species accumulation function, which compares the number of species collected as number of surveys increases. These values were plotted to a rarefaction curve with 95% confidence intervals. In addition, we utilized the non-parametric Chao 2 estimator (999 permutations) to calculate expected species richness. Inventory completeness was calculated as the ratio of collected species to those predicted by the Chao 2 estimator. Given that sampling for this study took place over a single growing season with limited replication, it was unlikely that there would be asymptotes in the species accumulation curves. Rather, this information was used to examine if species richness differed between shrub species and to further explore the efficacy of one year of sampling.
To test if netted flower-visiting insect assemblages differed among the three fall-blooming shrub species, we performed a two-way ANOSIM test (9999 permutations) using the Bray–Curtis similarity coefficient, with shrub species and sampling time (morning, afternoon) as factors. Following significant ANOSIM results for shrub type, we examined pairwise differences using the conservative Bonferroni correction approach, adjusting α-value for multiple testing (α = 0.05/3 = 0.0167). A multi-dimensional scaling plot was created to visualize relationships among samples. Following a significant pairwise comparison for shrub species, we ran SIMPER analyses to understand which species are driving differences between shrub assemblages.

2.5. Pollen Analyses

2.5.1. Species Selection

To understand what other plants are visited by common fall flower-visiting insect species, we selected the seven most abundant species for pollen analysis. The threshold for abundance was set to at least six collected specimens to ensure sufficient pollen DNA could be extracted for analysis. The most abundant species by far was Apis mellifera, the European honeybee, which is widespread given its use in honey production and agricultural pollination. Given their large number, these honeybees were separated by the shrub on which they were collected, creating three samples (honeybees of E. pinifolia, L. squamatum, and B. piularis). Other species selected for pollen analysis included Palpada alhambra, Lonchaeidae sp.1, Copestylum marginatum, Dexiinae sp., Tiphiinae sp.1, Ceratina arizonensis, and Largus californicus. Collected individuals from these species were pooled to maximize the amount of pollen in each sample. This resulted in ten samples for DNA sequencing, one sample of each of the common non-honey bee species and 3 honey bee samples using individuals collected on each shrub species (Table 2). The only insects carrying visible masses of pollen on their bodies were Apis mellifera. A majority of captured Apis mellifera individuals had filled pollen baskets.

2.5.2. Pollen Sample Removal

Pollen removal from the selected insects followed Bell et al. [41]. Insects were placed in centrifuge tubes filled with water and a small amount of liquid soap. Each tube of specimens was then vortexed until no visible pollen remained. The insects were then removed and replaced in 95% EtOH for long-term storage and reference. Each centrifuge tube, now containing the pollen in soapy water, was centrifuged to create a pellet from the suspended pollen. The supernatant liquid was removed using a pipette and the pollen pellet was frozen until DNA extraction [41].

2.5.3. DNA Extraction

DNA was extracted from the resulting pollen pellets using the DNeasy Power Soil Pro Kit by QIAGEN (DNeasy PowerSoil Pro Kit n.d.). This kit was chosen for its high DNA yields and powerful lysis, which easily breaks down pollen grain cell walls. Isolated DNA was used as template DNA in polymerase chain reactions (PCRs) targeting the second internal transcribed spacer (ITS2) marker in nuclear ribosomal DNA [29,41]. The ITS2 region has been shown to be efficient in plant DNA barcoding [42]. Once extracted, one μL of extracted sample DNA solution was put on a EzDrop 1000 micro-volume spectrophotometer (Blue-Ray Biotech Corp.) to provide an estimate of DNA concentration. Extracted DNA was then sent to Molecular Research LPTM for sequencing using the S2F (ATGCGATACTTGGTGTGAAT) and S3R (GACGCTTCTCCAGACTACAAT) primers for amplification of the ITS2 region [42]. Molecular Research LPTM sequenced the DNA samples as follows: PCR was performed using the HotStarTaq Plus Master Mix Kit (Qiagen, Germantown, MD, USA) with the following cycle: 3 min at 94 °C, then by 30 cycles of 30 s at 94 °C, 40 s at 53 °C and finally 1 min at 72 °C, followed by a final 5 min elongation step at 72 °C. PCR products were used to create an Illumina DNA library, then sequenced using Illumina MiSeq v3 2 × 300 bp sequencing according to manufacturer guidelines (Illumina, San Diego, CA, USA). All sequences used in this paper are available at GenBank’s SRA database under Bioproject PRJNA854139.

2.5.4. Pollen DNA Analyses

Sequence analyses were performed with QIIME 2 [43]. Sequences of all samples were imported into QIIME 2, and the ITS2 region was extracted from each read using the Q2_ITSxpress plugin [44]. The ITS2 regions were processed using DADA2 [45] (using the q2-dada2 QIIME plugin) to generate a table of unique amplicon sequence variants (ASV) and their counts per sample. Taxonomy for each ASV was determined using the q2-feature-classifier [46] classify-sklearn naïve Bayes taxonomy classifier against the PLANiTS database [47]. All the commands used in the QIIME 2 analyses are available in this paper’s GitHub repository: https://github.com/aroc110/Dartnell-et-al-2022, accessed on 1 October 2022.
Plant genera detected in pollen were then classified as being located either within the BFS or outside in the surrounding suburban community. Plants which were not a part of the comprehensive BFS Plant List (https://bfs.pomona.edu/biota/plants/, accessed on 1 April 2022) were considered to be outside resources, located either in suburban gardens or the neighboring California Botanic Garden.

3. Results

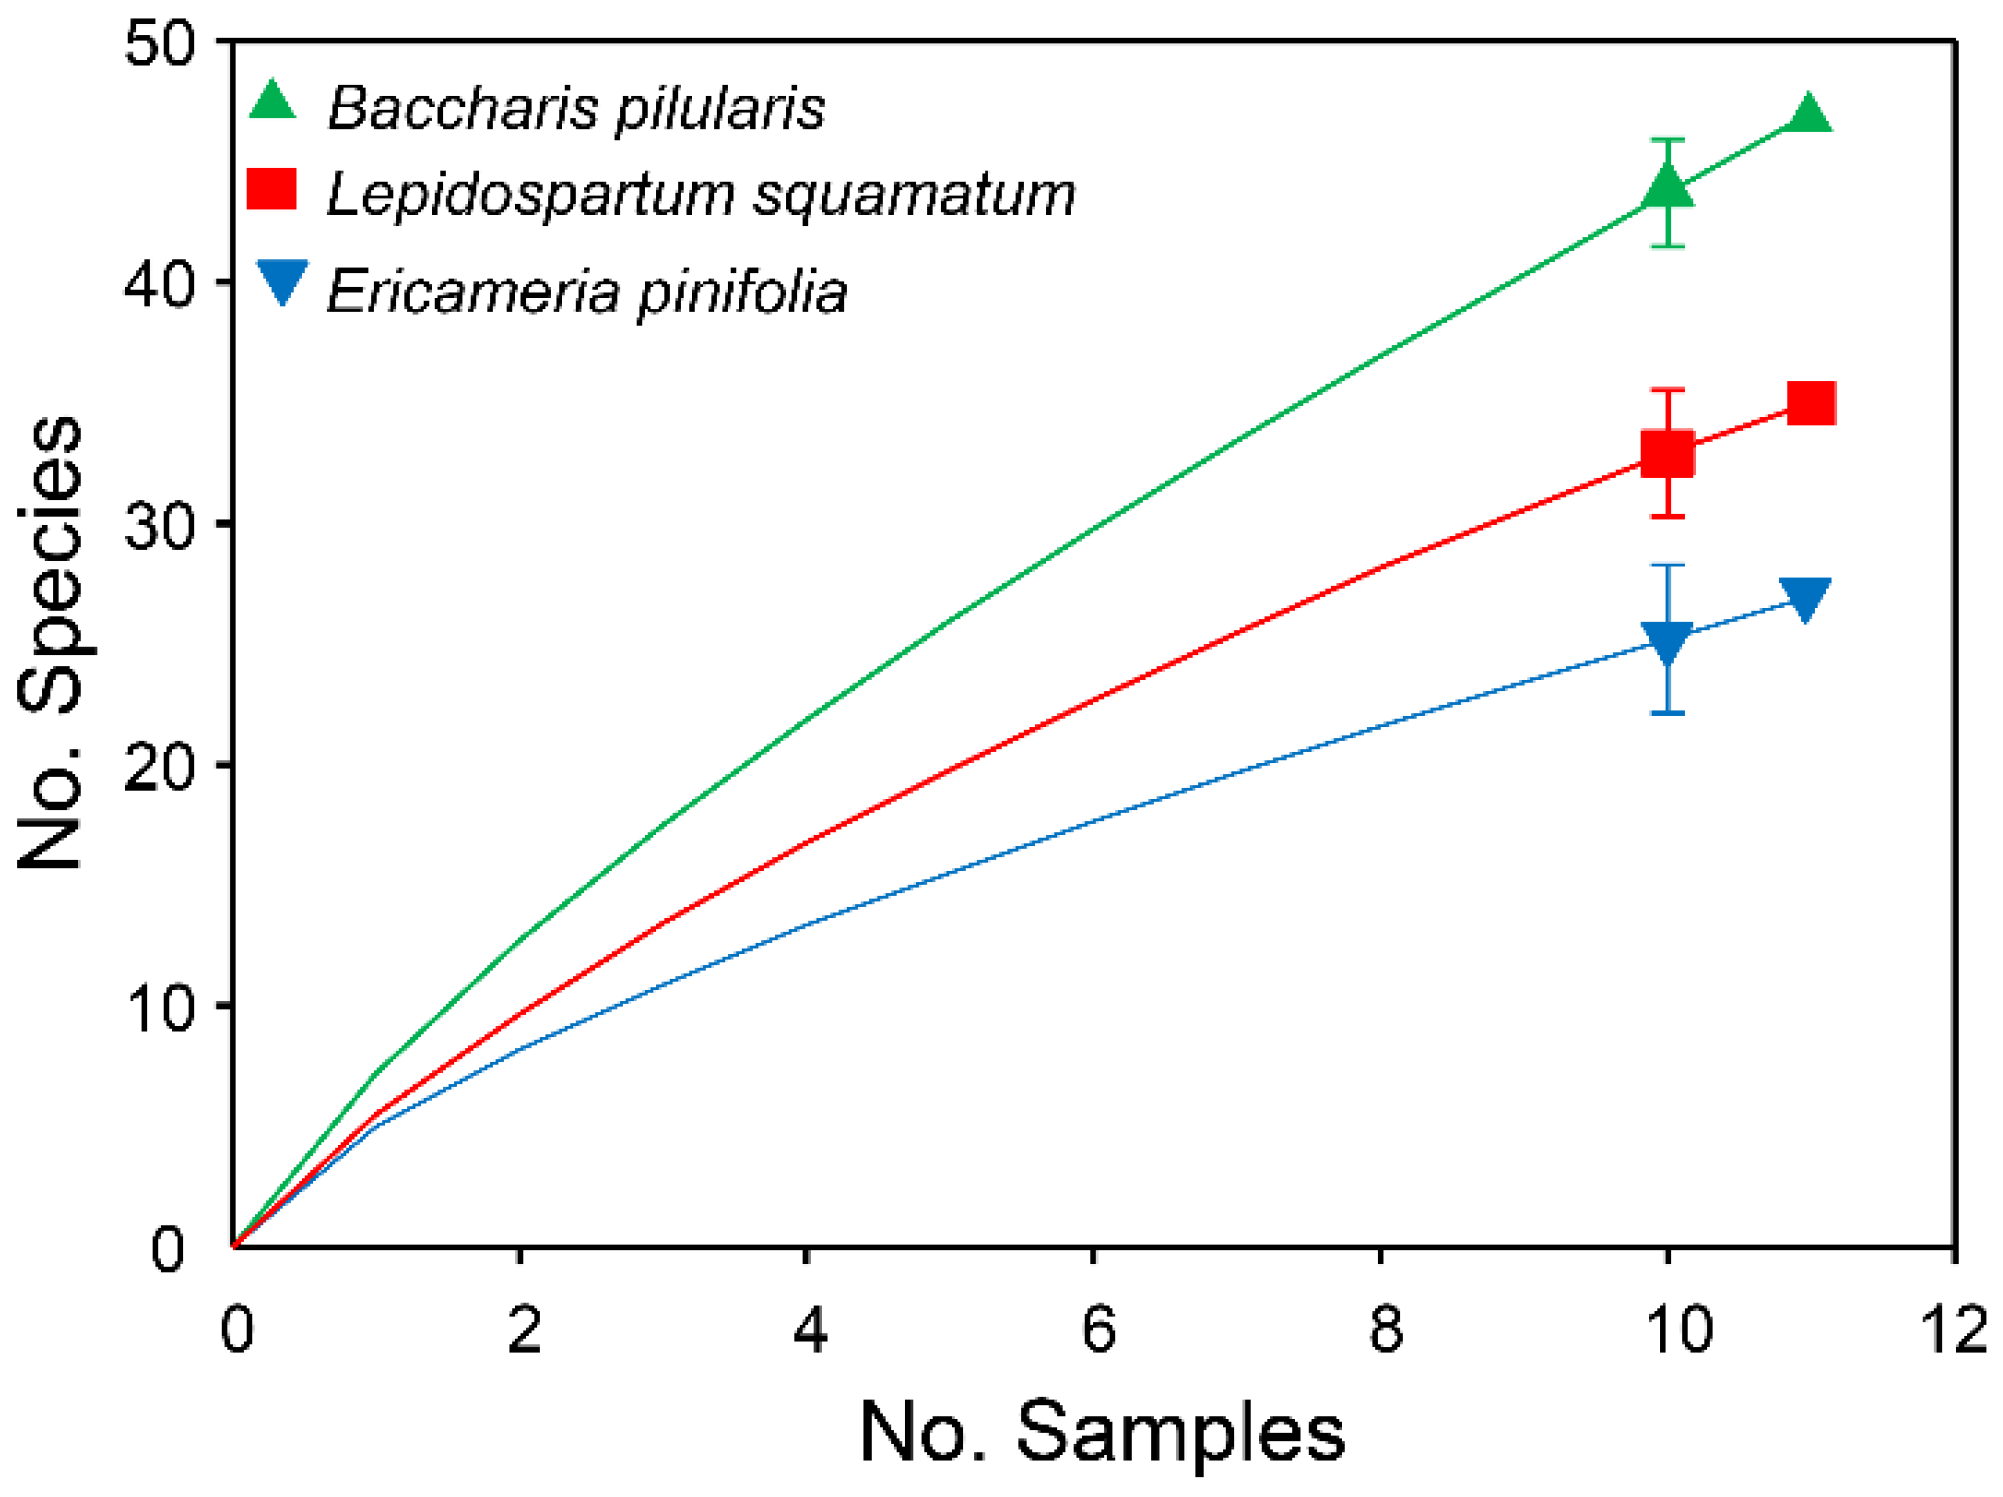
3.1. Documentation of Flower-Visiting Insects

Our first objective was to describe the fall flower-visiting insect assemblages on three native CSS fall-blooming shrubs. To do so, we incorporated data from hand netting and photo data. Hand netting returned 85 species (16 bee species, 18 wasp species, 46 fly species, 3 butterflies, 2 hemipterans; Table 3, Table 4, Table 5, Table 6 and Table 7). Photos of 182 individual insects were analyzed for comparison to the netted specimens. Nineteen individuals were excluded either because they were predatory or because they were leaf or stem-eating insects and were not photographed on flowers. Of the remaining 163 individual photographed insects, 122 were on L. squamatum, 33 on E. pinifolia, and 8 on B. pilularis. Fifty-seven different species were detected using photos; 19 of these (33.3%) had also been captured by hand netting. Photo data added an additional 38 species (5 bees, 8 wasps, 10 flies, 11 butterflies, 3 hemipterans and 1 beetle, Cotinis mutabilis (not included in our tables)), to those identified during hand netting (Table 3, Table 4, Table 5, Table 6 and Table 7). In total, we collected 123 species of flower-visiting insects on L. squamatum, E. pinifolia, and B. pilularis using these two active sampling approaches.

3.2. Comparison between Active and Passive Sampling Techniques

To understand the efficacy of malaise traps in capturing flower-visiting insect assemblages, we examined the number of insects found during active sampling (netting and photos) as compared to our malaise trap, which was placed next to the flowering shrubs. Our malaise trap captured 47 species of insects throughout its 42-day implementation (8 moths, 6 wasps, 2 ants, 4 hemipterans, 2 grasshoppers, 1 termite, 4 beetles, and 20 flies). Out of the 123 species of flower-visiting insects we found associated with shrubs L. squamatum, E. pinifolia, and B. pilularis, only 7 were found in the malaise trap. All of the overlapping species were flies: Villa sp., Dexiinae sp., Bombyliidae sp.1, Diptera sp.2, Aphoebantus sp.1, Diptera sp.3, and Muscoidea sp. for a 15.2% overlap with flies collected during hand netting, and a 5.69% overlap with the flower-visiting insects found overall using active sampling methods (Table 3, Table 4, Table 5, Table 6 and Table 7). While 16 bee species were collected using photo and hand netting techniques, zero were collected in the malaise trap, not even Apis mellifera, the most abundant species observed and collected during hand netting. Rather, the malaise trap captured a different assemblage of insects, featuring wasp and hemipteran species different than those from hand netting and photo data. The malaise trap also captured various moths but did not capture butterflies.

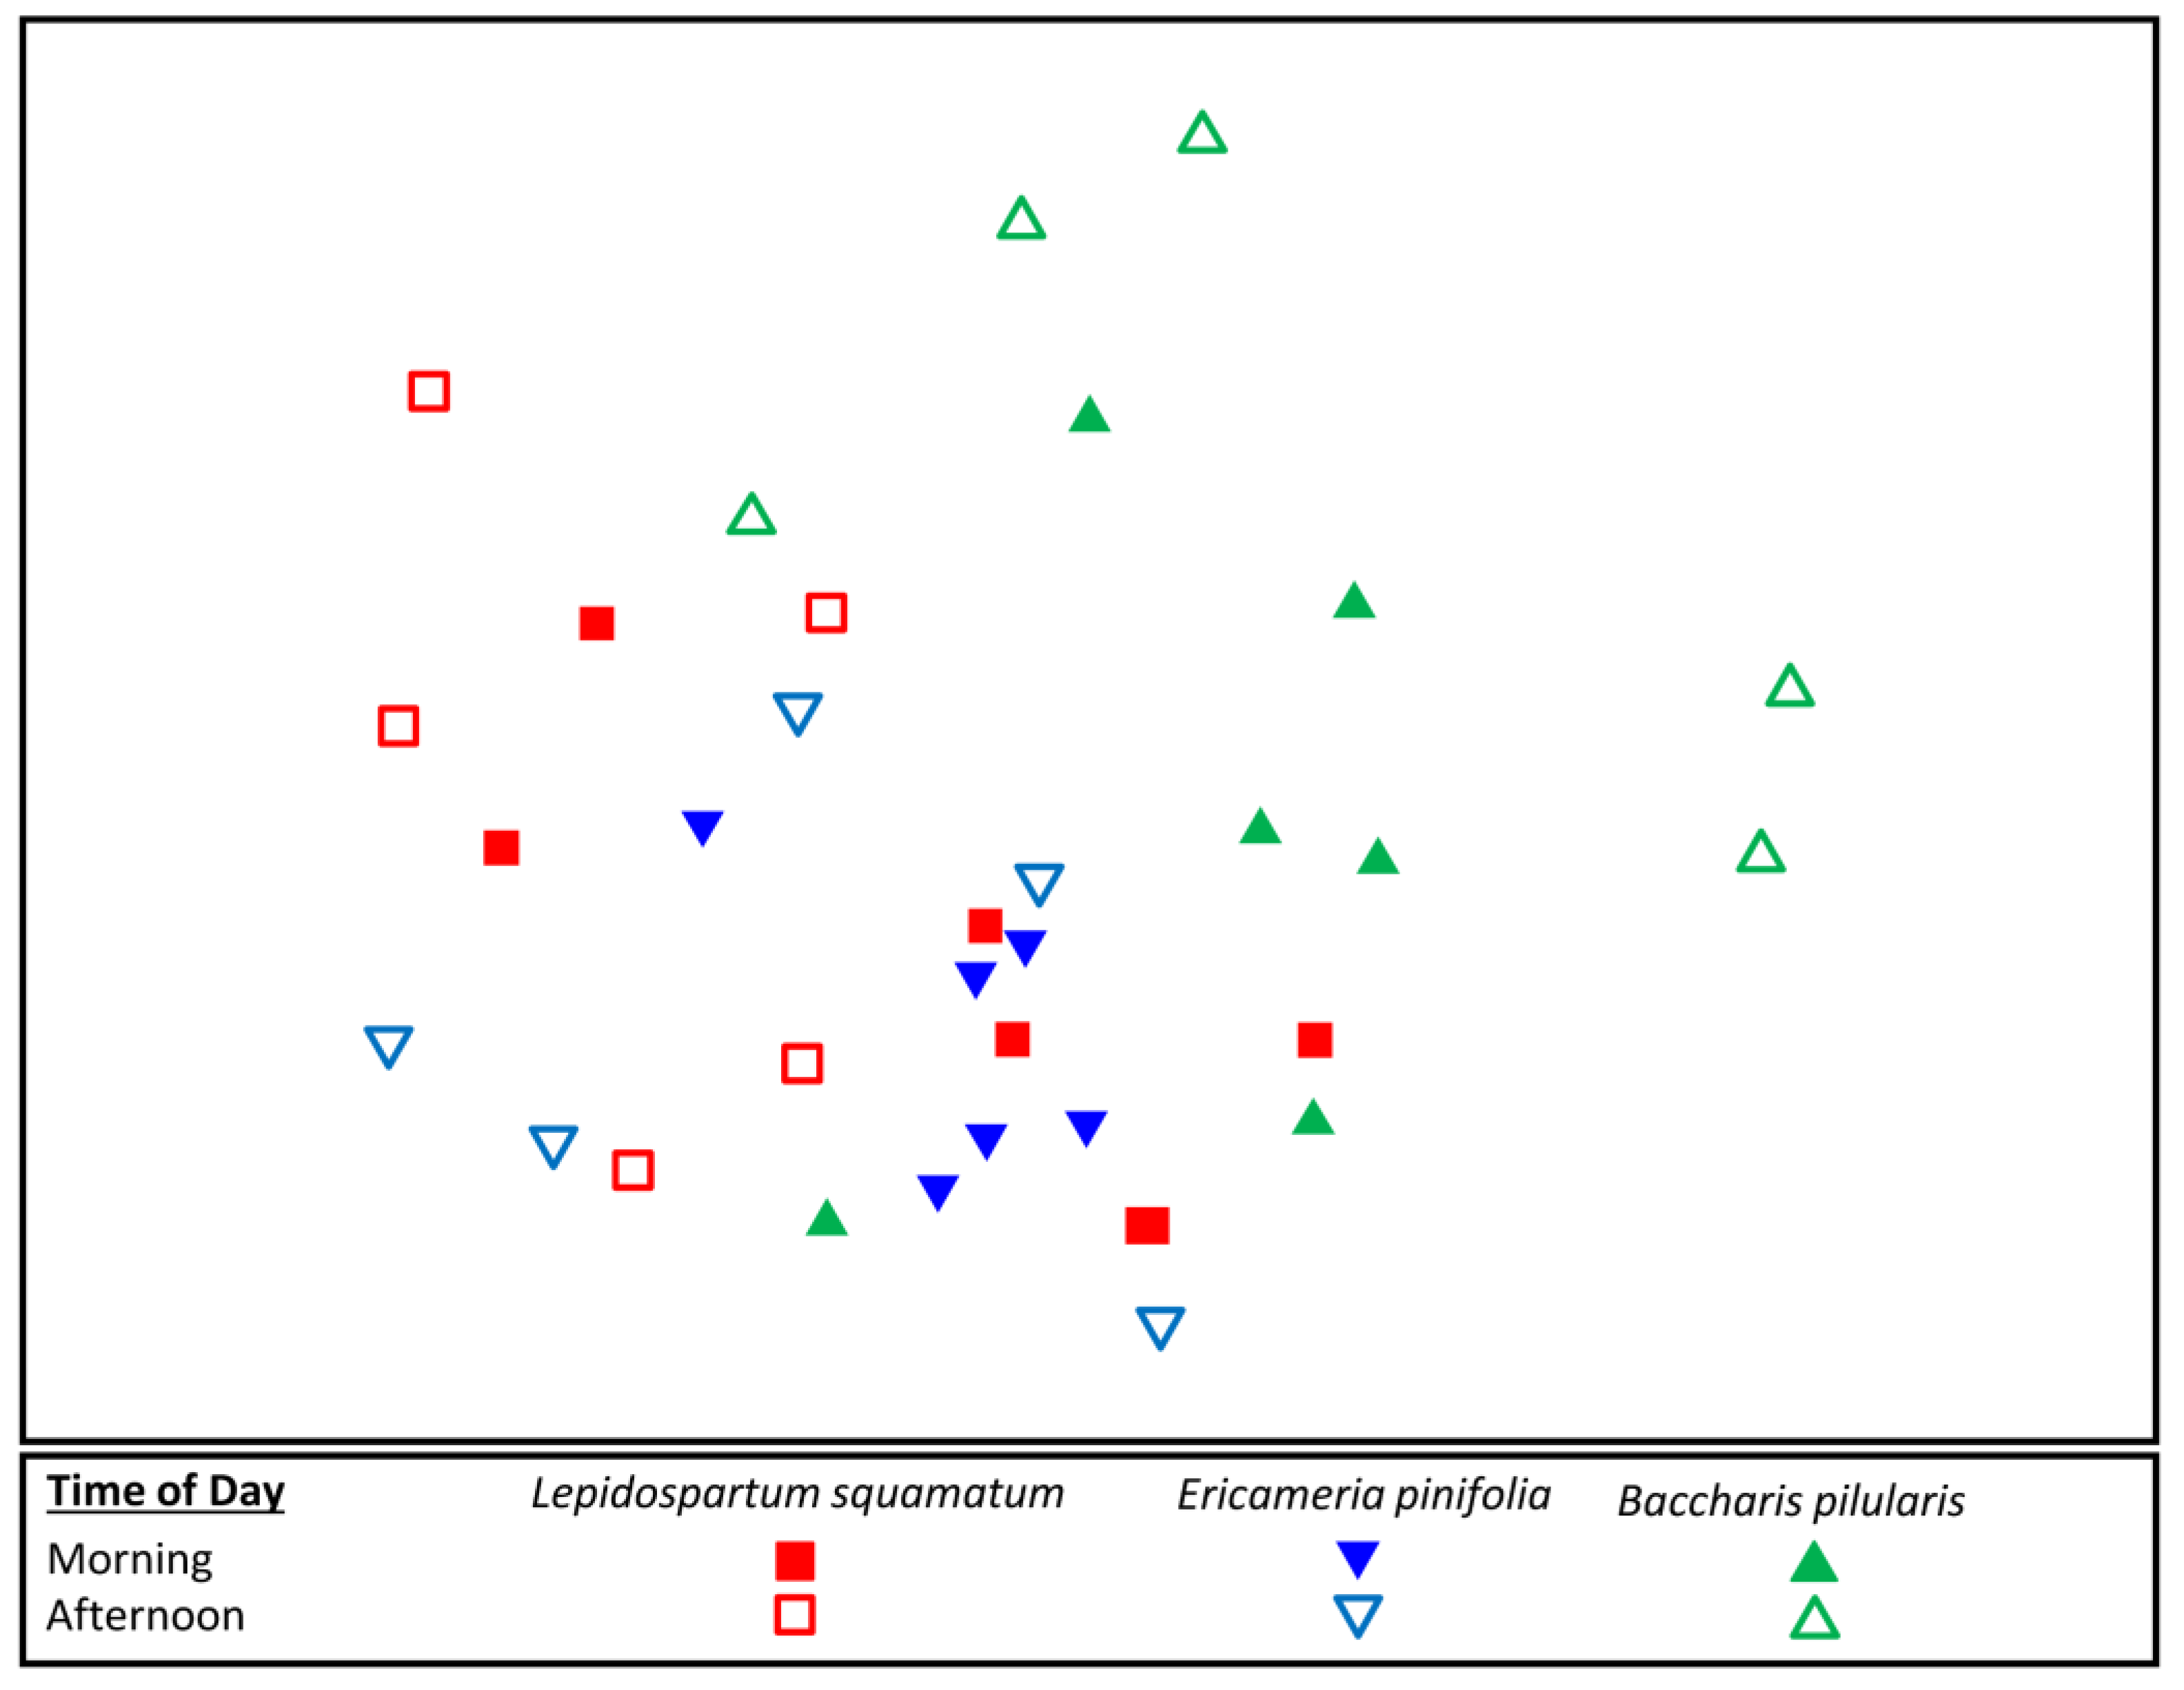
3.3. Flower-Visiting Insect Assemblage Differences on Fall Flowering Shrubs

Species richness, measured using hand-netting data alone, differed among the three species of native, fall-blooming shrubs. Baccharis pilularis had the highest richness, followed by L. squamatum and E. pinifolia (Figure 1). However, rarefaction curves highlight that more sampling is required to inventory flower-visiting insect species on these shrubs as asymptotes were not observed. Inventory completeness, assessed using the Chao 2 estimator to predict flower-visiting insect richness, was low (22.49 to 45.99%) for each shrub species (Table 8). Each fall-blooming shrub hosted a variety of unique species, or those not found on either of the other shrub species (Table 8). These unique species accounted for roughly 82% of species collected. However, over half (55.8%) of our captured specimens were singletons, meaning they were only captured once throughout the entirety of our sampling efforts.
Insect assemblages differed among fall-blooming shrubs (R = 0.193, p = 0.002), but not between sample time of day (R = 0.086, p = 0.147). Pairwise comparisons found that while L. squamatum and E. pinifolia host significantly different assemblages from B. pilularis, their insect assemblages do not differ from one another (Table 9; Figure 2). SIMPER analyses revealed that many of the insects driving the differences were common on B. pilularis but not collected on E. pinifolia or L. squamatum (Table 10).

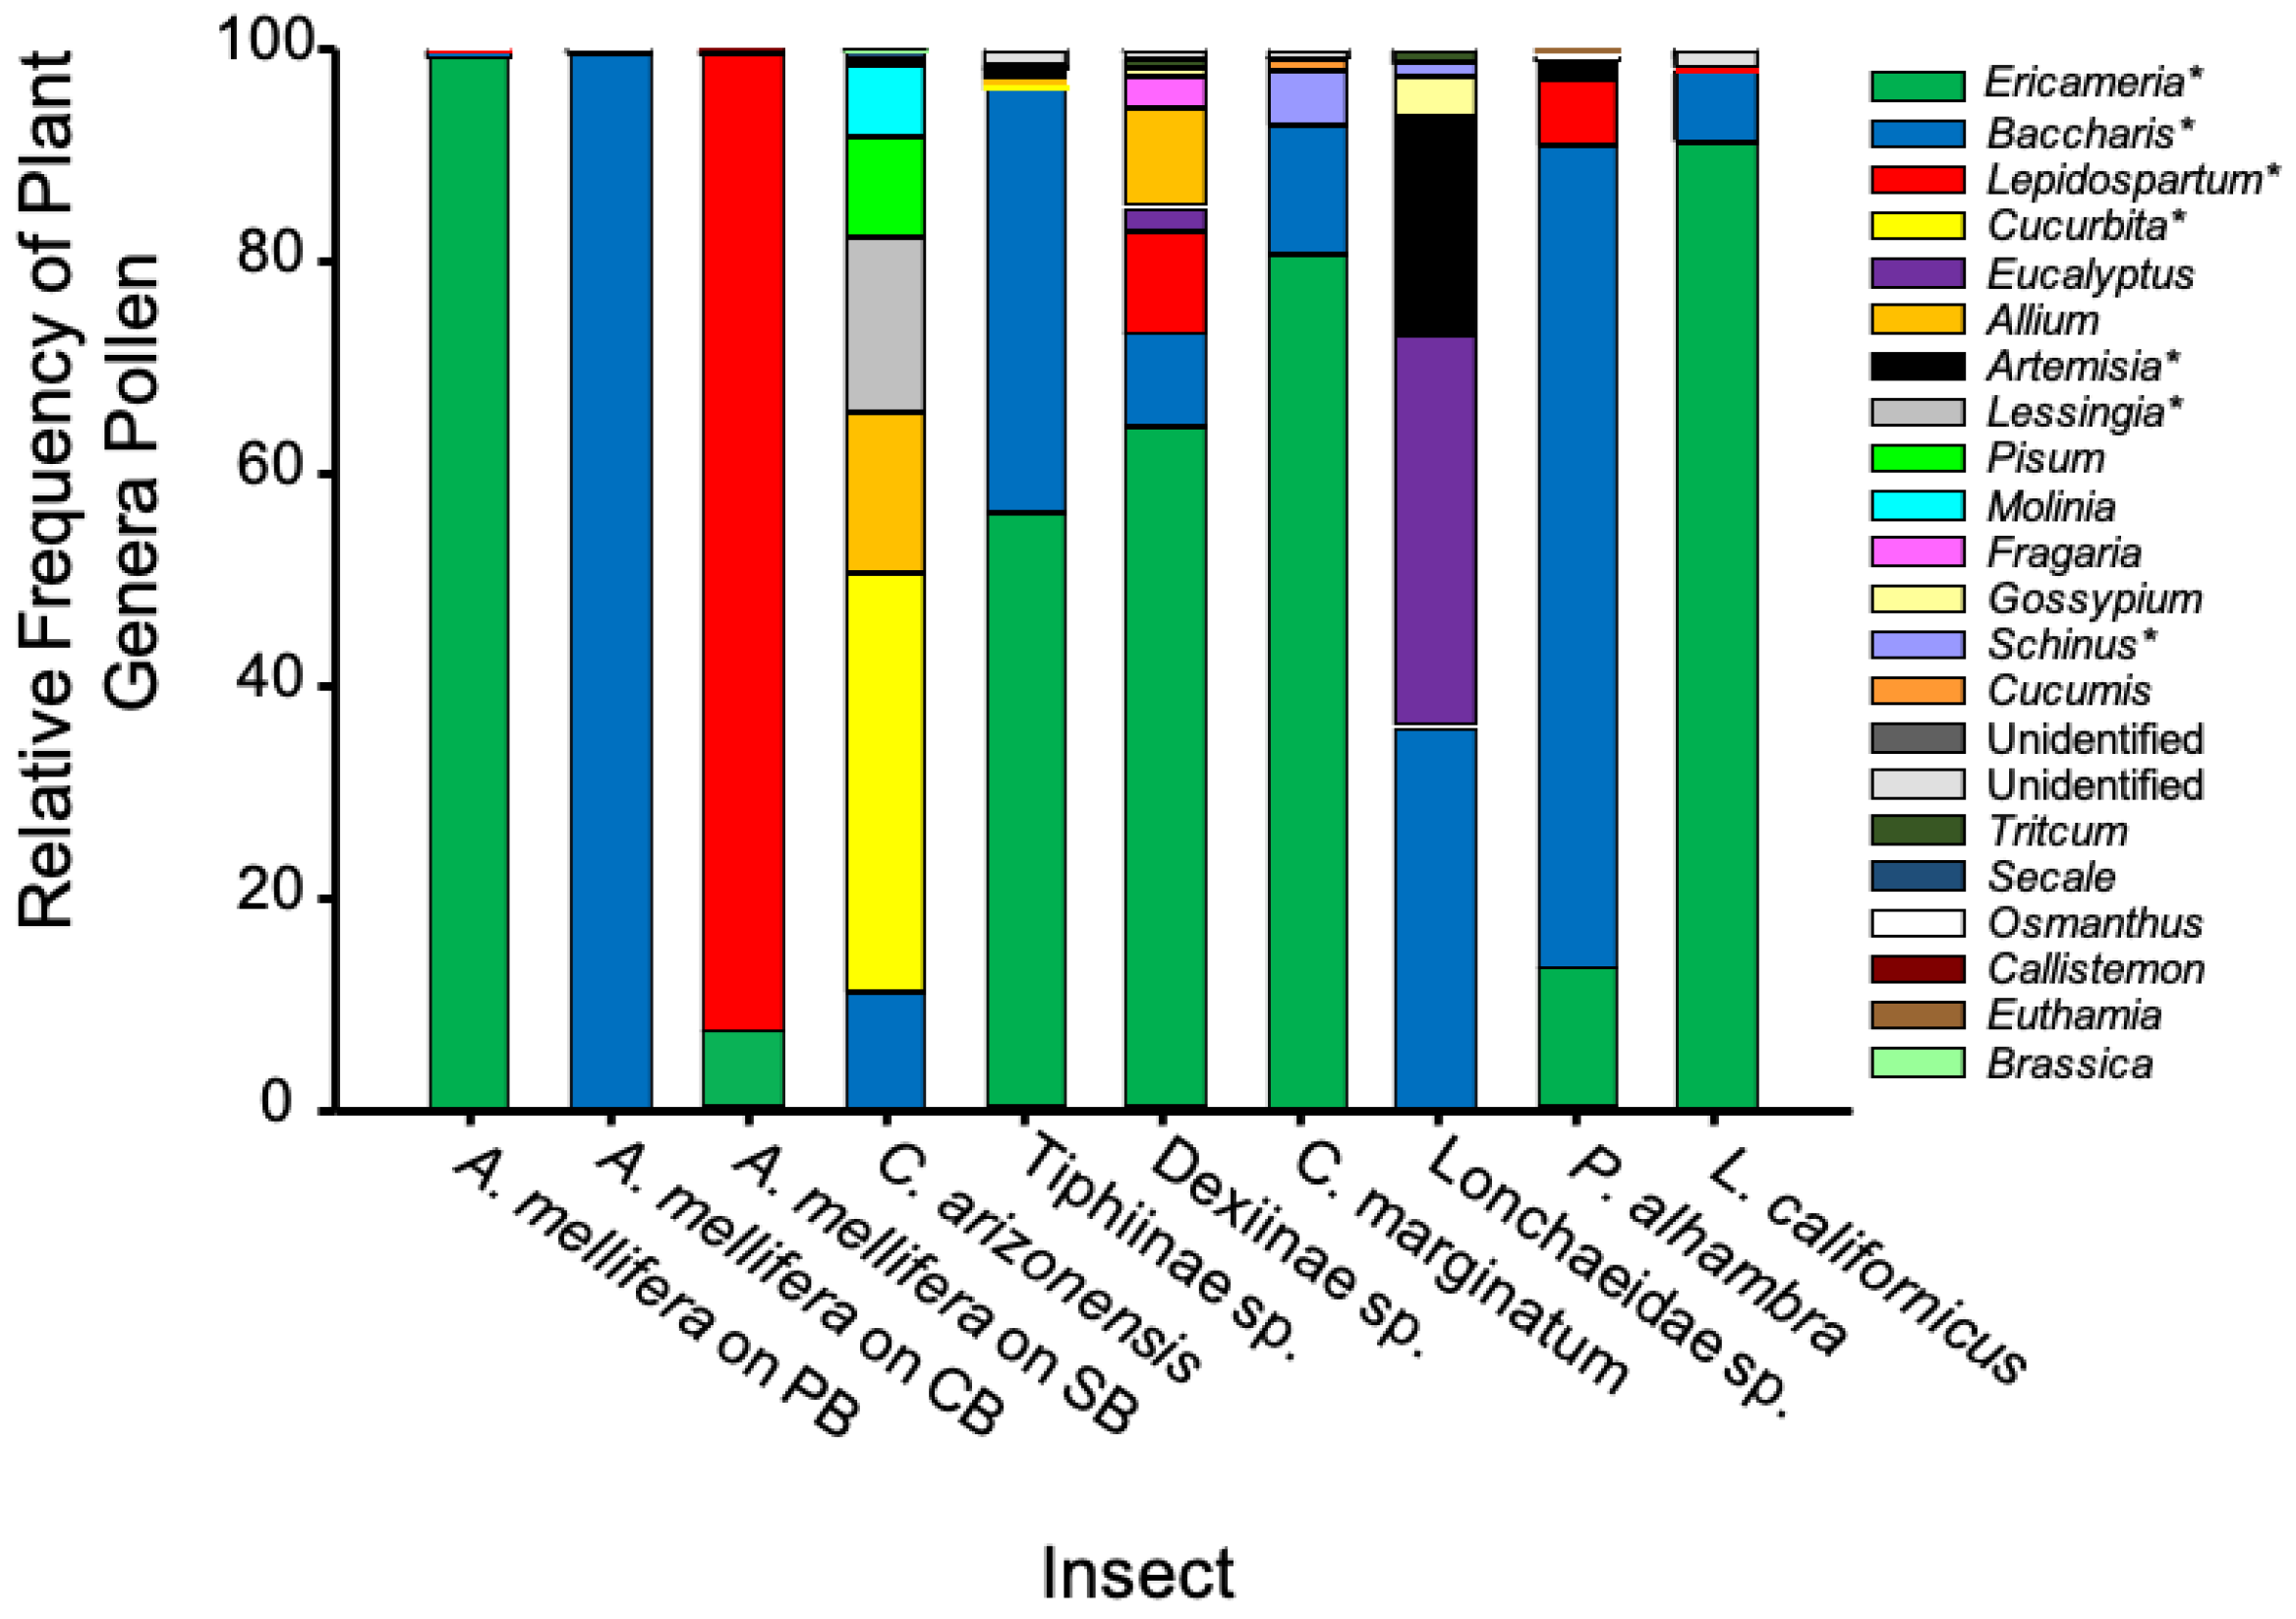
3.4. Pollen Analysis

We detected 27 genera of plants visited by the 7 morphospecies chosen for pollen analysis, with pollen from at least one of the three native shrub species present in each sample (Figure 3). In most cases, common flower-visiting insects carried pollen from the shrubs on which they were collected (see Table 2). The vast majority (91–99%) of pollen carried by honeybees, Apis mellifera, was from the plant on which they were collected (Figure 3). While C. arizonensis was collected on all three shrub species, DNA barcoding only detected pollen from B. pilularis. While Dexiinae sp. was only collected on L. squamatum and E. pinifolia, it also carried pollen from B. pilularis. Tiphiinae sp.1, which was only collected on B. piluaris, carried a majority of pollen from E. pinifolia (56.2%). Copestylum marginatum, also collected on all three shrubs, did not carry pollen from L. squamatum. The same was true of Largus californicus (Figure 3).
For all insect species, the majority of pollen came from the 9 genera of plants that grow within the BFS (see https://bfs.pomona.edu/biota/plants/, accessed on 1 April 2022) (Table 2, Figure 3). However, outside resources did appear to be important for C. arizonensis, Dexiinae sp., and Lonchaeidae sp.1, who sourced 31.9%, 16.2%, and 41.8% of their pollen loads from plants that only grow outside the BFS, respectively (Table 2).

4. Discussion

Our results highlight that fall-blooming CSS shrubs support a wide variety of insect species and are likely critical to maintaining diverse insect and pollinator assemblages in CSS. During our first year of sampling, we collected 85 flower-visiting insect species via hand netting. Inventory completeness was low on all shrub species and lack of observable asymptotes in rarefaction analyses indicate that further sampling efforts would yield additional species within our CSS fragment. Photo sampling, using both sporadic sampling of insects and standardized sampling for butterfly assemblages, provided an additional 38 insect species found on these fall-blooming shrub species. Of the 57 flower-visiting insects identified using photographs, only 19 (33.33%) were found using hand netting. Differences between hand netting and photograph data may be due to a variety of factors including: (1) photograph sampling was conducted over multiple years increasing the likelihood of capturing different species, and (2) during butterfly sampling, observer attention on this taxon increasing sighting of individuals on flowers. Combined, our results highlight the need for multi-year active field-based sampling efforts to effectively inventory the fall flower-visiting insect community on B. pilularis, L. squamatum, and E. pinifolia.
While passive collection via malaise traps is typically powerful in capturing a wide array of flying insects, including bees, parasitoid wasps, and moths [48], the insects we captured after 42 days of malaise trapping suggest that this approach may not be appropriate in documenting fall flower-visiting insect assemblages in CSS fragments. For example, we did not collect bees or butterflies using malaise traps, despite setting traps near actively flowering shrubs. While the malaise trap did capture wasps, there was no wasp species overlap with our netted specimens, further supporting the conclusion that malaise traps do not effectively collect the insects visiting fall shrubs. Only fly species were collected using both active and passive sampling techniques. Of the 56 fly species we found in hand netting and photo data, 7 (12.5%) were found in the malaise trap. Combined, our data suggest that malaise traps capture a different subset of the flying invertebrate community than those captured on fall-blooming shrubs. Consequently, future surveys focused on collecting flower-visiting insects and pollinators should utilize active collection approaches like hand netting and other observational approaches like those used to generate our photo data. Passive pan trapping, which we did not implement, may also be a good approach as it will passively collect species attracted to flowers by color association [49,50,51,52]. While it is suggested that malaise trap placement may greatly alter the abundance of insects one can capture [53], it is unclear how we might improve placement as we placed the trap near target shrub species when they were flowering. Similarly, type of malaise trap matters [53], but we utilized a Townes-style malaise trap, which is thought to be the most effective variety.
Our results highlight that fall floral resources may be critical for the preservation of bee species diversity in CSS. For example, these resources may be important for bees with long flight periods, such as Anthophora urbana that emerge during the summer and have flight periods extending into the fall season [31,54]. Five of the native bee species collected in this study (Ceratina arizonensis, Halictus farinosus, Halictus ligatus, Agapostemon texanus, and Anthophora urbana) were also collected by Hung et al. [6] between April and August, indicating the flight time for these species extends into the fall season. In addition, fall flowers may represent critical resources for species that are only active in the fall. One hand-netted and photographed species, Perdita ericameria, and one photographed species, Xeromelecta californica, were not found in the extensive sampling done by Hung et al. [6]. Perdita is a large genus of bees known for their narrow host plant preferences [55] and preference for native plants [31]. As suggested by its name, Perdita ericameria specializes on Ericameria spp., which would include E. pinifolia. Moldenke [5] also suggests that Perdita bees are important pollinators of Lepidospartum and Baccharis plants in California. However, Perdita ericameria has been found only in Los Angeles and Riverside counties [56], and consequently little is known of its biology. It is possible that without E. pinifolia, this highly specialized species would no longer be supported at the BFS. Xeromelecta californica is a widespread bee of the Western US, known for its cleptoparasitic relationship with Anthophora urbana [54]. We collected both species with active sampling, indicating that fall-blooming shrubs are not only important pollen and nectar resources for the cuckoo bee Xeromelecta californica and its host, but also help support its cleptoparasitic niche.
These comparisons support the idea that losing fall flowering shrubs within a habitat fragment may deleteriously impact bee and pollinator diversity, as well as the broader CSS insect community. This is especially true for B. pilularis, which featured the highest species richness of flower-visiting insects, and featured heavily in the pollen found during our DNA barcoding analyses. The flower-visiting insect assemblage on B. pilularis was different from the assemblages on E. pinifolia and L. squamatum. The extent to which this assemblage is reliant on the presence of B. pilularis requires further study. However, these patterns suggest that loss of B. piluaris and E. pinifolia or L. squamatum may deleteriously impact insect and pollinator assemblages in CSS fragments, highlighting the conservation value of the fall-blooming shrubs.
Analysis of the ITS2 region of pollen collected from the most abundant flower-visiting insects collected during hand netting emphasizes the value of native fall-blooming shrubs during the hot, dry fall season. Our results revealed that a majority of pollen (58–100%) came from plants within the BFS, a fragment of native CSS habitat, rather than from the surrounding suburban environment. European honeybees, Apis mellifera, are known to share foraging information via waggle dances to direct workers towards high quality floral resources [57,58,59]. Honeybees adhere closely to optimal foraging theory, selectively visiting flowers to maximize their efficiency and return, making them strong indicators of floral resource quality [60,61,62]. Pollen analyzed from honeybees collected on L. squamatum, E. pinifolia, and B. pilularis yielded over 92% specificity to the plant they were captured on in all cases (over 99% for B. pilularis and E. pinifolia), indicating these shrubs were being selectively targeted for their pollen by honeybees. From a honeybee’s perspective, then, it appears that fall-flowering shrubs found inside the perimeters of the BFS represent important resources.
In addition to the crucial role of native shrubs, suburban pollen resources may also be important. Nearly half (41.8%) of the pollen load carried by Lonchaeidae sp.1 originated from outside the BFS, and Ceratina arizonensis carried pollen from plants of the genera Allium, Pisum, Molinia, Cucumis, and Secale, which are not found in the BFS. These genera accounted for 31.9% of the Ceratina arizonensis pollen, suggesting suburban resources may help sustain the species during the fall season. It also appears, then, that these native bees may be contributing to pollination of backyard food crops, such as cucumber, squash, strawberries, peas, and nasturtiums. Similarly, the fly species Palpada alhambra carried pollen from 11 plant genera from both inside and outside the BFS, highlighting that floral resources both inside and outside CSS fragments are important to flower-visiting insect assemblages. Given insects are using resources beyond what is available in CSS fragments, it is important to also consider how suburban gardens can increase opportunities for flower-visiting insect species and support a more diverse bee community [31].
The pollen analysis performed in this study revealed details of flower-visiting insect foraging patterns that were not uncovered during hand netting. For example, Tiphiinae sp.1 was only collected on B. pilularis, leading to an assumption that this shrub is preferentially selected over other fall-blooming shrubs at the BFS. However, Ericameria accounted for 56.3% of this species’ pollen profile, suggesting an importance of E. pinifolia in this species’ diet that would not have been revealed by hand netting alone. Conversely, Ceratina arizonensis was caught on all three shrubs, but only had pollen from Baccharis pilularis, suggesting that while the bee may visit the other native shrubs, it may not utilize their floral resources. Consequently, DNA metabarcoding allows for additional insights into the foraging of flower-visiting insects, refining observations made by active sampling.

5. Conclusions

While little attention has been focused on fall flower-visiting insect assemblages in CSS, our results highlight that a diverse fall insect community utilizes floral resources provided by fall-blooming shrubs L. squamatum, E. pinifolia, and B. pilularis. In this study, conducted in one CSS fragment, we documented 123 flower-visiting insects, though increased sampling efforts, especially with efforts spanning multiple years, would certainly result in documentation of additional species. Based on our experience, malaise traps failed to capture fall flower-visiting insect assemblages in CSS and should not be used for this purpose. Fall floral resources may be critical for the preservation of insect diversity in CSS, particularly within isolated fragments. Further, the diversity of fall flowering shrubs found within a CSS fragment may be critical to maintaining flower-visiting insect species and pollinator diversity. Although our pollen analyses suggested that suburban plants are used, a majority of pollen came from plants likely found within the protected CSS habitat fragment. While further research is required, we hypothesize that the loss or absence of fall-blooming shrubs within CSS habitat fragments reduces the number of flower-visiting insects, including potential pollinators, that are supported, particularly in isolated fragments. Therefore, we recommend that future research test this hypothesis and restoration and conservation efforts consider their importance.

Author Contributions

Conceptualization, S.D. and W.M.M.III; methodology, S.D., A.R.O.C., E.J.C.III, N.V.H. and W.M.M.III; software, A.R.O.C. and W.M.M.III; validation, S.D., A.R.O.C. and W.M.M.III; formal analysis, S.D. and A.R.O.C.; investigation, S.D. and A.M.B.; resources, W.M.M.III; data curation, S.D., A.R.O.C. and W.M.M.III; writing—original draft preparation, S.D. and W.M.M.III; writing—review and editing, all authors; visualization, S.D. and W.M.M.III; supervision, W.M.M.III and A.R.O.C.; project administration, S.D. and W.M.M.III; funding acquisition, W.M.M.III. All authors have read and agreed to the published version of the manuscript.

Funding

This research was funded by the Pomona College Biology Department and the Shultz Family.

Data Availability Statement

All species collected and how they were collected can be gleaned from tables in this manuscript. Molecular data can be retrieved from GenBank’s SRA database under Bioproject PRJNA854139.

Acknowledgments

Access to our research sites were provided by the Robert J. Bernard Field Station. We thank Jonathan Wright and Hartmut Wisch for providing us additional photo data. We also thank Madison Brothers for her help in DNA extraction and Hartmut Wisch for his assistance in identifying pinned bee specimens.

Conflicts of Interest

The authors declare no conflict of interest. The funders had no role in the design of the study; in the collection, analyses, or interpretation of data; in the writing of the manuscript; or in the decision to publish the results.

References

  1. Michener, C.D. Biogeography of the bees. Ann. Mo. Bot. Garden 1979, 66, 277–347. [Google Scholar] [CrossRef]
  2. Cincotta, R.P.; Wisnewski, J.; Engelman, R. Human population in the biodiversity hotspots. Nature 2000, 404, 990–992. [Google Scholar] [CrossRef] [PubMed]
  3. Myers, N.; Mittermeier, R.A.; Mittermeier, C.G.; da Fonseca, G.A.B.; Kent, J. Biodiversity hotspots for conservation priorities. Nature 2000, 403, 853–858. [Google Scholar] [CrossRef] [PubMed]
  4. Hung, K.-L.J.; Ascher, J.S.; Gibbs, J.; Irwin, R.E.; Bolger, D.T. Effects of fragmentation on a distinctive coastal sage scrub bee fauna revealed through incidental captures by pitfall traps. J. Insect Conserv. 2015, 19, 175–179. [Google Scholar] [CrossRef]
  5. Moldenke, A.R. California pollinationecology and vegetation types. Phytologia 1976, 34, 305–361. [Google Scholar]
  6. Hung, K.-L.J.; Ascher, J.S.; Holway, D.A. Urbanization-induced habitat fragmentation erodes multiple components of temporal diversity in a Southern California native bee assemblage. PLoS ONE 2017, 12, e0184136. [Google Scholar] [CrossRef] [Green Version]
  7. Munz, P.A.; Renshaw, D.L.; Faber, P.M. Introduction to California Desert Wildflowers; University of California Press: Berkeley, CA, USA, 2020. [Google Scholar]
  8. Westman, W.E. Diversity relations and succession in Californian coastal sage scrub. Ecology 1981, 62, 170–184. [Google Scholar] [CrossRef]
  9. Bolger, D.T.; Suarez, A.V.; Crooks, K.R.; Morrison, S.A.; Case, T.J. Arthropods in urban habitat fragments in southern California: Area age, and edge effects. Ecol. Appl. 2000, 10, 1230–1248. [Google Scholar] [CrossRef]
  10. Rubinoff, D. Evaluating the California gnatcatcher as an umbrella species for conservation of southern California coastal sage scrub. Conserv. Biol. 2001, 15, 1374–1383. [Google Scholar] [CrossRef]
  11. Riordan, E.C.; Rundel, P.W. Modelling the distribution of a threatened habitat: The California sage scrub. J. Biogeogr. 2009, 36, 2176–2188. [Google Scholar] [CrossRef]
  12. Shreeve, T.G.; Mason, C.F. The number of butterfly species in woodlands. Oecologia 1980, 45, 414–418. [Google Scholar] [CrossRef] [PubMed]
  13. Bowers, M.A. Bumble bee colonization, extinction, and reproduction in subalpine meadows in northeastern Utah. Ecology 1985, 66, 914–927. [Google Scholar] [CrossRef]
  14. Jennersten, O. Pollination in Dianthus deltoides (Caryophyllaceae): Effects of habitat fragmentation on visitation and seed set. Conserv. Biol. 1988, 2, 359–366. [Google Scholar] [CrossRef]
  15. Cane, J.H. Habitat fragmentation and native bees: A premature verdict? Conserv. Ecol. 2001, 5, 1. [Google Scholar] [CrossRef]
  16. Gezon, Z.J.; Wyman, E.S.; Ascher, J.S.; Inouye, D.W.; Irwin, R.E. The effect of repeated, lethal sampling on wild bee abundance and diversity. Methods Ecol. Evol. 2015, 6, 1044–1054. [Google Scholar] [CrossRef]
  17. Sawyer, J.O.; Keeler-Wolf, T.; Evens, J.M. A Manual of California Vegetation; California Native Plant Society Press: Sacramento, CA, USA, 1995. [Google Scholar]
  18. Tabush, C.P. Temporal Bee Diversity and Abundance within the California Sage Scrub of the San Jose Hills and Chino Hills. Master’s Dissertation, California State Polytechnic University, Pomona, CA, USA, 2019. [Google Scholar]
  19. Montalvo, A.M.; Riordan, E.C.; Beyers, J. Plant Profile for Lepidospartum squamatum. In Riverside-Corona Resource Conservation District and U.S. Department of Agriculture, Forest Service; Pacific Southwest Research Station: Riverside, CA, USA, 2017. [Google Scholar]
  20. Francis, J.K. Wildland Shrubs of the United States and Its Territories: Thamnic Descriptions, Volume 1; U.S. Department of Agriculture, Forest Service, International Institute of Tropical Forestry: San Juan, PR, USA; U.S. Department of Agriculture, Forest Service, Rocky Mountain Research Station: Fort Collins, CO, USA, 2004.
  21. Hoffman, L. Spatiotemporal Variation in Pollinator Taxa on the Santa Ana River Woolly Star Eriastrum densifolium ssp. sanctorum (Milliken) Mason (Polemoniaceae). Master’s Dissertation, California State University, Fullerton, CA, USA, 2010. [Google Scholar]
  22. Barrios-Garcia, M.N.; Rodriguez-Cabal, M.A.; Rudgers, J.A.; Crutsinger, G.M. Soil fertilization does not alter plant architectural effects on arthropod communities. J. Plant Ecol. 2016, 10, 800–807. [Google Scholar] [CrossRef] [Green Version]
  23. Rudgers, J.A.; Whitney, K.D. Interactions between insect herbivores and a plant architectural dimorphism. J. Ecol. 2006, 94, 1249–1260. [Google Scholar] [CrossRef]
  24. Huey, S.; Nieh, J.C. Foraging at a safe distance: Crab spider effects on pollinators: Crab spider effects on pollinators. Ecol. Entomol. 2017, 42, 469–476. [Google Scholar] [CrossRef] [Green Version]
  25. Wania, A.; Kühn, I.; Klotz, S. Plant richness patterns in agricultural and urban landscapes in central Germany—Spatial gradients of species richness. Landsc. Urb. Plan. 2006, 75, 97–110. [Google Scholar] [CrossRef]
  26. Stout, J.C.; Morales, C.L. Ecological impacts of invasive alien species on bees. Apidologie 2009, 40, 388–409. [Google Scholar] [CrossRef] [Green Version]
  27. Goddard, M.A.; Dougill, A.J.; Benton, T.J. Scaling up from gardens: Biodiversity conservation in urban environments. Trends Ecol. Evol. 2010, 25, 90–98. [Google Scholar] [CrossRef] [PubMed]
  28. Schlaepfer, M.A.; Sax, D.F.; Olden, J.D. The potential conservation value of non-native species: Conservation value of non-native species. Conserv. Biol. 2011, 25, 428–437. [Google Scholar] [CrossRef] [PubMed]
  29. Koyama, A.; Egawa, C.; Taki, H.; Yasuda, M.; Kanzaki, N.; Ide, T.; Okabe, K. Non-native plants are a seasonal pollen source for native honeybees in suburban ecosystems. Urban Ecosyst. 2018, 21, 1113–1122. [Google Scholar] [CrossRef]
  30. Bjerknes, A.-L.; Totland, Ø.; Hegland, S.J.; Nielsen, A. Do alien plant invasions really affect pollination success in native plant species? Biol. Conserv. 2007, 138, 1–12. [Google Scholar] [CrossRef]
  31. Frankie, G.; Pawelek, J.; Chase, M.H.; Jadallah, C.C.; Feng, I.; Rizzardi, M.; Thorp, R. Native and non-native plants attract diverse bees to urban gardens in California. J. Pollination Ecol. 2019, 25, 16–23. [Google Scholar] [CrossRef]
  32. Alarcón, R. Congruence between visitation and pollen-transport networks in a California plant-pollinator community. Oikos 2010, 119, 35–44. [Google Scholar] [CrossRef]
  33. Thomson, D.M.; Meyer, W.M., III; Whitcomb, I.F. Non-native plant removal and high rainfall years promote post-fire recovery of Artemisia californica in southern California sage scrub. PLoS ONE 2021, 16, e0254398. [Google Scholar] [CrossRef]
  34. Dartnell, S.D.; Hamlett, N.; Meyer, W.M., III. Monitoring butterfly assemblages in southern California to assess the impacts of habitat and climate modifications. J. Insect Conserv. 2022, 26, 149–162. [Google Scholar] [CrossRef]
  35. Caspi, T.; Hartz, L.A.; Soto Villa, A.E.; Loesberg, J.A.; Robins, C.R.; Meyer, W.M., III. Impacts of invasive annuals on soil carbon and nitrogen storage in southern California depend on identity of the invader. Ecol. Evol. 2019, 9, 4980–4993. [Google Scholar] [CrossRef]
  36. Xu, X.; Ren, Z.-X.; Trunschke, J.; Kuppler, J.; Zhao, Y.-H.; Knop, E.; Wang, H. Bimodal activity of diurnal flower visitation at high elevation. Ecol. Evol. 2021, 11, 13487–13500. [Google Scholar] [CrossRef]
  37. Irwin, R.E.; Brody, A.K.; Waser, N.M. The impact of floral larceny on individuals, populations, and communities. Oecologia 2001, 129, 161–168. [Google Scholar] [CrossRef] [PubMed]
  38. Hargreaves, A.L.; Harder, L.D.; Johnson, S.D. Consumptive emasculation: The ecological and evolutionary consequences of pollen theft. Biol. Rev. 2009, 84, 259–276. [Google Scholar] [CrossRef] [PubMed]
  39. Inouye, D.W. The terminology of floral larceny. Ecology 1980, 61, 1251–1253. [Google Scholar] [CrossRef]
  40. Clarke, K.R.; Gorley, R.N. PRIMER V6: User Manual/Tutorial. Plymouth, PRIMER-E. Mar. Biol. 2006, 118, 167–176. [Google Scholar] [CrossRef]
  41. Bell, K.L.; Fowler, J.; Burgess, K.S.; Dobbs, E.K.; Gruenewald, D.; Lawley, B.; Morozumi, C.; Brosi, B.J. Applying pollen DNA metabarcoding to the study of plant–pollinator interactions. Appl. Plant Sci. 2017, 5, 1600124. [Google Scholar] [CrossRef]
  42. Sickel, W.; Ankenbrand, M.J.; Grimmer, G.; Holzschuh, A.; Härtel, S.; Lanzen, J.; Steffan-Dewenter, I.; Keller, A. Increased efficiency in identifying mixed pollen samples by meta-barcoding with a dual-indexing approach. BMC Ecol. 2015, 15, 20. [Google Scholar] [CrossRef] [Green Version]
  43. Bolyen, D.; Rideout, J.R.; Dillon, M.R.; Bokulich, N.A.; Abnet, C.C.; Al-Ghalith, G.A.; Alexander, H.; Alm, E.J.; Arumugam, M.; Asnicar, F.; et al. Reproducible, interactive, scalable and extensible microbiome data science using QIIME 2. Nat. Biotech. 2019, 37, 852–857. [Google Scholar] [CrossRef]
  44. Rivers, A.R.; Weber, K.C.; Gardner, T.G.; Liu, S.; Armstrong, S.D. ITSxpress: Software to rapidly trim internally transcribed spacer sequences with quality scores for marker gene analysis. F1000Research 2018, 7, 1418. [Google Scholar] [CrossRef] [Green Version]
  45. Callahan, B.J.; McMurdie, P.J.; Rosen, M.J.; Han, A.W.; Johnson, A.J.A.; Holmes, S.P. DADA2: High-resolution sample inference from Illumina amplicon data. Nat. Methods 2016, 13, 581. [Google Scholar] [CrossRef] [Green Version]
  46. Bokulich, N.A.; Kaehler, B.D.; Rideout, J.R.; Dillon, M.; Bolyen, E.; Knight, R.; Huttley, G.A.; Gregory Caporaso, J. Optimizing taxonomic classification of marker-gene amplicon sequences with QIIME 2′s q2-feature-classifier plugin. Microbiome 2018, 6, 90. [Google Scholar] [CrossRef]
  47. Banchi, E.; Ametrano, C.G.; Greco, S.; Stanković, D.; Muggia, L.; Pallavicini, A. PLANiTS: A curated sequence reference dataset for plant ITS DNA metabarcoding. Database 2020, 2020, baz155. [Google Scholar] [CrossRef] [PubMed]
  48. Sheikh, A.H.; Thomas, M.; Bhandari, R.; Meshram, H. Malaise trap and insect sampling: Mini review. Biol. Bull. 2016, 2, 35–40. [Google Scholar]
  49. Cane, J.H.; Minckley, R.L.; Kervin, L.J. Sampling bees (Hymenoptera: Apiformes) for pollinator community studies: Pitfalls of pan-trapping. J. Kans. Entomol. Soc. 2000, 73, 225–231. [Google Scholar]
  50. Trent, T.R.; Evans, E.W.; Tepedino, V.J. Pan-trapping for bees (Hymenoptera: Apiformes) in Utah’s West Desert: The importance of color diversity. Pan-Pac. Entomol. 2005, 81, 103–113. [Google Scholar]
  51. Roulston, T.H.; Smith, S.A.; Brewster, A.L. A comparison of pan trap and intensive net sampling techniques for documenting a bee (Hymenoptera: Apiformes) fauna. J. Kans. Entomol. Soc. 2007, 80, 179–181. [Google Scholar] [CrossRef]
  52. Westphal, C.; Bommarco, R.; Carré, G.; Lamborn, E.; Morison, N.; Petanidou, T.; Potts, S.G.; Roberts, S.P.M.; Szentgyôrgyi, H.; Tscheulin, T.; et al. Measuring bee diversity in different European habitats and biogeographical regions. Ecol. Monogr. 2008, 78, 653–671. [Google Scholar] [CrossRef] [Green Version]
  53. Matthews, R.W.; Matthews, R.J. Malaise trap: The townes trap catches more insects. Contrib. Am. Entomol. Inst. 1983, 20, 428–432. [Google Scholar]
  54. Torchio, P.F.; Trostle, G.E. Biological notes on Anthophora urbana urbana and its parasite, Xeromelecta californica (Hymenoptera: Anthophoridae), including descriptions on late embryogenesis and hatching. Annal. Entomol. Soc. Am. 1986, 79, 434–447. [Google Scholar] [CrossRef]
  55. Bossert, S.; Wood, T.J.; Patiny, S.; Michez, D.; Almeida, E.A.B.; Minckley, R.L.; Packer, L.; Neff, J.L.; Copeland, R.S.; Straka, J.; et al. Phylogeny, biogeography and diversification of the mining bee family Andrenidae. Syst. Entomol. 2021, 47, 283–302. [Google Scholar] [CrossRef]
  56. Timberlake, P.H. A Revisional Study of the Bees of the Genus Perdita F. Smith, with Special Reference to the Fauna of the Pacific Coast (Hymenoptera, Apoidea) Part III; University of California Press: Berkeley, CA, USA; Los Angeles, CA, USA, 1958. [Google Scholar]
  57. Riley, J.R.; Greggers, U.; Smith, A.D.; Reynolds, D.R.; Menzel, R. The flight paths of honeybees recruited by dance. Nature 2005, 425, 205–207. [Google Scholar] [CrossRef]
  58. Grüter, C.; Farina, W. The honeybee waggle dance: Can we follow the steps? Trends Ecol. Evol. 2009, 24, 242–247. [Google Scholar] [CrossRef]
  59. Nürnberger, F.; Keller, A.; Härtel, S.; Steffan-Dewenter, I. Honey bee waggle dance communication increases diversity of pollen diets in intensively managed agricultural landscapes. Mol. Ecol. 2019, 28, 3602–3611. [Google Scholar] [CrossRef] [PubMed]
  60. Abrol, D.P. Foraging behavior of bees as influenced by quality and quantity of rewards from flowers. J. Asia-Pac. Entomol. 2006, 9, 145–148. [Google Scholar] [CrossRef]
  61. Al Toufailia, H.; Couvillon, M.J.; Ratnieks, F.L.W.; Grüter, C. Honey bee waggle dance communication: Signal meaning and signal noise affect dance follower behaviour. Behav. Ecol. Sociobiol. 2013, 67, 549–556. [Google Scholar] [CrossRef]
  62. Saritha, R.; Vinod Chandra, S.S. Multi dimensional honey bee foraging algorithm based on optimal energy consumption. J. Inst. Eng. India Ser. B 2017, 98, 527–531. [Google Scholar] [CrossRef]
Figure 1. Rarefaction curves comparing species richness to sampling effort on the three fall-blooming shrubs. Significant differences are indicated by non-overlapping 95% confidence intervals.
Diversity 14 00958 g001
Figure 2. MDS ordination showing the relationship among the flower-visiting insect compositions (presence absence of different species) on the three fall-blooming shrubs. Closed shapes represent samples taken in the morning, while open shapes show samples from the afternoon. Similarity was determined using the Bray–Curtis similarity coefficient. Samples that are closer together are more similar in terms of species composition.
Diversity 14 00958 g002
Figure 3. Relative frequencies of plant genera detected from insect pollen loads, as identified by Qiime2 using the PLANiTS database. For A. mellifera, PB = captured on E. pinifolia, CB = captured on B. pilularis, SB = captured on L. squamatum. Asterisks denote pollen from plant genera located within the BFS. We also recovered pollen from Tropaeolum, Syzygium, Eriogonum, Medicago, and Sambucus, but these each represented less than 0.1% of the sequences and cannot be seen on this graph. Eriogonum and Sambucus were also classified as plant genera found within the BFS.
Diversity 14 00958 g003
Table 1. Bloom periods of L. squamatum, E. pinifolia, and B. pilularis at the Bernard Field Station in 2021.
Plant SpeciesSample Start DateSample End Date
L. squamatum16 September1 October
E. pinifolia12 October5 November
B. pilularis20 October5 November
Table 2. Species selected for pollen removal and molecular analysis and results of pollen DNA analysis. Concentration of extracted DNA was recorded using a EZDrop™ 1000. While no DNA was detected in some samples, sequencing was nonetheless successful. % Pollen from BFS was calculated by adding the relative abundance of all sequences from genera found at the BFS.
SpeciesNo.
Indiv.
Netting LocationExtracted DNA (ng/µL)No. Raw ReadsNo. Plant Genera% Pollen from BFS 2
Apis mellifera44L. squamatum2.4534,630799.79
Apis mellifera46B. pilularis9.032,8782100
Apis mellifera62E. pinifolia4.121,249699.93
Ceratina arizonensis19All 3 hosts1.5513,933967.17
Copestylum marginatum8All 3 hosts0 112,684597.90
Dexiinae sp.18L. squamatum & E. pinifolia0.0523,660982.84
Largus californicus6All 3 hosts017,021598.23
Lonchaeidae sp.113B. pilularis011,869658.16
Palpada alhambra27All 3 hosts0.312,6841199.05
Tiphiinae sp.122B. pilularis1.815,634797.63
1 a 0 indicates that no DNA was detected by the EzDrop 1000; 2 Percent of total sequences in the 9 plant genera located inside the BFS (out of 27 total).
Table 3. Bees of E. pinifolia (pine bush), B. pilularis (coyote bush), and L. squamatum (scale broom).
SpeciesPine BushCoyote BushScale BroomMalaise
NetPhotoNetPhotoNetPhoto
Agapostemon texanusX X
Agapostemon sp. X
Anthophora urbanaXX X
Anthophora sp. X
Apis melliferaXXX XX
Ashmeadiella sp. X
Ceratina arizonensisX X XX
Ceratina (Zadontomerus) sp. X
Ceratina sp. X
Colletes sp.1X
Colletes sp.2X
Dialictus sp.1 X
Dialictus sp.2 X
Dialictus sp.3 X
Hylaeus sp. X
Halictus farinosus X
Halictus ligatusX
Perdita ericameriaeXX
Rophitinae sp. X
Xeromelecta californica X
Xylocopa sonarina X
Total: 21 bee species8480660
Table 4. Butterflies of E. pinifolia (pine bush), B. pilularis (coyote bush), and L. squamatum (scale broom).
SpeciesPine BushCoyote BushScale-BroomMalaise
NetPhotoNetPhotoNetPhoto
Atlides halesus X
Brephidium exilis X
Danaus gilippus X
Danaus plexippus X
Erynnis tristis XX
Euptoieta claudia X
Heliopetes ericetorum X
Hemiargus ceraunus X
Hylephila phyleus X XX
Junonia coenia X X
Plebejus acmon X
Pyrgus albescens X
Strymon melinus X X X
Vanessa carduiXX X
Total: 14 butterfly species14012140
Table 5. Wasps of E. pinifolia (pine bush), B. pilularis (coyote bush), and L. squamatum (scale broom).
SpeciesPine BushCoyote BushScale BroomMalaise
NetPhotoNetPhotoNetPhoto
Ancistrocerus sp. X
Anomalon sp. X
Bembix sp. X
Braconidae sp.1 X
Braconidae sp.2X
Brasema sp.X X
Cerceris convergens X
Cerceris sp. X
Chalcidoidea sp. X
Eulophidae sp. X
Eurytomidae sp.1X X
Eurytomidae sp.2X
Gasteruptiidae sp.1 X
Gasteruptiidae sp.2 X
Leptochilus sp. X
Oxybelus sp. X
Paratiphia sp.1 X
Paratiphia sp. 2 X
Philanthus gibbosus X
Philanthus sp.1 X
Philanthus sp. 2 X
Polistes aurifer X
Tiphiinae sp. 1 X X
Tiphiinae sp. 2 X
Tiphiinae sp. 3 X
Vespula pensylvanica X
Total: 26 wasp species4080890
Table 6. Hemipterans of E. pinifolia (pine bush), B. pilularis (coyote bush), and L. squamatum (scale broom).
SpeciesPine BushCoyote BushScale-BroomMalaise
NetPhotoNetPhotoNetPhoto
Bagrada hilaris X
Largus californicusXXX XX
Largus sp. X
Murgantia histrionica X
Neacoryphus bicrucis X
Total: 5 hemipterans1110240
Table 7. Flies of E. pinifolia (pine bush), B. pilularis (coyote bush), and L. squamatum (scale broom).
SpeciesPine BushCoyote BushScale-BroomMalaise
NetPhotoNetPhotoNetPhoto
Acreophthiria sp. X X
Allograpta obliquaX
Aphoebantus sp.1 XXX
Aphoebantus sp.2 X
Bombyliidae sp.1 X X
Bombyliidae sp.2 X
Bombyliidae sp.3 X
Calliphoridae sp.1 X
Calliphoridae sp.2 X
Ceratitis capitata X
Coenosia sp. X
Conopidae sp. X
Copestylum marginatumX X X
Copestylum mexicanumXXXX X
Copestylum saturXXX X
Copestylum violaceum X
Desmometopa sp. X
Dexiinae sp.X XXX
Dilophus sp. X
Dioprosopa clavataXXX X
Diptera sp.1 X
Diptera sp.2 X X
Diptera sp.3 X X
Diptera sp.4 X
Diptera sp.5 X
Diptera sp.6 X
Diptera sp.7 X
Diptera sp.8X
Diptera sp.9X N/A *
Diptera sp.10 X N/A *
Eristalinus taeniops XX
Eristalis hirta X X
Eupeodes fumipennis X
Eupeodes volucrisX X
Geron sp. X X
Lonchaeidae sp.1 X
Lonchaeidae sp.2 X
Lucilia sp. X
Musciodea sp. X X
Oscinellinae sp. X
Palpada alhambraX XXXX
Palpada mexicana X XX
Paragus haemorrhous X
Paragus sp. X
Phthiriinae sp.1X X
Spilomyia interrupta X
Tachinidae sp.1X
Tachinidae sp.2 X
Tachinidae sp.3 X
Tephritini sp. X
Thaumatomyia sp. X
Toxomerus marginatusX X XX
Trichopoda pennipes XX
Villa lateralis X
Villa sp. X X
Zodion sp. X
Total: 56 fly species13830516157
* N/A indicates that specimens were so small that any captured in the Malaise trap would have been excluded from analyses.
Table 8. Total number of species, unique species (found only on one host; includes singletons), and singletons (those with only one specimen collected through all sampling) collected on each plant species. Furthermore, the predicted species richness and percent inventory completeness (as predicted by the Chao 2 estimator) collected on each plant host.
Plant SpeciesNo. Species CollectedNo.Unique SpeciesNo. Singleton
Specimens
Predicted Species
Richness (SD)
% Inventory
Completeness
L. squamatum35221476.1 (23.8)45.99
E. pinifolia27128117.3 (76.7)23.02
B. pilularis473626209 (98.2)22.49
Table 9. Pairwise comparisons between plant assemblages. An asterisk denotes significance using a modified α-value of 0.016 to account for multiple testing. * denotes p < 0.016.
Pairwise ComparisonR Valuep Value
L. squamatum, E. pinifolia−0.0250.614
L. squamatum, B. pilularis0.3190.002 *
E. pinifolia, B. pilularis0.2830.005 *
Table 10. Results from pair-wise SIMPER analyses of samples, listing the ten most important species according to their contribution to the dissimilarity between shrubs.
Pairwise Comparison
Insect Species
Proportion of Samples PresentAvg. Dissimilarity ± 1 SDContributed % Dissimilarity
B. pilularis vs. E. pinifoliaB. pilularisE. pinifolia
  Tiphiinae sp.10.550.004.66 ± 1.015.94
  Palpada alhambra0.550.644.40 ± 0.915.62
  Largus californicus0.090.363.12 ± 0.763.97
  Copestylum marginatum0.090.363.10 ± 0.733.96
  Lonchaeidae sp.20.360.002.78 ± 0.703.54
  Braconidae sp.10.360.002.68 ± 0.713.42
  Dexiinae sp.0.000.272.33 ± 0.582.97
  Desmometopa sp.0.270.002.13 ± 0.582.71
  Ceratina arizonensis0.180.092.05 ± 0.512.61
  Braconidae sp.20.000.272.05 ± 0.602.61
B. pilularis vs. L. squamatumB. pilularisL. squamatum
  Tiphiinae sp.10.550.004.39 ± 1.035.34
  Palpada alhambra0.550.364.24 ± 0.965.17
  Dexiinae sp.0.000.454.02 ± 0.874.90
  Copestylum marginatum0.090.272.74 ± 0.653.34
  Lonchaeidae sp.20.360.002.63 ± 0.713.20
  Braconidae sp.10.360.002.55 ± 0.723.10
  Ceratina arizonensis0.180.182.22 ± 0.622.71
  Desmometopa sp.0.270.002.01 ± 0.582.45
  Lonchaeidae sp.10.270.001.89 ± 0.592.30
  Apis mellifera0.821.001.69 ± 0.462.06
Publisher’s Note: MDPI stays neutral with regard to jurisdictional claims in published maps and institutional affiliations.

