Article

Tracing the Food Web of Changing Arctic Ocean: Trophic Status of Highly Abundant Fish, Gasterosteus aculeatus (L.), in the White Sea Recovered Using Stomach Content and Stable Isotope Analyses

by
Anna S. Genelt-Yanovskaya
1,*,
Natalia V. Polyakova
2,
Mikhail V. Ivanov
1,
Ekaterina V. Nadtochii
1,
Tatiana S. Ivanova
1,
Evgeny A. Genelt-Yanovskiy
1,3,
Alexei V. Tiunov
2 and
Dmitry L. Lajus
1
1
Department of Ichthyology and Hydrobiology, Saint Petersburg State University, 199034 Saint Petersburg, Russia
2
Laboratory of Behavior of Lower Vertebrates, A. N. Severtsov Institute of Ecology and Evolution, Russian Academy of Sciences, 119071 Moscow, Russia
3
Laboratory of Evolutionary Genomics and Paleogenomics, Zoological Institute Russian Academy of Sciences, 199034 Saint Petersburg, Russia
*
Author to whom correspondence should be addressed.
Diversity 2022, 14(11), 955; https://doi.org/10.3390/d14110955
Submission received: 15 September 2022 / Revised: 31 October 2022 / Accepted: 3 November 2022 / Published: 6 November 2022

Abstract

:
Studies of dietary preferences of migratory species are of great importance as these species connect food webs of habitats across the migration route and thus represent trophic relationships between the spatially disjointed communities. Here we described the dietary preferences of threespine stickleback G. aculeatus in the White Sea during the spawning season using stable isotope and stomach content analyses. The two analyses suggested that during the spawning season, when sticklebacks spend the majority of their time inshore, their diet consists mostly of benthic species, while at the beginning of the spawning season when fish migrating from the offshore were feeding on plankton. Additionally, we demonstrated that stickleback eggs contributed greatly to the diet of both male and female fish. Using Bayesian mixing modeling, we showed that dietary preferences in females were broader than in males, and more variable during the spawning season. While guarding their nests, males fed almost exclusively on eggs. Both stomach contents and isotope signatures demonstrate that by the end of the spawning season sticklebacks again increase the consumption of plankton. Isotope analysis proved to be a more reliable tool to trace this change than stomach content analysis. Our results show that stable isotope and stomach content analyses are complementary in understanding seasonal changes in the dietary composition of stickleback.

1. Introduction

Arctic marine communities are vulnerable to climatic oscillations and anthropogenic pressures. Here, the recent warming is occurring at a rate that is more than twice compared to the global rate [1,2]. As a result, today’s Arctic ecosystem is a rapidly changing environment where some species, especially widely distributed, can benefit by taking new niches, while others can be stressed by facing non-optimal conditions [3]. As a result, temperate communities are predicted to shift northwards into polar regions [4]. Subarctic ecosystems, such as the White Sea, are currently receiving special attention to monitor how the ongoing global change will be reflected in the structure of communities inhabited by both boreal and arctic species. The White Sea is a semi-enclosed marine area mostly located to the south of the Arctic Circle and connected to the Barents Sea via the narrow Gorlo Strait [5]. Additionally, the White Sea is a marine area characterized by relatively low anthropogenic impacts, even commercial fisheries are minor compared to the adjacent Barents Sea [6,7,8].
Small fish play fundamental roles in pelagic ecosystems, as they transfer energy and nutrients to higher trophic levels [3]. The White Sea population of the threespine stickleback Gasterosteus aculeatus has been the subject of extensive research in recent years, as an abundance of this small fish is growing here in line with other populations across Northern Europe [9,10,11,12,13,14]. Stickleback has negligible commercial significance and has been targeted by fisheries only during periods of high abundance. As species form a “wasp waist” in the marine food web, sticklebacks maintain a remarkable energy flow between lower trophic levels (e.g., planktonic communities) and higher trophic levels, including top predators [15]. In recent decades, threespine stickleback along with herring Clupea sp. are the most abundant fish in the White Sea [11,13]. It is evident that the role of such abundant species in trophic chains must be very high, yet information on that is very limited [16,17].
Stable isotope analysis is among the most informative methods for studying trophic relationships of organisms, diet, trophic positions, sources of primary production, the origin of particular organic matter in an ecosystem, and the type of ecosystem itself [18,19,20,21,22,23]. Values of δ13C and δ15N represent the major energy flow pathways at lower trophic levels, offering a time-integrated measure of the organism’s trophic position, accounting for temporal and spatial variation in feeding at multiple levels of the food web, and detecting trophic interactions that are otherwise unobservable, as stomach contents can differ from the material actually assimilated by an organism [24]. Stable isotope analysis does not require assumptions of prey trophic levels, thus can be applied at lower trophic levels as well [25]. Additionally, knowledge of the trophic position of populations within species allows differentiation between cryptic species or revealing previously unknown aspects of their biology [26].
The aim of this study was to assess the trophic status of the threespine stickleback before and during the spawning period in the White Sea with the specific reference to habitat heterogeneity. We used two complimentary methods—analyses of stomach content and stable isotope composition of nitrogen and carbon in the fish tissues and their prey organisms. By comparing results of these two approaches, we expect to better understand the role of G. aculeatus in energy flows between the open sea and inshore communities of the White Sea. Studies of the diet of widely distributed and highly abundant fish such as three-spine stickleback spawning inshore and wintering on the open sea are essential for predicting future changes to the Arctic marine biota as a result of climate changes.

2. Materials and Methods

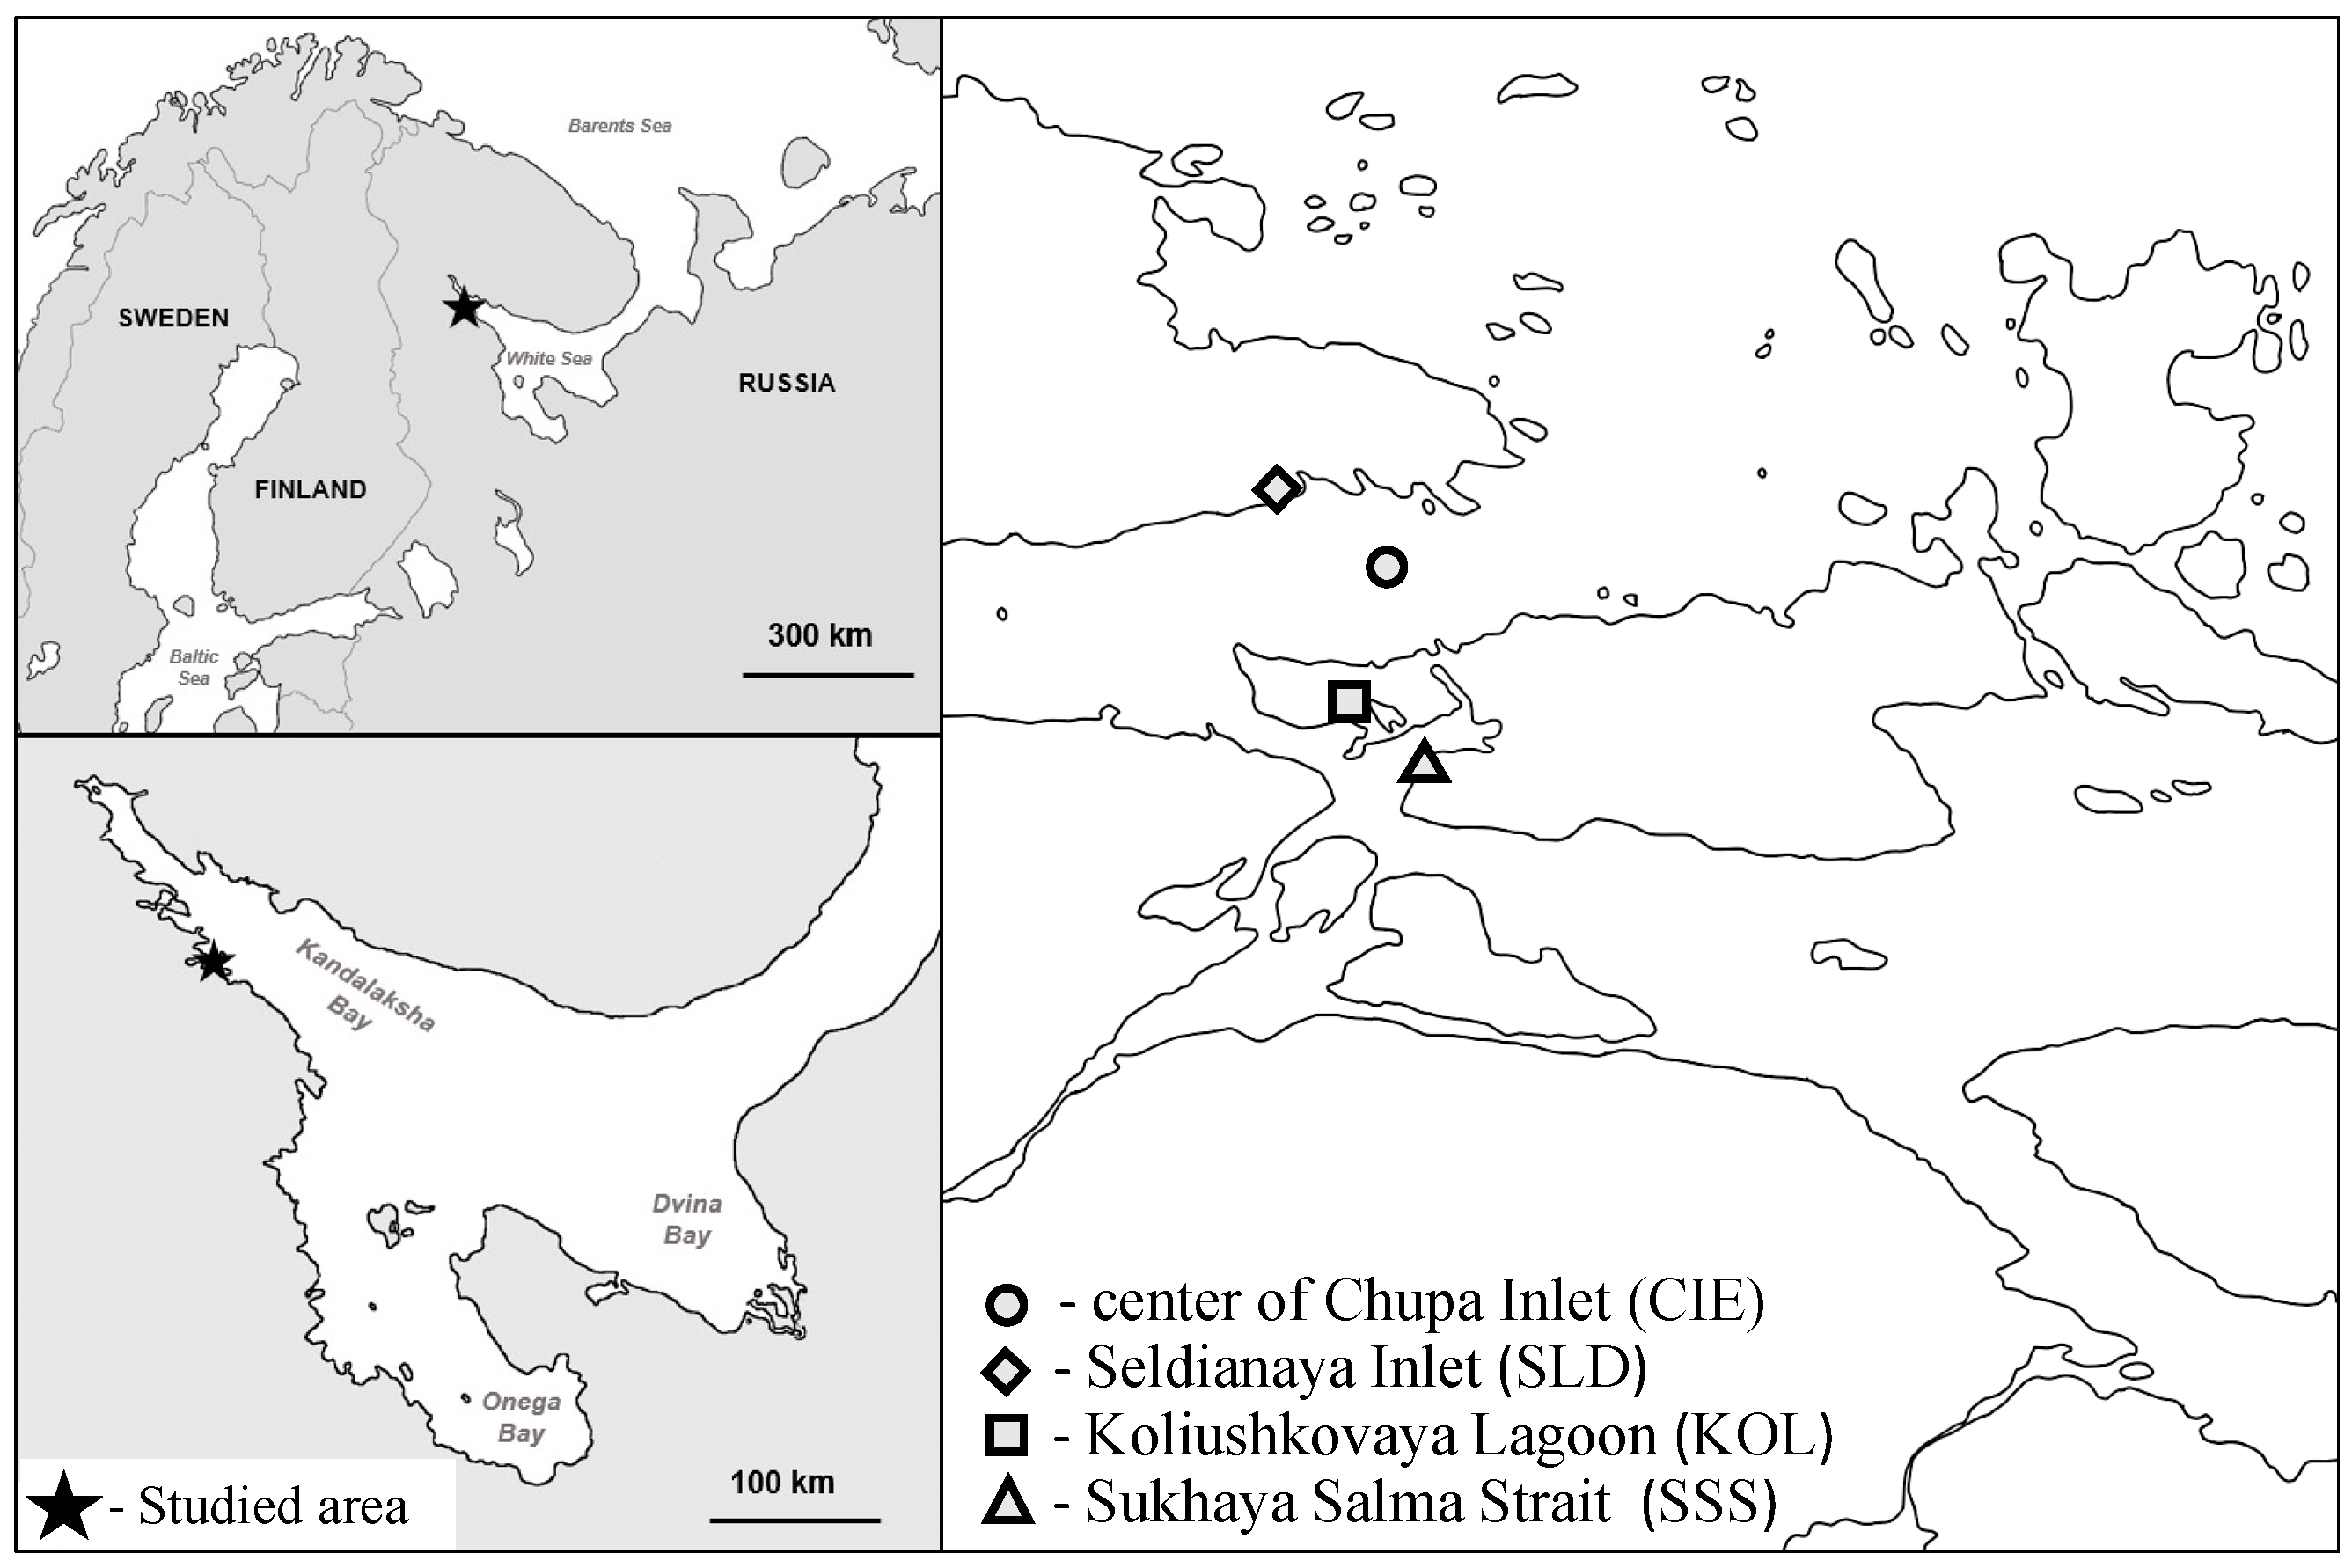
2.1. Study Area and Field Sampling

Samples of threespine stickleback were collected at four sites near the Education and Research station “Belomorskaya” of the Saint Petersburg State University in the Kandalaksha Bay of the White Sea. Samples for the main dataset (three inshore sites) were collected between June and July 2016 during the long-term monitoring studies of G. aculeatus (Figure 1). These sites represented various types of stickleback spawning grounds (Table 1) [13,16,27,28]. Inshore samples were collected in three periods of stickleback spawning season, particularly (i) beginning of the season (start of the first decade of June), (ii) middle (end of the second decade of June), and end (start of the first decade of July).
In early June 2019, before the start of spawning of stickleback, an offshore sample was collected at the center of Chupa Inlet entrance of Kandalaksha Bay (CIE) at 950 m from the shoreline and above approx. 50 m depth (Figure 1).
Inshore samples were collected using a beach seine with length and high of wings 7.5 and 1.5 m, respectively, a mesh size was 5 mm from knot to knot in the wings and 1 mm in the codend. In few cases, sticklebacks were caught using hand nets. Samples at the offshore site were collected using the surface twin trawl with characteristics similar to the beach seine. In 2016, simultaneously with fish samples, we also collected planktonic and benthic samples to analyze stable isotopes of main putative prey items for stickleback. Qualitative planktonic samples in one replicate were collected with a plankton net (size 93 mm) by filtering the surface water and consisted of mixture of zooplankton and phytoplankton organisms inhabiting the shallow water near the low water level mark. Intertidal benthic invertebrates were collected using benthic rectangular dredges.

2.2. Laboratory Analyses

All fish were weighed (±0.01 g), measured for total length (TL) (±0.1 mm), and sexed by observing the gonads. Boneless and skinless muscle tissue samples were individually frozen for further stable isotope analysis. Other specimens for stomach content analysis were fixed with 4% formaldehyde. For stomach content analysis, all zooplankton organisms were identified to the possible lowest taxonomic unit and counted (Qi). The best-preserved specimens of each prey item (up to 10 individuals) were measured with a micrometer eyepiece scale (up to 0.03 mm) for calculations of their biomass (Ii). The individual masses of prey organisms were determined based on their body length [29,30] or ready-average mass [31], and then summed up to obtain the total mass of particular prey item. In total, 264 G. aculeatus individuals were analyzed for stomach content analysis.
For stable isotope analysis, we have analyzed 175 samples from inshore sites (SLD, KOL, SSS). Stable isotope samples from CEO were not collected. Among them, 90 samples were sticklebacks equally represented by males and females (45 and 45 individuals, respectively). Thus, each of three periods of spawning season was represented by 15 G. aculeatus specimens of each sex per site. Additionally, 85 analyzed samples were taken from putative planktonic and benthic prey objects. Planktonic samples were not subjected to taxonomical species identification and thus were analyzed totally. Organisms from benthic samples were pooled by high-level taxonomic units to achieve sufficient biomass for the stable isotope analysis.
All samples were dried for 48–72 h at about 50 °C. After drying, samples were put into small tin capsules and weighed using a Mettler Toledo MX 5 balance with an accuracy of ±1 μg. At least (174 samples) in three replicates of each type of sample were prepared and analyzed.
The stable isotope analysis (SIA) was performed according to standard methods [32] using a Thermo Delta V Plus isotope mass spectrometer (Thermo Scientific, Waltham, MA, USA) equipped with an element analyzer (Thermo Flash 1112, Milan, Italy) at the Joint Usage Center of A.N. Severtsov Institute of Ecology and Evolution of RAS (Moscow, Russian Federation). Isotopic composition of C and N in organic matter was expressed in δ-notation relative to international standard (vPDB for carbon and the atmospheric N2 for nitrogen) (1).
δ ( ) = ( Rsample / Rstandard 1 ) × 103
where R = 13C/12C or 15N/14N. Samples were analyzed with reference gas calibrated against IAEA (Vienna, Austria) reference materials USGS 40 and USGS41. The drift was corrected using an internal laboratory standard (casein). The standard deviation of δ13C and δ15N values in the laboratory standard was ±0.2‰

2.3. Data Analysis

For fish, percent number (%Qi), percent biomass (%Ii), and percent frequency of occurrence (%Fi) were calculated, along with the index of relative importance (IRIi) and percent IRI (%IRIi) of each of their prey items [33,34] using the following Equations (2) and (3):
IRI i = ( % Q i + % I i ) · % F i
% IRI i = [ IRI i / ( IRI ) ] × 100
Comparison of stomach contents between male and female sticklebacks was implemented using one-way PERMANOVA analysis using Bray–Curtis similarity index, and SIMPER test. Based on the stomach content data the D–index was also calculated, indicating the number of taxa from stomach content significantly contributing to the diet of fish [35].
Feeding intensity was measured as index of fullness (FI, ‱) calculated (4) at first for each individual, and then averaged per species [36].
FI = 100 WS TW
where WS is the total weight intestinal tracts/stomachs contents and TW is the total weight of fish.
Trophic position was calculated by two methods. The first is more well-known [19,20] and based on difference of δ15N content in tissues of consumer and prey (also called the base) (5):
trophic   position = ( δ 15 N consumer δ 15 N base ) / a + 2
where a is a diet enrichment factor (3.2 for fish and their eggs; 3.4 for invertebrates) and 2 is the trophic level of the baseline organism (in our case it is the sample with the minimal isotope signature in each spawning season) [37]. Further, these values are called “observed”.
The second method is based on stomach contents and stable isotope values of prey organisms [19] allowing to assess expected trophic position (6):
trophic   position = ( I i / T i ) + 1
where Ii is the percent of biomass of prey item i, and Ti is the trophic position of prey item i, based on the literature data on feeding ecology [19]. In the following sections, we will call these values as “expected”.
To estimate proportion of each diet component we used Bayesian mixing models, which were performed in MixSIAR package in R [38]. To calculate the model, we prepared a set of data including (i) mean values of δ13C and δ15N, its standard deviation or standard error for predator (in our case these are males and females of threespine stickleback); (ii) mean values of δ13C and δ15N, its standard deviation or error for each prey organism; (iii) a set of trophic discrimination factors, which are calculated with the following Equations (7) and (8) [39].
Δ 13 C = δ 13 C predator δ 13 C diet
Δ 15 N = δ 15 N predator δ 15 N diet
where δ13C and δ15N are the carbon and nitrogen isotope values derived from the predator’s tissue.
Statistical analyses were performed using standard spreadsheet software (MS Excel 2013), STATISTICA v7.0, and PAST v.411. Separate factorial ANOVA analyses were run on individual parameters (factors: sex, period, site; input data were δ13C, δ15N, and observed trophic position, TP). Fisher’s post hoc comparisons were used to assess differences between sites, sexes, and period of spawning season. Generalized linear models (GLM) were used to evaluate factors affecting the intensity of adult stickleback feeding at spawning sites.

3. Results

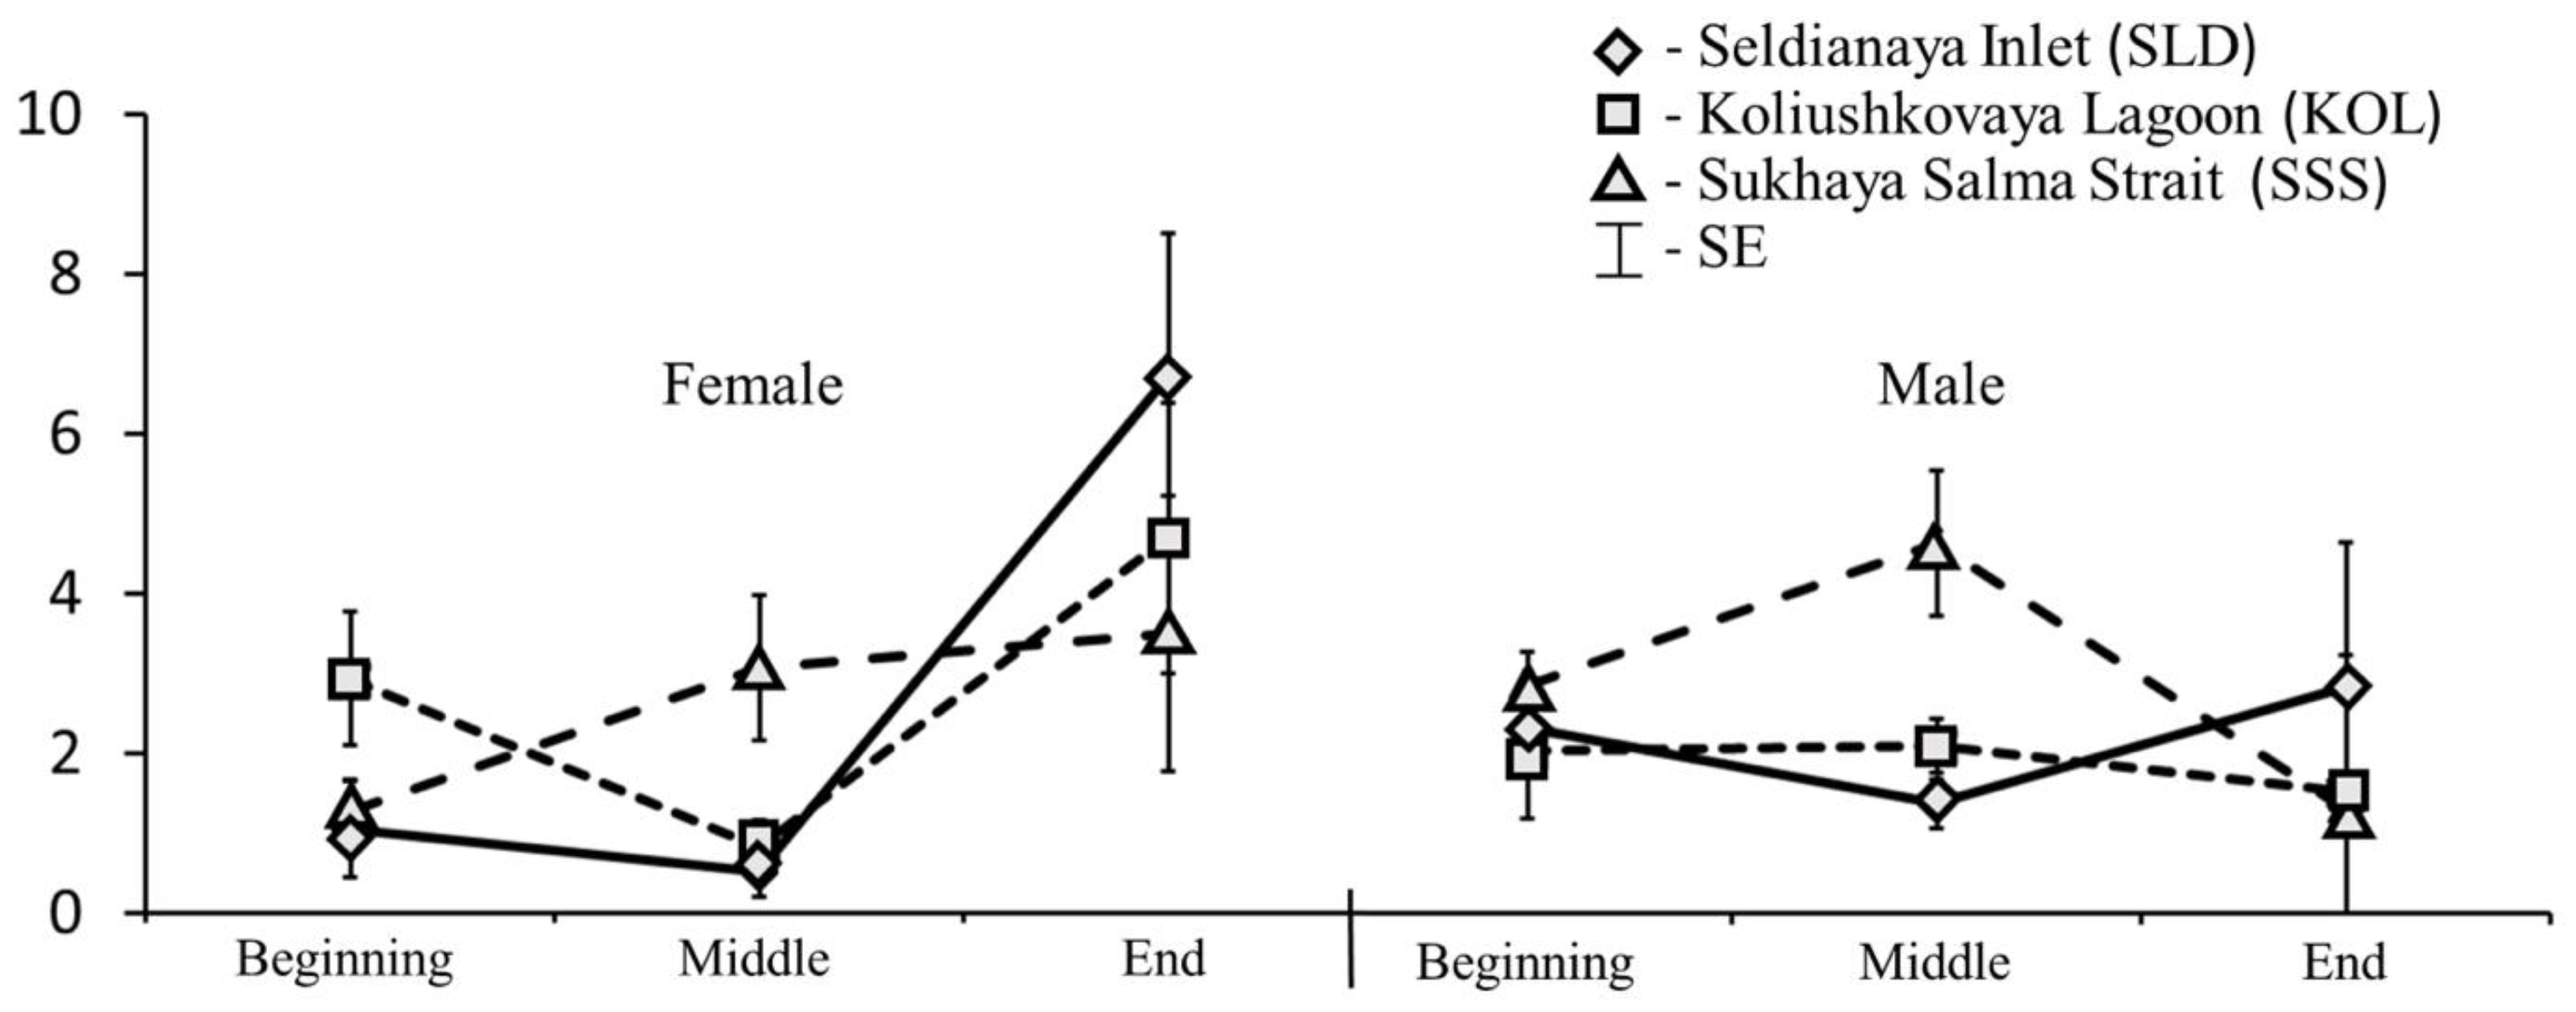
3.1. Feeding Intensity

Microscopic analysis of randomly sampled sticklebacks revealed no individuals with empty stomachs. The feeding intensity of fish, measured as an index of fullness (FI, ‱) is shown in Figure 2. Further comparison of FI using generalized linear models (GLMs) revealed that the period of spawning season had a significant effect on FI (p = 0.025). Other studied factors (standard length, site, and sex) alone did not have a significant effect.
Two factor combinations had significant effects, particularly (1) period of spawning season and site (p = 0.003) and (2) period of spawning season and sex (p = 0.001). The post hoc test indicated that during the beginning of spawning, FI did not differ significantly between males and females at all sites studied. At the end of the spawning period, females demonstrated significantly higher FI than males at KOL and SLD (p = 0.007 и 0.027, respectively).

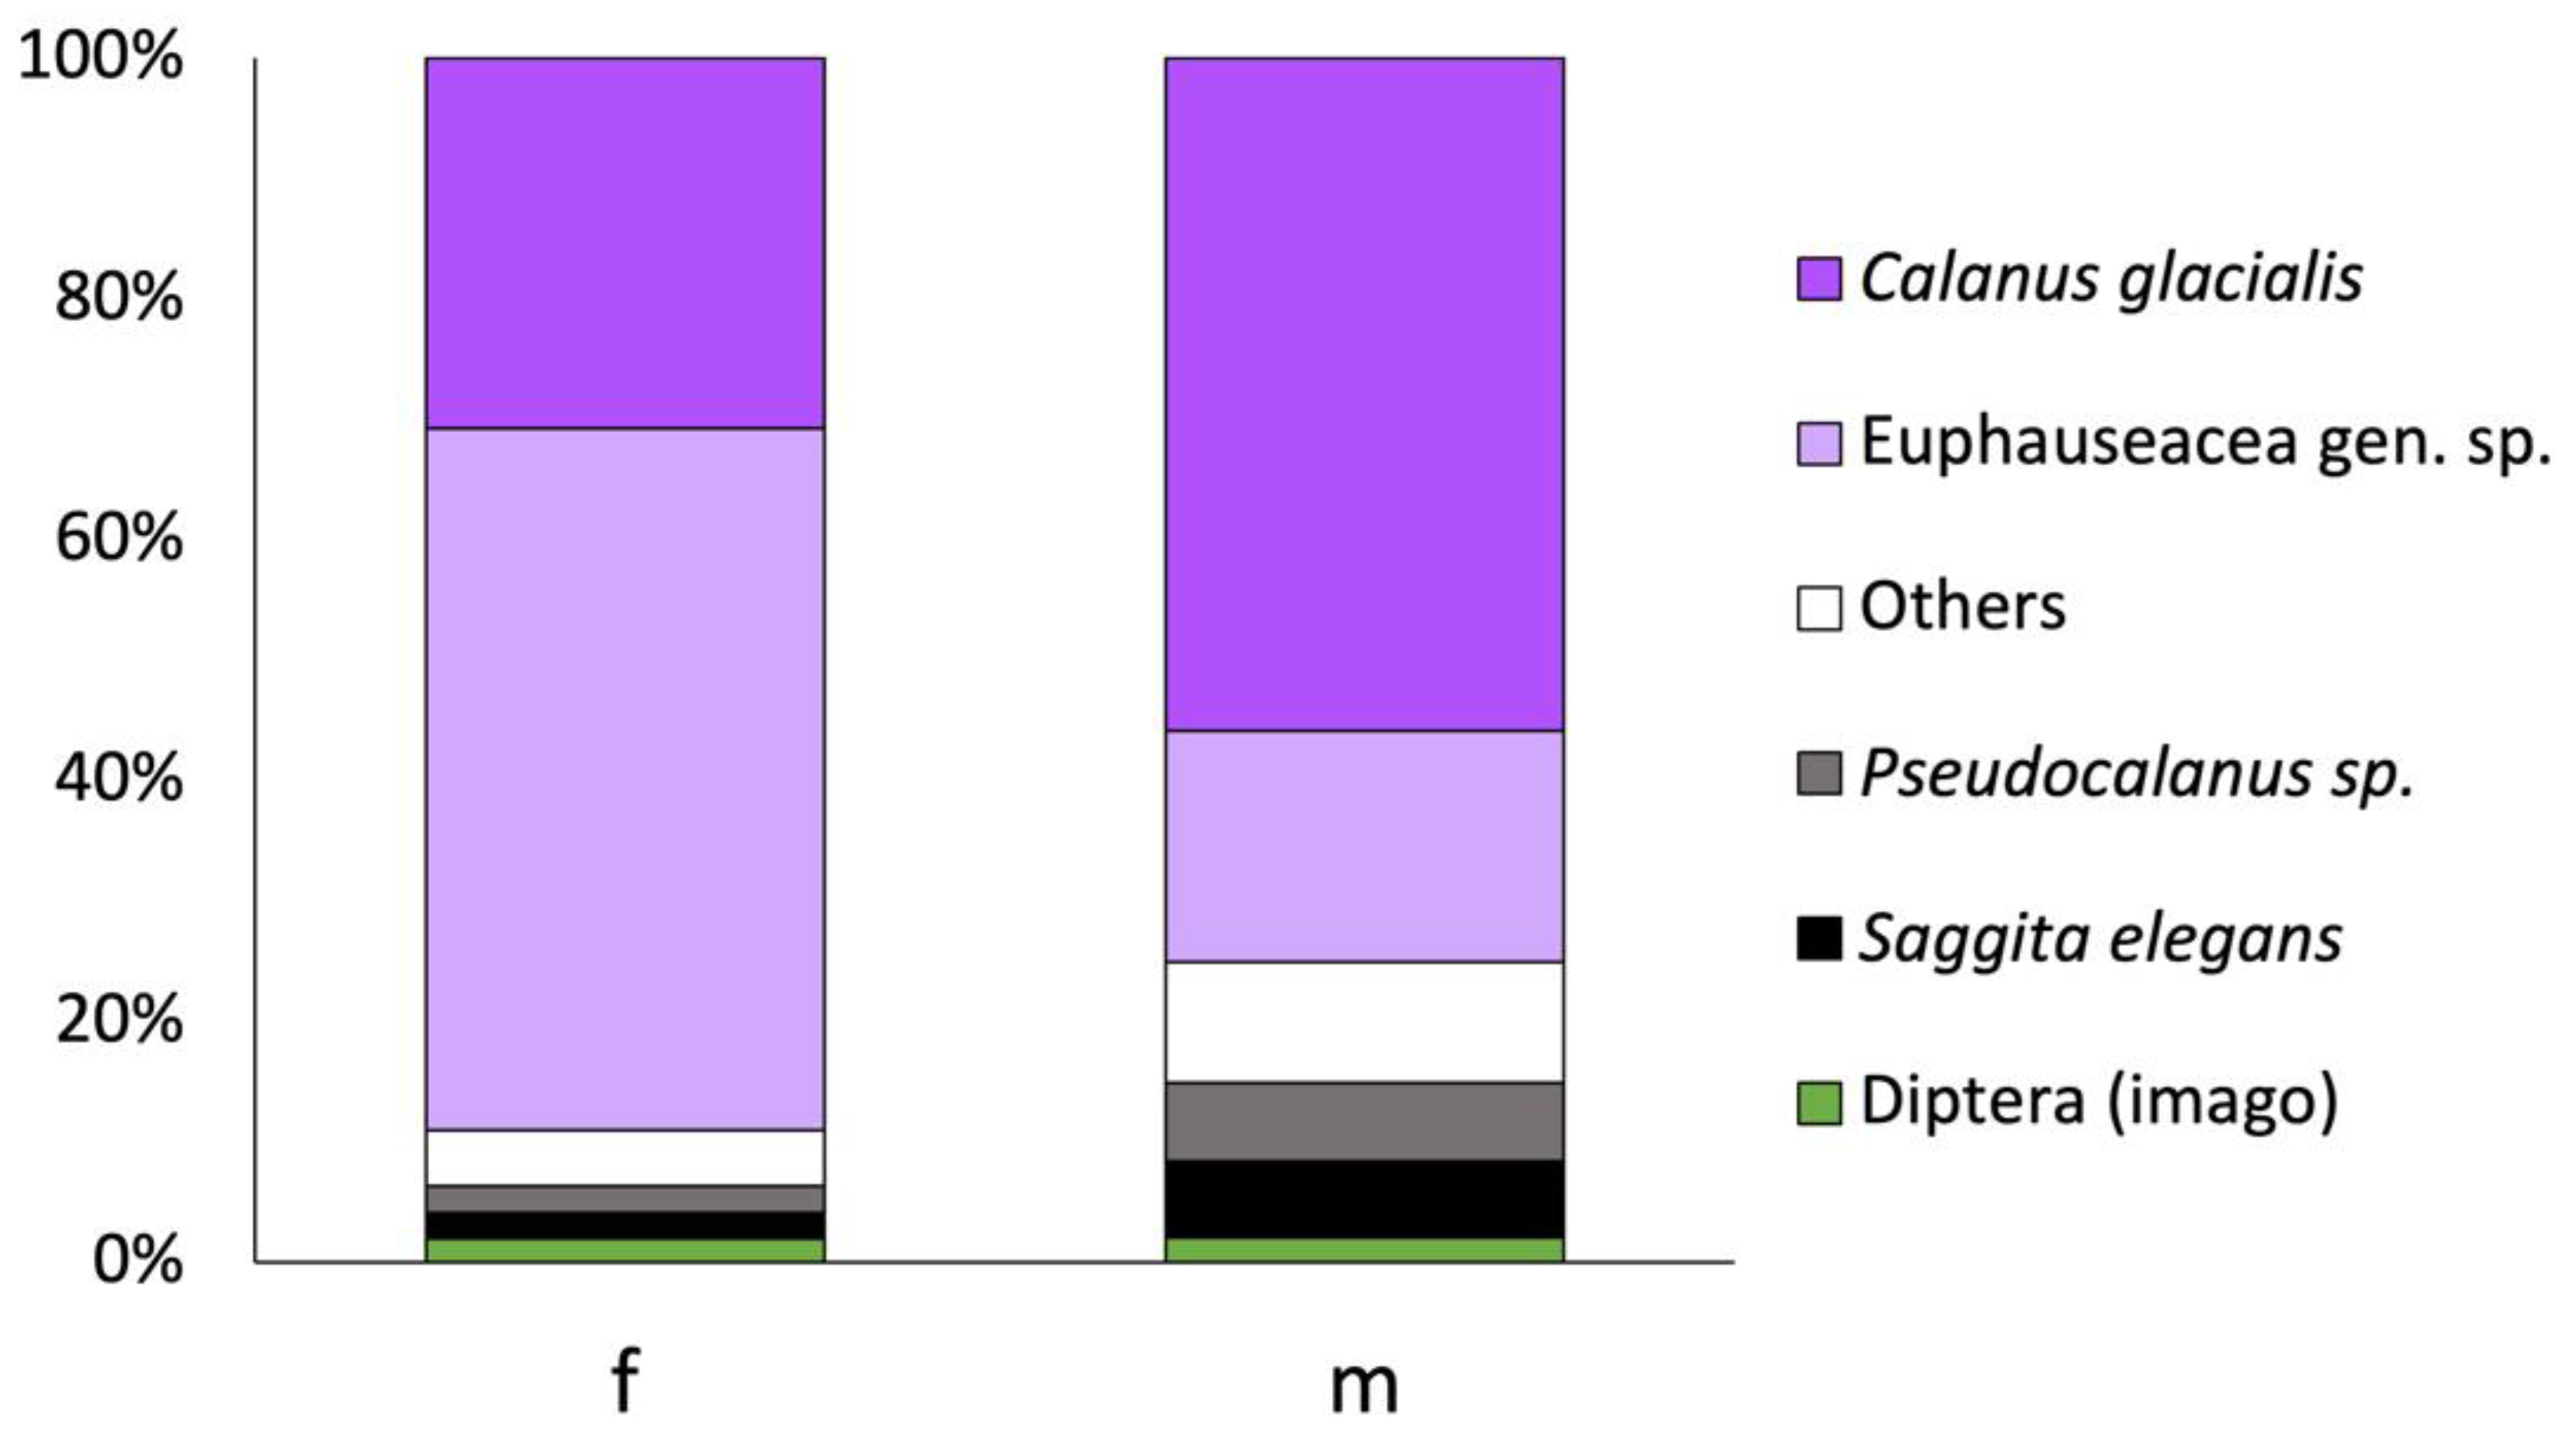
3.2. Stomach Content

Diet of stickleback in the open water site CIE before the start of spawning season (early June) consisted of 24 planktonic taxa, with prevalence of Calanus glacialis (50%) and Euphausiacea varia (30%) (Figure 3). The number of taxa in fish diet in the inshore zone between June and July was significantly greater—up to 33 species (ANOVA, F1–99 = 36.79, p < 0.001). On average, 5.5 ± 0.6 prey items were found in the stomach of fish from inshore sites in contrast with 3 ± 0.5 prey items in the stomach of fish from the offshore site. Diet of fish at inshore sites was characterized by notably higher D-index than the offshore site. At the offshore site, the CIE D-index varied per individual fish between 1.4 and 1.6 in females, and between 1.7–2.2 in males. At the inshore sites, the D-index varied between 3.1 and 3.8 in females, and between 2.7 and 3.7 in males.
According to stomach content analysis, stickleback eggs were the most important prey item of sticklebacks at the inshore sites during the whole spawning season, comprising more than 90% of stomach content in 25% of analyzed individuals. G. aculeatus demonstrated a switch from planktonic to benthic feeding, preying on polychaetes (up to 85%), pupae and larvae of Chironomidae, amphipods, and imago stages of Diptera (Table 2).
Based on taxonomic identification of prey items from stomach contents, diet of sticklebacks at the inshore sites throughout the season consisted of 25 taxa in female fish and 17 taxa in male fish (Table 2). Nevertheless, no significant differences were found between stomach contents of males and females at the inshore sites during the spawning season (PERMANOVA F = 1.376, p = 0.24). According to SIMPER test, overall average dissimilarity was 38.48, i.e., less than 40%). On the contrary, the diet of stickleback differed related between sexes at the offshore site sampled before the start of the spawning season (PERMANOVA F = 1.376, p = 0.24; SIMPER overall dissimilarity = 90.76).

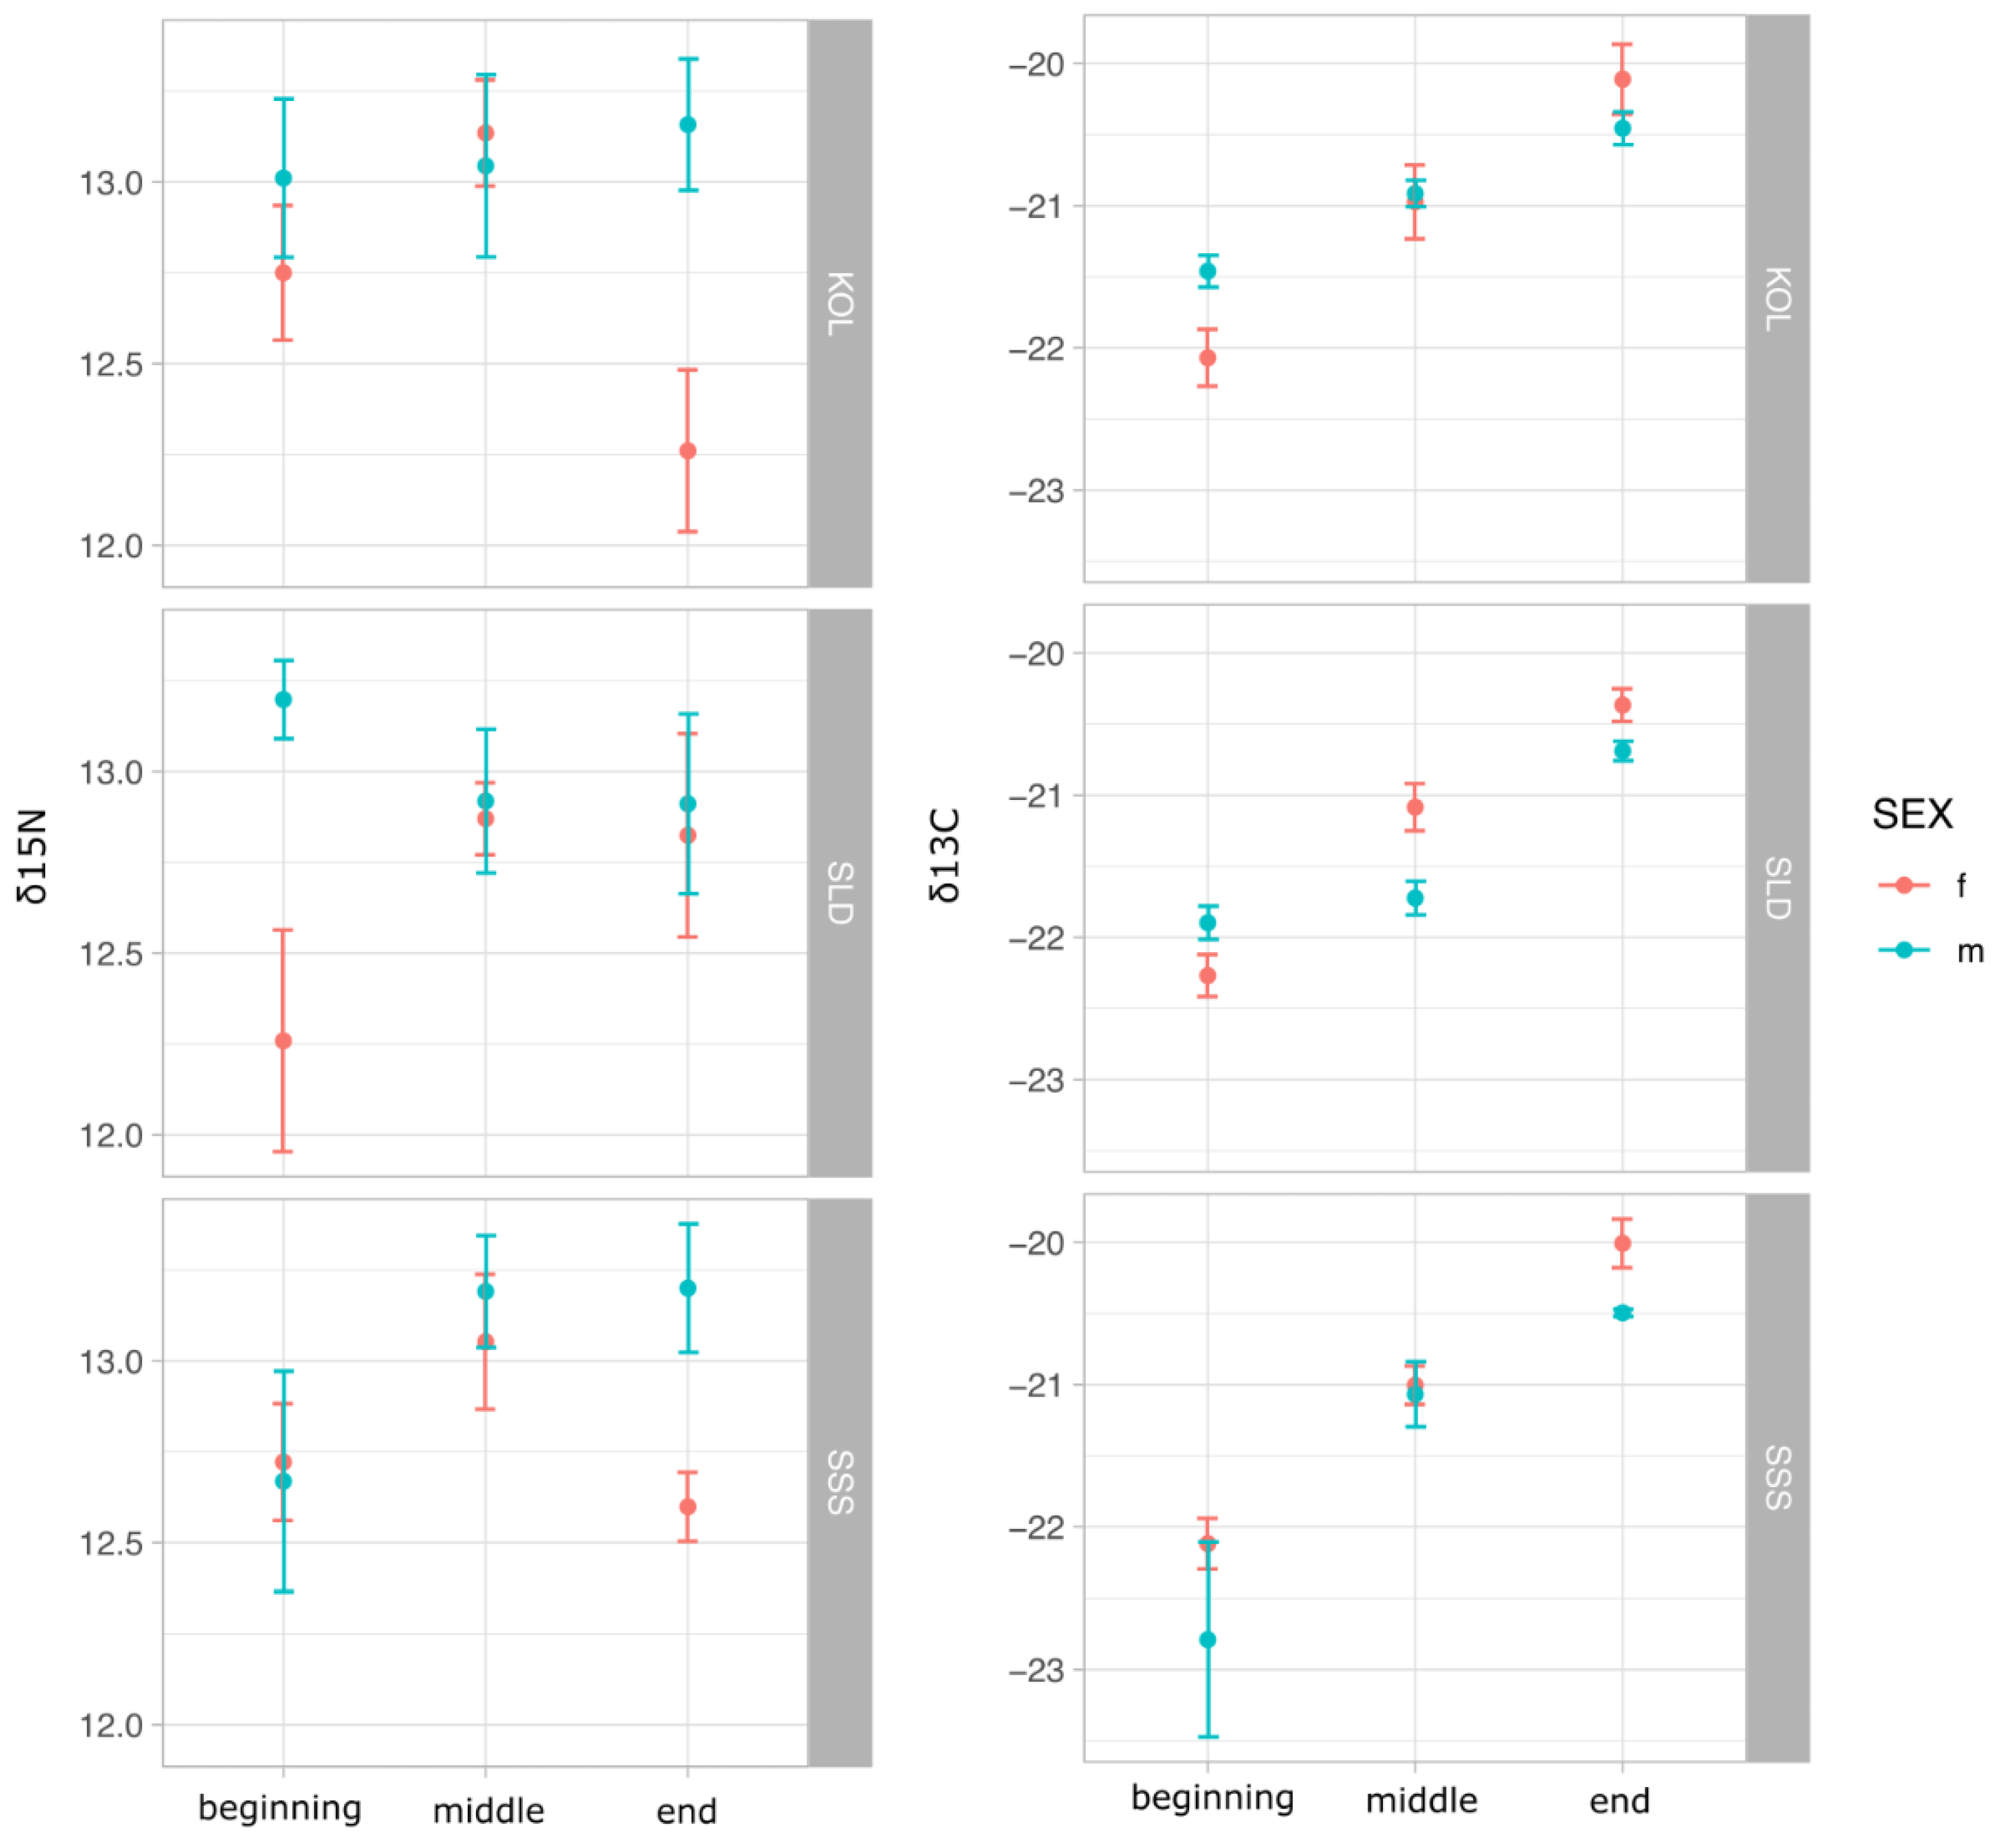
3.3. Stable Isotopes Values in Sticklebacks, Benthic and Planktonic Invertebrates

In sticklebacks, δ13C values varied between −25.76‰ and −19.34‰ in males, and from −22.76‰ to −19.34‰ in females. The δ15N varied between 11.19‰ and 13.65‰ in females and between 12.07‰ and 13.82‰ in males (Table 3). The difference in δ15N values between sexes was significant, but differences in δ15N values in sticklebacks (sexes pooled together) between sites and periods of spawning season were not significant. Differences in δ13C carbon values between different sites were also significant, Koliushkovaya Lagoon (KOL) was different from other sites (ANOVA, post hoc p < 0.01) (Figure 4; Table 3 and Table 4).
Stable isotope values (δ13C) differentiated potential prey items for G. aculeatus into two groups corresponding to planktonic and benthic taxa, respectively (Table 3, Figure 5) with δ13C values in plankton lower than in benthos. From the beginning to the end of the spawning period, carbon δ13C values in the muscle tissues of sticklebacks significantly increased following changes in the diet from planktonic to benthic prey in both sexes.

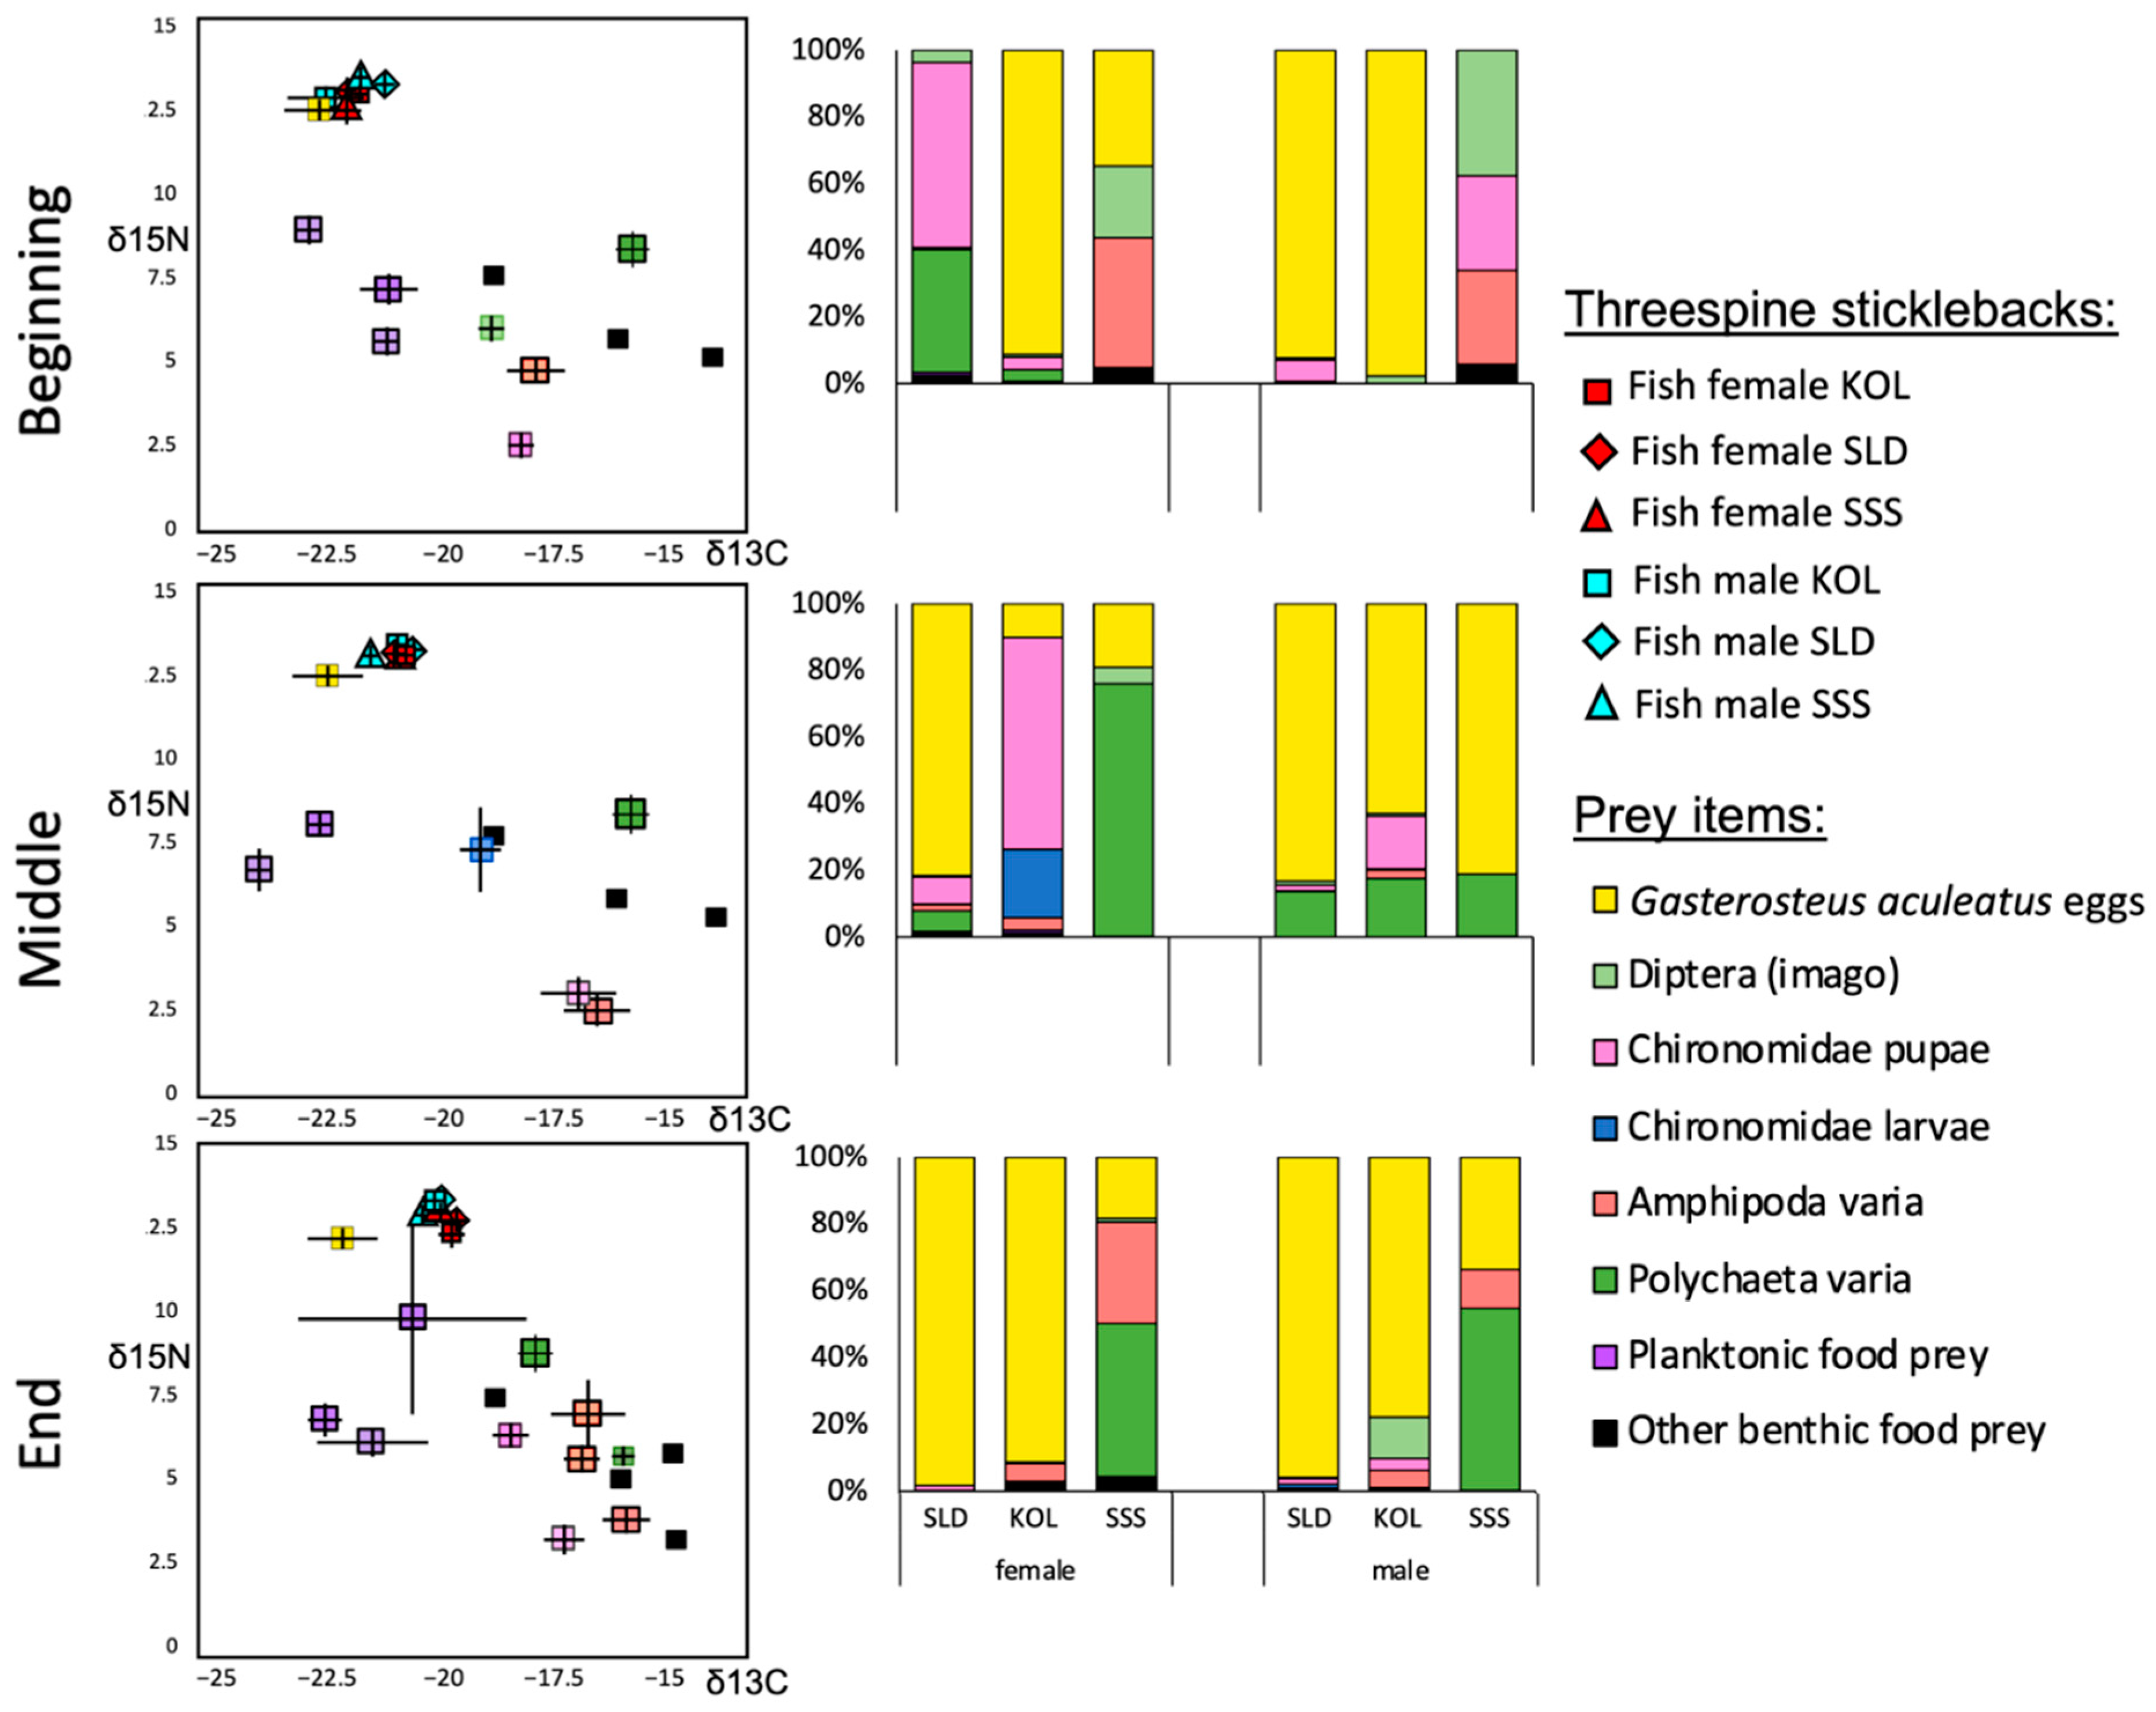
3.4. Comparing Stable Isotopes with Stomach Contents

The trophic position of stickleback significantly differed between sexes and spawning periods. The observed trophic position (TP) of male sticklebacks was slightly higher compared to females, but the entire range opposite was a bit higher for the females (see Table 3 and Table 4). The trophic position of the entire population was significantly higher at the end of the spawning position compared to the beginning and middle periods (ANOVA, post hoc all p < 0.001). Yet, no significant differences between sites in heavy stable isotope content were found (Table 4). The expected trophic position tended to be lower than the observed position by 0.9–1.2 units with a median of 1 unit (Table 3).
Results of Bayesian mixing modeling (Table 5) demonstrated that stickleback eggs are the main food resource for fish during the whole spawning season. At the beginning of spawning, the proportion of fish eggs in the diet spectrum was 99.4% for females and 99.9% for males; the proportion of other prey in female’s and male’s diet are extremely low (<0.1%). In the middle of the spawning season, fractions of benthic resources were slightly higher in females (4.8%—Polychaeta, 0.2%—Oligochaeta) and in males (1.4%—Polychaeta). Yet, the diet largely consisted of stickleback eggs (94.8% for females and 98.5% for males). By the end of spawning, the diet of females was more diverse due to the higher fractions of benthic (29.1% total) and zooplanktonic prey (14.6%), whereas fish eggs remain practically the only prey for males (99.9%).

4. Discussion

The diet of marine and freshwater threespine stickleback has recently been extensively studied using the stomach content, stable isotope, and DNA metabarcoding analyses [40,41,42]. In the present study, we provide a description of changes in the diet of sticklebacks during the migration to the seasonal spawning grounds (represented by an offshore site CIE) and between three periods of spawning season of sticklebacks, when fish spend most of the time in the inshore. For this, we analyzed the stomach content using a combination of two methods—taxonomic identification and stable isotope analysis from fish collected at three types of spawning grounds of G. aculeatus (see Materials and Methods for details).
At the spawning grounds, the stickleback diet was more diverse than in the pelagic zone, which can be attributed to a shift from pelagic to benthic feeding. Based on the stable isotope analysis, G. aculeatus has the most constant trophic relationships during their life history with planktonic species. Before the spawning season, the main food sources of sticklebacks caught at the Chupa Inlet entrance (CIE) were Calanus glacialis and Euphausiacea (Figure 3). During the spawning season, a temporary switch to benthic taxa occurs, which can be seen from the stomach content analysis of fish caught inshore (Figure 4). At the inshore spawning grounds, sticklebacks demonstrated an increase in the diversity of prey objects in the inshore area than in the offshore before the spawning season. In addition, no planktonic taxa in the stomach contents of the inshore fish were found. An increase in the diversity of prey objects, measured as the D-index, was higher in both males (two-fold) and females (two-fold) compared to the pre-spawning season offshore sample. While the fish diet in early summer was mostly dominated by one prey species, later in the summer, between two and three various prey items always prevailed in the diet of fish at the inshore sites. In the middle of the spawning season, no considerable variation in stickleback diet was observed despite some fish just arriving inshore whereas others already spent their few weeks. The latter data indicate that the switch from plankton to benthos occurs simultaneously among the whole local population.
The stable isotope signature in muscle tissues of sticklebacks changed during the summer season when fish presumably foraged in the intertidal and upper subtidal zones. During this period, sticklebacks slightly changed their δ13C isotope signature from planktonic to benthic species. Previous studies have shown that juvenile sticklebacks first feed on benthic intertidal chironomid larvae and then switch to planktonic diets prior to migrating offshore [17,42,43]. Thus, both analyses indicate that the threespine stickleback G. aculeatus in the White Sea can be regarded as an omnivorous fish species with opportunistic feeding behavior that feeds on the most available food source.
Even though sticklebacks foraged a variety of benthic organisms, they mostly consumed stickleback eggs during most of the spawning season. Egg and larval cannibalism are already well known in the threespine stickleback [13,44]. Eggs are rich in protein and fat and match the nutritional requirements of species, presumably restoring the female energy balance after spawning effectively [45]. Stickleback males have been known to prey on eggs while removing the undeveloped ones [45,46], with the intent of sustaining themselves while they guard the nest. It is also plausible that switching from water column planktonic to bottom benthic feeding in the middle of the spawning period is a result of foraging by both males and females around the nests. Finally, benthic organisms are larger than planktonic and thus are expected to provide more energy per individual consumed [47]. In general, feeding intensity did not differ between males and females in the first weeks of spawning, yet at the end of the season feeding intensity in females was more intensive than in males. Additionally, males did not show remarkable differences in feeding intensity throughout the season. Feeding intensity in females was higher due to higher consumption of eggs and not because of higher variable diet. In two sites, KOL and SSS, an increase in feeding intensity was also a result of consuming larvae and pupae of chironomids and polychaetes.
Enrichment of δ13C in sticklebacks is presumed to be associated with greater foraging in the intertidal rather than limnetic habitats [48,49]. Following this assumption, we can assume that both males and females shifted their feeding depending on the spawning period and site. Firstly, at the end of the spawning period, fish slowly switched feeding behavior from benthic to planktonic feeding. Secondly, the significant difference of δ13C between sites indicates that sources of organic matter in SEL and KOL during the start of spawning are different, where the intertidal type of organic matter prevails within the lagoon and pelagic—in the inlet. Fish from KOL and SEL demonstrated a more benthic type of foraging in the middle of the spawning period, while fish from SSS still demonstrated a more pelagic isotopic signature. By the end of spawning, fish from all sites demonstrated an intertidal type of organic matter supply. Comparatively, the data from the Baltic Sea demonstrated that pelagic carbon is a fundamental resource for sticklebacks from coastal spawning grounds [21].
Our data indicate that isotope signatures of threespine stickleback change during migrations from the pelagic to inshore communities. It is presumed that isotope signatures change quite slowly due to the change in diet. While most of the isotope studies were focused on the static description of diet, several studies demonstrated that isotope signatures of migratory marine species vary during the season depending on the foraging area [50,51]. δ15N in females varied greatly compared to males (12.4–13.1 and 12.8–13.2, respectively). This indicates that the diet of females is more variable due to their higher foraging activity during the spawning period [52]. On the contrary, no sex-biased differences in δ13C concentration were found, which can be a consequence of overlapping between foraging habitats of male and female sticklebacks [49], although many researchers reported a higher proportion of benthic organisms in the male diet, which is associated with their sexual dimorphism [53,54,55,56,57].
In our study, the isotope trophic positions of sticklebacks and stickleback eggs were highest (between 5.04 and 5.33 for fish and 5.20 for eggs). On the contrary, the trophic positions of amphipods (2.66) and gastropods (2.65) were the lowest among all organisms studied. Similar values of trophic positions of fish were previously obtained during the summer season in the northern Barents Sea [58]. However, the trophic position of fish from that study (from 3.3 to 4.4) did not correspond to our observations but were comparable to expected (3.8–4.4). Herring is the direct stickleback food competitor [59], and its trophic position in the Barents Sea was 3.4 [58]. The trophic position of threespine stickleback in Canadian lakes (3.7) was previously shown to be similar to other predatory fish (3.5 to 3.7), while the trophic positions of Clupeids (alewife) and Salmonids (whitefish—3.2) varied between 3.0 and 3.5 [25]. The authors also mentioned that all predatory fish demonstrated high variability of trophic positions or even several trophic levels. This variability was explained by the opportunistic feeding of fish depending on the availability of putative prey organisms [25].
Our data show that the trophic position of threespine stickleback may vary between sexes and spawning periods. Site and period significantly affected δ13C signature, but the differences were observed in females only, as the diet of males was relatively similar during the season. In both sexes, TP was lowest at the end of the spawning season, probably due to a shift from benthic to plankton feeding. The latter caused a decrease in δ13C values. These changes were clearly traced using stable isotope analysis. Before the spawning, the diet of both sexes almost completely consisted of zooplankton and other pelagic prey [52]. During the spawning period, males occupied higher trophic position than females. According to the IRI index, males prefer stickleback eggs, and their diet also includes significant quantities of other prey sources only in specific sites. Male sticklebacks are known to guard nests and due to decreased home range thus have less access to various prey items. On the contrary, females forage over larger distances in the area after spawning [52]. Our results correspond with other authors. For example, Reimchen et al. (2016) [49] has shown that male sticklebacks inhabiting streams and lakes in Western Canada also had a higher trophic position than females in each locality. According to the authors, this dietary shift in males could emerge when pre-reproductive males shift from an offshore pelagic niche to an inshore littoral niche. Thus, our data differ from previous experiments that did not confirm the possibility that isotope analysis could indicate a seasonal change in the stickleback diet [60].
Comparison between stomach content and stable isotopes using Bayesian mixing models implemented in MixSIAR confirmed the initial assumption that the most important food source of adult sticklebacks during the whole spawning period were stickleback eggs (56–99% for females and 99% for males). According to the model, the predicted proportion of prey sources differed from the observed, and this deviation was mostly found in the diet of females. While females increased their consumption of benthic organisms during the season, the male stickleback diet did not change during the season. The Bayesian mixing model can generate an overestimation of prey items’ role in fish diet due to the data generalization [60]. In our study, the diet of sticklebacks in at least one of the inshore sites altered from others, especially in the proportion of eggs in the diet. On the other hand, the Bayesian mixing model can be a tool illustrating an average or theoretical structure of the diet, and cannot reveal slight differences between the diet of organisms from adjacent areas or internal variability within one area, what is considered to be for the usual stable isotope analysis [49]. According to Vander Zanden and Rasmussen (1996) [25], stomach contents are only a “snapshot of the fish diet”. Thus, it would be redundant to repeat the results obtained during traditional data processing. Estimates of the dietary trophic position require assumptions about the trophic position of prey items, which can be an additional source of errors [24]. Prey organisms also can take remarkably variable trophic positions [25]. The accuracy of mixing models also depends on whether diet tissue discrimination factors for a species are appropriate [60,61,62]. In turn, trophic discrimination factor (TDF) values are influenced by phylogeny, tissue type, the diet of the consumer, isotopic signature of food source, and the error associated with the measurement of TDF within a species [60]. Nevertheless, the application of the Bayesian mixing model generally confirmed initial expectations of diet variability in sticklebacks during the spawning season and variation in dietary habits between males and females.

5. Conclusions

Using a combination of stable isotope analysis and stomach content analysis we demonstrate that dietary preferences of threespine stickleback Gasterosteus aculeatus in the White Sea change at least seasonally between planktonic and benthic feeding during the species’ life history. G. aculeatus is a widespread boreal fish species that experience global population expansion in recent decades [13,63]. As migratory fish, sticklebacks are supposed to transfer energy between offshore and inshore communities and serve as indicators of long-term changes in both coastal and open-sea ecosystems. In the White Sea, G. aculeatus spend most of their time between autumn and late spring in offshore areas consuming planktonic species. This was clearly observed at the time of stickleback arrival at the spawning sites in the inshore areas of the Keret Archipelago. While the range and abundance of stickleback are currently increasing, the summer survival of this species mostly depends on itself during the spawning season. During the summer, both males and females prefer to consume stickleback eggs, but females also forage for twenty benthic taxa. On the contrary, males spend most of their time guarding the nest and thus their diet is less variable. At the end of the spawning period, sticklebacks undergo a backward switch from benthic to planktonic feeding. Our study also demonstrates that stable isotope signatures (δ13C and δ15N) remarkably change during the spawning season, being a reliable indicator of diet preferences of this fish species in line with recent studies involving the approach of analyzing the diet using DNA metabarcoding [40].

Author Contributions

Conceptualization, methodology, writing—original draft preparation, A.S.G.-Y.; sampling, N.V.P., M.V.I. and T.S.I.; laboratory analysis, A.S.G.-Y. and A.V.T.; data analysis, A.S.G.-Y. and E.V.N.; writing—review and editing, E.A.G.-Y., D.L.L. and M.V.I.; funding acquisition, M.V.I., A.S.G.-Y. and E.A.G.-Y. All authors have read and agreed to the published version of the manuscript.

Funding

This research was funded by Russian Science Foundation, (project No. RSF 22-24-00956).

Institutional Review Board Statement

Not applicable.

Data Availability Statement

Not applicable.

Acknowledgments

Authors would like to thank the staff of the Education and Research station “Belomorskaya” of Saint Petersburg State University and our colleagues at the Department of ichthyology and hydrobiology of Saint Petersburg State University for their support and collaboration.

Conflicts of Interest

The authors declare no conflict of interest. The funders had no role in the design of the study; in the collection, analyses, or interpretation of data; in the writing of the manuscript; or in the decision to publish the results.

References

  1. IPCC. Special Report on the Ocean and Cryosphere in a Changing Climate; Pörtner, H.-O., Roberts, D.C., Masson-Delmotte, V., Zhai, P., Tignor, M., Poloczanska, E., Mintenbeck, K., Nicolai, M., Okem, A., Petzold, J., et al., Eds.; Cambridge University Press: New York, NY, USA, 2019; pp. 1–755.
  2. Steffen, W.; Rockström, J.; Richardson, K.; Lenton, T.M.; Folke, C.; Liverman, D.; Summerhayes, C.P.; Barnosky, A.D.; Cornell, S.E.; Crucifix, M.; et al. Trajectories of the Earth System in the Anthropocene. Proc. Natl. Acad. Sci. USA 2018, 115, 8252–8259. [Google Scholar] [CrossRef] [PubMed] [Green Version]
  3. Cusa, M.; Berge, J.; Varpe, Ø. Seasonal Shifts in Feeding Patterns: Individual and Population Realized Specialization in a High Arctic Fish. Ecol. Evol. 2019, 9, 11112–11121. [Google Scholar] [CrossRef] [PubMed] [Green Version]
  4. Fossheim, M.; Primicerio, R.; Johannesen, E.; Ingvaldsen, R.B.; Aschan, M.M.; Dolgov, A.V. Recent Warming Leads to a Rapid Borealization of Fish Communities in the Arctic. Nat. Clim. Chang. 2015, 5, 673–677. [Google Scholar] [CrossRef]
  5. Filatov, N.; Pozdnyakov, D.; Johannessen, O.M.; Pettersson, L.H.; Bobylev, L.P. White Sea: Its Marine Environment and Ecosystem Dynamics Influenced by Global Change; Springer Science & Business Media: New York, NY, USA, 2007. [Google Scholar]
  6. Lajus, D.L.; Dmitrieva, Z.V.; Kraikovski, A.V.; Lajus, J.A.; Alexandrov, D.A. Atlantic Salmon Fisheries in the White and Barents Sea Basins: Dynamic of Catches in the 17–18th Century and Comparison with 19–20th Century Data. Fish. Res. 2007, 87, 240–254. [Google Scholar] [CrossRef]
  7. Studenov, I.; Chupov, D.; Ustyuzhinskiy, G.; Tortsev, A. Results of atlantic salmon investigations in northern dvina river during fishing for research purposes. Fisheries 2020, 2020, 64–70. [Google Scholar] [CrossRef]
  8. Lajus, D.L.; Alekseeva, Y.I.; Lajus, J.A. Herring Fisheries in the White Sea in the 18th-Beginning of the 20th Centuries: Spatial and Temporal Patterns and Factors Affecting the Catch Fluctuations. Fish. Res. 2007, 87, 255–259. [Google Scholar] [CrossRef]
  9. Yershov, P.; Sukhotin, A. Age and Growth of Marine Three-Spined Stickleback in the White Sea 50 Years after a Population Collapse. Polar Biol. 2015, 38, 1813–1823. [Google Scholar] [CrossRef]
  10. Yurtseva, A.; Noreikiene, K.; Lajus, D.; Li, Z.; Alapassi, T.; Ivanova, T.; Ivanov, M.; Golovin, P.; Vesala, S.; Merilä, J. Aging Three-Spined Sticklebacks Gasterosteus Aculeatus: Comparison of Estimates from Three Structures. J. Fish Biol. 2019, 95, 802–811. [Google Scholar] [CrossRef]
  11. Ivanova, T.S.; Ivanov, M.V.; Golovin, P.V.; Polyakova, N.V.; Lajus, D.L. The White Sea Threespine Stickleback Population: Spawning Habitats, Mortality, and Abundance. Evol. Ecol. Res. 2016, 17, 301–315. [Google Scholar]
  12. Murzina, S.A.; Nefedova, Z.A.; Pekkoeva, S.N.; Lajus, D.L.; Nemova, N.N. Fatty Acids of the Three-Spined Stickleback (Gasterosteus Aculeatus L.) from the White Sea. Appl. Biochem. Microbiol. 2019, 55, 73–77. [Google Scholar] [CrossRef]
  13. Lajus, D.L.; Golovin, P.V.; Zelenskaia, A.E.; Demchuk, A.S.; Dorgham, A.S.; Ivanov, M.V.; Ivanova, T.S.; Murzina, S.A.; Polyakova, N.V.; Rybkina, E.V.; et al. Threespine Stickleback of the White Sea: Population Characteristics and Role in the Ecosystem. Contemp. Probl. Ecol. 2020, 13, 132–145. [Google Scholar] [CrossRef]
  14. Lajus, D.; Ivanova, T.; Rybkina, E.; Lajus, J.; Ivanov, M. Multidecadal Fluctuations of Threespine Stickleback in the White Sea and Their Correlation with Temperature. ICES J. Mar. Sci. 2021, 78, 653–665. [Google Scholar] [CrossRef]
  15. Cury, P.; Bakun, A.; Crawford, R.J.M.; Jarre, A.; Quiñones, R.A.; Shannon, L.J.; Verheye, H.M. Small Pelagics in Upwelling Systems: Patterns of Interaction and Structural Changes in “wasp-Waist” Ecosystems. ICES J. Mar. Sci. 2000, 57, 603–618. [Google Scholar] [CrossRef]
  16. Bakhvalova, A.E.; Ivanova, T.S.; Ivanov, M.V.; Demchuk, A.S.; Movchan, E.A.; Lajus, D.L. Long-Term Changes in the Role of Threespine Stickleback (Gasterosteus Aculeatus) in the White Sea: Predatory Fish Consumption Reflects Fluctuating Stickleback Abundance during the Last Century. Evol. Ecol. Res. 2016, 17, 317–334. [Google Scholar]
  17. Demchuk, A.; Ivanov, M.; Ivanova, T.; Polyakova, N.; Mas-Martí, E.; Lajus, D. Feeding Patterns in Seagrass Beds of Three-Spined Stickleback Gasterosteus Aculeatus Juveniles at Different Growth Stages. J. Mar. Biol. Assoc. UK 2015, 95, 1635–1643. [Google Scholar] [CrossRef]
  18. Fry, B. Food Web Structure on Georges Bank from Stable C, N, and S Isotopic Compositions. Limnol. Oceanogr. 1988, 33, 1182–1190. [Google Scholar] [CrossRef]
  19. Zanden, M.J.V.; Rasmussen, J.B. Primary Consumer δ13 C and δ15 N and the Trophic Position of Aquatic Consumers. Ecology 1999, 80, 1395–1404. [Google Scholar] [CrossRef]
  20. Post, D.M. Using Stable Isotopes to Estimate Trophic Position: Models, Methods, and Assumptions. Ecology 2002, 83, 703–718. [Google Scholar] [CrossRef]
  21. Golubkov, S.M.; Berezina, N.A.; Gubelit, Y.I.; Demchuk, A.S.; Golubkov, M.S.; Tiunov, A.V. A Relative Contribution of Carbon from Green Tide Algae Cladophora Glomerata and Ulva Intestinalis in the Coastal Food Webs in the Neva Estuary (Baltic Sea). Mar. Pollut. Bull. 2018, 126, 43–50. [Google Scholar] [CrossRef]
  22. Croizier, G.L.; Schaal, G.; Point, D.; Loc’h, F.L.; Machu, E.; Fall, M.; Munaron, J.-M.; Boyé, A.; Walter, P.; Laë, R. Stable Isotope Analyses Revealed the Influence of Foraging Habitat on Mercury Accumulation in Tropical Coastal Marine Fish. Sci. Total Environ. 2019, 650, 2129–2140. [Google Scholar] [CrossRef] [Green Version]
  23. Costalago, D.; Forster, I.; Nemcek, N.; Neville, C.; Perry, R.I.; Young, K.; Hunt, B.P.V. Seasonal and Spatial Dynamics of the Planktonic Trophic Biomarkers in the Strait of Georgia (Northeast Pacific) and Implications for Fish. Sci. Rep. 2020, 10, 8517. [Google Scholar] [CrossRef]
  24. Zanden, M.J.V.; Cabana, G.; Rasmussen, J.B. Comparing Trophic Position of Freshwater Fish Calculated Using Stable Nitrogen Isotope Ratios (Δ15N) and Literature Dietary Data. Can. J. Fish. Aquat. Sci. 1997, 54, 1142–1158. [Google Scholar] [CrossRef]
  25. Zanden, M.J.V.; Rasmussen, J.B. A Trophic Position Model of Pelagic Food Webs: Impact on Contaminant Bioaccumulation in Lake Trout. Ecol. Monogr. 1996, 66, 451–477. [Google Scholar] [CrossRef]
  26. Ravinet, M.; Ishikawa, A.; Kitano, J. Trophic Niche Differentiation and Phenotypic Divergence among Cryptic Species of Japanese Ninespine Sticklebacks. Evol. Ecol. Res. 2016, 17, 505–523. [Google Scholar]
  27. Golovin, P.V.; Bakhvalova, A.E.; Ivanov, M.V.; Ivanova, T.S.; Smirnova, K.A.; Lajus, D.L. Sex-Biased Mortality of Marine Threespine Stickleback (Gasterosteus Aculeatus L.) during Their Spawning Period in the White Sea. Evol. Ecol. Res. 2019, 20, 279–295. [Google Scholar]
  28. Ivanova, T.S.; Ivanov, M.V.; Bakhvalova, A.E.; Polyakova, N.V.; Golovin, P.V.; Kucheryavyy, A.V.; Yurtseva, A.O.; Smirnova, K.A.; Lajus, D.L. Homing Ability and Site Fidelity of Marine Threespine Stickleback on Spawning Grounds. Evol. Ecol. Res. 2019, 20, 297–315. [Google Scholar]
  29. Chislenko, L.L. Nomograms for Determining the Weight of Aquatic Organisms by Body Size and Form (Sea Mesobenthos and Plankton); Nauka: Moscow, Russia, 1968. [Google Scholar]
  30. Alimov, A.F.; Bogatov, V.V.; Golubkov, S.M. Production Hydrobiology; Nauka: Moscow, Russia, 2013. [Google Scholar]
  31. Pertzova, N.M. Average Mass and Sizes of Abundant Zooplankton Species in the White Sea. Oceanology 1967, 7, 309–313. [Google Scholar]
  32. Keough, J.R.; Sierszen, M.E.; Hagley, C.A. Analysis of a Lake Superior Coastal Food Web with Stable Isotope Techniques. Limnol. Oceanogr. 1996, 41, 136–146. [Google Scholar] [CrossRef]
  33. Hyslop, E.J. Stomach Contents Analysis—A Review of Methods and Their Application. J. Fish Biol. 1980, 17, 411–429. [Google Scholar] [CrossRef] [Green Version]
  34. Pinkas, L.; Olipham, M.S.; Iverson, I.L.K. Food Habits of Albacore; Bluef in Tuna and Bonito in Californian Waters. Calif. Fish Game 1971, 152, 1–105. [Google Scholar]
  35. Jost, L. Entropy and Diversity. Oikos 2006, 113, 363–375. [Google Scholar] [CrossRef]
  36. Hureau, J.-C. Biologie Cornparee de Quelques Poissons Antarctiques (Nototheniidae). Bull. L’inst. Oc’Enograph. Monaco 1969, 68, 1–244. [Google Scholar]
  37. Nilsen, M.; Pedersen, T.; Nilssen, E.M.; Fredriksen, S. Trophic studies in a high-latitude fjord ecosystem—A comparison of stable isotope analyses (δ13C and δ15N) and trophic-level estimates from a mass-balance model. Can. J. Fish. Aquat. Sci. 2008, 65, 2791–2806. [Google Scholar] [CrossRef]
  38. Stock, B.C.; Jackson, A.L.; Ward, E.J.; Parnell, A.C.; Phillips, D.L.; Semmens, B.X. Analyzing Mixing Systems Using a New Generation of Bayesian Tracer Mixing Models. PeerJ 2018, 6, e5096. [Google Scholar] [CrossRef]
  39. Britton, J.R.; Busst, G.M.A. Stable Isotope Discrimination Factors of Omnivorous Fishes: Influence of Tissue Type, Temperature, Diet Composition and Formulated Feeds. Hydrobiologia 2018, 808, 219–234. [Google Scholar] [CrossRef] [Green Version]
  40. Jakubavičiute, E.; Bergström, U.; Eklöf, J.S.; Haenel, Q.; Bourlat, S.J. DNA Metabarcoding Reveals Diverse Diet of the Three-Spined Stickleback in a Coastal Ecosystem. PLoS ONE 2017, 12, e0186929. [Google Scholar] [CrossRef] [Green Version]
  41. Snowberg, L.K.; Bolnick, D.I. Assortative Mating by Diet in a Phenotypically Unimodal but Ecologically Variable Population of Stickleback. Am. Nat. 2008, 172, 733–739. [Google Scholar] [CrossRef] [Green Version]
  42. Bolnick, D.I.; Snowberg, L.K.; Hirsch, P.E.; Lauber, C.L.; Knight, R.; Caporaso, J.G.; Svanbäck, R. Individuals’ Diet Diversity Influences Gut Microbial Diversity in Two Freshwater Fish (Threespine Stickleback and Eurasian Perch). Ecol. Lett. 2014, 17, 979–987. [Google Scholar] [CrossRef]
  43. Rybkina, E.V.; Demchuk, A.S.; Lajus, D.L.; Ivanova, T.S.; Ivanov, M.V.; Galaktionov, K.V. Dynamics of Parasite Community during Early Ontogenesis of Marine Threespine Stickleback, Gasterosteus Aculeatus. Evol. Ecol. Res. 2016, 17, 335–354. [Google Scholar]
  44. Whoriskey, F.G.; FitzGerald, G.J. Sex, Cannibalism and Sticklebacks. Behav. Ecol. Sociobiol. 1985, 18, 15–18. [Google Scholar] [CrossRef]
  45. Rohwer, S. Parent Cannibalism of Offspring and Egg Raiding as a Courtship Strategy. Am. Nat. 1978, 112, 429–440. [Google Scholar] [CrossRef]
  46. Mehlis, M.; Bakker, T.C.M.; Frommen, J.G. Nutritional Benefits of Filial Cannibalism in Three-Spined Sticklebacks (Gasterosteus aculeatus). Naturwissenschaften 2009, 96, 399–403. [Google Scholar] [CrossRef]
  47. Vadeboncoeur, Y.; Zanden, M.J.V.; Lodge, D.M. Putting the Lake Back Together: Reintegrating Benthic Pathways into Lake Food Web Models: Lake Ecologists Tend to Focus Their Research on Pelagic Energy Pathways, but, from Algae to Fish, Benthic Organisms Form an Integral Part of Lake Food Webs. BioScience 2002, 52, 44–54. [Google Scholar] [CrossRef] [Green Version]
  48. Kainz, M.J.; Hager, H.H.; Rasconi, S.; Kahilainen, K.K.; Amundsen, P.-A.; Hayden, B. Polyunsaturated Fatty Acids in Fishes Increase with Total Lipids Irrespective of Feeding Sources and Trophic Position. Ecosphere 2017, 8, e01753. [Google Scholar] [CrossRef]
  49. Reimchen, T.E.; Steeves, D.; Bergstrom, C.A. Sex Matters for Defence and Trophic Traits of Threespine Stickleback. Evol. Ecol. Res. 2016, 17, 459–485. [Google Scholar]
  50. MacNeil, M.; Skomal, G.; Fisk, A. Stable Isotopes from Multiple Tissues Reveal Diet Switching in Sharks. Mar. Ecol. Prog. Ser. 2005, 302, 199–206. [Google Scholar] [CrossRef] [Green Version]
  51. Richert, J.E.; Galván-Magaña, F.; Klimley, A.P. Interpreting Nitrogen Stable Isotopes in the Study of Migratory Fishes in Marine Ecosystems. Mar. Biol. 2015, 162, 1099–1110. [Google Scholar] [CrossRef]
  52. Demchuk, A.S.; Ivanov, M.V.; Ivanova, T.S.; Polyakova, N.V.; Golovin, P.V.; Lajus, D.L. Feeding of the threespine stickleback Gasterosteus aculeatus (Linnaeus, 1758) in spawning grounds. Tr. KNC RAN 2018, 4, 42–58. [Google Scholar] [CrossRef] [Green Version]
  53. Bentzen, P.; McPhail, J.D. Ecology and Evolution of Sympatric Sticklebacks (Gasterosteus): Specialization for Alternative Trophic Niches in the Enos Lake Species Pair. Can. J. Zool. 1984, 62, 2280–2286. [Google Scholar] [CrossRef]
  54. Kristjánsson, B.K.; Skúlason, S.; Noakes, D.L. Rapid Divergence in a Recently Isolated Population of Threespine Stickleback (Gasterosteus Aculeatus L.). Evol. Ecol. Res. 2002, 4, 659–672. [Google Scholar]
  55. Reimchen, T.E.; Nosil, P. Replicated Ecological Landscapes and the Evolution of Morphological Diversity among Gasterosteus Populations from an Archipelago on the West Coast of Canada. Can. J. Zool. 2006, 84, 643–654. [Google Scholar] [CrossRef]
  56. Kitano, J.; Mori, S.; Peichel, C.L. Sexual Dimorphism in the External Morphology of the Threespine Stickleback (Gasterosteus Aculeatus). Copeia 2007, 2007, 336–349. [Google Scholar] [CrossRef]
  57. Spoljaric, M.A.; Reimchen, T.E. Habitat-Dependent Reduction of Sexual Dimorphism in Geometric Body Shape of Haida Gwaii Threespine Stickleback: Reduction in sexual dimorphism in stickleback. Biol. J. Linn. Soc. 2008, 95, 505–516. [Google Scholar] [CrossRef] [Green Version]
  58. Tamelander, T.; Renaud, P.E.; Hop, H.; Carroll, M.L.; Ambrose, W.G., Jr.; Hobson, K.A. Trophic Relationships and Pelagic–Benthic Coupling during Summer in the Barents Sea Marginal Ice Zone, Revealed by Stable Carbon and Nitrogen Isotope Measurements. Mar. Ecol. Prog. Ser. 2006, 310, 33–46. [Google Scholar] [CrossRef]
  59. Peltonen, H.; Vinni, M.; Lappalainen, A.; Pönni, J. Spatial Feeding Patterns of Herring (Clupea Harengus L.), Sprat (Sprattus Sprattus L.), and the Three-Spined Stickleback (Gasterosteus aculeatus L.) in the Gulf of Finland, Baltic Sea. ICES J. Mar. Sci. 2004, 61, 966–971. [Google Scholar] [CrossRef]
  60. Grey, J. Trophic Fractionation and the Effects of Diet Switch on the Carbon Stable Isotopic ‘Signatures’ of Pelagic Consumers. Int. Ver. Für. Theor. Angew. Limnol. Verh. 2000, 27, 3187–3191. [Google Scholar] [CrossRef]
  61. Healy, K.; Kelly, S.B.A.; Guillerme, T.; Inger, R.; Bearhop, S.; Jackson, A.L. Predicting Trophic Discrimination Factor Using Bayesian Inference and Phylogenetic, Ecological and Physiological Data. DEsIR: Discrimination Estimation in R. PeerJ Preprints 2017, 1–21. [Google Scholar] [CrossRef]
  62. Brush, J.M.; Fisk, A.T.; Hussey, N.E.; Johnson, T.B. Spatial and Seasonal Variability in the Diet of Round Goby (Neogobius melanostomus): Stable Isotopes Indicate That Stomach Contents Overestimate the Importance of Dreissenids. Can. J. Fish. Aquat. Sci. 2012, 69, 573–586. [Google Scholar] [CrossRef]
  63. Beltran, R.S.; Peterson, S.H.; McHuron, E.A.; Reichmuth, C.; Hückstädt, L.A.; Costa, D.P. Seals and Sea Lions Are What They Eat, plus What? Determination of Trophic Discrimination Factors for Seven Pinniped Species. Rapid Commun. Mass Spectrom. 2016, 30, 1115–1122. [Google Scholar] [CrossRef]
Figure 1. The study area.
Diversity 14 00955 g001
Figure 2. Feeding intensity of threespine stickleback during the spawning season. The Y-axis represents stomach fullness index FI (‱). The dots and bars represent the sample means and standard errors (SE).
Diversity 14 00955 g002
Figure 3. Stomach contents of female (F) and male (M) threespine stickleback at the offshore site CIE at the beginning of spawning period.
Diversity 14 00955 g003
Figure 4. Mean (±SE) stable isotope values of carbon δ13C and nitrogen δ15N of male and female sticklebacks during three periods of spawning season. See Figure 1 for site description.
Diversity 14 00955 g004
Figure 5. Mean (±SE) stable isotope values of carbon δ13C and nitrogen δ15N content (left column) and stomach contents (right column) of stickleback and their prey items during the spawning period (beginning, middle, and end) at Seldianaya Inlet (SLD), Koliushkovaya Lagoon (KOL), Sukhaya Salma Strait (SSS) in 2016.
Diversity 14 00955 g005
Table 1. Characteristics of abiotic and biotic conditions of the inshore sampling sites (see text for references).
VariableSeldianaya Inlet (SLD)Koliushkovaya
Lagoon (KOL)
Sukhaya Salma Strait (SSS)
Geographical coordinates66.33822° N, 33.62149° E66.31307° N, 33.64644° E66.31208° N, 33.65021° E
General descriptionTriangular inlet 120 × 240 m with wide entrance and shallow top. Average depth is 3.0 mIsolated lagoon 200 × 540 m with average depth 1.5 mOpen strait with slope 6–8 cm/m in the study area
Tide amplitude, mUp to 2.5Up to 0.3Up to 2.5
Surface water temperature at sampling in 201612 °C (May)–20 °C (July)14 °C (May)–22 °C (July)12 °C (May)–20 °C (July)
Surface salinity at sampling in 201623 ppt (May)–24 ppt (July) 15 ppt (May)–15 ppt (July)21 ppt (May)–19 ppt (July)
Bottom typeStony littoral and muddy sublittoral zonesMuddy littoral and sublittoral zonesStony littoral and muddy and sandy sublittoral zones
Aquatic vegetationFucoids in the littoral zone, dense eelgrass Zostera marina beds with dry biomass 1 kg/m2 and projective cover—up to 100%Eelgrass beds near the sea entrance with dry biomass up to 0.1 kg/m2 and projective cover up to 30%, filamentous algaeFucoids in the littoral, eelgrass with dry biomass up to 0.003 kg/m2 in sublittoral zone
Table 2. Stomach contents (IRI, %) of females (F) and males (M) at the offshore and inshore sites.
TaxaOffshore SiteInshore Sites
IRI, % (F)IRI, % (M)IRI, % (F)IRI, % (M)
Diatomeae gen. sp.3.20.31.50.0
Calanus glacialis20.761.6--
Oithona similis2.50.2--
Pseudocalanus sp.9.319.7--
Copepoditii Copepoda16.03.0--
Euphauseacea gen. sp.33.99.5--
Gastropoda varia0.00.25.80.5
Polychaeta varia0.00.06.51.7
Amphipoda varia0.50.01.70.5
Chironomidae varia--8.04.2
Diptera (imago)1.11.01.81.8
Gasterosteus aculeatus eggs--67.882.0
Other planktonic food prey12.73.45.69.3
Other benthic food prey0.01.00.40.01
Table 3. Values and ranges of δ13C and δ15N and trophic position (TP, mean ± SE) in males, females, and eggs of Gasterosteus aculeatus.
Sex and
Spawning Period
nδ13Cδ15NδC13 RangeδN15 RangeTP
Observed
TP
Expected
Threespine stickleback Gasterosteus aculeatus
Females, beginning15−22.15 ± 0.10112.58 ± 0.140−22.76 to −21.5111.19 to 13.245.22 ± 0.0444.2
Females, middle15−21.02 ± 0.10813.02 ± 0.087−21.57 to −20.3312.41 to 13.655.32 ± 0.0274.2
Females, end15−20.16 ± 0.11112.56 ± 0.135−20.75 to -19.3411.53 to 13.595.04 ± 0.0423.8
Males, beginning15−22.05 ± 0.27212.96 ± 0.138−25.48 to −21.2612.07 to 13.85.34 ± 0.0434.4
Males, middle15−21.24 ± 0.13113.05 ± 0.117−22.1 to −20.6412.11 to 13.755.33 ± 0.0374.1
Males, end15−20.55 ± 0.05213.09 ± 0.118−20.85 to −20.0712.11 to 13.825.21 ± 0.0374.2
Stickleback eggs3−22.45 ± 0.31512.63 ± 0.104−22.81 to −21.9512.47 to 12.755.2 ± 0.033
Prey organism
Amphipoda15−16.98 ± 0.2494.86 ± 0.451−18.93 to −15.672.4 to 8.612.66 ± 0.124
Chironomidae21−18.47 ± 0.2174.96 ± 0.421−20.12 to −15.792.27 to 6.882.73 ± 0.125
Gastropoda12−15.06 ± 0.3414.91 ± 0.31−16.97 to −13.213.2 to 6.132.65 ± 0.095
Isopoda3−16.27 ± 0.1665.76 ± 0.177−16.49 to −16.035.6 to 6.052.86 ± 0.052
Oligochaeta3−19.01 ± 0.367.56 ± 0.214−19.52 to −18.517.31 to 7.93.56 ± 0.063
Polychaeta5−16.48 ± 0.648.3 ± 0.14−18.11 to −15.718.12 to 8.653.2 ± 0.567
Plankton22−22.22 ± 0.3737.26 ± 0.394−24.64 to −16.655.36 to 12.143.39 ± 0.114
Table 4. p-values resulted from three-way ANOVA (sex, period, site) for δ13C, δ15N and observed trophic position (TP) (significant values are marked in bold).
VariablesFactor
SexPeriodSite
δ13C0.12<0.010.03
δ15N<0.010.070.79
TP<0.01<0.010.86
Table 5. Predicted diet composition of threespine stickleback (%) in different stages of spawning period based on Bayesian mixing model performed with MixSIAR package in R. Range from 2.5% and 97.5% quantiles is in numerator, mean value is in denominator. Prey items with the highest contribution are marked in bold.
DietFemaleMale
BeginningMiddleEndBeginningMiddleEnd
Amphipoda<0.01–0.01
0.001
<0.01–<0.01
<0.001
<0.01–0.03
0.005

<0.01–<0.01
<0.001

Chironomidae<0.01–0.01
0.001
<0.01–<0.01
<0.001
<0.01–0.57
0.164
<0.01–<0.01
<0.001
<0.01–<0.01
<0.001
<0.01–<0.01
<0.001
Stickleback eggs0.97–1.00
0.994
0.80–1.00
0.948
<0.01–1.00
0.563
0.99–1.00
0.999
0.87–1.00
0.985
0.99–1.00
0.999
Gastropoda<0.01–0.01
0.001
<0.01–<0.01
<0.001
<0.01–0.01
0.001
<0.01–<0.01
<0.001
<0.01–<0.01
<0.001
<0.01–<0.01
<0.001
Isopoda<0.01–0.01
0.001

<0.01–0.07
0.009
<0.01–<0.01
<0.001
<0.01–<0.01
<0.001
<0.01–<0.01
<0.001
Oligochaeta<0.01–0.02
0.002
<0.01–0.03
0.002
<0.01–0.16
0.018
<0.01–<0.01
<0.001
<0.01–<0.01
<0.001
<0.01–<0.01
<0.001
Polychaeta<0.01–0.01
0.001
<0.01–0.17
0.048
<0.01–0.28
0.094
<0.01–<0.01
<0.001
<0.01–0.13
0.014
<0.01–<0.01
<0.001
Mixed zooplankton<0.01–0.01
0.001
<0.01–<0.01
<0.001
<0.01–0.50
0.146
<0.01–<0.01
<0.001
<0.01–<0.01
<0.001
<0.01–<0.01
<0.001
Publisher’s Note: MDPI stays neutral with regard to jurisdictional claims in published maps and institutional affiliations.

