


Long-Term Ringing Data on Migrating Passerines Reveal Overall Avian Decline in Europe


Abstract
1. Introduction
2. Materials and Methods
2.1. Study Area
2.2. Bird-Ringing Database and Species Selection
2.3. Modelling Population Dynamics and Trends
2.4. Recovery Analysis
2.5. Species Traits and Their Association to Population Trends
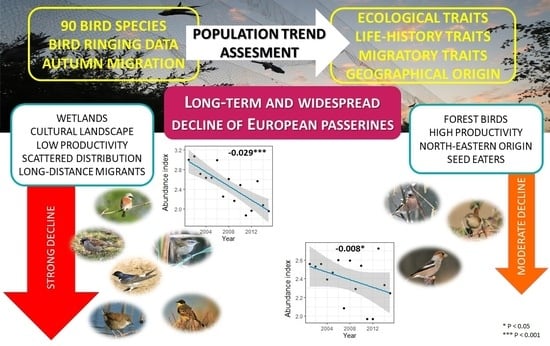
3. Results
3.1. Species Selection
3.2. Population Dynamics and Trends
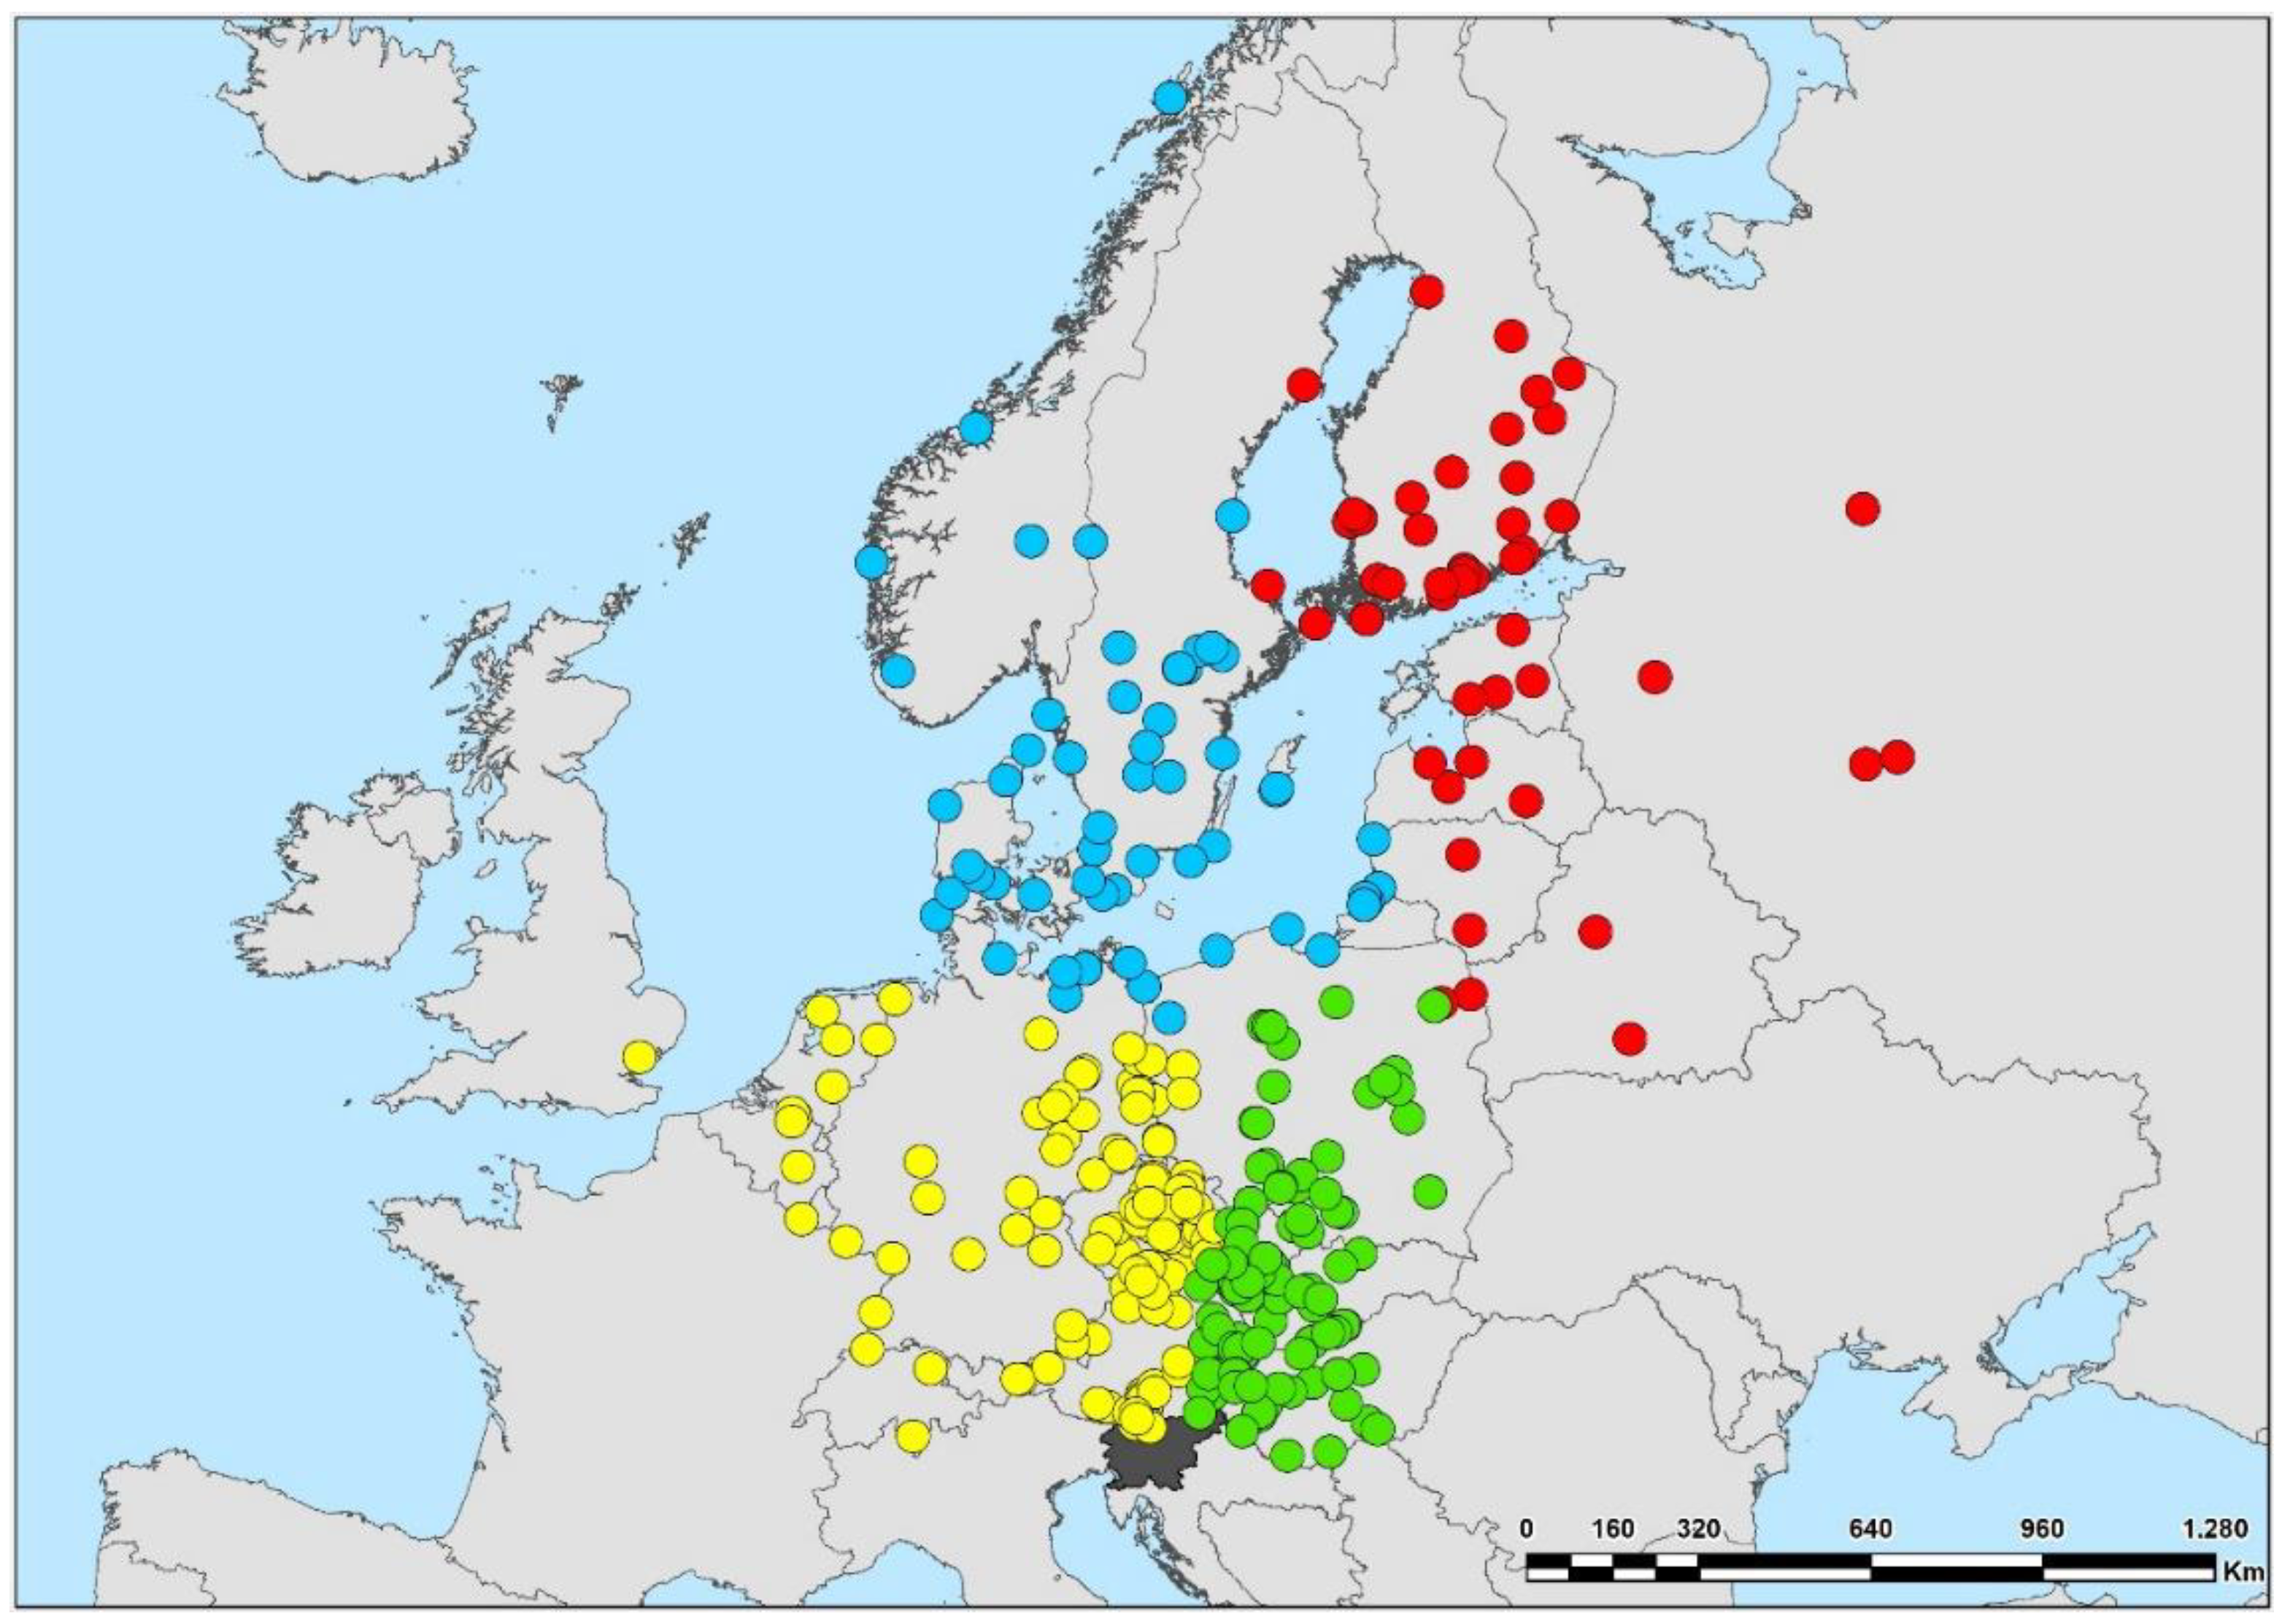
3.3. Species Guilds
3.4. Population Trends within Species Guilds
4. Discussion
4.1. Population Trends of Passerines
4.2. Geographical Origin of Species
4.3. Common Trends in Trait Guilds
5. Conclusions
Supplementary Materials
Author Contributions
Funding
Institutional Review Board Statement
Data Availability Statement
Acknowledgments
Conflicts of Interest
References
- Cardinale, B.; Duffy, J.; Gonzalez, A.; Hooper, D.U.; Perrings, C.; Venail, P.; Narwani, A.; Mace, G.M.; Tilman, D.; Wardle, D.A.; et al. Biodiversity loss and its impact on humanity. Nature 2012, 486, 59–67. [Google Scholar] [CrossRef]
- Hoffmann, M.; Hilton-Taylor, C.; Angulo, A.; Böhm, M.; Brooks, T.M.; Butchart, S.H.M.; Carpenter, K.E.; Chanson, J.; Collen, B.; Cox, N.A.; et al. The impact of conservation on the status of the world’s vertebrates. Science 2010, 330, 1503–1509. [Google Scholar] [CrossRef]
- Rosenberg, K.V.; Dokter, A.M.; Blancher, P.J.; Sauer, J.R.; Smith, A.C.; Smith, P.A.; Stanton, J.C.; Panjabi, A.; Helft, L.; Parr, M.; et al. Decline of the North American avifauna. Science 2019, 365, 120–124. [Google Scholar] [CrossRef] [PubMed]
- Bowler, D.E.; Heldbjerg, H.; Fox, A.D.; de Jong, M.; Bohning-Gaese, K. Long-term declines of European insectivorous bird populations and potential causes. Conserv. Biol. 2019, 33, 1120–1130. [Google Scholar] [CrossRef] [PubMed]
- Burns, F.; Eaton, M.A.; Burfield, I.J.; Klvaňová, A.; Šilarová, E.; Staneva, A.; Gregory, R. Abundance decline in the avifauna of the European Union reveals cross-continental similarities in biodiversity change. Ecol. Evol. 2021, 11, 16647–16660. [Google Scholar] [CrossRef] [PubMed]
- Marsh, D.M.; Trenham, P.C. Tracking current trends in plant and animal population monitoring. Conserv. Biol. 2008, 22, 647–655. [Google Scholar] [CrossRef]
- Jones, J.P.G. Monitoring species abundance and distribution at the landscape scale. J. Appl. Ecol. 2011, 48, 9–13. [Google Scholar] [CrossRef]
- De Barba, M.; Waits, L.P.; Genovesi, P.; Randi, E.; Chirichella, R.; Cetto, E. Comparing opportunistic and systematic sampling methods for non-invasive genetic monitoring of a small translocated brown bear population. J. Appl. Ecol. 2010, 47, 172–181. [Google Scholar] [CrossRef]
- Downes, C.M.; Bart, J.; Collins, B.T.; Craig, B.; Dale, B.; Dunn, E.H.; Francis, C.M.; Woodley, S.; Zorn, P. Bird Conservation Implementation and Integration in the Americas: Proceedings of the Third International Partners in Flight Conference; Ralph, C.J., Rich, T.D., Eds.; Asilomar, Dept. of Agriculture, Forest Service, Pacific Southwest Research Station California: Albany, CA, USA, 2002; pp. 993–996.
- Jäckel, D.; Mortega, K.G.; Sturm, U.; Brockmeyer, U.; Khorramshahi, O.; Voigt-Heucke, S.L. Opportunities and limitations: A comparative analysis of citizen science and expert recordings for bioacoustic research. PLoS ONE 2021, 16, e0253763. [Google Scholar] [CrossRef]
- Legg, C.J.; Nagy, L. Why most conservation monitoring is, but need not be, a waste of time. J. Environ. Manage. 2005, 78, 194–199. [Google Scholar] [CrossRef]
- Boersch-Supan, P.H.; Robinson, R.A. Integrating structured and unstructured citizen science data to improve wildlife population monitoring. bioRxiv 2021. [Google Scholar] [CrossRef]
- Dickinson, J.L.; Zuckerberg, B.; Bonter, D.N. Citizen science as an ecological research tool: Challenges and benefits. Annu. Rev. Ecol. Evol. Syst. 2010, 41, 149–172. [Google Scholar] [CrossRef]
- Kaplan, R.M.; Chambers, D.A.; Glasgow, R.E. Big data and large sample size: A cautionary note on the potential for bias. Clin. Transl. Sci. 2014, 7, 342–346. [Google Scholar] [CrossRef]
- Gregory, R.D.; Gibbons, D.W.; Donald, P.F. Bird Census and Survey Techniques. In Bird Ecology and Conservation: A Handbook of Techniques; Sutherland, W.J., Newton, I., Green, R., Eds.; Oxford University Press: Oxford, UK, 2004; Volume 2, pp. 17–55. [Google Scholar]
- Fink, D.; Auer, T.; Johnston, A.; Ruiz-Gutierrez, V.; Hochachka, W.M.; Kelling, S. Modeling avian full annual cycle distribution and population trends with citizen science data. Ecol. Appl. 2020, 30, e02056. [Google Scholar] [CrossRef] [PubMed]
- Brlík, V.; Šilarová, E.; Škorpilová, J.; Alonso, H.; Anton, M.; Aunins, A.; Benkö, Z.; Biver, G.; Busch, M.; Chodkiewicz, T.; et al. Long-term and large-scale multispecies dataset tracking population changes of common European breeding birds. Sci. Data 2021, 8, 21. [Google Scholar] [CrossRef] [PubMed]
- Díaz, M.; Cuervo, J.J.; Grim, T.; Flensted-Jensen, E.; Ibáñez-Álamo, J.D.; Jokimäki, J.; Markó, G.; Tryjanowski, P.; Møller, A.P. Interactive effects of fearfulness and geographical location on bird population trends. Behav. Ecol. 2015, 26, 716–721. [Google Scholar] [CrossRef]
- Eu-Citizen.Science. Available online: https://eu-citizen.science/projects?keywords=Birds (accessed on 7 June 2022).
- Sauer, J.R.; Link, W.A.; Fallon, J.E.; Pardieck, K.L.; Ziolkowski, D.J. The North American Breeding Bird Survey 1966–2011: Summary Analysis and Species Accounts. N. Am. Fauna 2013, 79, 1–32. [Google Scholar] [CrossRef]
- BirdLife International, IUCN Red List for birds 2020. Available online: http://www.birdlife.org (accessed on 7 February 2020).
- Reif, J. Long-Term Trends in Bird Populations: A Review of Patterns and Potential Drivers in North America and Europe. Acta Ornithol. 2013, 48, 1–16. [Google Scholar] [CrossRef]
- Selstam, G.; Sondell, J.; Olsson, P. Wintering area and migration routes for Ortolan Buntings Emberiza hortulana from Sweden determined with light-geologgers. Ornis Svec. 2015, 25, 3–14. [Google Scholar] [CrossRef]
- Jiguet, F.; Arlettaz, R.; Bauer, H.-G.; Belik, V. An update of the European breeding population sizes and trends of the Ortolan Bunting (Emberiza hortulana). Ornis Fenn. 2016, 93, 186–196. [Google Scholar]
- Jiguet, F.; Robert, A.; Lorrillière, R.; Hobson, K.A.; Kardynal, K.J.; Arlettaz, R.; Bairlein, F.; Belik, V.; Bernardy, P.; Copete, J.L.; et al. Unravelling migration connectivity reveals unsustainable hunting of the declining ortolan bunting. Sci. Adv. 2019, 5, eaau2642. [Google Scholar] [CrossRef] [PubMed]
- Nature, Landscape and Biodiversity. Available online: https://www.clo.nl/en/indicators/en1483-conservation-status-birds-and-habitats-directive (accessed on 30 August 2022).
- Berthold, P.; Fiedler, W. 32-jährige Untersuchung der Bestandsentwicklung mitteleuropäischer Kleinvögel mit Hilfe von Fangzahlen: Überwiegend Bestandsabnahmen. Vogelwarte 2005, 43, 97–102. [Google Scholar]
- Bibby, C.J.; Burgess, N.D.; Hill, D.A. Bird Census Techniques, 1st ed.; Academic Press Limited: London, UK, 1992; p. 257. [Google Scholar]
- Briedis, M.; Keišs, O. Extracting historical population trends using archival ringing data—An example: The globally threatened Aquatic Warbler. J. Ornithol. 2016, 157, 419–425. [Google Scholar] [CrossRef]
- Busse, P. Studies of long-term population dynamics based on ringing data. Ring 1990, 13, 221–234. [Google Scholar]
- Peach, W.J.; Furness, R.W.; Brenchley, A. The use of ringing to monitor changes in the numbers and demography of birds. Ringing Migr. 1999, 19, 57–66. [Google Scholar] [CrossRef][Green Version]
- Petras, T.; Vrezec, A. Modelling population dynamics and trends in migratory birds from non-standardized multi-species ringing data: The potential of multi-model selection. Bird Study 2021, 68, 330–344. [Google Scholar] [CrossRef]
- Rintala, J.; Tiainen, J.; Pakkala, T. Population trends of the Finnish starling Sturnus vulgaris, 1952–1998, as inferred from annual ringing totals. Ann. Zool. Fenn. 2003, 40, 365–385. [Google Scholar]
- Saurola, P.; Francis, C.M. Estimating population dynamics and dispersal distances of owls from nationally coordinated ringing data in Finland. Anim. Biodiv. Conserv. 2004, 27, 403–415. [Google Scholar]
- Payevsky, V.A. Mechanisms of Population Dynamics in Trans-Saharan Migrant Birds: A Review. Entomol. Rev. 2006, 86, 82–94. [Google Scholar] [CrossRef]
- Brown, J.H. On the relationship between abundance and distribution. Am. Nat. 1984, 124, 255–279. [Google Scholar] [CrossRef]
- Araújo, M.B.; Williams, P.H. The Bias of Complementarity Hotspots toward Marginal Populations. Conserv. Biol. 2001, 15, 1710–1720. [Google Scholar] [CrossRef]
- Cuervo, J.J.; Møller, A.P. Temporal variation in population size of European bird species: Effects of latitude and marginality of distribution. PLoS ONE 2013, 8, e77654. [Google Scholar] [CrossRef] [PubMed]
- Tryjanowski, P.; Hartel, T.; Báldi, A.; Szymański, P.; Tobolka, M.; Herzon, I.; Goławski, A.; Konvička, M.; Hromada, M.; Jerzak, L.; et al. Conservation of Farmland Birds Faces Different Challenges in Western and Central-Eastern Europe. Acta Ornithol. 2011, 46, 1–12. [Google Scholar] [CrossRef]
- McComb, B.; Zuzkerberg, B.; Vesely, D.; Jordan, C. Monitoring Animal Populations and Their Habitats, 1st ed.; CRC Press: New York, NY, USA, 2010; p. 298. [Google Scholar]
- Barshep, Y.; Erni, B.; Underhill, L.G.; Altwegg, R. Identifying ecological and life-history drivers of population dynamics of wetland birds in South Africa. Glob. Ecol. Conserv. 2017, 12, 96–107. [Google Scholar] [CrossRef]
- Gregori, J. 80 years of organized bird ringing in Slovenia. Scopolia 2009, 4, 2–16. [Google Scholar]
- Busse, P.; Zaniewicz, G.; Cofta, T. Evolution of the western Palaearctic Passerine migration pattern presentation style. Ring 2014, 36, 3–21. [Google Scholar] [CrossRef]
- Kralj, J.; Radović, D.; Tutiš, V.; Ćiković, D. Migration of central and east European Acrocephalus warblers at the eastern Adriatic coast: An analysis of recoveries. Ring 2007, 29, 121–131. [Google Scholar] [CrossRef]
- Vrezec, A.; Fekonja, D.; Šere, D. Bird ringing in Slovenia in 2012 with an overview of recoveries of birds ringed at home and abroad. Acrocephalus 2014, 35, 25–58. [Google Scholar] [CrossRef]
- Holmes, E.E. Estimating risks in declining populations with poor data. Proc. Natl. Acad. Sci. USA 2001, 98, 5072–5077. [Google Scholar] [CrossRef]
- Freeman, S.N.; Baillie, S.R.; Gregory, R.D. Statistical Analysis of an Indicator of Population Trends in Farmland Birds; British Trust for Ornithology: Norfolk, UK; Royal Society for the Protection of Birds: Bedfordshire, UK, 2001; p. 28. [Google Scholar]
- Nayak, B.K. Understanding the relevance of sample size calculation. Indian J. Ophthalmol. 2010, 58, 469–470. [Google Scholar] [CrossRef]
- Funk, E.R.; Mason, N.A.; Pálsson, S.; Albrecht, T.; Johnson, J.A.; Taylor, S.A. A supergene underlies linked variation in color and morphology in a Holarctic songbird. Nat. Commun. 2021, 12, 6833. [Google Scholar] [CrossRef] [PubMed]
- Craven, P.; Wahba, G. Smoothing Noisy Data with Spline Functions. Numer. Math. 1979, 31, 377–403. [Google Scholar] [CrossRef]
- Hastie, T.; Tibshirani, R. Generalized Additive Models. Stat. Sci. 1986, 1, 297–310. [Google Scholar] [CrossRef]
- Hastie, T. Package ‘Gam’–Generalized Additive Models, Version 1.20.2. 2020. Available online: https://cran.r-project.org/web/packages/gam/gam.pdf (accessed on 29 April 2022).
- Ram, P. Generalized Linear Model. Available online: https://www.mygreatlearning.com/blog/generalized-linear-models/ (accessed on 10 October 2022).
- Panigrahi, N.; Mohanty, S.P. Brain Computer Interface: EEG Signal Processing, 1st ed.; Taylor & Francis Group: Oxfordshire, UK, 2022; p. 224. [Google Scholar]
- Perdeck, A.C. The analysis of ringing data: Pitfalls and prospects. Vogelwarte 1977, 29, 33–44. [Google Scholar]
- Korner-Nievergelt, F.; Liechti, F.; Hahn, S. Migratory connectivity derived from sparse ring reencounter data with unknown numbers of ringed birds. J. Ornithol. 2012, 153, 771–782. [Google Scholar] [CrossRef]
- Busse, P.; Kania, W. A quantitative estimation of distribution of ringed birds on the basis of recovery dispersal. Notatki Ornitol. 1977, 718, 79–93. [Google Scholar]
- Webster, M.S.; Marra, P.; Haig, S.M.; Bensch, S.; Holmes, R.T. Links between worlds: Unravelling migratory connectivity. Trends Ecol. Evol. 2002, 17, 76–83. [Google Scholar] [CrossRef]
- Bairlein, F. Ökosystemanalyse der Rastplätze von Zugvögeln: Beschreibung und Deutung der Verteilungsmuster von ziehenden Kleinvögeln in verschiedenen Biotopen der Stationen des “Mettnau-Reit-Illmitz-Programmes” der Vogelwarte Radolfzell. Ökol. Vögel 1981, 3, 7–137. [Google Scholar]
- Maggini, I.; Cardinale, M.; Favaretto, A.; Voříšek, P.; Spina, F.; Maoret, F.; Ferri, A.; Riello, S.; Fusani, L. Comparing population trend estimates of migratory birds from breeding censuses and capture data at a spring migration bottleneck. Ecol. Evol. 2021, 11, 967–977. [Google Scholar] [CrossRef]
- Baillie, S.; Green, R.E. The importance of variation in recovery rates when estimating survival rates from ringing recoveries. Acta Ornithol. 1987, 23, 41–60. [Google Scholar]
- Robinson, R.A.; Grantham, M.J.; Clark, J.A. Declining rates of ring recovery in British birds. Ringing Migr. 2009, 24, 266–272. [Google Scholar] [CrossRef]
- Südbeck, P.; Andretzke, H.; Fischer, S.; Gedeon, K.; Schikore, T.; Schröder, K.; Sudfeld, C. Methodenstandards zur Erfassung der Brutvögel Deutschlands; Max-Planck-Institute für Ornithologie, Vogelwarte: Radolfzell, Germany, 2005; p. 753. [Google Scholar]
- BirdLife International. Available online: http://datazone.birdlife.org/species/factsheet/ (accessed on 23 February 2022).
- Park, S.H.; Lee, J.H.; Kim, D.H. Spatial Clustering Based on Moving Distance in the Presence of Obstacles. In Advances in Databases: Concepts, Systems and Applications. DASFAA 2007; Kotagiri, R., Krishna, P.R., Mohania, M., Nantajeewarawat, E., Eds.; Lecture Notes in Computer Science; Springer: Berlin/Heidelberg, Germany, 2007; Volume 4443, pp. 1024–1027. [Google Scholar]
- Anselin, L. Cluster Analysis (3). Advanced Clustering Methods. 2020. Available online: https://geodacenter.github.io/workbook/7c_clusters_3/lab7c.html (accessed on 8 March 2022).
- Maechler, M.; Struyf, A.; Hubert, M.; Hornik, K.; Studer, M.; Roudier, P.; Gonzalez, J.; Kozlowski, K.; Schubert, E.; Murphy, M. Package ‘Cluster’–Finding Groups in Data: Cluster Analysis, Version 2.1.3. 2022. Available online: https://cran.r-project.org/web/packages/cluster/cluster.pdf (accessed on 7 June 2022).
- Ripley, B.; Venables, B.; Bates, D.M.; Hornik, K.; Gebhardt, A.; Firth, D. Package ‘MASS’–Support Functions and Datasets for Venables and Ripley’s MASS, Version 7.3-58. 2022. Available online: https://cran.r-project.org/web/packages/MASS/MASS.pdf (accessed on 30 July 2022).
- McCullagh, P. Regression Models for Ordinal Data. J. R. Stat. Soc. Ser. B Stat. Methodol. 1980, 42, 109–142. [Google Scholar] [CrossRef]
- Lukács, Z.; Frühwirth, A.; Gyurácz, J.; Farkas, R. Autumn migration of blue tits (Parus caeruleus) at two Hungarian study sites. North-West. J. Zool. 2015, 11, 225–233. [Google Scholar]
- Mihelič, T.; Kmecl, P.; Denac, K.; Koce, U.; Vrezec, A.; Denac, D. Atlas ptic Slovenije. In Popisi gnezdilk 2002–2017; DOPPS: Ljubljana, Slovenia, 2019; p. 603. [Google Scholar]
- Vrezec, A.; Tome, D.; Denac, D. Selitev in izjemni selitveni pojavi pri pticah. Ujma 2006, 20, 125–136. [Google Scholar]
- Snow, D. A Study of Blackbirds; British Museum Natural History: London, UK, 1988; p. 196. [Google Scholar]
- Pierandrea, B.; Caffi, M.; Gandini, S. Biologia riproduttiva di una popolazione di Passera d’Italia, Passer italiae, nidificante in una “colombaia” della pianura lombarda. Avocetta 1993, 17, 65–71. [Google Scholar]
- Anderson, T.R. Biology of the Ubiquitous House Sparrow: From Genes to Populations; Oxford University Press: Oxford, UK, 2006; p. 560. [Google Scholar]
- Arheimer, O.; Svensson, S. Breeding performance of the Fieldfare Turdus pilaris in the subalpine birch zone in southern Lapland: A 20 year study. Ornis Svec. 2008, 18, 17–44. [Google Scholar] [CrossRef]
- Dolenec, Z. Is there a trade-off between clutch size and egg volume in Magpie Pica pica in Northwestern Croatia? Larus 2016, 51, 33–37. [Google Scholar] [CrossRef][Green Version]
- BirdLife International. European Birds of Conservation Concern: Populations, Trends and National Responsibilities; BirdLife International: Cambridge, UK, 2017; p. 14. [Google Scholar]
- Oiseaux-Birds. Available online: https://www.oiseaux-birds.com/summary-cards.html (accessed on 12 May 2022).
- Anselin, L. GeoDa an Introduction to Spatial Data Science. Available online: https://geodacenter.github.io/ (accessed on 17 February 2022).
- Development Core Team. A Language and Environment for Statistical Computing; Foundation for Statistical Computing: Vienna, Austria, 2022. [Google Scholar]
- European Bird Census Council. 2017. Available online: https://www.ebcc.info/trends-of-common-birds-in-europe-2017-update/ (accessed on 7 February 2020).
- Kmecl, P.; Figelj, J. Monitoring splošno razširjenih vrst ptic za določitev slovenskega indeksa ptic kmetijske krajine–delno poročilo za leto 2016; DOPPS: Ljubljana, Slovenia, 2016; p. 238. [Google Scholar]
- Spina, F. Value of ringing information for bird conservation in Europe. Ringing Migr. 1999, 19, 29–40. [Google Scholar] [CrossRef][Green Version]
- Belgian Ringing Scheme. Available online: http://odnature.naturalsciences.be/bebirds/en/ring-recoveries (accessed on 20 August 2022).
- Bowler, D.; Richter, R.L.; Eskildsen, D.; Kamp, J.; Moshøj, C.M.; Reif, J.; Strebel, N.; Trautmann, S.; Voříšek, P. Geographic variation in the population trends of common breeding birds across central Europe. Basic Appl. Ecol. 2021, 56, 72–84. [Google Scholar] [CrossRef]
- Reif, J.; Storch, D.; Voříšek, P.; Šťastný, K.; Bejček, V. Bird-habitat associations predict population trends in central European forest and farmland birds. Biodivers. Conserv. 2008, 17, 3307–3319. [Google Scholar] [CrossRef]
- Gregory, R.D.; Voříšek, P.; van Strien, A.; Gmelig Meyling, A.W.; Jiguet, F.; Fornasari, L.; Reif, J.; Chylarecki, P.; Burfield, I. Population trends of widespread woodland birds in Europe. Ibis 2007, 149, 78–97. [Google Scholar] [CrossRef]
- Reif, J.; Vermouzek, Z. Collapse of farmland bird populations in an Eastern European country following its EU accession. Conserv. Lett. 2019, 12, e12585. [Google Scholar] [CrossRef]
- Liordos, V.; Pergantis, F.; Perganti, I.; Roussopoulos, Y. Long-term population trends reveal increasing importance of a Mediterranean wetland complex (Messolonghi lagoons, Greece) for wintering waterbirds. Zool. Stud. 2014, 53, e12585. [Google Scholar] [CrossRef]
- Holopainen, S.; Čehovská, M.; Jaatinen, K.; Laaksonen, T.; Lindén, A.; Nummi, P.; Piha, M.; Pöysä, H.; Toivanen, T.; Väänänen, V.-M.; et al. A rapid increase of large-sized waterfowl does not explain the population declines of small-sized waterbird at their breeding sites. Glob. Ecol. Conserv. 2022, 36, e02144. [Google Scholar] [CrossRef]
- Brambilla, M.; Rizzolli, F.; Franzoi, A.; Caldonazzi, M.; Zanghellini, S.; Pedrini, P. A network of small protected areas favoured generalist but not specialized wetland birds in a 30-year period. Biol. Conserv. 2020, 248, 108699. [Google Scholar] [CrossRef]
- Čížková, H.; Květ, J.; Comín, F.A.; Laiho, R.; Pokorný, J.; Pithart, D. Actual state of European wetlands and their possible future in the context of global climate change. Aquat. Sci. 2013, 75, 3–26. [Google Scholar] [CrossRef]
- Báldi, Á.; Kisbenedek, T. Species-specific distribution of reed-nesting passerine birds across reed-bed edges: Effects of spatial scale and edge type. Acta Zool. Acad. Sci. Hung. 1999, 45, 97–114. [Google Scholar]
- Martínez-Vilalta, J.; Bertolero, A.; Bigas, D.; Paquet, J.-Y.; Martínez-Vilalta, A. Habitat selection of passerine birds nesting in the Ebro delta reedbeds (NE Spain): Management implications. Wetlands 2002, 22, 318–325. [Google Scholar] [CrossRef]
- Alambiaga, I.; Carrasco, M.; Ruiz, C.; Mesquita-Joanes, F.; Monrós, J.S. Population trends and habitat selection of threatened marsh passerines in a protected Mediterranean wetland. Avian Conserv. Ecol. 2021, 16, 23. [Google Scholar] [CrossRef]
- Kamp, J.; Frank, C.; Trautmann, S.; Busch, M.; Dröschmeister, R.; Flade, M.; Gerlach, B.; Karthäuser, J.; Kunz, F.; Mitschke, A.; et al. Population trends of common breeding birds in Germany 1990–2018. J. Ornithol. 2021, 162, 1–15. [Google Scholar] [CrossRef]
- Morrison, C.A.; Robinson, R.A.; Clark, J.A.; Risely, K.; Gill, J.A. Recent population declines in Afro-Palaearctic migratory birds: The influence of breeding and non-breeding seasons. Divers. Distrib. 2013, 19, 1051–1058. [Google Scholar] [CrossRef]
- Plard, F.; Bruns, H.A.; Cimiotti, D.V.; Helmecke, A.; Hötker, H.; Jeromin, H.; Roodbergen, M.; Schekkerman, H.; Teunissen, W.; van der Jeugd, H.; et al. Low productivity and unsuitable management drive the decline of central European lapwing populations. Anim. Conserv. 2020, 23, 286–296. [Google Scholar] [CrossRef]
- Arizaga, J.; Andueza, M.; Tamayo, I. Spatial Behaviour and Habitat use of First-Year Bluethroats Luscinia svecica Stopping over at Coastal Marshes during the Autumn Migration Period. Acta Ornithol. 2013, 48, 17–25. [Google Scholar] [CrossRef]
- Bairlein, F. Habitat selection and associations of species in European passerine birds during southward, post-breeding migration. Ornis Scand. 1983, 14, 239–245. [Google Scholar] [CrossRef]
- Trnka, A.; Prokov, P. Reedbed structure and habitat preference of reed passerines during the post-breeding period. Biologia 2006, 61, 225–230. [Google Scholar] [CrossRef]
- Bozó, L.; Heim, W.; Csörgő, T. Habitat use by Siberian warbler species at a stopover site in Far Eastern Russia. Ringing Migr. 2018, 33, 31–35. [Google Scholar] [CrossRef]
- Sánchez-Bayo, F.; Wyckhuys, K.A.G. Worldwide decline of the entomofauna: A review of its drivers. Biol. Conserv. 2019, 232, 8–27. [Google Scholar] [CrossRef]
- Brühl, C.A.; Després, L.; Frör, O.; Patil, C.D.; Poulin, B.; Tetreau, G.; Allgeier, S. Environmental and socioeconomic effects of mosquito control in Europe using the biocide Bacillus thuringiensis subsp. israelensis (Bti). Sci. Total Environ. 2020, 724, 137800. [Google Scholar] [CrossRef]
- Hallmann, C.A.; Sorg, M.; Jongejans, E.; Siepel, H.; Hofland, N.; Schwan, H.; Stenmans, W.; Müller, A.; Sumser, H.; Hörren, T.; et al. More than 75 percent decline over 27 years in total flying insect biomass in protected areas. PLoS ONE 2017, 12, e0185809. [Google Scholar] [CrossRef]
- Eisenhauer, N.; Bonn, A.; Guerra, C.A. Recognizing the quiet extinction of invertebrates. Nat. Commun. 2019, 10, 50. [Google Scholar] [CrossRef]
- Møller, A.P. Quantifying rapidly declining abundance of insects in Europe using a paired experimental design. Ecol. Evol. 2020, 10, 2446–2451. [Google Scholar] [CrossRef] [PubMed]
- Tirozzi, P.; Orioli, V.; Dondina, O.; Kataoka, L.; Bani, L. Species Traits Drive Long-Term Population Trends of Common Breeding Birds in Northern Italy. Animals 2021, 11, 3426. [Google Scholar] [CrossRef] [PubMed]
- Newton, I. Population limitation in migrants. Ibis 2004, 146, 197–226. [Google Scholar] [CrossRef]
- Pulido, F.; Widmer, M. Are long-distance migrants constrained in their evolutionary response to environmental change? Causes of variation in the timing of autumn migration in a blackcap (S. atricapilla) and two garden warbler (Sylvia borin) populations. Ann. N. Y. Acad. Sci. 2005, 1046, 228–241. [Google Scholar] [CrossRef] [PubMed]
- Møller, A.P.; Rubolini, D.; Lehikoinen, E. Populations of migratory bird species that did not show a phenological response to climate change are declining. Proc. Natl. Acad. Sci. USA 2008, 105, 16195–16200. [Google Scholar] [CrossRef] [PubMed]
- Sanz, J.J.; Potti, J.; Moreno, J.; Merino, S.; Frías, O. Climate change and fitness components of a migratory bird breeding in the Mediterranean region. Glob. Chang. Biol. 2003, 9, 461–472. [Google Scholar] [CrossRef]
- Both, C.; Bouwhuis, S.; Lessells, C.M.; Visser, M.E. Climate change and population declines in a long-distance migratory bird. Nature 2006, 4441, 81–83. [Google Scholar] [CrossRef]
- Gregory, R.D.; van Strien, A.; Vorisek, P.; Gmelig, M.A.W.; Noble, D.G.; Foppen, R.P.B.; Gibbons, D.W. Developing indicators for European birds. Phil. Trans. R. Soc. 2005, 360, 269–288. [Google Scholar] [CrossRef]
- Kuresoo, A.; Pehlaka, H.; Nellis, R. Population trends of common birds in Estonia in 1983–2010. Est. J. Ecol. 2011, 60, 88–110. [Google Scholar] [CrossRef]
- Hüppop, O.; Hüppop, K. Bird migration on Helgoland: The yield from 100 years of research. J. Ornithol. 2011, 152, 25–40. [Google Scholar] [CrossRef]
- Sanderson, F.J.; Donald, P.F.; Pain, D.J.; Burfield, I.J.; van Bommel, F.P.J. Long-term population declines in Afro-Palearctic migrant birds. Biol. Conserv. 2006, 131, 93–105. [Google Scholar] [CrossRef]
- Böhning-Gaese, K.; González-Guzmán, L.I.; Brown, J.H. Constraints on dispersal and the evolution of the avifauna of the Northern Hemisphere. Evol. Ecol. 1998, 12, 767–783. [Google Scholar] [CrossRef]
- Gregory, R.D.; Skorpilova, J.; Vorisek, P.; Butler, S. An analysis of trends, uncertainty and species selection shows contrasting trends of widespread forest and farmland birds in Europe. Ecol. Indic. 2019, 103, 676–687. [Google Scholar] [CrossRef]
- White, P.J.C. Song characteristics vary clinally across an active colonization zone in Eurasian Nuthatches Sitta europaea. Bird Study 2012, 59, 296–302. [Google Scholar] [CrossRef]
- Capellini, I.; Baker, J.; Allen, W.L.; Street, S.E.; Venditti, C. The role of life history traits in mammalian invasion success. Ecol. Lett. 2015, 1810, 1099–1107. [Google Scholar] [CrossRef] [PubMed]
- Tataridas, A.; Kanatas, P.; Chatzigeorgiou, A.; Zannopoulos, S.; Travlos, I.S. Sustainable Crop and Weed Management in the Era of the EU Green Deal: A Survival Guide. Agronomy 2022, 2, 589. [Google Scholar] [CrossRef]
- Flather, C.H.; Sieg, C. Species rarity: Definition, causes, and classification. In Conservation of Rare or Little-Known Species: Biological, Social, and Economic Considerations; Raphael, M.G., Molina, R., Eds.; Island Press: Washington, DC, USA, 2007; pp. 40–66. [Google Scholar]
- Chen, Y.-J.; Leung, P.M.; Wood, J.L.; Bay, S.K.; Hugenholtz, P.; Kessler, A.J.; Shelley, G.; Waite, D.W.; Franks, A.E.; Cook, P.L.M.; et al. Metabolic flexibility allows bacterial habitat generalists to become dominant in a frequently disturbed ecosystem. ISME J. 2021, 15, 2986–3004. [Google Scholar] [CrossRef]


| Species’ Trait Category and Trait Type | Abbreviation of Categories | Definition | Number of Species | Type of Statistical Data | Data Source |
|---|---|---|---|---|---|
| ECOLOGICAL TRAITS | |||||
| Cultural landscape | CL | Species living in cultural landscape | 27 | Categorical nominal | [63,64] |
| Forest | FOR | Species living in forest | 36 | ||
| Wetland | WET | Wetland specialists | 11 | ||
| Diet | SEEDS | Seed-eating birds | 13 | ||
| INVER | Species feeding on insects and other invertebrates | 61 | |||
| MIGRATORY TRAITS, BREEDING AND ABUNDANCE STATUS | |||||
| Migratory status in Europe | PAS | Passenger, including accidental passenger | 33 | Categorical nominal | [64,70,71,72] |
| RES | Resident in Europe (in Slovenia: resident; resident and passenger; wintering species) | 31 | |||
| NOM | Nomadic and irruptive species | 10 | |||
| Migration distance | LM | Long-distance migrant: Sub-Saharan-Africa and Asia | 30 | ||
| SM | Short-distance migrant | 35 | |||
| NM | Non-migrant species | 9 | |||
| Breeding status in Slovenia | RB | Regular breeder | 68 | ||
| OB | Occasional breeder | 4 | |||
| NB | Non-breeding species | 2 | |||
| Breeding distribution range in Europe | CBE | Common breeder and widespread breeding species in most of Europe | 56 | ||
| SBE | Species with scattered or restricted distribution to few parts of Europe | 18 | |||
| LIFE-HISTORY TRAITS | |||||
| Reproduction | avg. no. of annually produced eggs per pair * avg. no. of annual nests | [61,73,74,75,76,77,78,79] | |||
| MP | Low productivity: 3.0–6.9 | 22 | Numerical and categorical ordinal | ||
| LP | High productivity: 10.0–20.9 | 26 | |||
| GEOGRAPHICAL ORIGIN | |||||
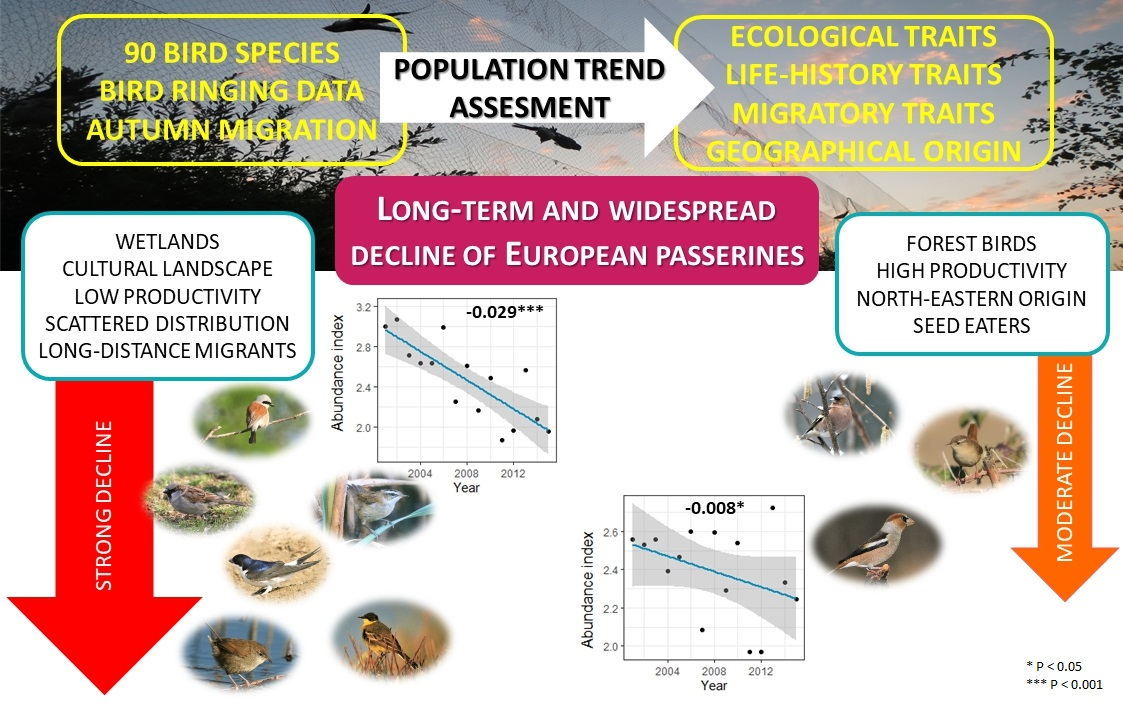
| Geographical origin (recoveries according to position of Slovenia) | NE | North-Eastern | 11 (122 recoveries) | Categorical nominal | Analyses in this article |
| NW | North-Western | 14 (149 recoveries) | |||
| NN | North-Northern | 8 (80 recoveries) | |||
| NNE | North-North-Eastern | 6 (54 recoveries) | |||
| Latitude (N) | Numerical | Slovenian bird ringing database | |||
| Longitude (E) | |||||
| Migratory distance (recoveries) | |||||
| Species | Estimate (GAM) ± SE | F | DE (%) | Model Acceptance | Estimated Annual Growth Rate (GLM) | Trend | Trend-Match with Ref. Data |
|---|---|---|---|---|---|---|---|
| Acrocephalus arundinaceus | 0.698 ± 0.030 | 1.9 | 20.2 | yes | +0.013 *** | Increase | yes |
| Acrocephalus melanopogon | 0.054 ± 0.009 | 4.0 * | 50.7 | yes | −0.089 *** | Decline | yes |
| Acrocephalus palustris | 2.840 ± 0.095 | 16.0 *** | 85.7 | yes | −0.051 *** | Decline | yes |
| Acrocephalus schoenobaenus | 6.224 ± 0.219 | 2.2 | 67.3 | yes | +0.000 | Stable | yes |
| Acrocephalus scirpaceus | 7.583 ± 0.347 | 8.6 * | 36.5 | yes | −0.027 *** | Decline | yes |
| Aegithalos caudatus | 0.606 ± 0.031 | 3.3 * | 66.2 | yes | −0.038 *** | Decline | yes |
| Anthus trivialis | 0.175 ± 0.005 | 10.8 ** | 45.4 | yes | −0.023 *** | Decline | yes |
| Carduelis carduelis | 0.569 ± 0.054 | 3.3 * | 47.7 | yes | −0.023 *** | Decline | yes |
| Certhia brachydactyla | 0.022 ± 0.002 | 6.2 * | 29.5 | yes | −0.059 *** | Decline | no |
| Certhia familiaris | 0.041 ± 0.002 | 2.6 | 17.1 | yes | +0.020 *** | Increase | unknown |
| Cettia cetti | 0.047 ± 0.003 | 5.9 ** | 81.6 | yes | −0.061 *** | Decline | yes |
| Chloris chloris | 1.110 ± 0.034 | 5.8 * | 85.2 | yes | −0.011 * | Decline | yes |
| Coccothraustes coccothraustes | 0.108 ± 0.011 | 2.2 | 13.3 | yes | +0.032 *** | Increase | yes |
| Curruca communis | 0.929 ± 0.036 | 17.1 *** | 80.4 | yes | −0.049 *** | Decline | yes |
| Curruca curruca | 0.545 ± 0.018 | 3.4 * | 70.4 | yes | −0.023 *** | Decline | yes |
| Curruca nisoria | 0.045 ± 0.003 | 2.7 | 63.7 | yes | −0.039 *** | Decline | yes |
| Cyanecula svecica | 0.087 ± 0.006 | 3.2 | 46.5 | yes | +0.013 *** | Increase | yes |
| Cyanistes caeruleus | 2.291 ± 0.095 | 3.1 | 76.5 | yes | +0.002 | Stable | yes |
| Delichon urbicum | 0.044 ± 0.005 | 9.7 ** | 92.2 | yes | −0.013 *** | Decline | yes |
| Emberiza cia | 0.034 ± 0.003 | 29.5 *** | 66.3 | yes | −0.116 *** | Decline | yes |
| Emberiza cirlus | 0.027 ± 0.001 | 4.9 * | 76.9 | yes | +0.040 *** | Increase | yes |
| Emberiza citrinella | 0.197 ± 0.008 | 0.1 | 0.8 | no | - | Uncertain | unknown |
| Emberiza schoeniclus | 1.314 ± 0.113 | 8.5 * | 36.4 | yes | −0.052 *** | Decline | yes |
| Erithacus rubecula | 9.227 ± 0.340 | 4.5 * | 50.3 | yes | −0.023 *** | Decline | yes |
| Ficedula hypoleuca | 0.216 ± 0.015 | 3.5 * | 66.3 | yes | −0.022 *** | Decline | yes |
| Fringilla coelebs | 0.907 ± 0.059 | 5.8 ** | 58.7 | yes | −0.054 *** | Decline | yes |
| Fringilla montifringilla | 0.222 ± 0.016 | 2.6 | 46.0 | yes | +0.026 *** | Increase | no |
| Garrulus glandarius | 0.027 ± 0.001 | 4.9 * | 84.7 | yes | −0.018 *** | Decline | yes |
| Hippolais icterina | 0.668 ± 0.062 | 8.1 ** | 47.5 | yes | −0.067 *** | Decline | yes |
| Hippolais polyglotta | 0.017 ± 0.002 | 2.2 | 39.9 | yes | +0.057 *** | Increase | yes |
| Hirundo rustica | 16.715 ± 2.785 | 1.2 | 39.8 | yes | −0.048 *** | Decline | yes |
| Lanius collurio | 0.367 ± 0.018 | 7.9 ** | 74.7 | yes | −0.052 *** | Decline | yes |
| Linaria cannabina | 0.074 ± 0.009 | 2.2 | 61.5 | yes | −0.007 | Stable | yes |
| Locustella fluviatilis | 0.033 ± 0.003 | 7.4 ** | 54.9 | yes | −0.081 *** | Decline | yes |
| Locustella luscinioides | 0.080 ± 0.006 | 3.5 * | 48.5 | yes | −0.022 *** | Decline | unknown |
| Locustella naevia | 0.301 ± 0.020 | 8.9 ** | 56.5 | yes | −0.058 *** | Decline | yes |
| Lophophanes cristatus | 0.126 ± 0.005 | 7.1 ** | 90.5 | yes | +0.048 *** | Increase | unknown |
| Loxia curvirostra | 0.022 ± 0.002 | 3.4 * | 74.1 | yes | +0.043 *** | Increase | yes |
| Luscinia luscinia | 0.051 ± 0.003 | 2.3 | 35.5 | yes | −0.031 *** | Decline | yes |
| Luscinia megarhynchos | 0.351 ± 0.013 | 4.9 * | 64.6 | yes | +0.028 *** | Increase | yes |
| Motacilla alba | 0.036 ± 0.009 | 1.3 | 38.1 | yes | −0.015 *** | Decline | yes |
| Motacilla cinerea | 0.013 ± 0.001 | 3.7 * | 48.1 | yes | +0.048 *** | Increase | yes |
| Motacilla flava | 0.087 ± 0.017 | 3.5 * | 62.6 | yes | +0.055 *** | Increase | yes |
| Muscicapa striata | 0.145 ± 0.007 | 6.5 ** | 70.2 | yes | −0.023 *** | Decline | yes |
| Oriolus oriolus | 0.013 ± 0.000 | 3.1 | 65.7 | yes | −0.026 *** | Decline | yes |
| Parus major | 4.007 ± 0.239 | 0.4 | 3.5 | no | - | Uncertain | unknown |
| Passer domesticus | 0.458 ± 0.024 | 4.4 * | 63.1 | yes | −0.040 *** | Decline | no |
| Passer italiae | 0.022 ± 0.002 | 11.2 ** | 91.1 | yes | +0.093 *** | Increase | unknown |
| Passer montanus | 2.248 ± 0.161 | 3.7 * | 45.8 | yes | −0.033 *** | Decline | yes |
| Periparus ater | 1.929 ± 0.143 | 3.2 | 59.8 | yes | −0.009 *** | Decline | yes |
| Phoenicurus ochruros | 0.067 ± 0.002 | 4.0 * | 72.5 | yes | +0.018 *** | Increase | yes |
| Phoenicurus phoenicurus | 0.112 ± 0.005 | 3.6 * | 79.4 | yes | +0.024 *** | Increase | yes |
| Phylloscopus collybita | 3.911 ± 0.156 | 3.7 * | 55.3 | yes | +0.009 *** | Increase | yes |
| Phylloscopus sibilatrix | 0.993 ± 0.116 | 1.4 | 38.7 | yes | −0.018 *** | Decline | yes |
| Phylloscopus trochilus | 0.507 ± 0.023 | 5.2 * | 48.2 | yes | −0.032 *** | Decline | yes |
| Poecile montanus | 0.079 ± 0.002 | 10.1 ** | 93.5 | yes | +0.001 | Stable | unknown |
| Poecile palustris | 0.233 ± 0.013 | 0.1 | 6.9 | no | - | Uncertain | unknown |
| Prunella modularis | 11.087 ± 0.403 | 5.2 * | 28.6 | yes | −0.019 *** | Decline | yes |
| Pyrrhula pyrrhula | 0.043 ± 0.001 | 4.4 * | 74.5 | yes | −0.010 *** | Decline | yes |
| Regulus ignicapilla | 0.070 ± 0.005 | 1.9 | 45.5 | yes | +0.012 *** | Increase | yes |
| Regulus regulus | 3.451 ± 0.148 | 6.4 * | 86.5 | yes | +0.003 | Stable | yes |
| Remiz pendulinus | 0.517 ± 0.045 | 3.8 * | 74.4 | yes | −0.038 *** | Decline | unknown |
| Riparia riparia | 0.185 ± 0.040 | 5.6 * | 27.2 | yes | −0.112 *** | Decline | unknown |
| Saxicola rubetra | 0.088 ± 0.002 | 8.6 ** | 91.5 | yes | −0.012 *** | Decline | yes |
| Saxicola rubicola | 0.074 ± 0.004 | 3.6 * | 78.9 | yes | −0.0541 *** | Decline | yes |
| Serinus serinus | 0.190 ± 0.014 | 2.2 | 51.2 | yes | −0.006 | Stable | yes |
| Sitta europaea | 0.054 ± 0.004 | 1.3 | 28.2 | yes | +0.027 *** | Increase | yes |
| Spinus spinus | 2.199 ± 0.218 | 5.5 * | 85.6 | yes | −0.046 *** | Decline | yes |
| Sturnus vulgaris | 0.303 ± 0.023 | 5.1 * | 85.3 | yes | +0.031 *** | Increase | no |
| Sylvia atricapilla | 41.656 ± 1.257 | 3.6 | 40.3 | yes | −0.016 *** | Decline | yes |
| Sylvia borin | 14.386 ± 0.432 | 9.1 ** | 91.0 | yes | −0.038 *** | Decline | yes |
| Troglodytes troglodytes | 0.217 ± 0.012 | 2.6 | 61.2 | yes | +0.010 ** | Increase | yes |
| Turdus merula | 1.298 ± 0.056 | 0.1 | 0.8 | no | - | Uncertain | unknown |
| Turdus philomelos | 0.588 ± 0.042 | 0.5 | 3.3 | no | - | Uncertain | unknown |
| Grouping by Species’ Traits | Estimate (GAM) ± SE | F | Deviance Explained (%) | Estimated Annual Growth Rate (GLM) | Trend |
|---|---|---|---|---|---|
| Habitat | |||||
| Cultural landscape | 2.453 ± 0.059 | 9.6 ** | 65.9 | −0.025 *** | Decline |
| Forest | 2.568 ± 0.077 | 1.6 | 11.3 | −0.008 * | Decline |
| Wetland | 2.504 ± 0.071 | 17.7 *** | 74.5 | −0.039 *** | Decline |
| Diet | |||||
| Seed-eaters | 2.448 ± 0.078 | 1.4 | 10.1 | −0.008 * | Decline |
| Invertebrate eaters | 2.451 ± 0.073 | 11.4 ** | 46.7 | −0.023 *** | Decline |
| Migratory status in Europe | |||||
| Passage migrants | 2.452 ± 0.074 | 8.1 ** | 55.6 | −0.027 *** | Decline |
| Residents | 2.545 ± 0.061 | 3.1 | 62.9 | −0.018 ** | Decline |
| Nomadic and irruptive species | 2.385 ± 0.110 | 0.4 | 11.7 | −0.001 *** | Decline |
| Migration distance | |||||
| Long-distance migrants | 2.525 ± 0.076 | 7.5 ** | 55.6 | −0.027 *** | Decline |
| Short-distance migrant | 2.375 ± 0.068 | 3.2 | 20.0 | −0.012 ** | Decline |
| Non-migrant species | 2.931 ± 0.085 | 4.5 * | 80.3 | −0.021 *** | Decline |
| Breeding status in Slovenia | |||||
| Regular breeder | 2.563 ± 0.065 | 11.7 ** | 47.5 | −0.020 *** | Decline |
| Occasional breeder | 1.269 ± 0.059 | 0.0 | 0.1 | 0.001 | Uncertain |
| Non-breeding species | 2.955 ± 0.101 | 3.4 * | 75.1 | −0.016 ** | Decline |
| Breeding distribution range in Europe | |||||
| Widespread | 2.423 ± 0.068 | 4.2 * | 44.4 | −0.019 *** | Decline |
| Small or scattered range | 2.537 ± 0.063 | 10.4 ** | 64.6 | −0.026 *** | Decline |
| Geographic origin of breeding populations | |||||
| North-Eastern | 1.756 ± 0.057 | 2.2 | 70.0 | 0.005 | Stable |
| North-Western | 2.392 ± 0.078 | 10.6 ** | 44.9 | −0.024 *** | Decline |
| North-Northern | 3.060 ± 0.118 | 3.2 | 42.2 | −0.021 *** | Decline |
| North-North-Eastern | 5.374 ± 0.191 | 5.3 * | 56.0 | −0.026 *** | Decline |
| Productivity | |||||
| Low productivity | 2.327 ± 0.073 | 13.8** | 51.6 | −0.027 *** | Decline |
| High productivity | 2.797 ± 0.075 | 4.2 | 24.9 | −0.012 *** | Decline |
| Species’ Trait Category or Trait Type | t | p |
|---|---|---|
| Habitat | −0.797 | 0.424 |
| Diet | −0.753 | 0.451 |
| Migratory status in Europe | 2.648 | 0.008 |
| Migration distance | 2.028 | 0.042 |
| Breeding status in Slovenia | 0.029 | 0.976 |
| Breeding distribution range in Europe | −0.805 | 0.420 |
| Productivity | 2.416 | 0.015 |
| Actual migration distance (recoveries) | 1.541 | 0.123 |
| Longitude (recoveries) | −1.839 | 0.065 |
| Latitude (recoveries) | 2.475 | 0.013 |
| Geographic origin of breeding populations (recoveries) | 0.999 | 0.317 |
Publisher’s Note: MDPI stays neutral with regard to jurisdictional claims in published maps and institutional affiliations. |
© 2022 by the authors. Licensee MDPI, Basel, Switzerland. This article is an open access article distributed under the terms and conditions of the Creative Commons Attribution (CC BY) license (https://creativecommons.org/licenses/by/4.0/).
Share and Cite
Petras, T.; Vrezec, A. Long-Term Ringing Data on Migrating Passerines Reveal Overall Avian Decline in Europe. Diversity 2022, 14, 905. https://doi.org/10.3390/d14110905
Petras T, Vrezec A. Long-Term Ringing Data on Migrating Passerines Reveal Overall Avian Decline in Europe. Diversity. 2022; 14(11):905. https://doi.org/10.3390/d14110905
Chicago/Turabian StylePetras, Tina, and Al Vrezec. 2022. "Long-Term Ringing Data on Migrating Passerines Reveal Overall Avian Decline in Europe" Diversity 14, no. 11: 905. https://doi.org/10.3390/d14110905
APA StylePetras, T., & Vrezec, A. (2022). Long-Term Ringing Data on Migrating Passerines Reveal Overall Avian Decline in Europe. Diversity, 14(11), 905. https://doi.org/10.3390/d14110905