Article

Shifts in Community Vegetative Organs and Their Dissimilar Trade-Off Patterns in a Tropical Coastal Secondary Forest, Hainan Island, Southern China

1
Wuzhishan National Long-Term Forest Ecosystem Monitoring Research Station, Hainan Key Laboratory for Sustainable Utilization of Tropical Bioresource, College of Forestry, Hainan University, Haikou 570228, China
2
Faculty of Agriculture and Environment, The Islamia University of Bahawalpur, Bahawalpur 63100, Pakistan
3
College of Plant Sciences and Technology, Huazhong Agriculture University, Wuhan 430070, China
*
Author to whom correspondence should be addressed.
Diversity 2022, 14(10), 823; https://doi.org/10.3390/d14100823
Submission received: 24 August 2022 / Revised: 27 September 2022 / Accepted: 28 September 2022 / Published: 30 September 2022
(This article belongs to the Special Issue Socioecology and Biodiversity Conservation)

Abstract

:
The ecology of functional features highlights the importance of the leaf economic spectrum (LES) in understanding plant trade-offs between conservative and commercial resource use. However, it is still unclear whether changes in the plant attributes of various vegetative organs can be altered and whether the plant economic spectrum (PES) is categorized by multiple vegetative organs. We investigated a total of 12 functional features of 174 woody tree species, with leaf and stem attributes, on Hainan Island. We used principal component analysis (PCA) to analyze the changes in attributes and connections to understand how the plant trade-offs differ. We detected that stem organic matter (SOM) and stem organic carbon (SOC) contributed most to the first principal component, followed by leaf organic matter (LOM) and leaf organic carbon (LOC). Using Spearman correlation analysis, we determined that leaf total nitrogen (LTN) and specific leaf area (SLA), LTN and leaf total phosphorus (LTP), and finally stem total nitrogen (STN) and stem total phosphorus (STP) were positively significantly correlated. These significant variations in the traits of nutrients are regulated, while the morphological traits of aboveground vegetative organs are diverse. The coexistence of species and community assembly can increase our knowledge on the tropical coastal secondary forests. Furthermore, our outcomes can help us to better understand the restoration of habitats and green infrastructure design, suggesting that selecting different species across multiple trait axes can help ensure functionality at the maximum level.

1. Introduction

The functional features of plants independently or collectively determine the ecological roles of species and the response of ecosystems to environmental change [1]. Consequently, functional trait approaches have been utilized to better understand the spectrum of plant functional strategies and their relationship with the environment [2,3]. Plant ecology strategy schemes (PESSs) divide species into spectrums based on categories and ecological traits, representing various trade-offs among species and types of resource investment (such as in tissues, cells, and organs) [4,5,6].
Plants need both growth and defense in order to thrive and survive in nature, so the trade-off between growth and defense has an important ecological consequence [7]. To survive in hostile habitats, plants must manage available resources to achieve a delicate balance between developmental and defensive processes. Plant scientists call this a strategy [8]. Plants allocate resources to maximize fitness in the face of a variety of abiotic (such as nutrient availability) and biotic (such as herbivory) constraints. A lack of resources can lead to conflicting demands on such resources and, as a result, plants may not be able to invest in growth, reproduction, and defense simultaneously [9]. Various organs of plants rarely modify classification with one another in relation to environmental conditions on a local scale, alternating resource usage techniques to sustain growth as well as its advancement [10]. Thus, the leaf economic spectrum (LES) demonstrates that variations and correlations in leaf features reflect ecological trade-offs in the use of resources, which is generally supported by many ecologists [11,12,13]. Nevertheless, whether stem and root represent a similar one-dimensional strategic trade-off remains undetermined [14,15].
Functional traits are associated with individual plant organs, i.e., leaves [16,17,18] and stems [19,20]. We have collected empirical evidence to support an incomplete set of possible trait combinations. Other studies have documented the plant organs as rare, geographically or taxonomically very rare, and often inconsistent. On the global scale, it is still unclear how strictly whole-plant form and function are limited. Stem-specific density reflects the trade-off between growth potential and the risk of mortality from hydraulic failure. The balance of water and leaf energy is affected by leaf area (LA). Different features of leaf resource attainment and conservation strategies are indicated by leaf nitrogen (LN) concentration per unit mass (Nmass) and leaf mass area (LMA). LMA represents a trade-off between carbon gaining and longevity, while Nmass represents a trade-off between the advantage of photosynthetic capacity and the costs of capturing nitrogen as well as suffering herbivory [21].
In addition, it is still under investigation whether there are coordinated changes in attributes between aboveground and belowground parts of plants as a result of environmental changes. According to the morphological similarity hypothesis, the structural toughness between the xylem and phloem tissue between root and stem functions is likely to be related to root morphological characteristics (i.e., wood density). It is likely closely related to stem morphological traits [22]. In the functional similarity hypothesis, root growth relies on the carbohydrates supplied via leaves and leaf function relies on the nutrients and water that are engaged from the roots, so traits of the roots are more important than those of the stem, which are more closely related [13,23]. Some previous studies suggests that leaves and roots respond to environmental conditions independently [24,25], causing a multi-layered trade-off.
Tropical secondary growth forests cover nearly half of the world’s tropical forests and play a key role in the conservation of biodiversity and carbon sequestration [26].
Tropical coastal secondary forests have been seriously affected not only by natural disasters (e.g., typhoons), but also by human disturbances (i.e., slash and burn) [27]. The natural forest flora of southern China has a rich diversity of various plants groups and is represented by this tropical coastal secondary forest, which has a selected parallel ecology [28,29,30,31,32]. Biodiversity conservation, monitoring of the natural environment, and controlling typhoons are thus serious issues in this region [27]. However, there is limited knowledge about the correlation and variation in plant functional traits and in leaf and stem nutrients in tropical coastal secondary forests. We examined 12 functional features (Table 1) of 174 species of woody trees in Tongguling National Nature Reserve (TNNR), a tropical coastal secondary forest of Hainan Island, and examined their relationships and variation with the help of multivariate and bivariate analyses. In particular, we evaluated the leaf functional traits associated with resource gain plus defense [16,33], and measured specific leaf area (SLA), wood density (WD), leaf thickness (LT), and relative leaf water content (RLWC), among others.
Overall, WD is crucial for plant productivity, survival, and capturing the primary approach axes of variation [16,34]. WD, the dry matter per volume of fresh stems, is often associated with plant defense and plant stability and is known to be the most important functional trait [16]. On the other hand, physiological and chemical properties of leaves, i.e., LT, SLA, and leaf dry matter content (LDMC), are morphological indicators that can be easily measured to designate the resource strategies and adaptive traits of a plant concerning its environment [35]. In this paper, we examine the following: (1) whether tree stems and leaves in tropical coastal secondary forests would show a plant economic spectrum (PES) for balancing and optimizing resource allocation; (2) whether aboveground traits are linked to leaf and stem nutrients and which nutrient contributes the most to community assembly.

2. Materials and Methods

2.1. Site Conditions

This research was carried out in the Tongguling National Nature Reserve (TNNR) (19°36′19°41′ N 110°58′111°03′ E), of Hainan Island, southern China. The Tongguling National Nature Reserve (TNNR) is a 44-square-kilometer nature reserve with an elevation of 338 m above sea level and a tropical monsoonal climate. The wet season ranges from May to October, while the dry season is from November to April, with an average annual temperature of 23.9 °C and 1721.6 mm of rainfall. It has lateritic soil [36]. Before the year 1980, all of these forests had been logged and altered into shrubs, grassland, or secondary growth forests. Deforestation was restricted once the Tongguling National Nature Reserve (TNNR) was established in 1983, and forests were well covered [28]. The dominant or most common tree species of the forests include the following: Sterculia lanceolata, Cryptocarya chinensis, Garcinia oblongifolia, Arytera littoralis, Canthium horridum, Litsea glutinosa, Ficus hispida, and Sapindus Saponaria.

2.2. Data Collection

We established nine 50 × 50 m (2500 m2) plots in the Tongguling National Nature Reserve, with a distance of 50 m or more between adjacent plots. Then, each plot was divided into sixty-four 20 × 20 m (400 m2) by the community size. Using a clinometer, all individual trees in each plot with a dbh ≥ 5 had their height and DBH (diameter at breast height) recorded. A total of 12 functional attributes of leaf and stem linked with plant resource strategy were identified for three woody plants of each species present in the investigated plots (Table 1).
To determine plant functional traits, two to three newly sprouted sun leaves (growth from the current year) from each individual were taken and measured for three standard woody trees of each species. A vernier caliper with a digital display was used to measure the leaf thickness (SF2000, Guilin, China; Franche-Comté, 1637). Additionally, the leaf area was measured using a leaf area meter (LI-COR 3100C Area Meter, LI-COR, Lincoln, NE, USA). The leaves were first dried at 70 °C for at least 72 h to a constant weight and weighed on a digital balance (Ohaus Adventurer AR2140 Analytical Balance, Hayward, CA, USA); the LMA (leaf mass area) (mg mm2) as well as specific leaf area (SLA) (mm2 mg−1) for each tree were then calculated using leaf area and dry mass.
To identify species WD (g cm−3), three branches (1 cm ≤ dbh ≤ 2 cm) were taken respectively and examined for leaf properties. After removing the pith and phloem along with the bark, we used water displacement to estimate the fresh volume of the rest of the branches and calculated the dry matter after drying at 70 °C for 72 h [37]. Branch density is the dry matter of the remaining portion of that branch (excluding the bark, pith, and phloem) divided by its volume, and showed a strong relationship with the core stem density for mature trees within the Tongguling National Nature Reserve (TNNR) [38]. Consequently, branch density can be used to indicate the wood density, in order to avoid legal damage when obtaining the tree rings with a growth cone drill. The RLWC was estimated with the following equation:
water   content   % = fresh   weight dry   weight fresh   weight × 100 [39]. Each sample was measured in biological triplicate. The nitrogen content was calculated with the Kjeldahl method, whereas the phosphorus content was degraded using the HClO4-H2SO4 decomposition method and determined using the key-blue colorimetry method [40]. Leaf carbon concentrations were determined using an elemental analyzer (PE2400 SeriesII, PerkinElmer Inc., Waltham, MA, USA).

2.3. Data Analysis

The mean values were calculated for 12 functional attributes of 174 species present in the sixty-four 20 × 20 m (400 m2) plots, respectively (Table 1). The trait variations as well as Pearson and Spearman’s correlations were evaluated using multivariate and bivariate analyses. We specifically computed the species-level mean values for each of the 12 functional traits and performed PCA (a matrix with 12 traits × 174 species) to assess multivariate trait relationships and reveal the dimension of variation in traits. Additionally, we used Spearman correlation analysis for further investigation of the statistical implications of correlations in functional traits. Variables with significant connections were visualized as scatter plots, where the trend line shows how strongly the variables are connected. It has been identified as a suitable statistical tool for evaluating positive non-causal bivariate correlations [41]. For Figure 1, the biplot using the “factoextra” package was used, and for Figure 2, Figure 3 and Figure 4, the “ggpubr” and “ggplot2” package was used. All data analyses were completed in R version 4.0.2.
Descriptive statistics of the plant functional traits of woody plant species in the tropical coastal secondary forest in Tongguling, China were presented in (Supplement, Table S1).

3. Results

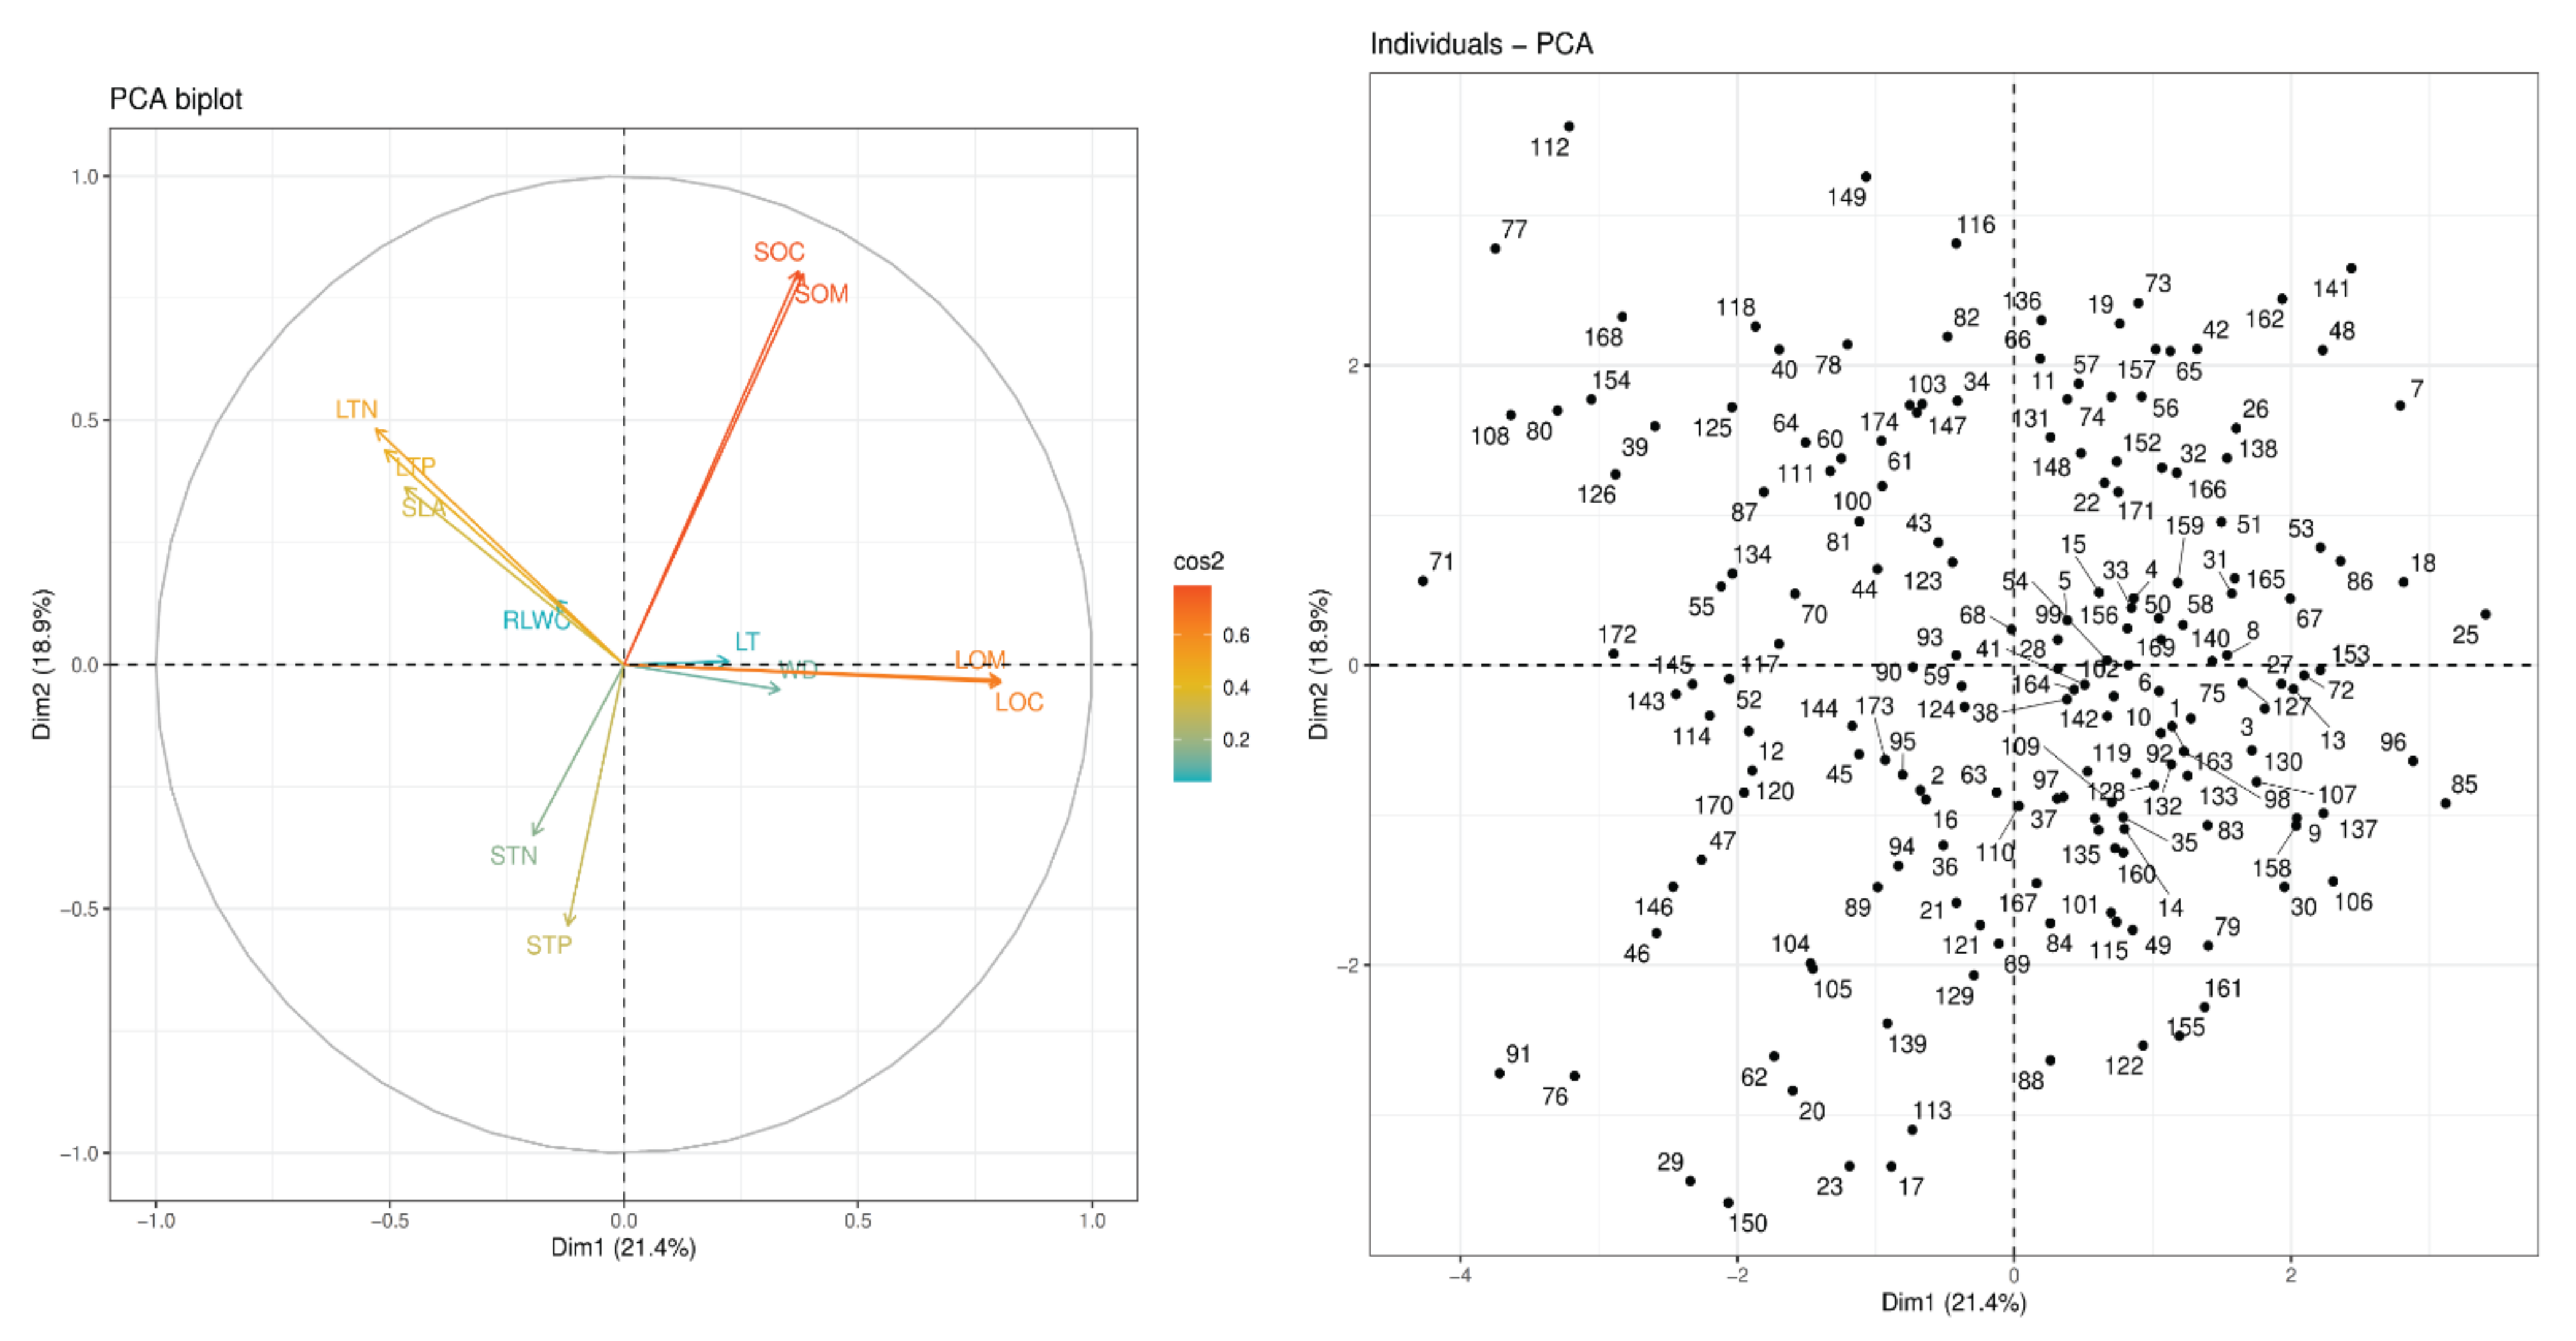
3.1. Principal Component Analysis (PCA) of Plant Functional Traits

In Figure 1, a total of 174 species are represented by circular black dots, while 12 functional traits are represented by vectors, and these vectors are connected to the PCs’ origin (Dim1 = 21.4% and Dim2 = 18.9%) (Figure 1). In the year 2020, the levels of heterogeneity in different species were recorded. LOM and LOC were increased, but LT, WD, SLA, and RLWC were decreased along this axis. In other words, one end of this axis is characterized by high LOM and LOC, while another end is characterized by low RLWC. In one extreme, negative values with the high values of traits (LTN and LTP) were positively correlated with one another and representative of the resource acquisition strategy. At the opposite extreme (positive value) were species with high LOM and LOC. These traits were also positively correlated with one another and indicative of the resource conservation strategy. On the other hand, the second axis of the PCA is defined by the covariance between STN STP, SOC, and SOM. STN and STP were significantly negatively correlated with SOC and SOM, while positively correlated with one another.

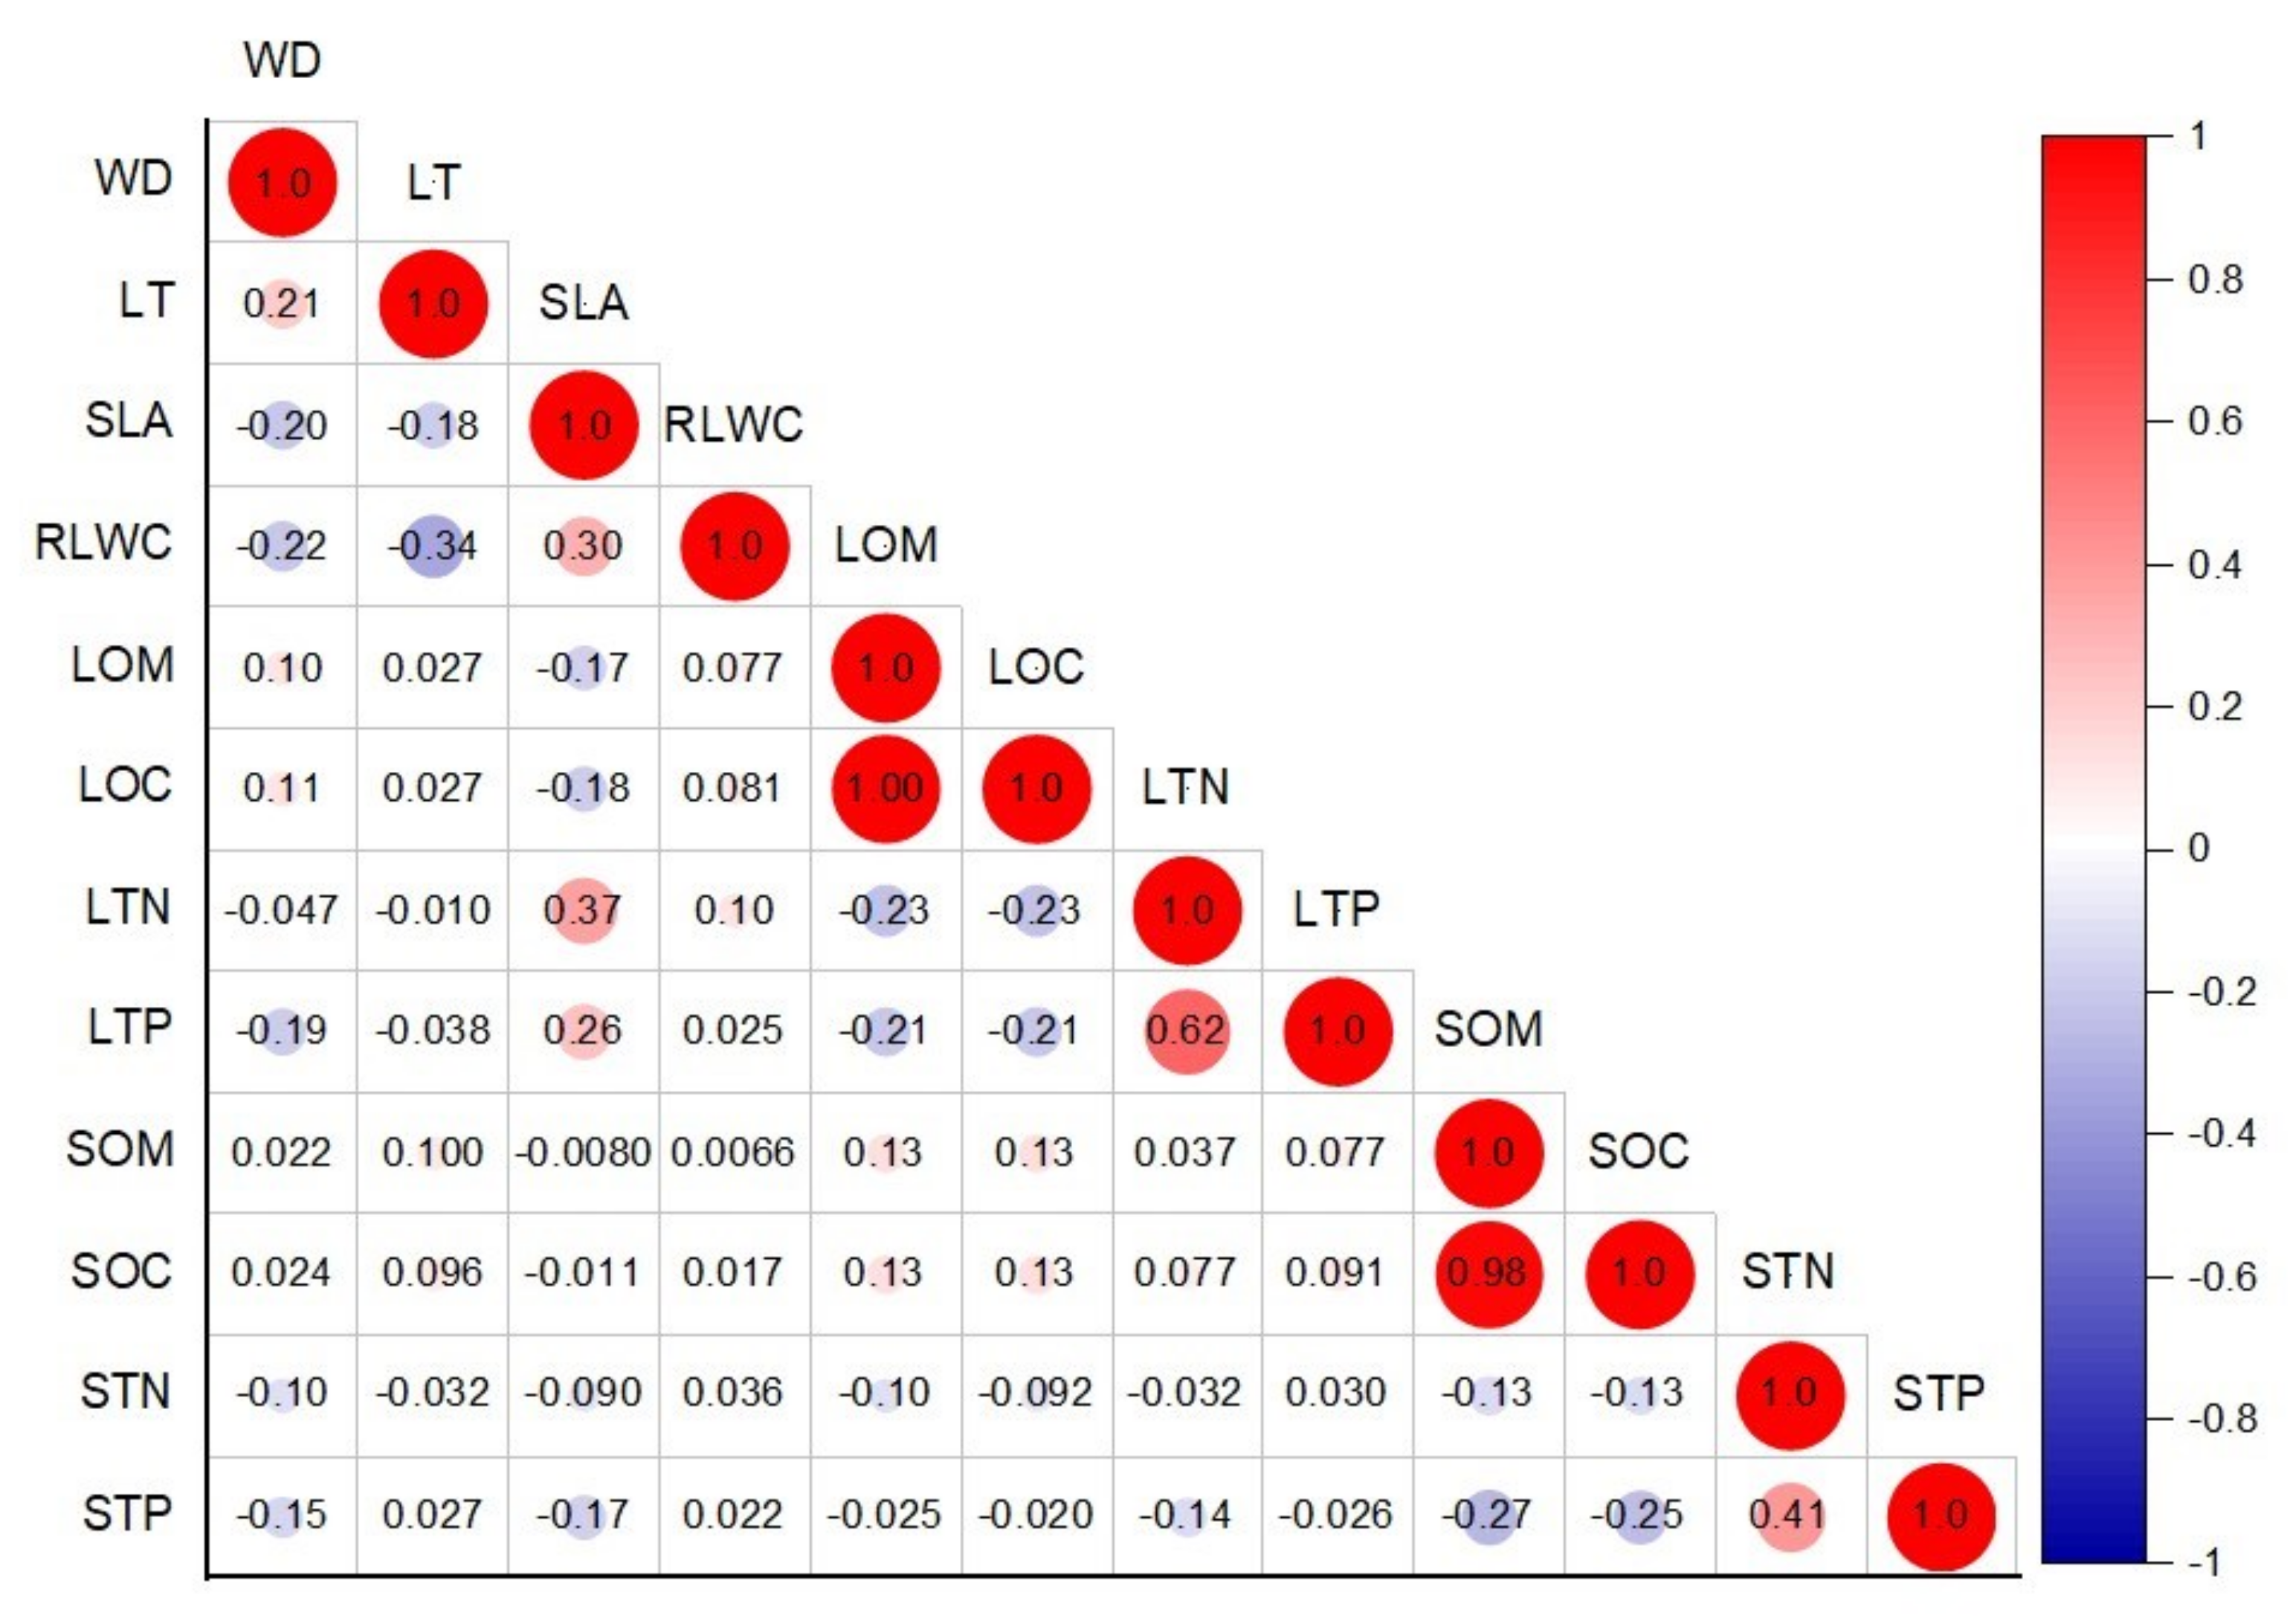
3.2. Multivariate Relationship between Morphological Traits and Nutrient Functional Traits

There was no significant relationship between the plant morphological features (e.g., stems and leaves) and nutrient functional features (Figure 3). Nevertheless, LTN with SLA and STP with LT were positively correlated (n = 174; r = 0.34, p = 0.00; r = 0.12, p = 0.12; Figure 2C,D and Figure 3), and LTP with WD, LOC with SLA, and STP with SLA were negatively correlated (n = 174; r = −0.24, p = 0.00; r = −0.18, p = 0.01; r = −0.16, p = 0.04; Figure 2A,B,E and Figure 3). On the other hand, LOC was positively linked to LOM and had a greater value, and SOC with SOM was also likely positively related and shows a higher value. STN was negatively correlated with SOM, SOC, and LOM and had a weak relationship (Figure 3).

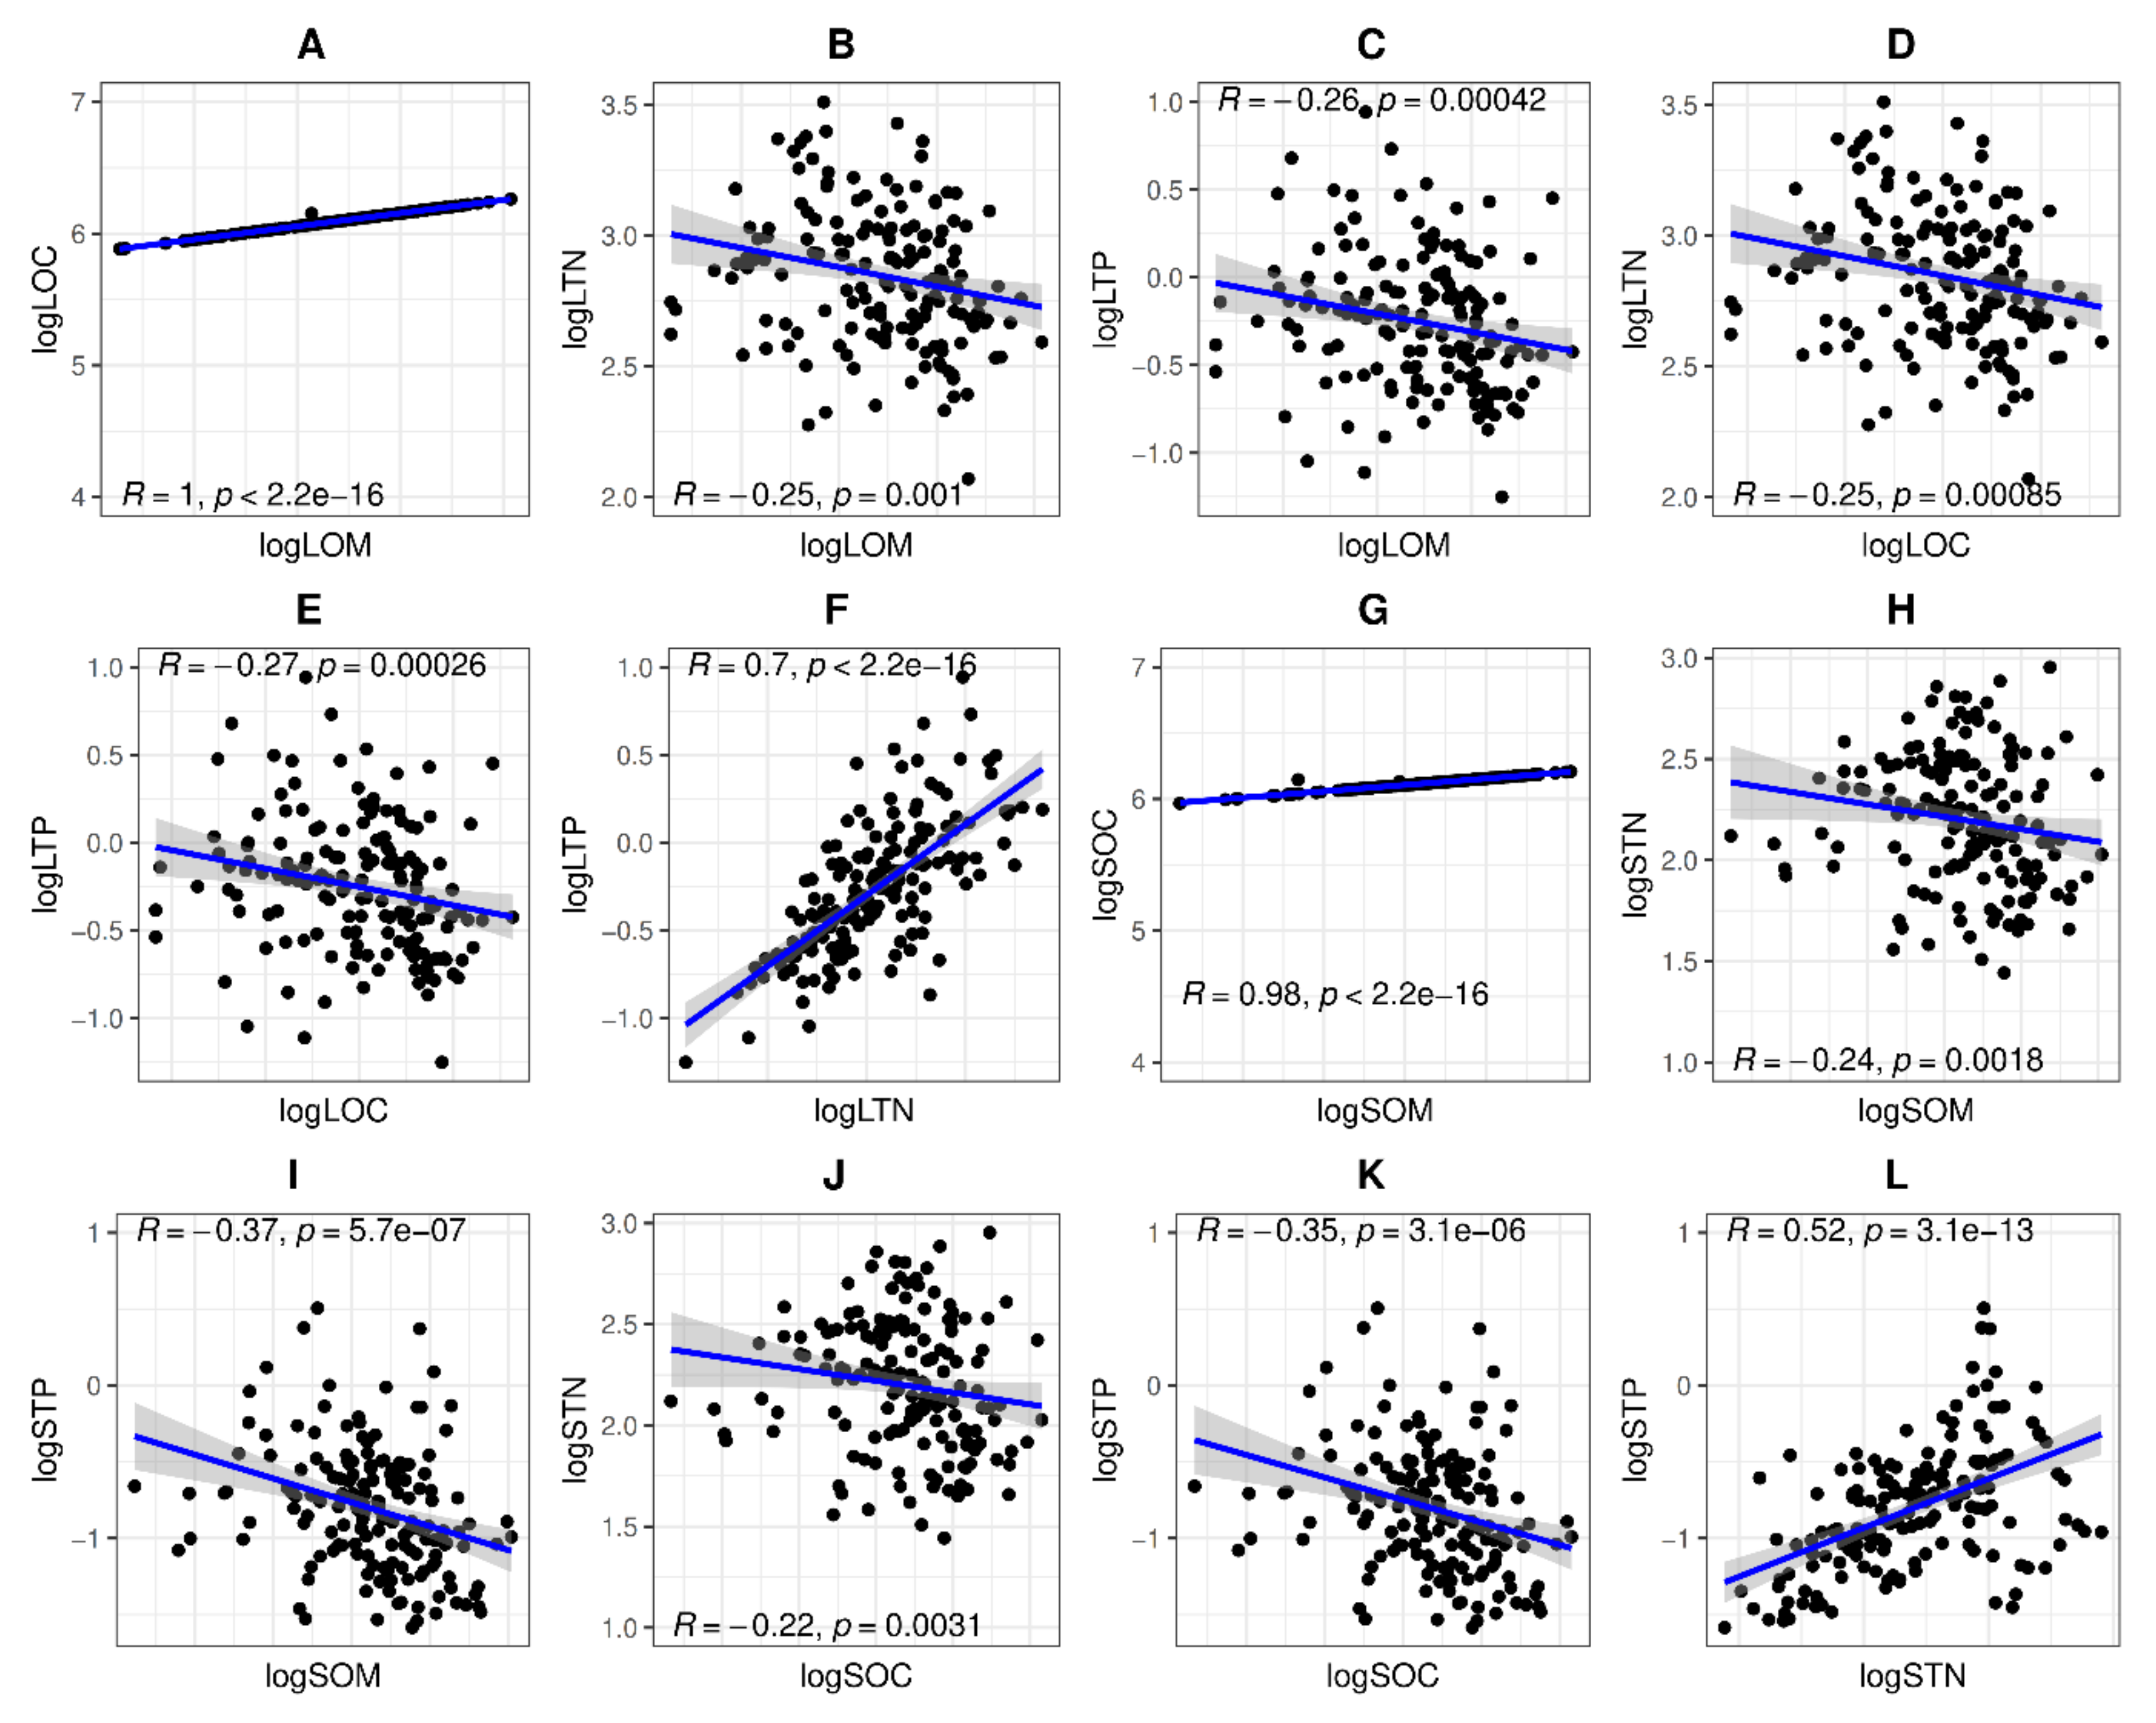
3.3. Bivariate Relationship between Functional Features

There were no significant connections between plant morphological attributes (Figure 4). However, logSLA with logWD (r = −0.19, p = 0.00), logRLWC with logWD (r = −0.28, p = 0.00), logSLA with logLT (r = −0.67, p = 0.00), and logRLWC with logLT (r = −0.22, p = 0.00) were significantly negatively correlated.

3.4. Bivariate Relationship between Nutrient Functional Attributes of Aboveground Vegetative Organs

There were no significant correlations between the nutrient functional attributes of woody species and aboveground vegetative parts in the tropical coastal secondary forest (Figure 5). However, logLOC with logLOM (r = 1, p = 0.00), logLTP with logLTN (r = 0.7, p = 0.00), logSOC with logSOM (r = 0.98, p = 0.00), and logSTP with logSTN (r = 0.52, p = 0.00) were significantly positively correlated (Figure 5). Meanwhile, logLTN with logLOM (r = −0.25, p= 0.001), logLTP with logLOM (r =−0.26, p = 0.00), logLTN with logLOC (r =−0.25, p = 0.00), logLTP with logLOC (r = −0.27, p = 0.00), logSTN with logSOM (r = −0.24, p = 0.00), logSTP with logSOM (r = −0.37, p = 0.00), logSTN with logSOC (r = −0.22, p = 0.00), and logSTP with logSOC (r = −0.35, p = 0.00) were significantly negatively correlated (Figure 5).

4. Discussion

4.1. Principal Component Analysis (PCA) of Plant Functional Traits

Prior studies have extensively investigated the LES, although it is still controversial if PES is completely present in leaves [13,15]. By analyzing the variations along with correlations in leaf and stem properties in tropical coastal secondary forests, we found that stems and leaves collectively evolved along a fast–slow economic spectrum, supporting our hypothesis. Whereas it has been confirmed in a few studies that there is a decoupling of evolutionary and ecological adaptations between leaves and stems [42], the coordinated variations between leaves and stems attributes are consistent with the findings of earlier studies [43,44] (Figure 1).
Our investigation demonstrated patterns of 12 functional attributes of plant variations. This is important for understanding succession and community assembly processes in the tropical coastal secondary forests of Hainan Island.
A positive relationship was found between plant functional traits such as SLA, LN, and LP, while a negative relationship was found with LMA, LT, and WD [40]. Based on the concept of leaf economic spectrum, leaf nitrogen and phosphorus content are expected to be strongly positively linked to the SLA of woody tree species found in dry tropical forests [16]. The above findings were not corroborated with our results. We determined that SLA, LTN, and LTP had a negative association with each other, whereas they had a positive relationship with WD, LT, and LOC (Figure 1).

4.2. Multivariate Relationship between Morphological Traits and Nutrient Functional Traits

These coordinated trait differences show an ecological trade-off between the use of accumulative and conservative resources [45]. With the higher LT, WD, and LOC, the resource-acquisitive species (i.e., Bridelia balansae and camellia furfuracea) are categorized by a strong photosynthetic volume and rapid growth rates in a short lifecycle. In contrast, SLA, LTN, and LTP (e.g., Pterospermum heterophyllum, Ficus subpisocarpa, and Clerodendrum cyrtophyllum) are categorized by a weak photosynthetic volume, slow growth rate, and long lifecycle [45]. Moreover, LT was significantly positively correlated with WD, while negatively related to SLA [41] (Figure 3). Long et al. (2020) [45] found a positive significant association between LMA (leaf mass area) and WD, while in our results, we found a negative association between SLA and WD (Figure 3).
These patterns could be explained by the distinct natural environmental conditions present in the tropical monsoonal dwarf forest, i.e., typhoon disturbances and human disturbances such as slash and burn [27]. Some species provide more stem structure to modulate stem and leaf strength (or persistence) and improve flora stability [42]. Some species require resource efficiency and resilience when the microenvironment is challenging. For example, species that live in the canopy or species that are common on windward sides need to adapt to natural disasters (e.g., stronger winds and typhoons) [46]. Furthermore, these woody trees may decrease their tissue density and rigidity, for instance, to strengthen their resilience, but this comes at the expense of using fewer resources for photosynthesis and respiration [34,47].

4.3. Bivariate Relationship between Functional Features and Nutrient Functional Features of Aboveground Vegetative Organs

Bivariate correlation between plant morphological traits such as LMA versus WD was found to be significantly positively correlated [45]. Nonetheless, we found dissimilar results that logSLA versus logWD had a significantly negative association (Figure 4A). Some functional traits such as WD and SLA are globally considered to be fundamental functional traits that explain plant growth rates [48]. A high WD is related to a slow potential growth rate, indicating a high level of competitive tolerance and a strong competitive effect. Moreover, specific leaf area (SLA) is an important functional trait that reflects trade-offs between resource acquisition and conservation and has been found to play an important role in plant community assembly [49]. Conversely, it is revealed that there is a negative connection between logSLA and logLT [41,50,51] (Figure 4C). Water stress limits transpiration, such as stomatal closure and the evaporation of water from the leaf surface, so leaf water content is a very important parameter in determining plant drought and salinity tolerance. Water stress also affects plant photosynthesis and productivity [52]. Aguilar-Peralta et al. (2022) [53] further found a positive association between LDMC (leaf dry matter content) and LT, while our findings did not corroborated them. Similarly, logRLWC had a negative association with logLT (Figure 4D). Marod et al. [54] revealed that WD was negatively related to LDMC. Our results also indicated the same findings that logRLWC has a negatively significant relationship with logWD (Figure 4B).
Functional traits include LN and LP concentrations, N/P ratios, and leaves. Plants evolve by both ecological filtering and evolution [55]. It is known as a quantitative indicator of fitness. SLA is the focus of more consideration [56,57]. Nutrient functional traits, e.g., N and P concentrations in leaves (based on mass or based on area), indicate the TN and TP content per unit of dry mass (mass-based, mg g1) or per unit of leaf area (area-based, g m−2). In contrast, SLA is the one-sided area of the leaf (cm2 g1) per unit of dry mass [58], and reflects the expected yield rate (shaded or light-blocking area) per unit of resource (such as carbon and nutrients) increased investment [28]. Species-specific attributes like SLA and the number of nutrients in the leaves are species-specific attributes that change across environmental gradients [35,59]. Yang et al. (2021) [51] documented the positive bivariate relationship between SLA with LN and SLA with LP. Our result also shows that SLA was positively and significantly linked to LTN (Figure 2C), while SLA was negatively linked to STP (stem total phosphorus) (Figure 2E). Moreover, Messier et al. [60] reported that LT with LPC as well as LCC with LMA had a negative association. Meanwhile, we found that logLT was positively linked to logSTP, but logLOC was negatively related to logSLA (Figure 2B,D).
Drenovsky et al. (2013) [61] revealed that plants had a lower LP (leaf phosphorus) content with low availability of water. Conversely, plants facing this treatment showed a high photosynthetic P utilization efficiency. This is a particularly important trait for species derived from serpentine soil, where seeds tend to have much less availability of P collected [61]. It is possible that, because of the mobility of these nutrients, they could create differences in leaf chemistry. Hao et al. [62] demonstrated that LN (leaf nitrogen) and LC (leaf carbon) had a negative association. Our findings also show a negative correlation between logLTN and logLOC (Figure 5D). Soil nutrients such as nitrogen have high mobility. It can be easily absorbed from the soil because it continues to transpire even under drought conditions. Contrarily, phosphorus is relatively immobile, which limits the quantity that can be absorbed, especially in low water situations [63]. LogLTN was significantly positively connected with logLTP (Figure 5F) [64]. On the other hand, a negative relationship was found between LPC and LCC [61]. Our observations are supported by these findings, as logLOC and logLTP were significantly negatively correlated (Figure 5E). The variation and distribution of nutrients between organs of the plant have been affected by several factors, i.e., environmental control, plant functional groups, and evolutionary history [65,66,67,68]. Although metabolic organs (leaves) and structural organs (roots and stems) play an important role in different ways, concentrations of N and P have been consistently associated with different plant nutrient organisms [66]. Luo et al. [69] reported that N and P concentrations were all greater in leaves as compared with stems and roots among different life forms. In contrast, the logSTP versus logSTN relationship was found to be positively and significantly increased (Figure 5L).

5. Conclusions

We discovered a PES with leaf and stem traits in the Tongguling National Nature Reserve (TNNR) tropical coastal secondary forest, reflecting a trade-off between resource-acquisitive and resource conservation management (Figure 6). Such a significant ecological trade-off can be generated because of extreme environmental pressure that species must modify on a regional scale. We also detected that LTN and STP were significantly positively linked to plant aboveground vegetative organs, e.g., SLA and LT. Our evidence suggests that whole plants in this secondary forest may react to environmental conditions on a regional scale in composite ways by evolving multiple strategies associated with various features and parts. This may be because of the fact that there are several factors associated with environmental stress in this tropical secondary forest. Overall, by considering the morphological and nutrient properties of stems and leaves, our results contribute to an awareness of PES and ecological trade-offs in tropical coastal secondary growth forest communities and contribute to the development of this forest. This study may provide important insights into species’ coexistence and community assembly in coastal areas. Moreover, these results can guide habitat restoration and green infrastructure design, suggesting that selecting different species across multiple trait axes can help ensure maximum functionality.

Supplementary Materials

The following supporting information can be downloaded at: https://www.mdpi.com/article/10.3390/d14100823/s1, Table S1: Shifts in community vegetative organs and their dissimilar trade-off patterns in a tropical coastal secondary forest, Hainan Island, Southern China.

Author Contributions

M.Y. and W.L. conceived the research ideas; H.A.N., F.K. and S.B. classified the vegetation datasets and wrote the paper with contributions; M.Y. prepared and analyzed the environmental variables; W.L. rigorously checked and revised the manuscript; all authors discussed the results and commented on the manuscript. All authors have read and agreed to the published version of the manuscript.

Funding

This research was funded by the National Key Research and Development Program of China (2021YFD2200403).

Institutional Review Board Statement

Not applicable.

Informed Consent Statement

Not applicable.

Data Availability Statement

Not applicable.

Acknowledgments

We are obliged to our lab fellows for their generous cooperation, and especially to Rana Ahmer Javaid (The Islamia University of Bahawalpur, Punjab, Pakistan), who supported us throughout this project.

Conflicts of Interest

The authors declare no conflict of interest.

References

  1. Cornelissen, J.H.C.; Lavorel, S.; Garnier, E.; Díaz, S.; Buchmann, N.; Gurvich, D.E.; Reich, P.B.; Ter Steege, H.; Morgan, H.D.; Van Der Heijden, M.G.A.; et al. A handbook of protocols for standardized and easy measurement of plant functional traits worldwide. Aust. J. Bot. 2003, 51, 335–380. [Google Scholar] [CrossRef]
  2. Westoby, M.; Wright, I.J. Land-plant ecology on the basis of functional traits. Trends Ecol. Evol. 2006, 21, 261–268. [Google Scholar] [CrossRef] [PubMed]
  3. Garnier, E.; Navas, M.L. A trait-based approach to comparative functional plant ecology: Concepts, methods and applications for agroecology. Agron. Sustain. Dev. 2012, 32, 365–399. [Google Scholar] [CrossRef]
  4. Westoby, M.; Falster, D.S.; Moles, A.T.; Vesk, P.A.; Wright, I.J. Plant ecological strategies: Some leading dimensions of variation between species. Annu. Rev. Ecol. Syst. 2002, 33, 125–159. [Google Scholar] [CrossRef]
  5. Diaz, S.; Hodgson, J.G.; Thompson, K.; Cabido, M.; Cornelissen, J.H.; Jalili, A.; Montserrat-Martí, G.; Grime, J.P.; Zarrinkamar, F.; Asri, Y.; et al. The plant traits that drive ecosystems: Evidence from three continents. J. Veg. Sci. 2004, 15, 295–304. [Google Scholar] [CrossRef]
  6. Freschet, G.T.; Cornelissen, J.H.C.; van Logtestijn, R.S.P.; Aerts, R. Evidence of the ‘plant economics spectrum’ in a subarctic flora. J. Ecol. 2010, 98, 362–373. [Google Scholar] [CrossRef]
  7. He, Z.; Webster, S.; He, S.Y. Growth–defense trade-offs in plants. Curr. Biol. 2022, 32, R634–R639. [Google Scholar] [CrossRef]
  8. Figueroa-Macías, J.P.; García, Y.C.; Núñez, M.; Díaz, K.; Olea, A.F.; Espinoza, L. Plant growth-defense trade-offs: Molecular processes leading to physiological changes. Int. J. Mol. Sci. 2021, 22, 693. [Google Scholar] [CrossRef]
  9. Weiner, J.; Campbell, L.G.; Pino, J.; Echarte, L. The allometry of reproduction within plant populations. J. Ecol. 2009, 97, 1220–1233. [Google Scholar] [CrossRef]
  10. Poorter, H.; Niklas, K.J.; Reich, P.B.; Oleksyn, J.; Poot, P.; Mommer, L. Biomass allocation to leaves, stems and roots: Meta-analyses of interspecific variation and environmental control. New Phytol. 2012, 193, 30–50. [Google Scholar] [CrossRef]
  11. Poorter, L.; Wright, S.J.; Paz, H.; Ackerly, D.D.; Condit, R.; Ibarra-Manríquez, G.; Harms, K.E.; Licona, J.C.; Martinez-Ramos, M.; Mazer, S.J.; et al. Are functional traits good predictors of demographic rates? Evid. Five Neotrop. For. Ecol. 2008, 89, 1908–1920. [Google Scholar] [CrossRef]
  12. Cornwell, W.K.; Ackerly, D.D. Community assembly and shifts in the distribution of functional trait values across an environmental gradient in coastal California. Ecol. Monogr. 2009, 79, 109–126. [Google Scholar] [CrossRef]
  13. Baraloto, C.; Timothy Paine, C.E.; Poorter, L.; Beauchene, J.; Bonal, D.; Domenach, A.M.; Hérault, B.; Patiño, S.; Roggy, J.C.; Chave, J. Decoupled leaf and stem economics in rain forest trees. Ecol. Lett. 2010, 13, 1338–1347. [Google Scholar] [CrossRef] [PubMed]
  14. Shen, Y.; Umaña, M.N.; Li, W.; Fang, M.; Chen, Y.; Lu, H.; Yu, S. Coordination of leaf, stem and root traits in determining seedling mortality in a subtropical forest. For. Ecol. Manag. 2019, 446, 285–292. [Google Scholar] [CrossRef]
  15. Prieto, I.; Roumet, C.; Cardinael, R.; Dupraz, C.; Jourdan, C.; Kim, J.H.; Maeght, J.L.; Mao, Z.; Pierret, A.; Portillo, N.; et al. Root functional parameters along a land-use gradient: Evidence of a community-level economics spectrum. J. Ecol. 2015, 103, 361–373. [Google Scholar] [CrossRef]
  16. Wright, I.J.; Reich, P.B.; Westoby, M.; Ackerly, D.D.; Baruch, Z.; Bongers, F.; Cavender-Bares, J.; Chapin, T.; Cornelissen, J.H.; Diemer, M.; et al. The worldwide leaf economics spectrum. Nature 2004, 428, 821–827. [Google Scholar] [CrossRef] [PubMed]
  17. Pierce, S.; Brusa, G.; Vagge, I.; Cerabolini, B.E.L. Allocating CSR plant functional types: The use of leaf economics and size traits to classify woody and herbaceous vascular plants. Funct. Ecol. 2013, 27, 1002–1010. [Google Scholar] [CrossRef]
  18. Li, L.E.; McCormack, M.L.; Ma, C.; Kong, D.; Zhang, Q.; Chen, X.; Guo, D. Leaf economics and hydraulic traits are decoupled in five species-rich tropical-subtropical forests. Ecol. Lett. 2015, 18, 899–906. [Google Scholar] [CrossRef]
  19. Chave, J.; Coomes, D.; Jansen, S.; Lewis, S.L.; Swenson, N.G.; Zanne, A.E. Towards a worldwide wood economics spectrum. Ecol. Lett. 2009, 12, 351–366. [Google Scholar] [CrossRef]
  20. Zanne, A.E.; Westoby, M.; Falster, D.S.; Ackerly, D.D.; Loarie, S.R.; Arnold, S.E.; Coomes, D.A. Angiosperm wood structure: Global patterns in vessel anatomy and their relation to wood density and potential conductivity. Am. J. Bot. 2010, 97, 207–215. [Google Scholar] [CrossRef] [Green Version]
  21. Díaz, S.; Kattge, J.; Cornelissen, J.H.; Wright, I.J.; Lavorel, S.; Dray, S.; Gorné, L.D. The global spectrum of plant form and function. Nature 2016, 529, 167–171. [Google Scholar] [CrossRef] [PubMed]
  22. Pratt, R.B.; Jacobsen, A.L.; Ewers, F.W.; Davis, S.D. Relationships among xylem transport, biomechanics and storage in stems and roots of nine Rhamnaceae species of the California chaparral. New Phytol. 2007, 174, 787–798. [Google Scholar] [CrossRef] [PubMed]
  23. Marschner, H.; Kirkby, E.A.; Cakmak, I. Effect of mineral nutritional status on shoot-root partitioning of photoassimilates and cycling of mineral nutrients. J. Exp. Bot. 1996, 47, 1255–1263. [Google Scholar] [CrossRef]
  24. Kramer-Walter, K.R.; Bellingham, P.J.; TMillar, R.; Smissen, R.D.; Richardson, S.J.; Laughlin, D.C. Root traits are multidimensional: Specific root length is independent from root tissue density and the plant economic spectrum. J. Ecol. 2016, 104, 1299–1310. [Google Scholar] [CrossRef]
  25. Weemstra, M.; Mommer, L.; Visser, E.J.; van Ruijven, J.; Kuyper, T.W.; Mohren, G.M.; Sterck, F.J. Towards a multidimensional root trait framework: A tree root review. New Phytol. 2016, 211, 1159–1169. [Google Scholar] [CrossRef]
  26. Oberleitner, F.; Egger, C.; Oberdorfer, S.; Dullinger, S.; Wanek, W.; Hietz, P. Recovery of aboveground biomass, species richness and composition in tropical secondary forests in SW Costa Rica. For. Ecol. Manag. 2021, 479, 118580. [Google Scholar] [CrossRef]
  27. Long, C.; Yang, X.; Long, W.; Li, D.; Zhou, W.; Zhang, H. Soil nutrients influence plant community assembly in two tropical coastal secondary forests. Trop. Conserv. Sci. 2018, 11, 1940082918817956. [Google Scholar] [CrossRef]
  28. Waring, B.G.; Becknell, J.M.; Powers, J.S. Nitrogen, phosphorus, and cation use efficiency in stands of regenerating tropical dry forest. Oecologia 2015, 178, 887–897. [Google Scholar] [CrossRef]
  29. Long, W.; Zang, R.; Wang, X.; Bahadur, S. Environmental Characteristics in Tropical Cloud Forests. In Tropical Cloud Forest Ecology in Hainan Island; Springer: Singapore, 2022; pp. 3–12. [Google Scholar]
  30. Bahadur, S.; Taj, S.; Long, W.; Ahmad, M. Pollen morphology and its implication in the taxonomy of some selected tribes of the Asteraceae of Hainan Island South China. Bot. Rev. 2022, 88, 271–298. [Google Scholar] [CrossRef]
  31. Bahadur, S.; Taj, S.; Long, W.; Ahmad, M. Pollen morphology and its implication in the taxonomy of some selected taxa of the bi and tri-ovulate Euphorbiaceae of the Hainan Island by using multiple microscopic techniques. Microsc. Res. Tech. 2022, 85, 2045–2060. [Google Scholar] [CrossRef]
  32. Bahadur, S.; Taj, S.; Long, W.; Hanif, U. Pollen Morphological Peculiarities of Selected Mimosoideae Taxa of Hainan Island and Their Taxonomic Relevance. Agronomy 2022, 12, 1122. [Google Scholar] [CrossRef]
  33. Agrawal, A.A.; Fishbein, M. Plant defense syndromes. Ecology 2006, 87, S132–S149. [Google Scholar] [CrossRef]
  34. Poorter, H.; Niinemets, Ü.; Poorter, L.; Wright, I.J.; Villar, R. Causes and consequences of variation in leaf mass per area (LMA): A meta-analysis. New Phytol. 2009, 182, 565–588. [Google Scholar] [CrossRef] [PubMed]
  35. Vendramini, F.; Díaz, S.; Gurvich, D.E.; Wilson, P.J.; Thompson, K.; Hodgson, J.G. Leaf traits as indicators of resource-use strategy in floras with succulent species. New Phytol. 2002, 154, 147–157. [Google Scholar] [CrossRef]
  36. Long, W.; Yang, X.; Li, D. Patterns of species diversity and soil nutrients along a chrono sequence of vegetation recovery in Hainan Island, South China. Ecol. Res. 2012, 27, 561–568. [Google Scholar] [CrossRef]
  37. Cornwell, W.K.; Schwilk, D.W.; Ackerly, D.D. A trait-based test for habitat filtering: Convex hull volume. Ecology 2006, 87, 1465–1471. [Google Scholar] [CrossRef]
  38. Bu, W.S.; Zang, R.G.; Ding, Y. Field observed relationship between biodiversity and ecosystem functioning during secondary succession in a tropical lowland rainforest. Acta Oecol. 2014, 55, 1–7. [Google Scholar] [CrossRef]
  39. Jin, X.; Shi, C.; Yu, C.Y.; Yamada, T.; Sacks, E.J. Determination of leaf water content by visible and near-infrared spectrometry and multivariate calibration in Miscanthus. Front. Plant Sci. 2017, 8, 721. [Google Scholar] [CrossRef]
  40. Yang, Y.; Xiao, C.; Wu, X.; Long, W.; Feng, G.; Liu, G. Differing Trade-Off Patterns of Tree Vegetative Organs in a Tropical Cloud Forest. Front. Plant Sci. 2021, 12, 680379. [Google Scholar] [CrossRef]
  41. Warton, D.I.; Wright, I.J.; Falster, D.S.; Westoby, M. Bivariate line-fitting methods for allometry. Biol. Rev. 2006, 81, 259–291. [Google Scholar] [CrossRef]
  42. Fortunel, C.; Fine, P.V.A.; Baraloto, C. Leaf, stem and root tissue strategies across 758 neotropical tree species. Funct. Ecol. 2012, 26, 1153–1161. [Google Scholar] [CrossRef]
  43. Reich, P.B.; Cornelissen, H. The world–wide ‘fast–slow’ plant economics spectrum: A traits manifesto. J. Ecol. 2014, 102, 275–301. [Google Scholar] [CrossRef]
  44. de la Riva, E.G.; Tosto, A.; Pérez-Ramos, I.M.; Navarro-Fernández, C.M.; Olmo, M.; Anten, N.P.; Villar, R. A plant economics spectrum in Mediterranean forests along environmental gradients: Is there coordination among leaf, stem and root traits? J. Veg. Sci. 2016, 27, 187–199. [Google Scholar] [CrossRef]
  45. Long, W.; Zhou, Y.; Schamp, B.S.; Zang, R.; Yang, X.; Poorter, L.; Xiong, M. Scaling relationships among functional traits are similar across individuals, species, and communities. J. Veg. Sci. 2020, 31, 571–580. [Google Scholar] [CrossRef]
  46. Zheng, J.M.; Martínez-Cabrera, H.I. Wood anatomical correlates with the theoretical conductivity and wood density across China: Evolutionary evidence of the functional differentiation of axial and radial parenchyma. Ann. Bot. 2013, 112, 927–935. [Google Scholar] [CrossRef]
  47. Long, W.X.; Zang, R.G.; Schamp, B.S.; Ding, Y. Within- and among species variation in specific leaf area drive community assembly in a tropical cloud forest. Oecologia 2011, 167, 1103–1113. [Google Scholar] [CrossRef]
  48. Hanley, M.E.; Lamont, B.B.; Fairbanks, M.M.; Rafferty, C.M. Plant structural traits and their role in anti-herbivore defence. Perspect. Plant Ecol. Evol. Syst. 2007, 8, 157–178. [Google Scholar] [CrossRef]
  49. Conti, L.; Block, S.; Parepa, M.; Münkemüller, T.; Thuiller, W.; Acosta, A.T.; Carboni, M. Functional trait differences and trait plasticity mediate biotic resistance to potential plant invaders. J. Ecol. 2018, 106, 1607–1620. [Google Scholar] [CrossRef]
  50. Kunstler, G.; Falster, D.; Coomes, D.A.; Hui, F.; Kooyman, R.M.; Laughlin, D.C.; Westoby, M. Plant functional traits have globally consistent effects on competition. Nature 2016, 529, 204–207. [Google Scholar] [CrossRef]
  51. Yang, L.; Zhao, H.; Zuo, Z.; Li, X.; Yu, D.; Wang, Z. Generality and Shifts in Leaf Trait Relationships Between Alpine Aquatic and Terrestrial Herbaceous Plants on the Tibetan Plateau. Front. Ecol. Evol. 2021, 9, 409. [Google Scholar] [CrossRef]
  52. Arndt, S.K.; Irawana, A.; Sanders, G.J. Apoplastic water fraction and rehydration techniques introduce significant errors in measurements of relative water content and osmotic potential in plant leaves. Physiol. Plant. 2015, 155, 355–368. [Google Scholar] [CrossRef] [PubMed]
  53. Aguilar-Peralta, J.S.; Maldonado-López, Y.; Espírito-Santo, M.M.; Reyes-Chilpa, R.; Oyama, K.; Fagundes, M.; Cuevas-Reyes, P. Contrasting successional stages lead to intra-and interspecific differences in leaf functional traits and herbivory levels in a Mexican tropical dry forest. Eur. J. For. Res. 2022, 141, 225–239. [Google Scholar] [CrossRef]
  54. Marod, D.; Sungkaew, S.; Mizunaga, H.; Thongsawi, J. Association of community-level traits with soil properties in a tropical coastal sand dune. Environ. Nat. Resour. J. 2020, 18, 101–109. [Google Scholar] [CrossRef]
  55. Chapin, F.S., III; Autumn, K.; Pugnaire, F. Evolution of suites of traits in response to environmental stress. Am. Nat. 1993, 142, S78–S92. [Google Scholar] [CrossRef]
  56. Sun, L.; Yang, G.; Zhang, Y.; Qin, S.; Dong, J.; Cui, Y.; Wang, R. Leaf functional traits of two species affected by nitrogen addition rate and period not nitrogen compound type in a meadow grassland. Front. Plant Sci. 2022, 13. [Google Scholar] [CrossRef]
  57. Moor, H.; Rydin, H.; Hylander, K.; Nilsson, M.B.; Lindborg, R.; Norberg, J. Towards a trait-based ecology of wetland vegetation. J. Ecol. 2017, 105, 1623–1635. [Google Scholar] [CrossRef]
  58. Perez-Harguindeguy, N.; Diaz, S.; Garnier, E.; Lavorel, S.; Poorter, H.; Jaureguiberry, P.; Cornelissen, J.H.C. New handbook for standardised measurement of plant functional traits worldwide. Aust. Bot. 2013, 61, 167–234. [Google Scholar] [CrossRef]
  59. Güsewell, S.; Koerselman, W. Variation in nitrogen and phosphorus concentrations of wetland plants. Perspect. Plant Ecol. Evol. Syst. 2002, 5, 37–61. [Google Scholar] [CrossRef]
  60. Messier, J.; Lechowicz, M.J.; McGill, B.J.; Violle, C.; Enquist, B.J. Interspecific integration of trait dimensions at local scales: The plant phenotype as an integrated network. J. Ecol. 2017, 105, 1775–1790. [Google Scholar] [CrossRef]
  61. Drenovsky, R.E.; Koehler, C.E.; Skelly, K.; Richards, J.H. Potential and realized nutrient resorption in serpentine and non-serpentine chaparral shrubs and trees. Oecologia 2013, 171, 39–50. [Google Scholar] [CrossRef] [Green Version]
  62. Hao, M.; Messier, C.; Geng, Y.; Zhang, C.; Zhao, X.; von Gadow, K. Functional traits influence biomass and productivity through multiple mechanisms in a temperate secondary forest. Eur. J. For. Res. 2020, 139, 959–968. [Google Scholar] [CrossRef]
  63. Marschner, H. (Ed.) Marschner’s Mineral Nutrition of Higher Plants; Academic Press: Cambridge, MA, USA, 2011. [Google Scholar]
  64. Chua, S.C.; Potts, M.D. The role of plant functional traits in understanding forest recovery in wet tropical secondary forests. Sci. Total Environ. 2018, 642, 1252–1262. [Google Scholar] [CrossRef] [PubMed]
  65. Li, A.; Guo, D.; Wang, Z.Q.; Liu, H.Y. Nitrogen and phosphorus allocation in leaves, twigs, and fine roots across 49 temperate, subtropical and tropical tree species: A hierarchical pattern. Funct. Ecol. 2010, 24, 224–232. [Google Scholar] [CrossRef]
  66. Han, W.X.; Fang, J.Y.; Reich, P.; Ian Woodward, F.; Wang, Z.H. Biogeography and variability of eleven mineral elements in plant leaves across gradients of climate, soil and plant functional type in China. Ecol. Lett. 2011, 14, 788–796. [Google Scholar] [CrossRef]
  67. He, M.Z.; Song, X.; Tian, F.P.; Zhang, K.; Zhang, Z.S.; Chen, N.; Li, X.R. Divergent variations in concentrations of chemical elements among shrub organs in a temperate desert. Sci. Rep. 2016, 6, 20124. [Google Scholar] [CrossRef] [PubMed]
  68. Yang, Y.; Liu, B.R.; An, S.S. Ecological stoichiometry in leaves, roots, litters and soil among different plant communities in a desertified region of Northern China. Catena 2018, 166, 328–338. [Google Scholar] [CrossRef]
  69. Luo, Y.; Peng, Q.; Li, K.; Gong, Y.; Liu, Y.; Han, W. Patterns of nitrogen and phosphorus stoichiometry among leaf, stem and root of desert plants and responses to climate and soil factors in Xinjiang, China. Catena 2021, 199, 105100. [Google Scholar] [CrossRef]
Figure 1. PCA of 174 tree species according to their functional traits. See Table 1 for trait abbreviations.
Diversity 14 00823 g001
Figure 2. The bivariate relationship among morphological features of woody species’ aboveground vegetative parts in tropical coastal secondary forest. The R and p-values for (A) LTP-WD, (B) LOC-SLA, (C) LTN-SLA, (D) STP-LT, and (E) STP-SLA were derived from linear regression analyses.
Diversity 14 00823 g002
Figure 3. Pearson correlation coefficients of 12 plant functional traits within various components.
Diversity 14 00823 g003
Figure 4. The bivariate association of morphological features of woody species’ aboveground vegetative parts in tropical coastal secondary forest. Showed the relationship between (A) logWD and logSLA, (B) logRLWC and logWD, (C) logSLA and logLT, and (D) logRLWC and logLT. SLA (specific leaf area), WD (wood density), LT (leaf thickness), and RLWC (relative leaf water content) show a significant relationship at the levels of p < 0.05 and p < 0.01 individually.
Diversity 14 00823 g004
Figure 5. The associations between nutrient functional attributes of woody tree species’ aboveground vegetative parts in the tropical coastal secondary forest. LOC, LOM, LTN, LTP, SOC, SOM, STN, STP, and concentration. Showed the relationship between (A) logLOC and logLOM, (B) logLTN and logLOM, (C) logLTP and logLOM, (D) logLTN and logLOC, (E) logLTP and logLOC, (F) logLTP and logLTN, (G) logSOC and logSOM, (H) logSTN and logSOM, (I) logSTP and logSOM, (J) logSTN and logSOC, (K) logSTP and logSOC, (L) logSTP and logSTN.
Diversity 14 00823 g005
Figure 6. Conceptual illustration of the plant economic spectrum (PES).
Diversity 14 00823 g006
Table 1. A list of 12 functional properties and their ecological strategies.
OrganAttributeAbbreviationUnitStrategy
LeafLeaf thickness


Specific leaf area
LT


SLA
mm


mm2 g −1
Resource gain and defense
Resource acquisition and defense
StemLeaf total nitrogen
Leaf organic matter
Leaf organic carbon
Leaf total phosphorus
Relative leaf water content
Wood density
Stem organic matter
Stem organic carbon
Stem total nitrogen
Stem total phosphorus
LTN

LOM

LOC

LTP

RLWC

WD

SOM

SOC

STN

STP
g/kg

g/kg

g/kg

g/kg

%

g cm−3

g/kg

g/kg

g/kg

g/kg
Resource gain and defense

Transport, structure, and defense
Resource gain and defense
Publisher’s Note: MDPI stays neutral with regard to jurisdictional claims in published maps and institutional affiliations.

