Article

Indication of Possible Shifts in Copepod Species Composition in St. Pauls Inlet, a Fjordal Estuary Connected to the Gulf of St. Lawrence

by
Erin N. Stevens
1 and
Christine E. Campbell
2,*
1
Department of Biology, St. Francis Xavier University, Antigonish, NS B2G 2W5, Canada
2
School of Science and Environment, Grenfell Campus, Memorial University of Newfoundland, Corner Brook, NL A2H 6P9, Canada
*
Author to whom correspondence should be addressed.
Diversity 2022, 14(1), 59; https://doi.org/10.3390/d14010059
Submission received: 10 December 2021 / Revised: 11 January 2022 / Accepted: 13 January 2022 / Published: 17 January 2022

Abstract

:
St. Pauls Inlet, a coastal brackish lake/estuary within Gros Morne National Park in Newfoundland and Labrador (Canada), is a semi-enclosed body of water with a narrow 80-m wide opening to the marine Gulf of St. Lawrence and with freshwater input from 24 streams. An initial biological survey of St. Pauls Inlet in 1977/78 during Park planning stages found dominant members of the mesozooplankton community to be copepods of genera Acartia, Calanus, Oithona, and Temora. Subsequent surveys of 2009, 2010, and 2019 found Calanus abundance to be much reduced or absent and low adult microcrustacean (copepods + cladocerans) densities. Recent data suggest that Calanus finmarchicus, a large energy-rich copepod, has declined across the Gulf of St. Lawrence and the wider Northwest Atlantic, with the zooplankton community shifting towards smaller, warm-water copepods This shift is coincident with rising surface sea-surface temperatures in the Atlantic. Mid-July temperatures in the inlet were higher in 2009, 2010, and 2019 compared with 1977. Shifting zooplankton abundances in St. Pauls Inlet, even with reduced exchange with the Gulf, may reflect wider trends in the Northwest Atlantic and be a useful indicator of a changing coastal environment in this national park.

1. Introduction

Many types of nearshore coastal waters are broadly estuarine in nature [1,2] with the intermingling of fresh and salt water. Such estuaries or brackish systems can be of great importance to a variety of ecosystems and may experience ecological alterations due to changing climate. Microcrustacean zooplankton such as copepods are key players in estuaries and other aquatic food webs, transferring energy from the microbial food web and primary producers up to higher trophic levels [3]. Although estuarine environments often have fewer species and thus lower biodiversity compared with marine or freshwater systems [4], those estuarine zooplankton that are able to tolerate the brackish salinities often show high and variable abundances and can support higher levels of tertiary (fish) productivity. Therefore, it is important to understand what type of zooplankton community is present within inlets and related estuarine systems, due to its potential to contribute to the larger marine ecosystem.
St. Pauls Inlet is a large brackish system on the west coast of the island of Newfoundland, Canada. This fjordal-type estuary [1,5] lies partially within Gros Morne National Park (GMNP) and is a semi-enclosed body of water with a narrow 80 m wide opening to the Northwest Atlantic. The basin receives freshwater input from 24 streams, the largest at the inlet head [6]. Esquiman Channel, the neritic feature of the Gulf of St. Lawrence closest to St. Pauls Inlet, has salinity concentrations ranging from 32–36‰ [7] and low nutrient concentrations compared to other regions of the Gulf [8]. The inflow of salt water into the inlet from the Gulf of St. Lawrence generally occurs only during the higher ranges of the tidal cycle. Investigation of zooplankton communities in coastal national parks such as GMNP is valuable as zooplankton can be useful bioindicators for tracking environmental changes in temperature and salinity [9].
An investigation was undertaken to determine whether St. Pauls Inlet could serve to track changes over time and correlate with environmental changes seen in the wider Atlantic. Scientific biological surveys of St. Pauls Inlet were first carried out during the summer of 1977 as well as in the spring of 1978 by Carter and MacGregor [10], following the establishment of GMNP in 1973. Zooplankton species composition and semi-quantitative abundances were determined at that time. There was no further exploration of the plankton community until we carried out our survey 31 years later in 2009 and 2010 (spring and summer of both years) [11] with additional sampling in July 2019. The purpose of our study was first to document any temporal differences in zooplankton species composition or relative abundance based on the four data sets and then evaluate likely causative environmental factors on a larger regional scale.

2. Materials and Methods

St. Pauls Inlet (Figure 1), located on insular Newfoundland’s Great Northern Peninsula, is 11 km long and 6 km wide at the widest point. The surface area of the inlet is 34 km2 with a maximum depth of 36 m and a mean depth of 13.6 m. The inlet can be classified as a positive fjordal-type estuary [1] with a tectonic overprint from glacial isostatic rebound [12]. There is a shallow (<6 m deep) sill at the entry, derived from a terminal moraine, a feature that marks the maximum advance of glaciation during the most recent ice age. The basin has characteristic steep-sided walls with relatively shallow outer portions exiting out into a low-lying coastal plain [6].
Due to the restricted size (80 m wide) of the natural opening to the sea (St. Paul’s Bay to the Gulf of St. Lawrence (GSL)), there can be a significant tidal velocity of 2 to 8 knots at the mouth of the inlet with estimated tidal amplitude of 0.6 to 0.9 m [10]. However, the tidal amplitude decreases rapidly further into the inlet meaning that most of the water body is essentially non-tidal.
In the initial zooplankton survey (methods outlined in Table 1), Carter and MacGregor sampled four open-water locations along the inlet (Figure 1) once in summer (July 1977) and in spring (May 1978), as well as a site (Eastern Brook Beach) closer to shore. Water salinity and temperature were measured in the field with a Hydrolab meter. We sampled zooplankton at the same four open-water sites using both horizontal and vertical tows (Table 1), in biweekly surveys in 2009–2010 (June–August of both years) and vertical tows alone in July 2019. Water salinity and temperature were measured with a YSI® 85 Probe. For logistical reasons, we did not sample at Eastern Brook Beach (between Head of Inlet and Mid-Inlet I). Tow net mesh sizes differed in order to collect a range in size of organisms.
Mesoplankton species abundances were assessed qualitatively by Carter and MacGregor [10] through observations of the standing volume of organisms in vials of preservative. In our later surveys, zooplankton samples (pooled for replicated tows per site) were concentrated through a 25 µm filter and preserved within 4 h in 70% ethanol [14] in sterile scintillation vials. Samples were well-mixed and diluted to a known volume (20 mL) within the vial, then a 1 mL subsample was removed with a graduated pipette. Microcrustacean zooplankton were enumerated under a circular, rotating Plexiglass counting chamber at 250–500× magnification using a dissecting microscope. A minimum number of 200 individuals was counted in the samples. In some samples, it was not possible to get 200 individuals in the 1 mL subset so additional subsamples were removed until either 200 individuals or the full sample was counted. Contents of the vials were identified to the lowest taxonomic group possible using a variety of sources and dichotomous keys for cladocerans and copepods [4,15,16,17,18,19,20,21,22,23].
In the 30+ year period since the 1979 study by Carter and MacGregor, there has been much research on copepod systematics and a number of species have been re-designated (see [20,23]). Species designations were upgraded for the St. Pauls Inlet 1977/78 data prior to comparisons with St. Pauls Inlet 2009, 2010, and 2019 data. Species rarefaction curves were computed (using www.biology.ualberta.ca/jbrzusto/rarefact.php; accessed on 26 May 2016) to estimate the number of species expected in a random collection of individuals.
Site similarity among surveys was defined statistically by grouping zooplankton samples according to their species composition, using presence/absence data which were available for all surveys. Similarity was assessed with Jaccard’s coefficient of similarity and non-metric multi-dimensional scaling (NMDS) ordination was performed on the similarity matrix. Kruskal stress coefficient values, a type of goodness of fit that reflects how well the ordination summarizes observed distances among the samples [24], were examined to determine the stress level. NMDS analysis was carried out using NTSYSpc statistical software version 2.2 [25]; based on 100 iterations, the stress was type 2 and the 2D plot was chosen. An examination of the correlations of the axis values with environmental factors (bottom and surface salinity, bottom and surface temperature, depth) was done to determine what the axes might represent. Data from 2019 were not included in this classification as only one date was sampled.
Carter and MacGregor [10] ranked relative abundances of zooplankton species as Abundant, Common, or Infrequent based on settled volumes, an estimate of population density. We determined % species abundance for our zooplankton data for 2009, 2010, and 2019 based directly on population densities, setting Abundance as >70%, Common between 40–69%, Infrequent between 2–39%, and Rare as <1%. We calculated the % abundance of each species first relative to total microcrustacean numbers then just to total copepod numbers as copepods made up the majority of all microcrustacean zooplankton collected.
In order to account for seasonal variability in our analyses, we restricted comparisons of relative abundances and mean density to July dates, as all surveys (1977, 2009, 2010, and 2019) overlapped in having sampled during that month. Also, comparisons of relative abundances were made only for the four open-water locations that were consistent between surveys.

3. Results

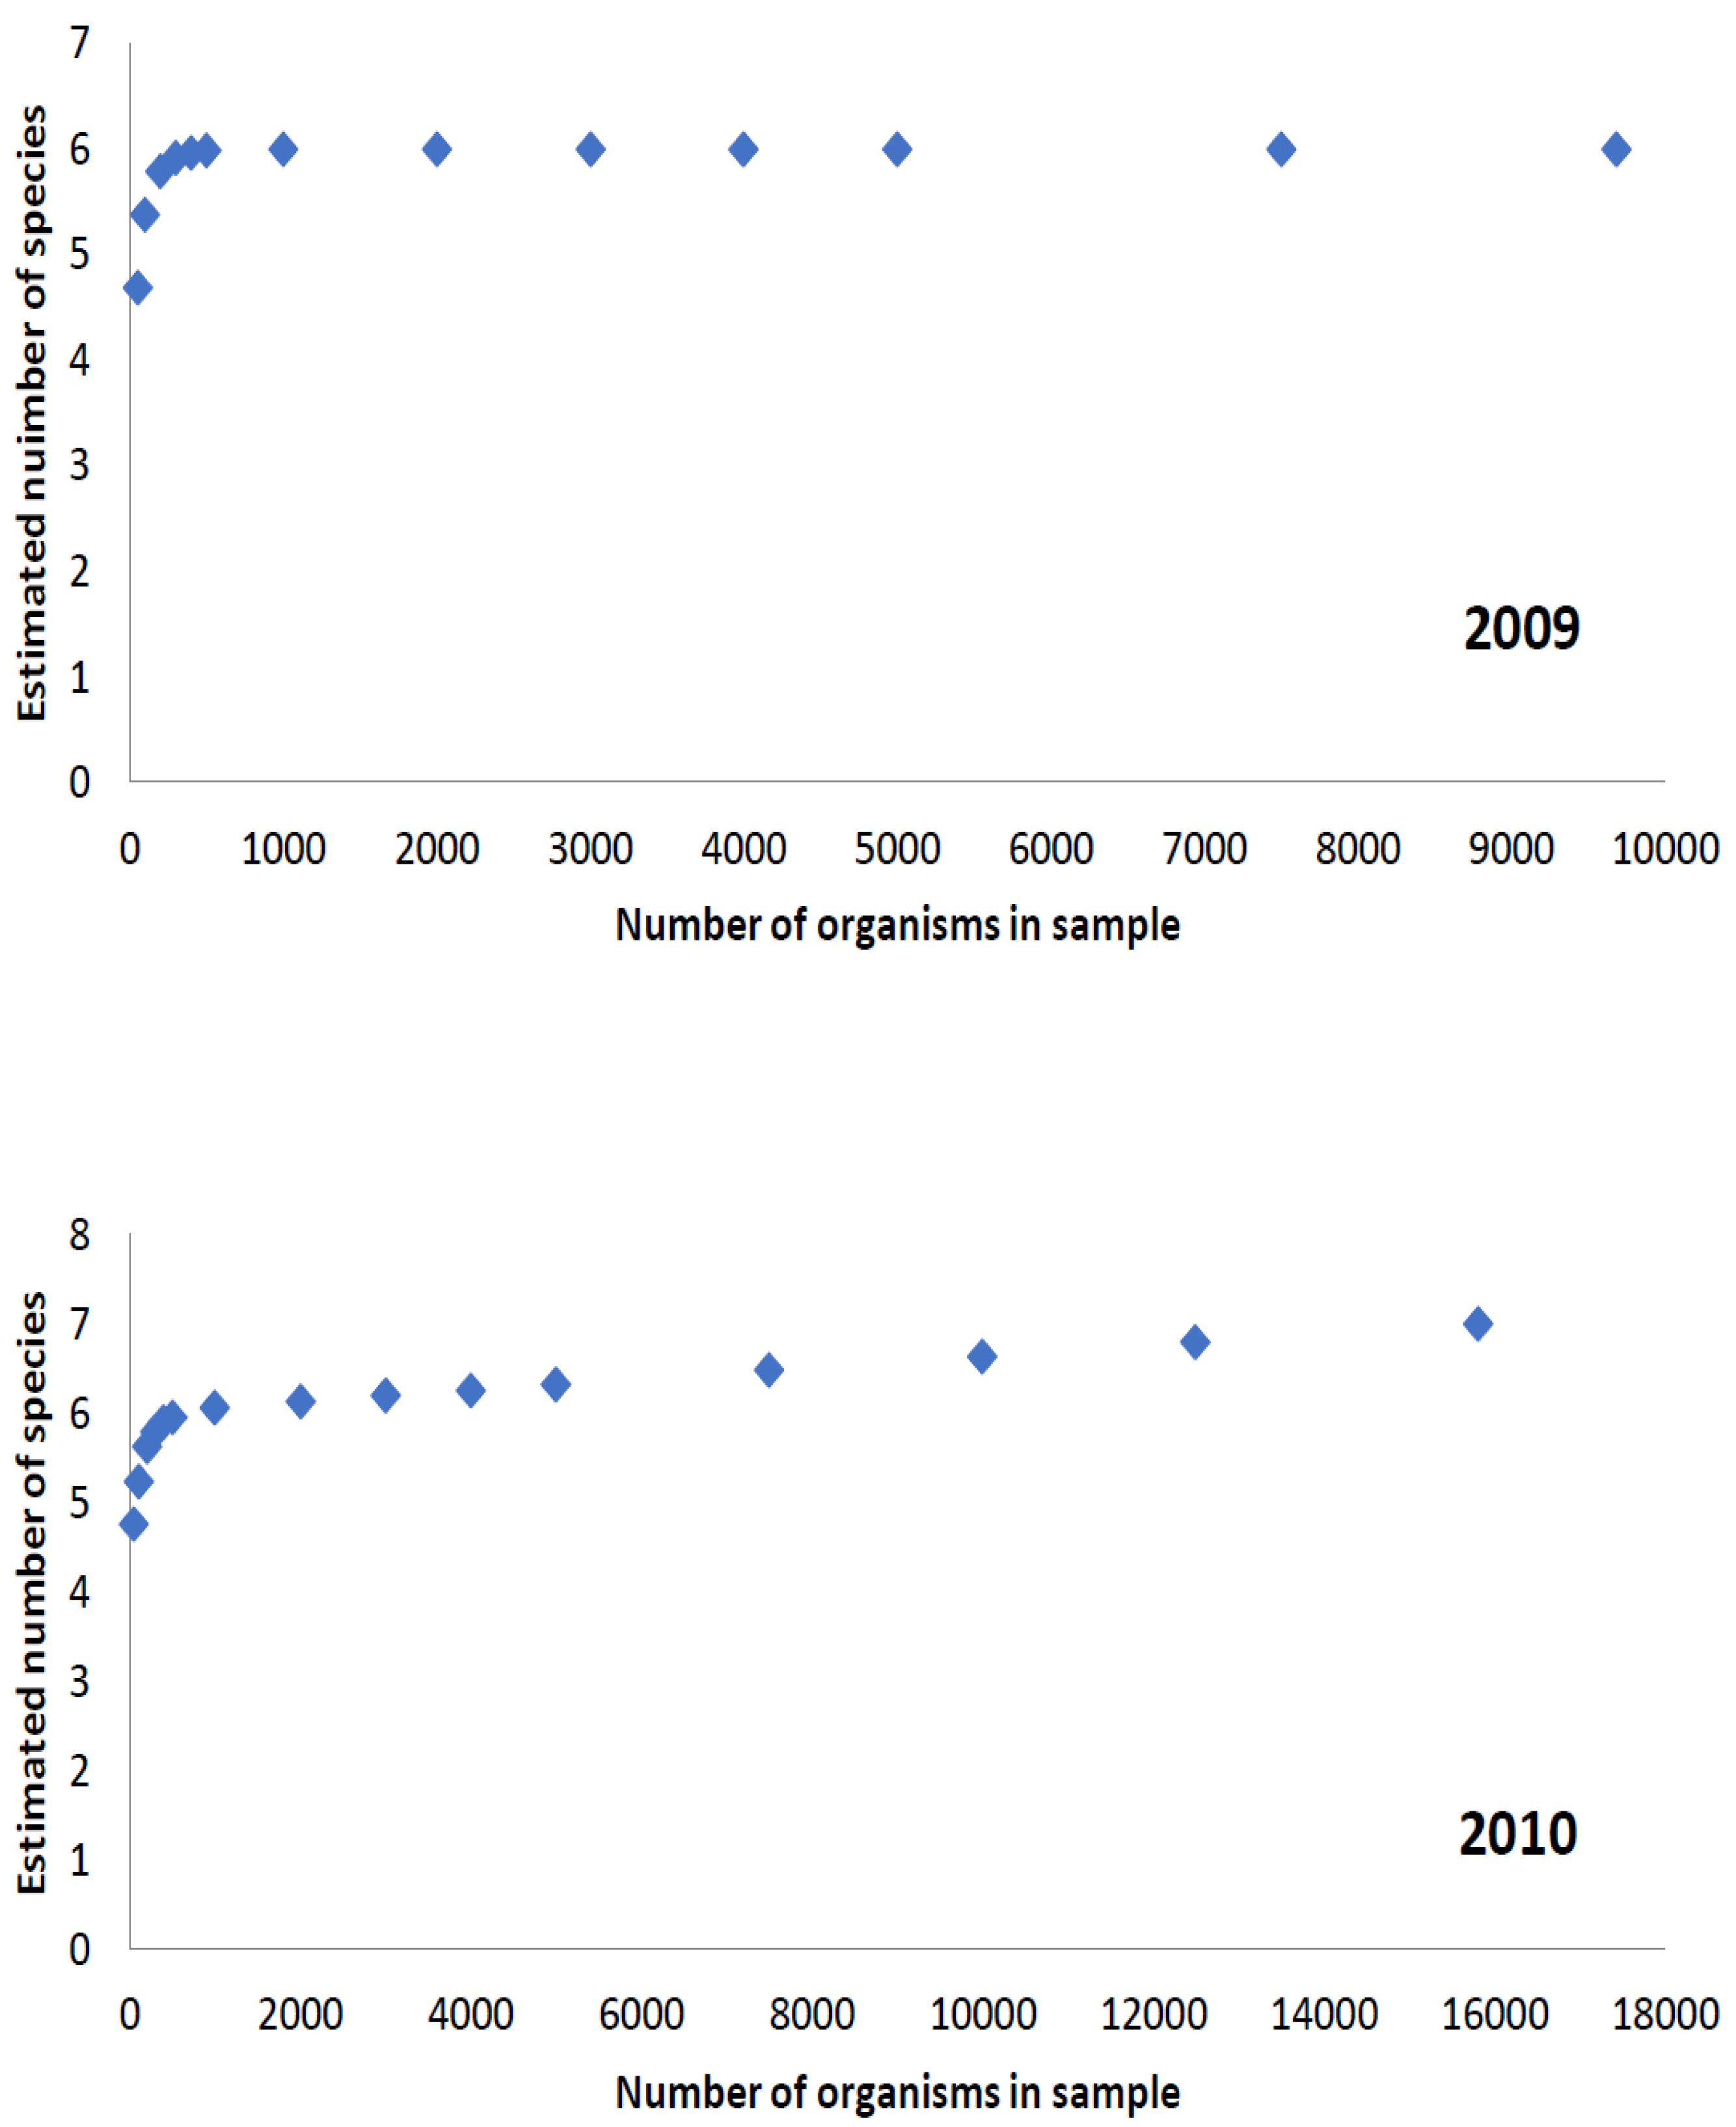
3.1. Species Richness

Species presence of microcrustacean zooplankton is shown in Table 2. The initial surveys from 1977/78 detected the presence of one cladoceran and 11 copepod species, while overall species richness in the later surveys consisted of two cladoceran and 7 copepod species (Table 2). Curves interpolated from the total number of individual microcrustaceans collected separately in 2009 and 2010 converged to asymptotes for both years (Figure 2). Adult microcrustacean densities (copepods + cladocerans, July data) ranged from 1.34 to 12.50 inds/L over the 4 sites, with the lowest densities observed at the Near Mouth site (Table 3). Most species sampled were Copepoda: densities of Cladocera (Evadne + Podon) averaged over the four sites were just 0.34 ± 0.17, 0.35 ± 0.16, and 0.15 ± 0.10 inds/L for 2009, 2010, and 2019, respectively.
Species composition differences were noted between survey periods. As seen in Figure 3, the NMDS ordination showed a distinct grouping separating the two time series. Axis I was significantly correlated with both surface and bottom temperature (0.663, 0.665, respectively), while Axis 2 showed correlations with surface temperature, bottom temperature, and site depth (0.860, 0.883, and −0.622, respectively). Neither axis was correlated with salinity. Mean surface salinity showed a consistent range between surveys, typically lower (~15‰) at the inlet head and higher (~21‰) at the mouth of the inlet.

3.2. Copepods

The dominant members of the zooplankton noted by Carter and MacGregor [10] in July 1977 were copepods Acartia, Calanus, Oithona, and Temora. The large Calanus finmarchicus was described as being “common to abundant at all locations and depths” (Table 2). In contrast, the later July surveys of 2009, 2010, and 2019 found Calanus abundance to be much diminished with only one specimen being found in a horizontal tow in 2010 at the Mid-Inlet I site. Acartia, Oithona, and Temora were common across most sampling periods, with numerous individuals present in all samples. Johnson and Allen [21] list Acartia hudsonica and Temora longicornis as two of the species most commonly found in Atlantic coastal waters, being estuarine in nature.
Copepods comprised the majority of individuals counted (ranging from 77 to 96% of each sample) for all years. We computed relative abundances of the four dominant copepods as a percentage of the total number of all copepod species found (copepodites and nauplii excluded); data are shown in Table 3. The shift in relative abundance for Calanus finmarchicus is the most striking difference between the early and later surveys.
Carter and MacGregor did not provide density values. Table 3 shows mean density values for the four dominant copepod species from our surveys (July data). Densities of both Oithona and Temora were quite variable between years, with the small-bodied Oithona being most abundant in 2019; densities of the more abundant Acartia showed greater consistency between years.

3.3. Temperature

All of the surveys had temperature data for mid-July (period between 7–22 July) which we used as a comparison. Surface temperatures (site means with standard deviations) were 14.3 ± 0.84 °C, 16.6 ± 1.36 °C, 16.5 ± 2.93 °C, and 17.4 ± 0.36 °C for 1977, 2009, 2010, and 2019, respectively. While there is some evidence for an increasing trend in surface water temperatures in St. Pauls Inlet, there was no significant difference between dates as tested with a non-parametric Kruskal–Wallis test (H = 5.44, p = 0.143).

4. Discussion

The mesozooplankton assemblage of St. Pauls Inlet can be characterized as estuarine and relatively depauperate. Adult microcrustacean abundances (based on July data only) seem within the lower range of those typically sampled by small-mesh nets in brackish regions of the Gulf of St. Lawrence [26]. Low mesoplankton abundance likely reflects low nutrient levels. There is little marine tidal input, and the rivers providing the freshwater influx also have very low levels of nutrients, with 0.07 ppm N measured nitrate and 0.01 ppm P measured phosphate [6].
The observed shift in species composition over a 30+ year period may be suggestive of ecological change, especially if this change consists of the almost complete absence of a previously dominant species such as C. finmarchicus. Estuarine species composition can be strongly influenced by temperature [3]. Yet given the paucity of zooplankton sampling from St. Pauls Inlet over the 30 years, it does become difficult to ascribe changes to any specific factor. However, what if observed changes in the inlet are indicative of wider regional ecosystem shifts? Indeed, recent reports from the Gulf of St. Lawrence and the Northwest Atlantic do show shifting zooplankton composition, with Calanus numbers particularly in decline [27,28].
Copepod development and spatial distribution are related to water temperature, with warmer waters more favorable for the population growth of smaller-bodied species which have lower respiration costs than larger-bodied zooplankton [29,30]. Debertin et al. [27] noted an increase in abundance of smaller zooplankton species such as Oithona that coincided with rising sea surface temperatures of 0.6 °C from 1993 to 2009 in Atlantic Canada’s Northumberland Strait. Increases in water temperature may reduce hatching success in C. finmarchicus [30]. Some larger estuarine copepods such as Eurytemora affinis may find it difficult to maintain osmoregulation at warmer water temperatures [31]. E. affinis was found in St. Pauls Inlet by Carter and MacGregor [10] in early spring with colder water temperatures, and only once in summer (at Eastern Brook Beach). We did not find this copepod in any of our samples.
Large Calanus spp. are predominant members of the mesozooplankton community in the North Atlantic [22,28]. Warming sea surface temperatures (SST) may be implicated in the declining abundance of C. finmarchicus [28,32]. Sorochan et al. [33] found population levels of Calanus spp. to be lower than the long-term average since the 2000s or early 2010s throughout much of the western North Atlantic shelf system, including the Gulf of St. Lawrence (data from 1982–2016). Abundances of C. finmarchicus were found to be significantly negatively correlated with SST for the Gulf of Maine and the Scotian Shelf areas and with near-bottom temperatures for both the western and eastern parts of the Gulf of St. Lawrence [33].
Our study showed a slight increasing trend in surface water temperatures for St. Pauls Inlet, based on mid-July data. Galbraith et al. [34] also observed summer (August data only) temperatures throughout the Gulf of St. Lawrence to be lower in 1977 than for 2009, 2010, and 2019. Mean surface sea temperatures were less than 15.4 °C in 1977, but consistently above 15.4 °C in 2009, 2010, and 2019 (with 15.4 °C the climatological average for the period 1982–2010) with particularly high temperatures for August 2019. Increases in temperature were more marked in deeper water >150 m. Similarly, Bourdages et al. [35] found temperatures at 150 m and deeper in the Gulf to be increasing from 1981 to 2019 surveys, breaking new records since 1915 at 250 and 300 m. July and August average surface temperatures within the Gulf showed slight increases after 1992.
Larger spatial correlations between populations of C. finmarchicus and ocean temperatures in the Gulf and the western North Atlantic may be associated with indirect effects on changes in ocean circulation and transport of Calanus [33]. Carter and MacGregor [10] suggested that there was an intrusion of cold, oxygenated GSL sea water and nutrients into St. Pauls Inlet during winter and speculated that the inlet received an external supply of zooplankton from Gulf populations at this time. Increasingly warm sea temperatures could then indirectly limit the input of C. finmarchicus individuals into the inlet via a reduction in the supply of over-wintering diapausing copepodite stages and higher mortality resulting from subsurface warming.
Therefore, despite reduced exchange with the sea via its narrow opening, shifts in zooplankton species composition towards small-bodied copepods in St. Pauls Inlet may reflect climate changes in the wider ecosystem [28]. Without a more extensive sampling regime, however, this remains speculation. A related survey of near-shore fish in the inlet [36] also described an estuarine and depauperate fauna (15 fish species) with possible declines in abundance of marine species such as Atlantic Herring and Atlantic Cod. However, this survey only occurred in one month (August) and did not do the extensive gill-netting of Carter and MacGregor who recorded 23 fish species. Continued monitoring of the inlet can provide for an additional way to monitor and assess future changes within the Gros Morne National Park ecosystem as well as in the wider Gulf of St. Lawrence.

Author Contributions

Both authors contributed towards conceptualization, methodology, analysis, investigation; C.E.C. contributed to supervision, acquisition of funds and reviewing; E.N.S. wrote the original draft of the work and contributed to reviewing and data curation. All authors have read and agreed to the published version of the manuscript.

Funding

Funding support was provided through SSHRC (Social Sciences and Humanities Research Council) Canada via CURRA (Community-University Research for Recovery Alliance) grant at Memorial University of Newfoundland.

Institutional Review Board Statement

Not applicable.

Informed Consent Statement

Not applicable.

Data Availability Statement

Data can be supplied by the corresponding author upon reasonable request.

Acknowledgments

Thanks to residents of the town of St. Paul’s for invaluable assistance in the field, and to the MUN CURRA group. J. McDermott assisted with the map.

Conflicts of Interest

The authors declare no conflict of interest. The funders had no role in the design of the study; in the collection, analyses, or interpretation of the data; in the writing of the manuscript, or in the decision to publish the results.

References

  1. Day, J.H. What is an estuary? S. Afr. J. Sci. 1980, 76, 198. [Google Scholar]
  2. Knox, G.A. Estuarine Ecosystems: A Systems Approach; CRC Press Inc.: Boca Raton, FL, USA, 1986; Volume I. [Google Scholar]
  3. Marques, S.C.; Pardal, M.A.; Pereira, M.J.; Goncalves, F.; Marques, J.C.; Azeiteiro, U.M. Zooplankton distribution and dynamics in a temperate shallow estuary. Hydrobiologia 2007, 587, 213–223. [Google Scholar] [CrossRef] [Green Version]
  4. Barnes, R.S.K. The Brackish-Water Fauna of Northwestern Europe; Cambridge University Press: New York, NY, USA, 1994. [Google Scholar]
  5. Pritchard, D.W. What is an estuary: Physical viewpoint. Am. Assoc. Advan. Sci. 1967, 85, 3–5. [Google Scholar]
  6. O’Sullivan, W. Hydrological Inventory of Gros Morne National Park, Newfoundland Canada; Inland Waters Directorate, Water Resources Branch: Halifax, NS, Canada, 1976. [Google Scholar]
  7. Galbraith, P.S. Winter water masses in the Gulf of St. Lawrence. J. Geophys. Res. 2006, 111, 1–23. [Google Scholar] [CrossRef]
  8. Savenkoff, C.; Vezina, A.F.; Smith, P.C.; Han, G. Summer transports of nutrients in the Gulf of St. Lawrence estimated by inverse modeling. Estuar. Coast. Shelf Sci. 2001, 52, 565–587. [Google Scholar] [CrossRef]
  9. Kim, H.; Lee, C.-R.; Lee, S.-k.; Oh, S.-Y.; Kim, W. Biodiversity and community structure of mesozooplankton in the marine and coastal national park areas of Korea. Diversity 2020, 12, 233. [Google Scholar] [CrossRef]
  10. Carter, J.A.; MacGregor, C.D. Marine Inventory of St. Paul’s Inlet for Gros Morne National Park; Report for Parks Canada; Martec Limited: Halifax, NS, Canada, 1979. [Google Scholar]
  11. Stevens, E.N. A Biological Assessment of Zooplankton in St. Pauls Inlet: An Estuarine Environment in Gros Morne National Park, Newfoundland. Master’s Thesis, Dept. of Biology, Memorial University of Newfoundland, St. Johns, NL, Canada, 2017. [Google Scholar]
  12. Sella, G.F.; Stein, S.; Dixon, T.H.; Craymer, M.; James, T.S.; Mazzotti, S.; Dokka, R.K. Observation of glacial isostatic adjustment in “stable” North America with GPS. Geophys. Res. Lett. 2007, 34, 1–6. [Google Scholar] [CrossRef] [Green Version]
  13. ESRI. ArcGIS Desktop: Release 10; ArcMap 10.7.1; Environmental Systems Research Institute: Redlands, CA, USA, 2011. [Google Scholar]
  14. Black, A.R.; Dodson, S.I. Ethanol: A better preservation technique for Daphnia. Limnol. Oceanogr. Methods. 2003, 1, 45–50. [Google Scholar] [CrossRef] [Green Version]
  15. Della Croce, N. Cladocera; ICES ID Leaflet No. 143: Copenhagen, Denmark, 1974. [Google Scholar]
  16. Shih, C.; Marhue, L.; Barrett, N.; Munro, R. Planktonic copepods of the Bras d’Or Lakes system, Nova Scotia, Canada. Hydrobiologia 1988, 167, 319–324. [Google Scholar] [CrossRef]
  17. Frost, B.W. A taxonomy of the marine calanoid copepod genus Pseudocalanus. Can. J. Zool. 1989, 6, 525–551. [Google Scholar] [CrossRef]
  18. Todd, C.D.; Laverack, M.S.; Boxshall, G.A. Coastal Marine Zooplankton: A Practical Manual for Students, 2nd ed.; Cambridge University Press: New York, NY, USA, 1996. [Google Scholar]
  19. Bradford-Grieve, J.M. Copepoda: Calanoida: Acartiidae; ICES ID Leaflet No. 181: Copenhagen, Denmark, 1999. [Google Scholar]
  20. Gerber, R.P. An Identification Manual to the Coastal and Estuarine Zooplankton from Passamaquoddy Bay to Long Island Sound; Acadia Productions: Brunswick, ME, USA, 2000. [Google Scholar]
  21. Campbell, C.E.; Knoechel, R. Species occurrences of microcrustacean zooplankton in Labrador, Canada. Verh. Int. Ver. Limnol. 2008, 30, 77–81. [Google Scholar] [CrossRef]
  22. Johnson, W.S.; Allen, D.M. Zooplankton of the Atlantic and Gulf Coasts: A Guide to their Identifications and Ecology; Johns Hopkins University Press: Baltimore, MD, USA, 2005. [Google Scholar]
  23. Walter, T.C.; Boxshall, G. World of Copepods Database. 2014. Available online: http://www.marinespecies.org/copepoda (accessed on 12 June 2014).
  24. Holland, S.M. Non-Metric Multidimensional Scaling (MDS); Dept. of Geology, University of Georgia: Athens, GA, USA, 2008; Available online: https://strata.uga.edu/software/pdf/mdsTutorial.pdf (accessed on 3 June 2016).
  25. Rohlf, F.J. NTSYSpc Numerical Taxonomy and Multivariate Analysis System; Version 2.21L; Exeter Software, Setauket: New York, NY, USA, 2009. [Google Scholar]
  26. Winkler, G.; Dodson, J.J.; Bertrand, N.; Thivierge, D.; Vincent, W. Trophic coupling across the St. Lawrence River estuarine transition zone. Mar. Ecol. Prog. Ser. 2003, 251, 59–73. [Google Scholar] [CrossRef]
  27. Debertin, A.J.; Hanson, J.M.; Courtenay, S.C. Linking zooplankton assemblages with oceanographic zones in an Atlantic coastal system. Can. J. Fish. Aquat. Sci. 2018, 75, 868–882. [Google Scholar] [CrossRef]
  28. Bernier, R.Y.; Jamieson, R.E.; Moore, A.M. (Eds.) State of the Atlantic Ocean Synthesis Report. Can. Tech. Rep. Fish. Aquat. Sci. 2018, 3167, iii + 149p. [Google Scholar]
  29. Moore, M.; Folt, C. Zooplankton body size and community structure: Affects of thermal and toxicant stress. Trends Ecol. Evol. 1993, 8, 178–183. [Google Scholar] [CrossRef]
  30. Preziosi, B.M.; Runge, J.A. The effect of warm temperatures on hatching success of the marine planktonic copepod, Calanus finmarchicus. J. Plankton Res. 2014, 36, 1381–1384. [Google Scholar] [CrossRef] [Green Version]
  31. Favier, J.-B.; Winkler, G. Coexistence, distribution patterns and habitat utilization of the sibling species complex Eurytemora affinis in the St. Lawrence estuarine transition zone. J. Plankton Res. 2014, 36, 1247–1261. [Google Scholar] [CrossRef] [Green Version]
  32. Hinder, S.L.; Gravenor, M.B.; Edwards, M.; Ostle, C.; Bodger, O.G.; Lee, P.L.; Walne, A.W.; Hays, G.C. Multi-decadal range changes vs. thermal adaptation for north east Atlantic oceanic copepods in the face of climate change. Glob. Chang. Biol. 2014, 20, 140–146. [Google Scholar] [CrossRef]
  33. Sorochan, K.A.; Plourde, S.; Morse, R.; Pepin, P.; Runge, J.; Thompson, C.; Johnson, C.L. North Atlantic right whale (Eubalaena glacialis) and its food: (II) interannual variations in biomass of Calanus spp. on western North Atlantic shelves. J. Plankton Res. 2019, 41, 687–708. [Google Scholar] [CrossRef]
  34. Galbraith, P.S.; Chassé, J.; Shaw, J.-L.; Dumas, J.; Caverhill, C.; Lefaivre, D.; Lafleur, C. Physical oceanographic conditions in the Gulf of St. Lawrence during 2019. DFO Can. Sci. Advis. Sec. Res. Doc. 2020, 2020/030, iv + 84p. [Google Scholar]
  35. Bordages, H.; Brassard, C.; Desgagnés, M.; Galbraith, P.; Gauthier, J.; Nozères, C.; Scallon-Chouinard, P.-M.; Senay, C. Preliminary results from the ecosystemic survey in August 2019 in the estuary and northern Gulf of St. Lawrence. DFO Can. Sci. Advis. Sec. Res. Doc. 2020, 2020/009, iv + 93p. [Google Scholar]
  36. Melanson, R.; Campbell, C.E. Near-shore fish populations within St. Pauls Inlet, an estuarine system in western Newfoundland. Northeast. Nat. 2012, 19, 487–500. [Google Scholar] [CrossRef] [Green Version]
Figure 1. St. Pauls Inlet (official name of the inlet has no apostrophe before the s) located on the island of Newfoundland in Atlantic Canada. The * symbol is the location of the opening to the Gulf of St. Lawrence (GSL) and the wider Atlantic, through St. Paul’s Bay. Numbers refer to sampling sites: 1 = Head of Inlet, 2 = MidInlet I, 3 = MidInlet II, 4 = Near Mouth. Map generated with ArcGis Desktop [13].
Diversity 14 00059 g001
Figure 2. Rarefaction curves for microcrustaceans in 2009 and 2010.
Diversity 14 00059 g002
Figure 3. NMDS ordination comparing zooplankton survey of 1977/1978 (numbers bolded in red) with survey of 2009/2010 (numbers bolded in black) for St. Pauls Inlet. Numbers refer to sampling sites from Figure 1 map: 1 = Head of Inlet, 2 = MidInlet I, 3 = MidInlet II, 4 = Near Mouth. Stress value = 0.05.
Diversity 14 00059 g003
Table 1. Summary of field sampling protocol for the different survey periods. The four open-water sites were consistent between surveys and designated as Head of Inlet, Mid-Inlet I, Mid-Inlet II, and Near Mouth of Inlet (see Figure 1).
SurveySampling SitesSampling TypeMesh Size
1977 (July) and
1978 (May)
4 open-water sites,
1 near shore
Vertical tows (discrete 5 m depth intervals from approx. 15–20 m to the surface).
Surface 5 min horizontal tows (vertical + horizontal in summer, horizontal only in spring).
birge-style closing net (17 cm diameter and 108 cm long; mesh size n/a), Niskin bottle.


plankton net of 80 μm mesh.
2009 and
2010
(biweekly
June–August
both years)
4 open-water sitesTwo 2 min oblique horizontal tows per site, either small or large-mesh conical net, with calibrated General Oceanics® flow meter attached for estimation of volume of water filtered.
Vertical tows at each site. Two depths of tows were taken per site, one close to 1 m above the bottom and one down to half of the maximum depth of the sampling site, with two tows per depth range.
small-mesh conical net (63 µm mesh, 300 mm mouth diameter, 1.0 m length).


large-mesh conical net (500 µm mesh, 300 mm mouth diameter, 1.0 m length).


80 µm mesh conical net, 200 mm mouth diameter, 0.5 m length.
2019 (July)4 open-water sitesTwo vertical tows at each site.80 µm mesh conical net, 200 mm mouth diameter, 0.5 m length.
Table 2. Microcrustacean zooplankton of St. Pauls Inlet (SPI) from survey periods of Carter and MacGregor [10] and Stevens [11] + Campbell (2019, unpubl.). Checkmark indicates presence of species in survey. Habitat (salinity) ranges derived from Johnson and Allen [22]. Taxonomic re-designations include: Acartia clausi (listed by Carter and MacGregor) revised to A. hudsonica Pinhey, 1926; Eurytemora hirundoides (listed by Carter and MacGregor) revised to E. affinis (Poppe 1880); Pseudocalanus elongatus is not likely a valid species according to Frost [17].
Microcrustacean SpeciesHabitat RangeSPI
C and M
SPI
S and C
Cladocera
Evadne nordmanni Lovén, 1836Brackish
Podon leuckarti (Sars, 1862)Brackish
Copepoda
Acartia hudsonica Pinhey, 1926 *Marine
Calanus finmarchicus (Gunnerus, 1770) *Marine
Centropages typicus (Kröyer, 1849)Marine
Eurytemora affinis (Poppe, 1880)Brackish
Harpacticus chelifer (Müller O.F., 1776)Marine
Macrosetella gracilis (Dana, 1847)Marine
Metridia longa (Lubbock, 1854)Marine
Metridia lucens Boeck, 1865Marine
Microsetella norvegica (Boeck, 1865)Marine
Oithona similis Claus, 1866 *Brackish
Oncaea venusta Philippi, 1843Marine
Pseudocalanus elongatus (Boeck, 1865)Marine
Temora longicornis (Müller O.F., 1785) *Marine
* Noted as dominant members of the zooplankton by Carter and MacGregor and described thusly: (i) Acartia—abundant during summer sampling in the surface layers in the outer reaches of the inlet; (ii) Calanus—a common to abundant large species observed at all stations and depths during the summer sampling; (iii) Oithona—a relatively common species throughout the inlet during the summer; and (iv) Temora—relatively common in the surface waters throughout the inlet in summer.
Table 3. Relative abundance of the four dominant copepod species in July from the different survey periods. Carter and MacGregor in 1977 ranked species semi-quantitatively as abundant, common or infrequent. For our later surveys, we quantified relative copepod abundance as Abundant (>70% of total copepods), Common (40–69% of total copepods), Infrequent (2–39%) or Rare (<1%), based on a total of all copepod species found. Mean density (± standard deviation) refers to density of each species calculated from Vertical Tows, averaged over the 4 open-water sites. Density of adult microcrustaceans (copepods + cladocerans) refer to mean densities per site (inds/L; July data).
Mean Density (inds/L)Head of InletMid-Inlet IMid-Inlet IINear Mouth
Calanus1977--ACAC
20090.000000
20100.000R (0.04%)00
20190.000000
Acartia1977--CICC
20093.73 ± 2.11CCCC
20104.02 ± 2.87AAAA
20192.14 ± 1.35CICI
Oithona1977--CCCC
20090.42 ± 0.68RIII
20100.52 ± 0.79IIIR
20193.84 ± 2.52CACC
Temora1977--CICC
20093.65 ± 2.35CCCC
20100.70 ± 0.40IIII
20190.33 ± 0.16IIII
Density of adult microcrustaceans2009 11.3 ± 0.005.14 ± 3.0012.5 ± 8.532.88 ± 1.59
2010 9.08 ± 7.386.02 ± 3.983.40 ± 3.901.99 ± 1.82
2019 7.99 ± 2.489.44 ± 3.657.11 ± 1.771.34 ± 0.38
Publisher’s Note: MDPI stays neutral with regard to jurisdictional claims in published maps and institutional affiliations.

