Article

Patterns of Cryptic Diversity and Phylogeography in Four Freshwater Copepod Crustaceans in European Lakes

1
Finnish Museum of Natural History LUOMUS, University of Helsinki, P.O. Box 17, 00014 Helsinki, Finland
2
Organismal and Evolutionary Biology, Faculty of Biological and Environmental Sciences, University of Helsinki, Viikinkaari 1, 00014 Helsinki, Finland
3
Zoological Institute, Russian Academy of Sciences, Universitetskaya Embankment 1, 199034 Saint Petersburg, Russia
4
Evolutionary Biology, Department of Ecology and Genetics, Uppsala University, Norbyvägen 18 D, 752 36 Uppsala, Sweden
*
Author to whom correspondence should be addressed.
Diversity 2021, 13(9), 448; https://doi.org/10.3390/d13090448
Submission received: 23 August 2021 / Revised: 14 September 2021 / Accepted: 15 September 2021 / Published: 19 September 2021
(This article belongs to the Special Issue Cryptic Biodiversity in Freshwater Ecosystems)

Abstract

:
Comparative phylogeography has become a powerful approach in exploring hidden or cryptic diversity within widespread species and understanding how historical and biogeographical factors shape the modern patterns of their distribution. Most comparative phylogeographic studies so far focus on terrestrial and vertebrate taxa, while aquatic invertebrates (and especially freshwater invertebrates) remain unstudied. In this article, we explore and compare the patterns of molecular diversity and phylogeographic structure of four widespread freshwater copepod crustaceans in European water bodies: the harpacticoids Attheyella crassa, Canthocamptus staphylinus and Nitokra hibernica, and the cyclopoid Eucyclops serrulatus, using sequence data from mtDNA COI and nuclear ITS/18S rRNA genes. The three taxa A. crassa, C. staphylinus and E. serrulatus each consist of deeply diverged clusters and are deemed to represent complexes of species with largely (but not completely) non-overlapping distributions, while in N. hibernica only little differentiation was found, which may however reflect the geographically more restricted sampling. However, the geographical patterns of subdivision differ. The divisions in A. crassa and E. serrulatus follow an east–west pattern in Northern Europe whereas that in C. staphylinus has more of a north–south pattern, with a distinct Fennoscandian clade. The deep mitochondrial splits among populations of A. crassa, C. staphylinus and E. serrulatus (model-corrected distances 26–36%) suggest that divergence of the lineages predate the Pleistocene glaciations. This study provides an insight into cryptic diversity and biogeographic distribution of freshwater copepods.

Graphical Abstract

1. Introduction

Freshwater animals generally comprise well-defined populations separated by unsuitable habitats and geographical barriers, and often manifest remarkable intraspecific diversity, facilitated by limited gene flow between populations [1]. Studies on the genetic diversity of widespread freshwater taxa, largely applying DNA barcoding methods, are increasingly revealing complex patterns of cryptic variation. Apart from investigations of freshwater fishes [2] and other macroscopic taxa [3], studies on the phylogeny of smaller freshwater crustaceans, such as cladocerans [4,5,6], isopods [7], amphipods [8,9,10], and copepods [11] have demonstrated the presence of hidden genetic diversity and occurrence of cryptic species across presumed conspecific populations.
The concept of cryptic or hidden species has various definitions in the literature, the most commonly holds that cryptic species are two or more (genetically) distinct species that were classified as a single species due to their morphological similarity [12]. The frequency with which cryptic species are uncovered using DNA sequence data suggests that the morphospecies concept is no longer sufficient but must be complemented by molecular data [3]. The abundance of new cryptic diversity described in the literature raises such questions as how should the boundaries between cryptic species be defined? What are the main causes and processes of cryptic speciation? What is the age of a cryptic species?
When using molecular methods for species identification and delimitation, generally from the variation in the cytochrome c oxidase subunit I (COI) gene (widely applied for freshwater animals [13,14,15,16]), most studies involve evaluation of genetic distances between populations and application of species delimitation algorithms such as jMOTU, GMYC, and ABGD, which diagnose the difference between intra- and inter-specific variability by statistical criteria [17,18,19]. Although these methods have been widely tested in aquatic taxa [5,20,21,22,23,24], only a few studies use them in a comparative setting, i.e., simultaneously on several co-distributed freshwater species from the same area. However, such comparative studies are essential in revealing general patterns and recognizing baseline levels of divergence for distinguishing cryptic species and investigating historical and geographical factors that commonly affect the distribution of intraspecific diversity [25,26,27].
Identifying phylogeographic patterns and determining borders between cryptic species are necessary steps in exploring the speciation process of freshwater organisms [28]. The first attempts to see how earth features and history shape geographic patterns of diversification were already in the late 19th century by Alfred Russel Wallace, who mapped distributions of multiple vertebrate and invertebrate taxa to develop the system of terrestrial zoogeographic regions and subregions, which is used more or less unchanged to this day [29]. Current comparative phylogeographic studies, which often use both morphological and genetic data, elucidate various processes that shape biodiversity, such as allopatric and sympatric speciation, contact zones, demographic history and gene flow, dispersal vectors, etc. [30]. While congruent phylogeographic patterns are interpreted as mirroring common geologic or climatic events that shaped the diversity [31], incongruent structuring reflects the presence of different taxon-specific ecological and organismal traits that may have differentially affected dispersal and distributions [32].
In terms of time, the Pleistocene glacial cycles are generally considered as key events that shaped the cladogenesis and distributions of the extant species in northern parts of the Palearctic, by increasing fragmentation and opportunities for vicariance, allopatric divergence and speciation [33]. However, studies in several taxa have indicated that many splits trace back much further, to Pre-Pleistocene times [34,35]. It may be hypothesized that the phylogeographic structures of certain Palearctic groups indeed result from a combination of deep splits during the Miocene or Pliocene, that themselves may remain cryptic, followed by restructuring of population sizes and the addition of new layers of complexity during the Quaternary [36,37,38]. To understand the age of cryptic species, methods such as estimation of lineage divergence times using molecular clocks [39] or, in lack of fossils/appropriate calibration nodes, demographic tests which detect recent changes of effective population sizes [40] are usually used.
Although continental studies of cryptic diversity and comparative phylogeography are common in zoology, they are heavily biased towards vertebrates and terrestrial organisms, with aquatic (especially freshwater) invertebrates remaining underrepresented [30]. Copepod crustaceans are critical components of the world’s freshwater and marine ecosystems and are sensitive indicators of local and global climate change and key ecosystem service providers [41,42]. They manifest morphological and behavioral diversity among conspecific populations in association with environmental and geographical factors [43]. Whereas molecular phylogeny and phylogeography of marine copepods has been broadly explored [20,44,45,46,47], fewer studies have addressed the diversity in freshwater copepods [26]. Particularly, comparative studies allowing a general view to the dynamics of diversification are lacking [25]. At any rate, the studies of individual freshwater taxa tend to challenge the general ‘cosmopolitanism paradigm’ of widespread copepod species and instead reveal previously unrecognized hidden regional diversity [21,25,26,48,49,50,51,52].
Here we present a comparative survey of the broad phylogeographic patterns and cryptic diversity in four one of the most widespread freshwater copepods in Northern Europe, Attheyella crassa Sars [53], Canthocamptus staphylinus Jurine [54], Eucyclops serrulatus Fischer [55], and Nitokra hibernica Brady [56]. We use our previous mtDNA sequence data for A. crassa [51], C. staphylinus [52], and E. serrulatus [48] and supplement them with new mtDNA data from several additional populations and with nuclear DNA sequences, and newly analyse mtDNA data for N. hibernica. We analyze the intra-species phylogenies and genetic structuring and compare the patterns of cryptic diversity and distribution to understand how the potential cryptic subdivision is formed, what the contact zones and divergence levels between cryptic species are, and what are the implications on the views of the age of diversity.

2. Materials and Methods

2.1. Overview of the Studied Taxa

The harpacticoid copepod Attheyella crassa is widespread in Europe in different types of freshwater water bodies, and the overall distribution is Palearctic [43,57,58]. The short life cycle (4–6 weeks) has facilitated its use as an experimental organism in ecotoxicological studies, which have shown that exposure to toxic substances can significantly affect the body length, individual fertility, and genetic diversity of populations [59,60]. Preliminary studies of structuring among several European populations revealed significant differentiation in morphometric characters and marked genetic divergence (c 20% between two main clades [51].
Canthocamptus staphylinus is one of the most widely distributed freshwater harpacticoid copepod taxa in the Palearctic [43,61]. It is considered a stenothermal and psychrophilic species inhabiting water bodies with temperatures from 0 °C to 19 °C [62,63]. As part of their life cycle, adult C. staphylinus rest encysted in the bottom mud. They occur in a wide range of habitats, from small spring pools to large lakes and rivers. Populations are both geographically and ecologically variable in several morphological characteristics, including the structure of the fifth pair of thoracal legs, numbers of spinules on the anal operculum, form of the spermatophore, and the development of the aesthetask on the fourth segment of the antennule [43,52,61]. Two distinct mitochondrial clades (22–23% divergence in COI) were recently reported [52], which raises the question whether the different forms described as C. staphylinus in the literature actually represent a group of closely related species.
Eucyclops serrulatus is a widespread cyclopoid copepod, which was considered a cosmopolitan taxon until recent splits and a comprehensive revision of the E. serrulatus group [64]. In the Palearctic, the range of this broader E. serrulatus group extends from North Africa to continental Europe and central Asia to Eastern Siberia. All records from Australia, North America, and other zoogeographical regions are likely the result of recent invasions [64]. Recent studies from East European mountains and European water bodies showed significant differences in morphology of setae on caudal rami and swimming legs, as well as in mtDNA. Eight clades with high mitochondrial divergences (around 30%) have been recognized [25,48].
Nitokra hibernica is a benthic harpacticoid with broad salinity tolerance, occurring in fresh, brackish, coastal, and estuarine waters. It is usually associated with macrophyte beds occurring in nearshore zones of large rivers and lakes. It has a broad distribution in Eurasia, e.g., in the Black and Caspian Seas, the coasts of the Atlantic and Baltic Seas, inland waters in the South, East, and Central Europe as well as in Central Asia and the Caucasus [65,66]. N. hibernica was probably introduced in ballast water to the Great Lakes of North America, where it has become one of the most common nearshore harpacticoids [67,68]. No previous information on mitochondrial diversity is available.

2.2. Sampling

Our sampling comprised a total of 27 European freshwater bodies with 11 populations of A. crassa, 13 of C. staphylinus, 11 of E. serrulatus, and 5 of N. hibernica (Table S1). The locations include individual lakes, rivers or reservoirs in Norway, Sweden, Finland, Estonia, Switzerland, Germany, Austria, Belarus, France, Italy, and various regions of Russia (see later in Results and Discussion). The material includes samples of three species from our previous studies [48,51,52] augmented by new samples from Germany (lakes Plau am See and Stechlin), Austria (lakes Fernsteinsee, Zell am See and Hallstatt), Switzerland (Lake Zurich) and Russia (the Severnaya Dvina and Lena rivers), as well as new data on 5 populations of the previously unassessed harpacticoid N. hibernica. Samples were collected by horizontal sweeps at 1 m depth in near-shore areas using a 100 μm mesh size hand net. Living samples were sorted under a stereomicroscope; copepods were then individually preserved in 96% ethanol. mtDNA data on five additional specimens from four populations were obtained from GenBank (see Table S1).

2.3. Molecular Analysis

Genomic DNA was extracted using different protocols for the different taxa. For E. serrulatus these included the salt extraction method of Aljanabi & Martinez, 1997 [69], and use of the Diatom™ DNA Prep 200 Kit (Galart, Russia); for C. staphylinus and N. hibernica the Chelex protocol outlined in Walsh et al., 1991 [70] and described in Kochanova et al., 2018 [52]; and for A. crassa the DNeasy Blood & Tissue Kit (Qiagen, Hilden, Germany). The primers used in this study are listed in Table S2 in the supplementary material. The PCR mixes and amplification protocols for the mitochondrial COI gene for A. crassa and N. hibernica are described in Kochanova & Gaviria, 2018 [51], for C. staphylinus in Kochanova et al., 2018 [52] and for E. serrulatus in Sukhikh & Alekseev, 2015 [48]. In addition, sequences of nuclear markers, either ITS or 18S rRNA, were obtained for the three species C. staphylinus, A. crassa, and E. serrulatus. The amplification of ITS1-5.8S-ITS2 region of the rRNA operon (for short, ITS) involved initial denaturation at 95 °C (30 s), followed by 38 cycles of denaturing at 95 °C (30 s), annealing at 50 °C (30 s), and extension at 72 °C (70 s), and then a final extension at 72 °C for 7 min. The PCR program for the 18S gene was: 15 min HotStarTaq activation step at 95 °C; 35 cycles of 1 min at 94 °C, 1 min at 55 °C (fragment 1), 59 °C (fragment 2) or 57 °C (fragment 3), 2 min at 72 °C; and 10 min extension hold at 72 °C. PCR products were visualized by electrophoresis in 2% agarose gel and purified with the ExoSap-IT PCR Product Clean-Up kit (Applied Biosystems, Waltham, MA, USA). Sequencing was carried out in both directions, using the BigDye Terminator v3.1 (Life Technology) reagent kit on the ABI PRISM 310 Genetic Analyzer (Applied Biosystems, Waltham, MA, USA).

2.4. Analysis of Sequences and Reconstruction of Phylogeny, Haplowebs and Population Structure

The obtained nucleotide sequences were aligned using the ClustalW algorithm [71]. In the nuclear dataset, alleles were not distinguished and double peaks in chromatograms were coded using ambiguity codes. The nucleotide and haplotype diversities, number of polymorphic sites, and mutations were assessed in DnaSP 5.1 [72]. The best-fitting models of nucleotide substitution for both mitochondrial and nuclear datasets were selected in jModelTest v. 2.1.7 based on the likelihood scores for 88 different models and under the Akaike Information Criterion (AICc) [73]. The model selected for COI was GTR+Г (general time reversible model with inter-site rate variation modeled with a gamma distribution) in all species but N. hibernica, for which HKY+Г was chosen (see Results). The model for all nuclear datasets was HKY.
Phylogenies were reconstructed for each genus and each locus separately using Maximum Likelihood analysis under the selected models in MEGA X [74]. Additional congeneric sequences were included to illustrate the divergence among conventional species in the COI trees, including Attheyella dentata (accession numbers MZ147009-MZ147011) and A. (Neomrazikiella) nordenskioldii, Canthocamptus kitaurensis (KR049006), C. (Baikalocamptus) longifurcatus (MZ169062-MZ169064), and C. microstaphylinus (KP974720-KP974734); Eucyclops taiwanensis (KC627324-KC627330), E. prionophorus (a MG448928, MG449753, MG449804), and E. cuatrocienegas (MG448762, MG448828, MG449054, MG449344); Nitokra lacustris (KR049005) and Nitocrella achaigae (MW0399384). Non-congeneric outgroups were included as well. The trees were visualized in FigTree version 1.4.0 (http://tree.bio.ed.ac.uk/software/figtree/ access on 13 September 2021). Mean genetic distances between populations and species under the selected models were calculated in PAUP ver. 4a168 [75]. In order to compare our results to previously published distances inferred for other freshwater copepods, we also (re)calculated interclade/interspecies COI genetic distances for Eudiaptomus hadzici [21], Neutrodiaptomus tumidus [76], Hemidiaptomus ingens [26], and Skistodiaptomus pallidus [77] using the same substitution model (GTR+Г) for all species since it was one of the best fits among all datasets.
To display the relationships of individual haplotypes, separate median-joining (MJ) haplotype networks for the COI marker and ITS/18S markers were constructed using POPART 1.7 [78]. The homoplasy level parameter (ε) was set at the default value (ε = 0).
An analysis of molecular variance (AMOVA) among and within populations of A. crassa, C. staphylinus, E. serrulatus and N. hibernica was conducted using Arlequin v.3.5.2.2 [79] and presented in Supplementary Material (Table S3). Tajima’s D [80] and Fu’s FS [81] were calculated for populations with more than four sequences and tested for significant departure from demographic stability with 10,000 coalescent simulations in DnaSP 5.10 [72].

2.5. Species Delimitation

For a mechanistic “OTU delimitation” from sequence data of individual loci, we applied three commonly used approaches (the ABGD distance method, coalescence models in the ‘splits’ and ‘bGMYC’ packages, and through the Poisson analysis of mPTP) and one (STACEY) for the combined mtDNA and rRNA gene dataset.
ABGD, or Automatic Barcode Gap Discovery (ABGD) [19], was calculated on the web-server Atelier de BioInformatique, France (https://bioinfo.mnhn.fr/abi/public/abgd/abgdweb.html access on 13 September 2021). Single values for both mitochondrial loci were selected by us: Pmin = 0.001, Pmax = 0.1, Steps = 100, X =10, Nb = 25. GMYC instead applies the coalescence approach based on the general mixed Yule coalescent model [82] and was performed with the ‘splits’ package [17]. As the input tree, we used an ultrametric tree obtained for each locus in BEAST 2.5.2 programme [83]. The PTP method of species delimitation in turn is based on the Poisson tree processes, for which we used multi-rate Poisson Tree Processes, mPTP [18] on the web server of Heidelberg Institute for Theoretical Studies, Germany (http://mptp.h-its.org/ access on 13 September 2021). As the input tree, we used the phylogenetic ML-tree obtained for each locus.
STACEY v.1.2.4 [84] was used as a method for multilocus phylogenetic taxonomy. This method is a version of the multi-species coalescence model used in the BEAST 2.5.2. program [83]. Bayesian species (partitioned) trees were first constructed in BEAST 2.5.2 using the STACEY template. Final phylogenetic relationships were estimated in four independent runs for the whole data set. Each run consisted of 50 million iterations sampling every 10,000th and discarding the first 50.00 iterations (burn-in). STACEY log files were examined in Tracer v.1.7.1 [85] to assess whether the runs have reached the stationary phase and converged on model parameters (ESS > 400). Support of topologies was evaluated in STACEY by constructing a tree of maximum reliability in TreeAnnotator after the rejection of half of all estimated trees. Species delineation (based on the trees evaluated in STACEY) was carried out using a Java-application ‘speciesDA’ written by Graham Jones (http://www.indriid.com/software.html access on 13 September 2021).

3. Results

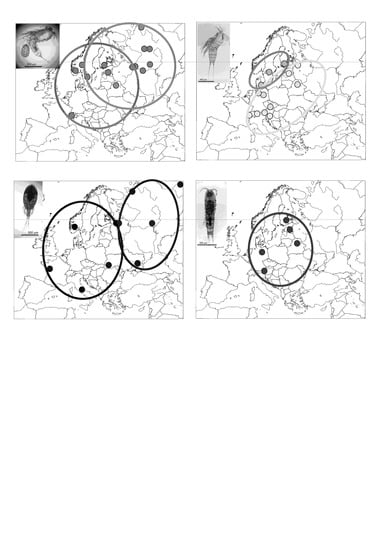
3.1. Attheyella crassa

In total, an alignment of 37 sequences (individuals) of mtDNA COI gene (545 bp), and one of 17 sequences of rRNA ITS gene (461 bp) were used in the analysis (Table 1). Two distinct mitochondrial clades termed the E (Eastern) and W (Western) clades, were identified from 13 populations in the ML tree (Figure 1a). The E clade included the single water bodies studied from Finland, Estonia, Sweden, and Belarus, and from Komi, Nenetsia (Pechora and Vychegda Rivers), the lake Glubokoe in Moscow region, and the Rybinsk reservoir in the Yaroslavl Region of Russia. The W clade was made up of individuals occurring in the Swiss Lake Geneva, two lakes in Norway and the Rybinsk reservoir in Russia. Additional sequences of closely related species A. dentata and A. (N.) nordenskioldii formed the separate clade on the COI gene tree. The same division into E and W clades was observed in the ITS gene tree from 17 sequences, including one from the Norwegian Store Le not analyzed for COI (Figure 1b). The presence of individuals from both E and W clades in the Rybinsk reservoir was identified congruently with the two mitochondrial and nuclear markers.
All three single-locus species delimitation methods (ABGD, GMYC and PTP) separated E and W clades in both markers. Further, GMYC and PTP approaches on ITS indicated the Rybinsk and Vänern populations in E clade as additional species, while they showed negligible divergence. The multi-locus approach (STACEY), which was based on the partitioned Bayesian species tree, only recognized the E and W clades as species.
The same division into E and W groups of haplotypes (with 84 mutations between them in COI gene and 23 mutations in ITS gene) is illustrated in the median-joining networks (Figure 1c,d). The average model-corrected distances between the E and W clades were 26.1% for COI and 5.5% for the nuclear ITS marker. For comparison, the divergence between A. crassa and A. dentata and A. (N.) nordenskioldii were about 35%. The intraclade diversity in E and W clades were 6.5% and 1.3% correspondingly for the COI gene and less than 1% for the ITS gene (Table 2).
The haplotype and nucleotide diversities were higher in the E clade (with the highest values in Pääjärvi lake and lower in Rybinsk reservoir in both clades), values of Tajima’s D and Fu’s Fs indexes were calculated only for two populations, they were insignificant but negative (Table 3).

3.2. Canthocamptus staphylinus

Overall, 59 sequences of COI (606 bp aligned) and 10 of 18S (1576 bp) were obtained (Table 1). The COI gene tree of C. staphylinus, representing 13 populations, also showed two major clades, nominally C (Continental) and F (Fennoscandian) (Figure 2a). The C clade comprised of ten populations, from Switzerland, Germany, Austria, Estonia, Belarus, and Russia (St. Petersburg). The F clade comprised of three populations, from Finland, Sweden, and Northern Germany. In the broader comparison, the two clades did not cluster together but the sequences of the Asian species C. kitaurensis and C. (B.) longifurcatus were positioned between them. The European C. microstaphylinus made the basal branch of the tree. The 18S gene, analyzed from five populations (Finland, Sweden, Estonia, Switzerland, and Russia) showed almost no variation (one common haplotype and three rare ones separated from them) and no consistent division between the COI clades (Figure 2b).
In the COI dataset, the ABGD and GMYC methods identified the C and F clades as different species (as well as C. kitaurensis, C. (B.) longifurcatus and C. microstaphylinus), while the PTP method would further separate the Finnish and Swedish populations in F clade, and the isolated Russian St. Petersburg from the other populations in C clade. No division was implied from the practically invariable 18S gene data. The STACEY approach, considering the two genes together, recognized the C and F clades.
The division into C and F groups of haplotypes (with 102 mutations between them) was similarly illustrated in the COI gene median-joining network, but again not in 18S (Figure 2c,d).
The average genetic distances between clades were 33.2% and 0.07% for the COI and 18S genes, respectively. The divergence among all Canthocamptus species ranged from 15.3% to 46.4% of the COI gene. The average intraclade distances in the F and C clades were 2.8% and 3.6% (COI) and 0.007% (18S) (Table 4).
Haplotype and nucleotide diversities were higher in the C clade than in the F clade, with the highest values in the Orlov pond and lowest in Pääjärvi lake. Tajima’s D and Fu’s Fs were calculated for four populations: three of them were significant (p < 0.05) a and fourth had negative value of Tajima’s D (Table 3).

3.3. Eucyclops serrulatus

Here, 38 sequences of COI (654 bp) and 12 sequences of ITS (628 bp) were analyzed (Table 1). The COI gene tree of E. serrulatus, from ten populations, again displayed two main clades: W (Western) and E (Eastern) (Figure 3a). The W clade comprised of various ponds in Russia (two in St Petersburg), Ukraine, Norway, France, and Italy. The E clade was mainly Russian and recorded in the ponds of St. Petersburg along with samples from three rivers, i.e., Karkalaika (Udmurtia), Severnaya Dvina (Arkhangelsk) and Lena (Yakutia, Siberia), and from the Dniester Liman in Ukraine. The closely related species E. taiwanensis, E. prionophorus, and E. cuatrocienegas formed another clade on the tree. The ITS gene tree only comprised three populations from Russia (two ponds in St. Petersburg and a river in Udmurtia) but showed the same division into two clades (Figure 3b). Both mtDNA and rRNA markers showed that individuals from the two clades co-existed in both ponds from St. Petersburg.
The ABGD and GMYC approaches identified the E and W clades as different species from the mtDNA data, while the PTP method also separated a group of four populations from Russia. From the ITS dataset, all three single-locus methods indicated the three species from Russia: two of them in ponds of St. Petersburg and the third from the river in Udmurtia. STACEY separated two groups, i.e., the E and W clades.
There were 70 mutations between the E and W groups of haplotypes in the COI median-joining network (Figure 3c). In the ITS gene network the specimen from the Tauride population belonging to E and W clades were separated in different haplotypes with 6 mutations between them (Figure 3d). The average COI genetic distances between the two clades were 36.6%, with 2.4% in the ITS gene. The divergence between other Eucylops species ranged from 38.5% to 48.1%. The E and W intraclade distances were 2.1% and 1.3% in COI gene and less than 0.5% in ITS (Table 5).
The nucleotide and haplotype diversities were higher in the E clade, with the highest values in the Orlov pond. Values of Tajima’s D and Fu’s Fs for two populations and were insignificant with one instance of negative Tajima’s D in Karkalai creek (Table 3).

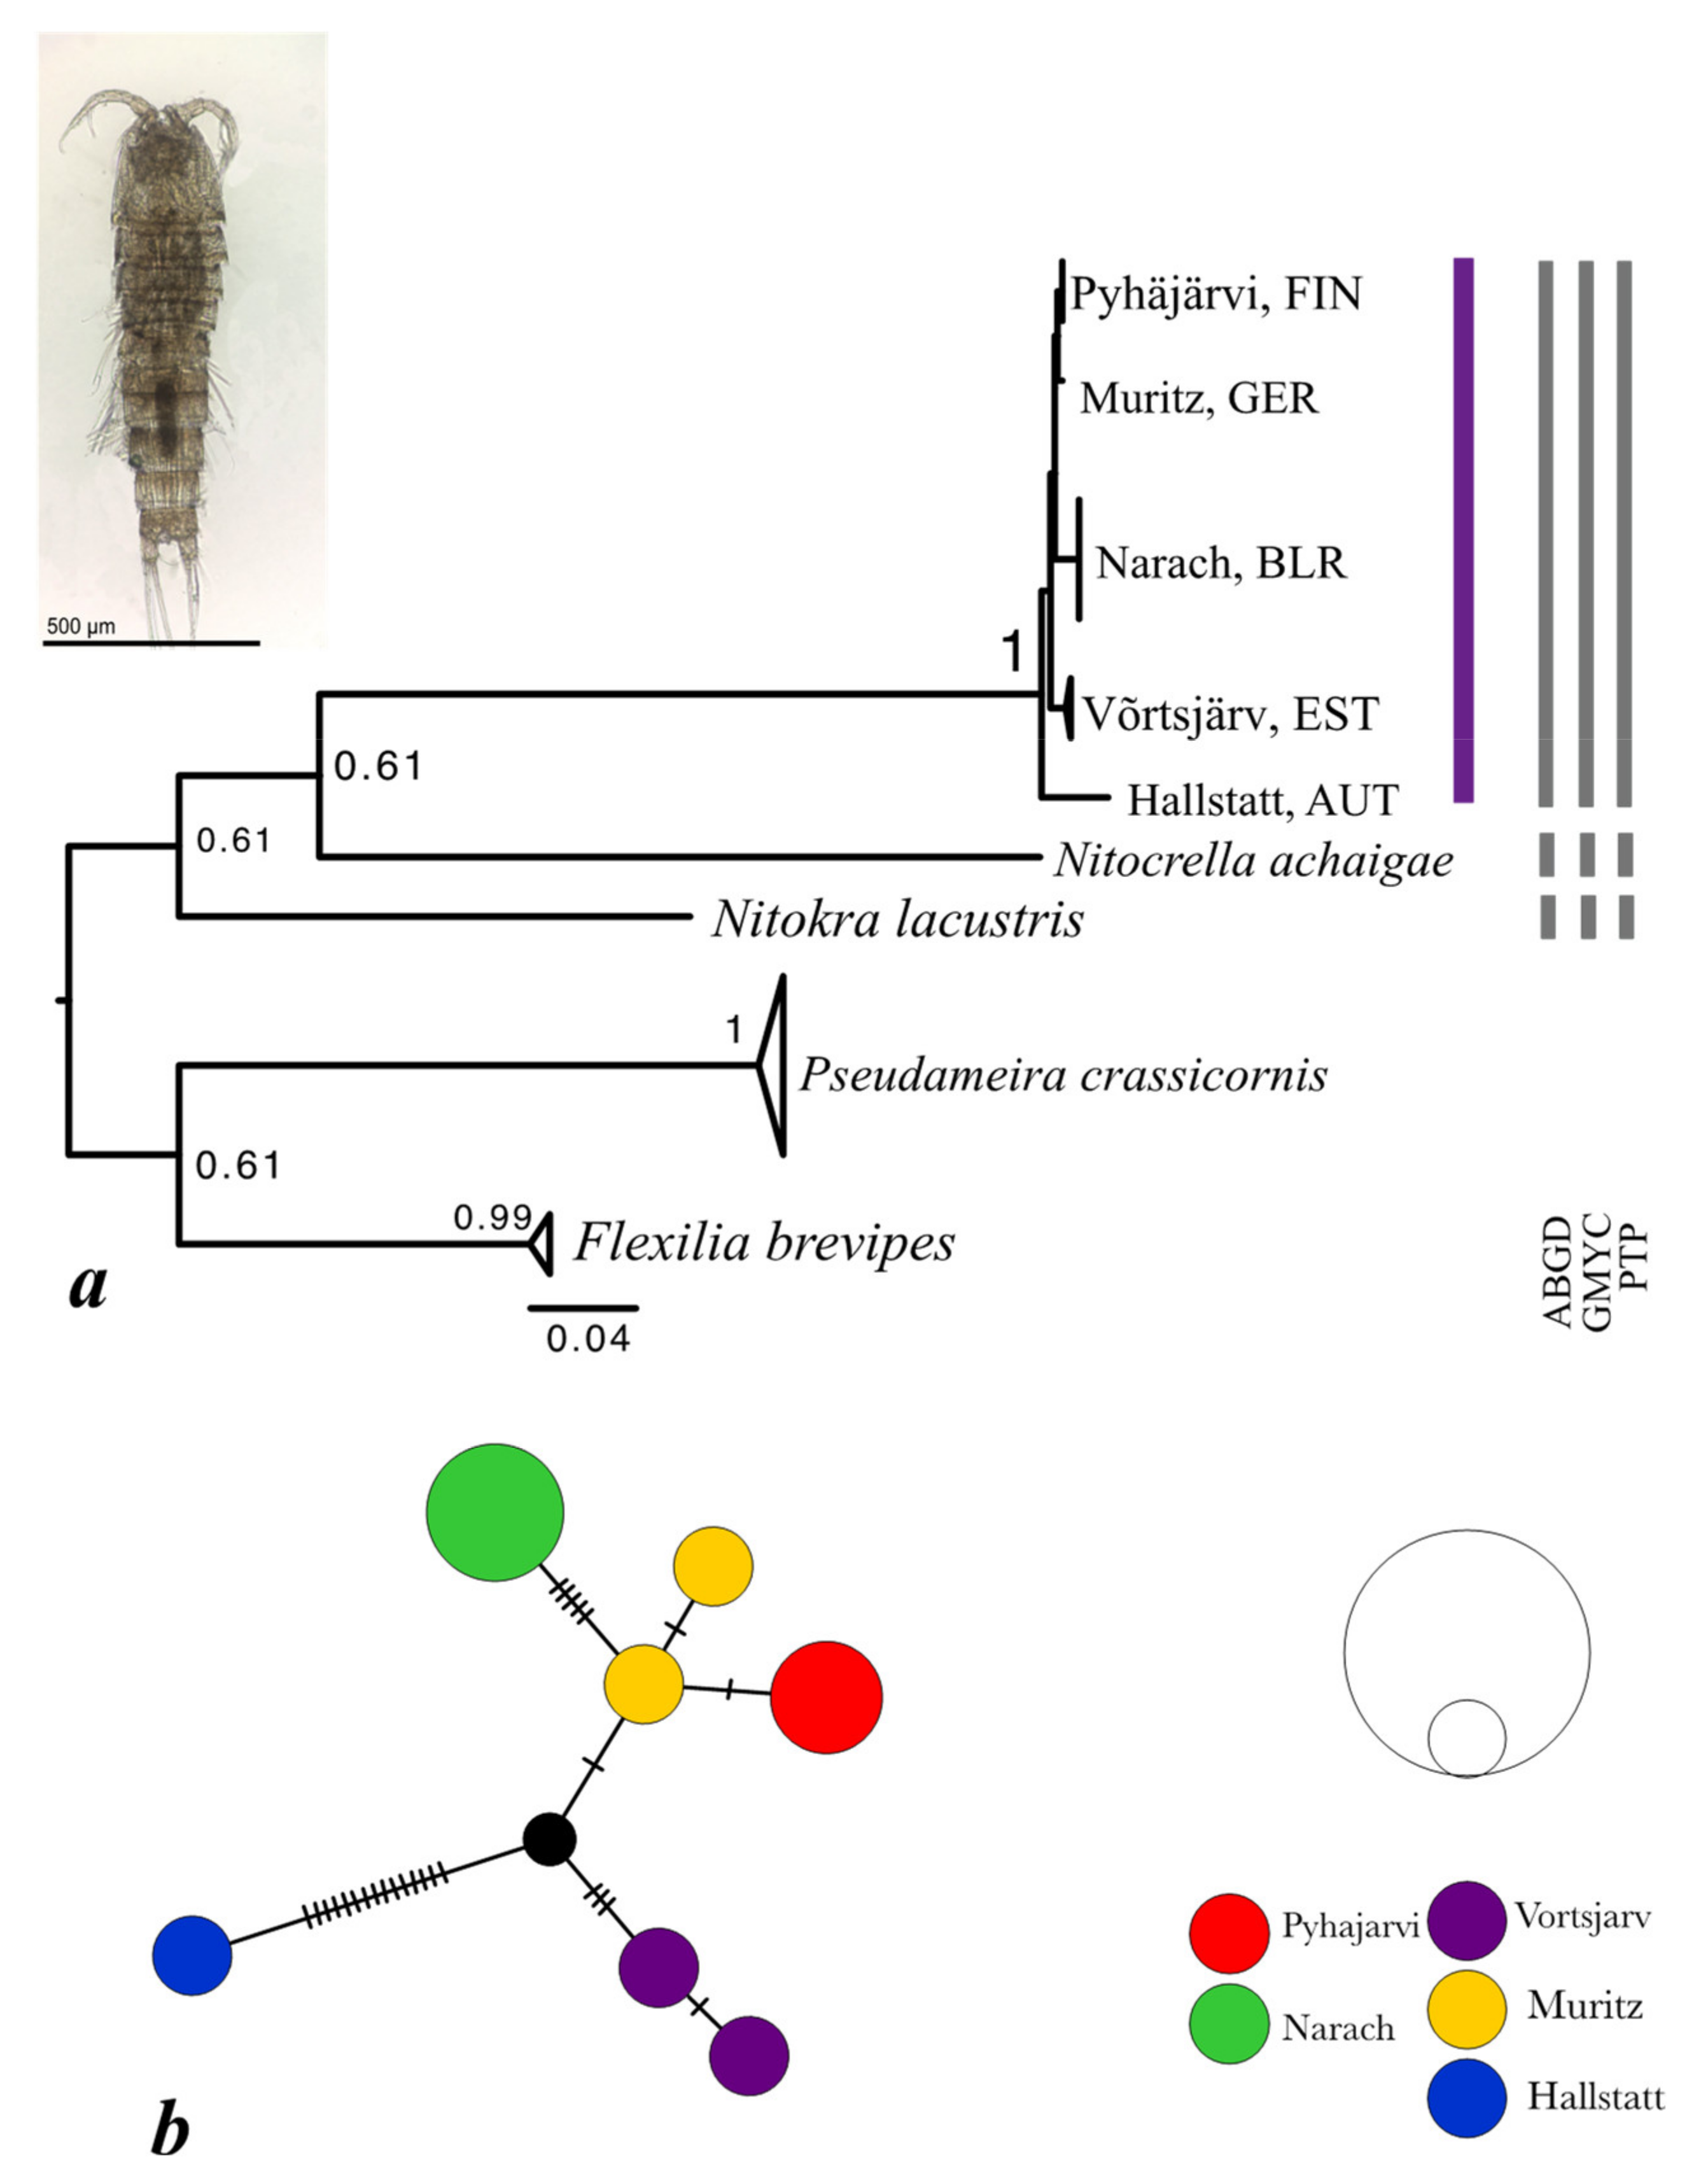
3.4. Nitokra hibernica

This analysis involved 10 COI gene sequences (554 bp) from five populations (Table 1). The diversity of N. hibernica was lower than in the other taxa, with no deep clades and COI distances around 3% (Table 6). The basal split was between an Austrian population and another clade comprising the samples from Belarus, Estonia, Finland, and Germany (Figure 4a). N. lacustris formed a sister clade on the tree and Nitocrella achaigae formed another (Figure 4a). The divergence between Nitokra species was 47.3% and between N. hibernica and N. achaigae was 53.4% (Table 6). In the median-joining network the Austrian population was distinct by 15 substitutions. Other populations were closer but showed clear inter-population differences contrasted by within-population homogeneity (maximum 1 substitution within population).

4. Discussion

4.1. Cryptic Diversification

Three of the four studied taxa, Attheyella crassa, Canthocamptus staphylinus, and Eucyclops serrulatus, show a division into two European clades with strong mitochondrial divergence (26.1–36.6%). The ranges of these sister clades are largely parapatric, although sympatric occurrences were also documented in putative contact zones, in E. serrulatus in St Petersburg, and in A. crassa in Rybinsk Reservoir, Russia. Four sequence-based species delimitation procedures unanimously suggested these sister clades as distinct species. One of the methods (PTP) would even have delineated some populations inside the main clades as species. The fourth taxon studied, Nitokra hibernica, does not show such a deep split, and the divergence between its main clades (3% in COI) rather corresponds to the intra-clade diversity in A. crassa, C. staphylinus, and E. serrulatus (1.3–5.5%). The geographical sampling of N. hibernica was however not as extensive as of the others and not comprehensive in relation to the overall range, and important subdivisions similar to those of other taxa could therefore have been missed.
The presence of clearly diverged sister clades and cryptic species, and in general high levels of intra- and interspecific divergence, have been a common observation in studies of marine copepods [44,45,46,47,86,87,88,89]. Phylogeographic studies of freshwater copepods have demonstrated similar patterns, and their interpretation in the framework of geographical factors and geological events may have been more easily connected with the role of isolation in the speciation process. For instance, in the calanoid Eudiaptomus hadzici four isolated cryptic species were identified from relatively closely situated lakes or groups of lakes in the Western Balkans [21]. Similarly, four geographically separate phylogroups of Neutrodiaptomus tumidus were revealed in Taiwan [76]. In a study of Cyclops, Holynska and Wyngaard [49] pointed out that the distinct distributions of the morphological and genetic sister species C. lacustris, C. bohater, and C. divergens suggest a speciation history connected with geographical isolation. Further, molecular data indicated the subdivision of the freshwater calanoid Hemidiaptomus ingens in the Mediterranean area into three distinct lineages and divided H. roubaui into two geographically isolated species: H. roubaui and H. maroccanus, highlighting ample unknown diversity in morphologically similar widespread species [26]. Similarly, among North American populations of Skistodiaptomus pallidus, three genetically divergent clades were identified [77].
In terms of quantitative divergence estimates, the ranges of interspecific and interclade (cryptic) COI variation found in this study are similar to those in other freshwater copepods: the model-corrected distances of the above-mentioned sister lineages of E. hadzici, N. tumidus, H. ingens, and S. pallidus ranged from 15.2% in N. tumidus to 56.3% in H. ingens (Table 7). For the comparability of studies these estimates have been recalculated using the GTR+Г substitution model similarly to our own data, and aiming to make them proportional to divergence time [27]. The observed p-distances are often almost half as small (also in Table 7), yet also illustrate the parallels among taxa. It should be noted that copepod populations also overall show extreme mitochondrial DNA diversity [90]. Interestingly, this is not only for geographically isolated freshwater populations, but also for marine species, where populations from relatively close locations can demonstrate high variability [11,20,44,45,46,47,50,86,87,88,89,90,91,92]. These “intra-species” levels are extraordinary in comparison with vertebrate and invertebrate taxa, which commonly show <3% intraspecific and >2% interspecific variation [93,94,95]. Rawson and Burton [96] explained that the unexpected genetic diversity in copepod mtDNA can be caused by clonal inheritance which reduces the effective population size and increases the likelihood of deleterious mutation fixation. The influences of short life span, fast generation time and peculiar life history of microcrustacean species have also been implicated. As yet there is no theoretical or experimental evidence of the relevance of these factors as accounting for the observations in freshwater taxa.
The lower divergence in the nuclear markers is in line with data from previous copepod studies [24,44] and with the generally comparatively slow rates in ribosomal RNA genes [102,103]. The 18S rRNA in particular is too conservative for phylogeographic investigations [24], and showed no informative differentiation in our study. However, the ITS gene was more variable and distinguished the major groups congruently with mtDNA, although with lower sequence divergence (3–7%). It appears a suitable nuclear marker for intraspecific population structure and species delimitation [11]. Most importantly, the congruent information of mtDNA and nuclear markers of the presence of two lineages sympatrically in one lake (in each of A. crassa and E. serrulatus) supports a taxonomic distinction, although more data is desirable for proving reproductive isolation.
The terming of the major clades of A. crassa, C. staphylinus, and E. serrulatus as cryptic species also accords with the absence of phenotypic differences among them. In our previous studies, morphological variability of certain characters among populations of these species was observed [48,51,52]. In A. crassa there was statistical variation in total body length, relative length and width of caudal rami, and the ratio of length and widths of exopod and baseoendopod of the fifth legs [51]. Among populations of C. staphylinus, variable characters included ratios of spine length of the fifth pair of thoracic legs, numbers of spinules on the anal operculum, and the development of the aesthetask of the antennule [52]. Populations of E. serrulatus showed differences in morphology of setae on caudal rami and swimming legs [48]. However, these morphometric characters did not split the groups congruently with the genetic clades and remained variable across all populations in each of three species. No morphological differences were found in populations of N. hibernica (Kochanova, unpubl.) The slow rate of morphological evolution relative to molecular evolution is emerging as a general pattern in copepods [41,91,104,105,106], and indicates that modern morphological resemblance does not necessarily mirror cladogenetic events [11,77].
The observations on the phylogenetic structure and deep splits among populations of A. crassa, C. staphylinus, and E. serrulatus, together with previous studies on cryptic speciation among freshwater copepods, illustrates the broad underestimation of the true taxonomic diversity. As a rule, and as a clear antithesis to the previous “cosmopolitanism paradigm”, molecular studies on putatively widespread freshwater copepods (and other planktonic and meiobenthic organisms [3,4,5,6,7,8,9,10]) show that they indeed represent a high number of different species or complexes of cryptic species, while often remaining indistinguishable by morphological characters. Rather, “regionalism” and “provincialism” of freshwater taxa are replacing the concept of global homogeneity of widespread species [26].

4.2. Comparative Phylogeography

Comparative phylogeography is an important approach to understanding the biotic response to past challenges and can provide a compass for contemporary and future changes [28]. For instance, Soltis et al. [107] examined the phylogeographic structures of 157 species of fish, amphibians, birds, reptiles, mammals, molluscs, crustaceans, insects, algae, fungi, moss, trees, and plants from eastern North America and recognized six main recurrent patterns which may generally be attributable to isolation and differentiation during Pleistocene glaciations, although may in some cases be older (Pliocene). Interestingly, many species exhibited distinct patterns that reflect the unique, rather than the shared, aspects of species’ phylogeographical histories. Similarly, the comparative phylogeography of oceanic species of cetaceans, fishes, turtles, and plankton [108] showed that the main common phylogeographic patterns were influenced by glacial cycles and changes in sea levels; however, they also demonstrated alternative pathways, such as ecological speciation and parapatric (semi-isolated) divergences. Bowen et al. [108] showed that the general concordance between biogeography and phylogeography indicates that the population-level genetic divergences observed between provinces are a starting point for macroevolutionary divergences between species. This can be crucial for recognizing the hidden cryptic diversity in conservation and natural resource protection and management [109].
At the same time, comparative phylogeographic approaches among closely related and ecologically similar species should be more sensitive to reflect shared processes (‘phylogeographic parallelism’) [110] and to point out the factors underlying discordant phylogeographic patterns, since the analysis is less biased by major biological differences of the taxa [111]. We know of no previous studies on comparative phylogeography of copepods. But a study of two closely related species of metallic show skink in Tasmania [111] demonstrated remarkably similar phylogeographic patterns suggesting that these species responded similarly to Plio-Pleistocene climate cycling, and that glacial cold and aridity forced them into similar lowland refugial regions throughout the area. Likewise, comparison of phylogeographic patterns of 12 species from desert-dwelling fauna in the Mojave and Sonoran deserts identified six hotspots of high genetic divergence and diversity and suggested that most of the species diversified into distinct lineages prior to Pleistocene climatic changes [31].
In our study, the main lines of subdivision in three European freshwater copepod taxa do not exactly concur, but may be divided into two patterns: Eastern–Western (E–W) in A. crassa and E. serrulatus and Continental–Fennoscandian (C–F) in C. staphylinus (Figure 5).
A. crassa and E. serrulatus are from different copepod orders but both are thermophilic and prefer summer seasons for active stages of life cycles [43,64]. Similar contacts of eastern and western lineages are known from several terrestrial and aquatic taxa, and they constitute a general pattern in North European biogeography. Generally, the North European fauna has been regarded as a mixture of Siberian and European elements, which have immigrated from non-glaciated refugial areas in the east and the south [4,112,113]. The division of A. crassa runs between Swedish and Norwegian populations, which relates to the hypothesis of Fennoscandian colonization from both north-eastern and south-western directions [114]. The unexpected occurrence of two haplotypes from distant clades in the Rybinsk reservoir might be linked with migration assisted by water birds [115] as the Black Sea Flyway connects the Basin of Volga River with the area of the Western clade [116]. The contact zone between clades of E. serrulatus passes through waterbodies in St. Petersburg, Russia: in two distant ponds (Orlov pond, the type locality of the species, and the pond in Tauride garden), there are representatives of two separate groups.
The structure in C. staphylinus appears as a north vs. south subdivision. This species, in contrast to others, is psychrophilic and can be found in an active form even under ice and at a temperature of 0 °C [62]. It also differs from others by the capability to form resting cysts and encapsulate during unfavorable environmental conditions, for example when the temperature goes below 4 °C or above 15 °C [62]. The limit between the two clades is essentially between Fennoscandia and the Continental part of Europe, in the Baltic Sea. The nucleotide and haplotype diversities in Fennoscandian populations are smaller than on the continent (Table 3). The obviously consistent north–south pattern may reflect the existence of two climatically adapted taxa whose distributions have been adjusted in parallel through the recurring climatic cycles. It will be interesting to see whether there are real contact areas where these taxa occur together and how their putative ecological and genetic distinctness would be maintained.
In Nitokra hibernica, no significant division or divergence was observed which could reflect the more limited sampling of populations in this species. On the other hand, N. hibernica is the only species in the analysis that can inhabit both freshwater and brackish environments as it has a broad salinity tolerance [43]. Such plasticity helps it to occupy a wide variety of water bodies, similar to what has been shown for the calanoid copepod Eurytemora affinis [117]. However, at this stage, we are not able to conclude the phylogeographic structure for this species and further studies are needed.

4.3. Demographic History

Apart from the broad-scale divisions and divergence, the intra-clade structure in haplotypic distribution (e.g., ‘demographic tests’) are informative of the population history, particularly of a post-glacial time scale. In the haplotype networks of A. crassa (Figure 1c,d) E. serrulatus (Figure 3c,d) and particularly of C. staphylinus (Figure 2c) individual populations often comprised of single haplotypes or of a core haplotype with adjacent singletons one step away, and there was little or no overlap between populations (unique coalescence of lake-wise genealogy). Such homotypic or star-like patterns are indicative of population expansion since the (post-glacial) colonization of the lake (a population bottleneck), and are reflected in the negative Tajima’s D and Fu’s Fs values [80,118,119]. Overall, this kind of structuring is congruent with other copepod species [120]. Indeed, given the environment and reproductive dynamics, population expansions from an initially small stock are not unexpected among copepods or any small aquatic invertebrates [121]. More intriguing is the question of the nature of the initial bottlenecks (rapid coalescence), whether they were connected only with the colonization processes or also with subsequent or preceding population dynamics (cycles of expansion and bottlenecks), or eventually with selective sweeps in the genome.

4.4. Age of Diversity

Under general concepts of mitochondrial substitution rates, the deep divergences among the ‘conspecific’ copepod clades (26–36%) would in the first place suggest distinctly pre-Pleistocene origins for each lineage. While no properly calibrated rate estimates are available for copepods in particular, for other crustaceans estimates of COI rates in the range 1.4% to 4% divergence Ma-1 have been obtained and used as a basis of discussion [97,98,99,100,101]. With these rates, all the three pairs of cryptic species in our data would have diverged already in the Miocene, from 6 to 26 Ma (Table 7). While this appears unexpected in the context of European biogeography, in the context of copepod systematics these estimates are not exceptional: similar or even deeper cryptic lineages are frequently observed [20,21,26,44,45,89,90,91,104,105]. Several studies on the phylogeography of freshwater copepods (including European populations) have pointed to the Early Miocene as a possible time of initial divergence [21,26,76]. Similarly, Miocene isolation events were implicated for the initial divergences of the North American copepod Skistodiaptomus [77]. Pre-Pleistocene origin is also shown in the freshwater isopod Asellus aquaticus, whose species diversification was interpreted as dating back to the Middle Miocene and was triggered by the Parathethys regression, continuing with several lineages surviving and diversifying through the Pliocene and Pleistocene glaciations and populating the areas free of ice during the interglacials [7,23,101]. We need to stress caution in making generalizations regarding the potentially exceptional dynamics of copepod mtDNA evolution and lack of proper calibration. Nevertheless, even with considerably higher rates (e.g., 10% Ma−1) the divergences would appear pre-Pleistocene (Table 7). An implication is that the origin of the newly revealed cryptic diversity was not connected with Pleistocene events. Regarding putative non-monophyly of (e.g.,) C. staphylinus with respect to Asian taxa (Figure 2), the diversification and invasion events should also be viewed in their broader geographic perspective. But at all events the distributions of the component taxa in Europe must have been (repeatedly) adjusted through the Pleistocene dynamics of extirpation, isolation, expansion, and colonization. The data so far may involve unexpectedly little traces of events, e.g., further radiations, at that time scale.

5. Conclusions

Our study describes contrasting phylogenetic and phylogeographic structures within the four widespread freshwater copepod species Attheyella crassa, Canthocamptus staphylinus, Eucyclops serrulatus, and Nitokra. hibernica in Europe. The first three taxa each represent a complex of cryptic species with an overall high level of genetic diversity but low phenotypic differentiation. N. hibernica in turn shows only low genetic divergence between populations. The two main patterns of distribution of the recognized sister lineages were Eastern–Western (for A. crassa and E. serrulatus) and Continental–Fennoscandian (for C. staphylinus). The deep mitochondrial splits suggest that the lineages could have diverged already in the Micocene or at least before the Pleistocene, prior to major glacial cycles. Their currently largely allopatric distributions point to differential refugial and colonization histories in later Pleistocene times. The pattern of lake-wise haplotype and haplotype cluster distributions in turn reflect more recent colonization dynamics, probably of post-glacial colonization bottlenecks and population expansions.

Supplementary Materials

The following are available online at https://www.mdpi.com/article/10.3390/d13090448/s1, Table S1: Sampling localities, number of obtained sequences and GenBank accession numbers, Table S2: Primer sequences for PCR amplification and sequencing, Table S3: Analysis of molecular variance (AMOVA) of the studied species among different populations.

Author Contributions

Conceptualization, E.K., N.S., A.N. and R.V.; methodology, E.K.; validation, E.K., A.N., R.V. and A.H.; formal analysis, E.K.; investigation, E.K.; resources, E.K., N.S.; data curation, E.K.; writing—original draft preparation, E.K.; writing—review and editing, E.K., A.N., N.S., R.V. and A.H.; visualization, E.K.; supervision, R.V., A.N., A.H.; funding acquisition, E.K., N.S., R.V. and A.H. All authors have read and agreed to the published version of the manuscript.

Funding

This research was funded by a grant from the Russian Foundation for Basic Research (RFBR 20-04-00035, 20-34-70020), a University of Helsinki grant under the LUOVA doctoral programme, and grant from EDUFI (Ministry of Education, Finland: TM-17-10588/WS21). This work was conducted in accordance with the national research initiative AAAA-A19-119020690091-0 of the Russian Academy of Science. The Federal Collection of Zoological Institute RAS was also used. Open access funding provided by University of Helsinki.

Institutional Review Board Statement

The procedure for catching and collecting the animals was in accordance with the Act on the Use of Animals for Experimental Purposes (62/2006), Ministry of Agriculture and Forestry, Finland.

Informed Consent Statement

Not applicable.

Data Availability Statement

All obtained nucleotide sequences of the studied species are available in GenBank database, the accession numbers are listed in Table 1.

Acknowledgments

We are grateful to Inta Dimante-Deimantovica (Latvian Institute of Aquatic Ecology), Maria Baturina (Institute of Biology of Komi Scientific Center of the Ural Branch of the Russian Academy of Sciences) and Vladimir Gusakov (Papanin Institute for Biology of Inland Waters Russian Academy of Sciences) for harpacticoid samples, Elena Fefilova (Institute of Biology of Komi Scientific Center of the Ural Branch of the Russian Academy of Sciences) for providing additional sequences of A. crassa and E. bidens, and Carol Lee (University of Wisconsin) for consultation.

Conflicts of Interest

The authors declare no conflict of interest.

References

  1. Incagnone, G.; Marrone, F.; Barone, R.; Robba, L.; Naselli-Flores, L. How do freshwater organisms cross the “dry ocean”? A review on passive dispersal and colonization processes with a special focus on temporary ponds. Hydrobiologia 2015, 750, 103–123. [Google Scholar] [CrossRef]
  2. Sudasinghe, H.; Pethiyagoda, R.; Ranasinghe, R.H.T.; Raghavan, R.; Dahanukar, N.; Meegaskumbura, M. A molecular phylogeny of the freshwater-fish genus Rasbora (Teleostei: Cyprinidae) in Sri Lanka reveals a remarkable diversification-And a cryptic species. J. Zool. Syst. Evol. Res. 2020, 58, 1076–1110. [Google Scholar] [CrossRef]
  3. Cordellier, M.; Pfenninger, M. Inferring the past to predict the future: Climate modelling predictions and phylogeography for the freshwater gastropod Radix balthica (Pulmonata, Basommatophora). Mol. Ecol. 2009, 18, 534–544. [Google Scholar] [CrossRef]
  4. Bekker, E.I.; Karabanov, D.P.; Galimov, Y.R.; Haag, C.R.; Neretina, T.V.; Kotov, A.A. Phylogeography of Daphnia magna Straus (Crustacea: Cladocera) in Northern Eurasia: Evidence for a deep longitudinal split between mitochondrial lineages. PLoS ONE 2018, 13, e0194045. [Google Scholar] [CrossRef]
  5. Neretina, A.N.; Karabanov, D.P.; Sacherova, V.; Kotov, A.A. Unexpected mitochondrial lineage diversity within the genus Alonella Sars, 1862 (Crustacea: Cladocera) across the Northern Hemisphere. PeerJ 2021, 9, e10804. [Google Scholar] [CrossRef]
  6. Zuykova, E.I.; Bochkarev, N.A.; Taylor, D.J.; Kotov, A.A. Unexpected endemism in the Daphnia longispina complex (Crustacea: Cladocera) in Southern Siberia. PLoS ONE 2019, 14, e0221527. [Google Scholar] [CrossRef] [PubMed] [Green Version]
  7. Verovnik, R.; Sket, B.; Trontelj, P. The colonization of Europe by the freshwater crustacean Asellus aquaticus (Crustacea: Isopoda) proceeded from ancient refugia and was directed by habitat connectivity. Mol. Ecol. 2005, 14, 4355–4369. [Google Scholar] [CrossRef]
  8. Vainio, J.K.; Väinölä, R. Refugial races and postglacial colonization history of the freshwater amphipod Gammarus lacustris in Northern Europe. Biol. J. Linn. Soc. 2003, 79, 523–542. [Google Scholar] [CrossRef]
  9. Weiss, M.; Macher, J.N.; Seefeldt, M.A.; Leese, F. Molecular evidence for further overlooked species within the Gammarus fossarum complex (Crustacea: Amphipoda). Hydrobiologia 2014, 721, 165–184. [Google Scholar] [CrossRef]
  10. Westram, A.M.; Jokela, J.; Keller, I. Hidden biodiversity in an ecologically important freshwater amphipod: Differences in genetic structure between two cryptic species. PLoS ONE 2013, 8, e69576. [Google Scholar] [CrossRef] [PubMed] [Green Version]
  11. Rocha-Olivares, A.; Fleeger, J.W.; Foltz, D.W. Decoupling of molecular and morphological evolution in deep lineages of a meiobenthic harpacticoid copepod. Mol. Biol. Evol. 2001, 18, 1088–1102. [Google Scholar] [CrossRef] [Green Version]
  12. Pfenninger, M.; Schwenk, K. Cryptic animal species are homogeneously distributed among taxa and biogeographical regions. BMC Evol. Biol. 2007, 7, 121. [Google Scholar] [CrossRef] [Green Version]
  13. García-Morales, A.E.; Elías-Gutiérrez, M. DNA barcoding of freshwater Rotifera in Mexico: Evidence of cryptic speciation in common rotifers. Mol. Ecol. Resour. 2013, 13, 1097–1107. [Google Scholar] [CrossRef] [PubMed]
  14. Jo, H.; Ventura, M.; Vidal, N.; Gim, J.-S.; Buchaca, T.; Barmuta, L.A.; Jeppesen, E.; Joo, G.-J. Discovering hidden biodiversity: The use of complementary monitoring of fish diet based on DNA barcoding in freshwater ecosystems. Ecol. Evol. 2016, 6, 219–232. [Google Scholar] [CrossRef] [PubMed] [Green Version]
  15. Macher, J.N.; Salis, R.K.; Blakemore, K.S.; Tollrian, R.; Matthaei, C.D.; Leese, F. Multiple-stressor effects on stream invertebrates: DNA barcoding reveals contrasting responses of cryptic mayfly species. Ecol. Indic. 2016, 61, 159–169. [Google Scholar] [CrossRef]
  16. Pereira, L.H.G.; Pazian, M.F.; Hanner, R.; Foresti, F.; Oliveira, C. DNA barcoding reveals hidden diversity in the Neotropical freshwater fish Piabina argentea (Characiformes: Characidae) from the Upper Paran Basin of Brazil. Mitochondrial DNA 2011, 22 (Suppl. 1), 87–96. [Google Scholar] [CrossRef]
  17. Fujisawa, T.; Barraclough, T.G. Delimiting Species Using Single-Locus Data and the Generalized Mixed Yule Coalescent Approach: A Revised Method and Evaluation on Simulated Data Sets. Syst. Biol. 2013, 62, 707–724. [Google Scholar] [CrossRef] [Green Version]
  18. Kapli, P.; Lutteropp, S.; Zhang, J.; Kobert, K.; Pavlidis, P.; Stamatakis, A.; Flouri, T. Phylogenetics Multi-rate Poisson tree processes for single-locus species delimitation under maximum likelihood and Markov chain Monte Carlo. Bioinformatics 2017, 33, 1630–1638. [Google Scholar] [CrossRef] [PubMed] [Green Version]
  19. Puillandre, N.; Lambert, A.; Brouillet, S.; Achaz, G. ABGD, Automatic Barcode Gap Discovery for primary species delimitation. Mol. Ecol. 2012, 21, 1864–1877. [Google Scholar] [CrossRef]
  20. Cornils, A.; Held, C. Evidence of cryptic and pseudocryptic speciation in the Paracalanus parvus species complex (Crustacea, Copepoda, Calanoida). Front. Zool. 2014, 11, 19. [Google Scholar] [CrossRef] [PubMed] [Green Version]
  21. Previšić, A.; Gelemanović, A.; Urbanič, G.; Ternjej, I. Cryptic diversity in the Western Balkan endemic copepod: Four species in one? Mol. Phylogenet. Evol. 2016, 100, 124–134. [Google Scholar] [CrossRef] [PubMed]
  22. Rossel, S.; Martínez Arbizu, P. Revealing higher than expected diversity of Harpacticoida (Crustacea:Copepoda) in the North Sea using MALDI-TOF MS and molecular barcoding. Sci. Rep. 2019, 9, 9182. [Google Scholar] [CrossRef] [PubMed] [Green Version]
  23. Sworobowicz, L.; Grabowski, M.; Mamos, T.; Burzyński, A.; Kilikowska, A.; Sell, J.; Wysocka, A. Revisiting the phylogeography of Asellus aquaticus in Europe: Insights into cryptic diversity and spatiotemporal diversification. Freshw. Biol. 2015, 60, 1824–1840. [Google Scholar] [CrossRef]
  24. Vakati, V.; Eyun, S.I.; Lee, W. Unraveling the intricate biodiversity of the benthic harpacticoid genus Nannopus (Copepoda, Harpacticoida, Nannopodidae) in Korean waters. Molecular Phylogenetics Evol. 2019, 130, 366–379. [Google Scholar] [CrossRef] [PubMed]
  25. Hamrová, E.; Krajicek, M.; Karanovic, T.; Černý, M.; Petrusek, A. Congruent patterns of lineage diversity in two species complexes of planktonic crustaceans, Daphnia longispina (Cladocera) and Eucyclops serrulatus (Copepoda), in East European mountain lakes. Zool. J. Linn. Soc. 2012, 166, 754–767. [Google Scholar] [CrossRef] [Green Version]
  26. Marrone, F.; Lo Brutto, S.; Hundsdoerfer, A.K.; Arculeo, M. Overlooked cryptic endemism in copepods: Systematics and natural history of the calanoid subgenus Occidodiaptomus Borutzky 1991 (Copepoda, Calanoida, Diaptomidae). Mol. Phylogenet. Evol. 2013, 66, 190–202. [Google Scholar] [CrossRef] [Green Version]
  27. Laakkonen, H.M.; Hardman, M.; Strelkov, P.; Väinölä, R. Cycles of trans-Arctic dispersal and vicariance, and diversification of the amphi-boreal marine fauna. J. Evol. Biol. 2021, 34, 73–96. [Google Scholar] [CrossRef]
  28. Avise, J.C.; Bowen, B.W.; Ayala, F.J. In the light of evolution X: Comparative phylogeography. Proc. Natl. Acad. Sci. USA 2016, 113, 7957–7961. [Google Scholar] [CrossRef] [Green Version]
  29. Wallace, A.R. The Geographical Distribution of Animals; With a Study of the Relations of Living and Extinct Faunas as Elucidating the Past Changes of the Earth’s Surface; Macmillan & Co.: London, UK, 1876; Volume 2. [Google Scholar]
  30. Riddle, B.R. Comparative phylogeography clarifies the complexity and problems of continental distribution that drove A. R. Wallace to favor islands. Proc. Natl. Acad. Sci. USA 2016, 113, 7970–7977. [Google Scholar] [CrossRef] [Green Version]
  31. Wood, D.A.; Vandergast, A.G.; Barr, K.R.; Inman, R.D.; Esque, T.C.; Nussear, K.E.; Fisher, R.N. Comparative phylogeography reveals deep lineages and regional evolutionary hotspots in the Mojave and Sonoran Deserts. Divers. Distrib. 2013, 19, 722–737. [Google Scholar] [CrossRef]
  32. Marko, P.B. “What’s larvae got to do with it?” Disparate patterns of post-glacial population structure in two benthic marine gastropods with identical dispersal potential. Mol. Ecol. 2004, 13, 597–611. [Google Scholar] [CrossRef]
  33. Hewitt, G.M. Genetic consequences of climatic oscillations in the Quaternary. Philos. Trans. R. Soc. B Biol. Sci. 2004, 359, 183–195. [Google Scholar] [CrossRef] [Green Version]
  34. Babik, W.; Branicki, W.; Crnobrnja-Isailović, J.; Cogǎlniceanu, D.; Sas, I.; Olgun, K.; Poyarkov, N.A.; Garcia-París, M.; Arntzen, J.W. Phylogeography of two European newt species—Discordance between mtDNA and morphology. Mol. Ecol. 2005, 14, 2475–2491. [Google Scholar] [CrossRef] [PubMed]
  35. Seddon, J.M.; Santucci, F.; Reeve, N.J.; Hewitt, G.M. DNA footprints of European hedgehogs, Erinaceus europaeus and E. concolor: Pleistocene refugia, postglacial expansion and colonization routes. Mol. Ecol. 2001, 10, 2187–2198. [Google Scholar] [CrossRef] [PubMed] [Green Version]
  36. Nascetti, G.; Zangari, F.; Canestrelli, D. The spectacled salamanders, Salamandrina terdigitata (Lacépède, 1788) and S. perspicillata (Savi, 1821): Genetic differentiation and evolutionary history. Rend. Lincei 2005, 16, 159–169. [Google Scholar] [CrossRef]
  37. Paulo, O.S.; Dias, C.; Bruford, M.W.; Jordan, W.C.; Nichols, R.A. The persistence of Pliocene populations through the Pleistocene climatic cycles: Evidence from the phylogeography of an Iberian lizard. Proceedings of the Royal Society B. Biol. Sci. 2001, 268, 1625–1630. [Google Scholar] [CrossRef] [Green Version]
  38. Ursenbacher, S.; Schweiger, S.; Tomović, L.; Crnobrnja-Isailović, J.; Fumagalli, L.; Mayer, W. Molecular phylogeography of the nose-horned viper (Vipera ammodytes, Linnaeus (1758)): Evidence for high genetic diversity and multiple refugia in the Balkan peninsula. Mol. Phylogenet. Evol. 2008, 46, 1116–1128. [Google Scholar] [CrossRef]
  39. Ho, S. The Molecular clock and estimating species divergence. Nat. Educ. 2008, 1, 168. [Google Scholar]
  40. Jażdżewska, A.M.; Rewicz, T.; Mamos, T.; Wattier, R.; Bącela-Spychalska, K.; Grabowski, M. Cryptic diversity and mtDNA phylogeography of the invasive demon shrimp, Dikerogammarus haemobaphes (Eichwald, 1841), in Europe. NeoBiota 2020, 57, 53–86. [Google Scholar] [CrossRef]
  41. Bron, J.E.; Frisch, D.; Goetze, E.; Johnson, S.C.; Lee, C.E.; Wyngaard, G.A. Observing copepods through a genomic lens. Front. Zool. 2011, 8, 22. [Google Scholar] [CrossRef] [Green Version]
  42. Regier, J.C.; Shultz, J.W.; Kambic, R.E. Pancrustacean phylogeny: Hexapods are terrestrial crustaceans and maxillopods are not monophyletic. Proc. R. Soc. B Biol. Sci. 2005, 272, 395–401. [Google Scholar] [CrossRef]
  43. Borutzky, E.V. Freshwater Harpacticoida. Crustacea. Freshwater Harpacticoida. Fauna of the USSR; USSR Academy of Sciences: Moscow, Russia, 1952; Volume 3, 424p. (In Russian) [Google Scholar]
  44. Easton, E.E.; Thistle, D.; Spears, T. Species boundaries in Zausodes-complex species (Copepoda: Harpacticoida: Harpacticidae) from the north-eastern Gulf of Mexico. Invertebr. Syst. 2010, 24, 258–270. [Google Scholar] [CrossRef]
  45. Lee, C.E. Global phylogeography of a cryptic copepod species complex and reproductive isolation between genetically proximate “populations”. Evolution 2000, 54, 2014–2027. [Google Scholar] [CrossRef]
  46. Questel, J.M.; Blanco-Bercial, L.; Hopcroft, R.R.; Bucklin, A. Phylogeography and connectivity of the Pseudocalanus (Copepoda: Calanoida) species complex in the eastern North Pacific and the Pacific Arctic Region. J. Plankton Res. 2016, 38, 610–623. [Google Scholar] [CrossRef] [PubMed] [Green Version]
  47. Winkler, G.; Souissi, S.; Poux, C.; Castric, V. Genetic heterogeneity among Eurytemora affinis populations in Western Europe. Mar. Biol. 2011, 158, 1841–1856. [Google Scholar] [CrossRef]
  48. Sukhikh, N.; Alekseev, V. Genetic and morphological heterogeneity within Eucyclops serrulatus (Fischer, 1851) (Crustacea: Copepoda: Cyclopidae). J. Nat. Hist. 2015, 49, 2929–2953. [Google Scholar] [CrossRef]
  49. Hołyńska, M.; Wyngaard, G.A. Towards a phylogeny of Cyclops (Copepoda): (in) Congruences among morphology, molecules and zoogeography. Zool. Scr. 2019, 48, 376–398. [Google Scholar] [CrossRef]
  50. Karanovic, T.; Cooper, S.J.B. Explosive radiation of the genus Schizopera on a small subterranean island in Western Australia (Copepoda:Harpacticoida): Unravelling the cases of cryptic speciation, size differentiation and multiple invasions. Invertebr. Syst. 2012, 26, 115–192. [Google Scholar] [CrossRef]
  51. Kochanova, E.S.; Gaviria, S. Integrative taxonomy of the freshwater harpacticoid Attheyella crassa G.O. Sars, 1863 (Crustacea: Copepoda: Canthocamptidae) in the Palearctic region. Invertebr. Zool. 2018, 15, 267–276. [Google Scholar] [CrossRef]
  52. Kochanova, E.; Sarvala, J.; Fefilova, E. Phylogenetic Study of Dioecious and Parthenogenetic Populations of Canthocamptus staphylinus (Crustacea, Copepoda, Harpacticoida). Bull. South. Calif. Acad. Sci. 2018, 117, 138–149. [Google Scholar] [CrossRef]
  53. Sars, G.O. Oversigt af de indenlandske Ferskvandcopepoder. Forh. i Vidensk.-Selsk. i Christiania Aar 1862, 1863, 212–262. [Google Scholar]
  54. Jurine, L. Histoire Des Monocles, Qui Se Trouvent Aux Environs De Genève; Paschoud, J.J., Ed.; Genève et Paris: Paris, France, 1820; 258p. [Google Scholar]
  55. Fischer, S. Beitrage zur Kenntnis der in der Umgegend von St Petersburg sich findenden Cyclopiden. Bull. Société Impériale Nat. Moscou 1851, 24, 409–438. [Google Scholar]
  56. Brady, G.S. A Monograph of the Free and Semi-Parasitic Copepoda of the British Islands; Ray Society: London, UK, 1880; Volume 3, pp. 83–93. [Google Scholar]
  57. Enckell, P.H. Kräftdjur (Fältfauna); Signum: Lund, Sweden, 1980; 420p. [Google Scholar]
  58. Defaye, D.; Dussart, N. World Directory of Crustacea Copepoda of Inland Waters, II-Harpacticoides 2011; Editions N. Boubée & Cie: Paris, Frence; 450p.
  59. Gardeström, J.; Dahl, U.; Kotsalainen, O.; Maxson, A.; Elfwing, T.; Grahn, M.; Bengtsson, B.E.; Breitholtz, M. Evidence of population genetic effects of long-term exposure to contaminated sediments—A multi-endpoint study with copepods. Aquat. Toxicol. 2008, 86, 426–436. [Google Scholar] [CrossRef]
  60. Turesson, E.U.; Stiernström, S.; Minten, J.; Adolfsson-Erici, M.; Bengtsson, B.E.; Breitholtz, M. Development and reproduction of the freshwater harpacticoid copepod Attheyella crassa for assessing sediment-associated toxicity. Aquat. Toxicol. 2007, 83, 180–189. [Google Scholar] [CrossRef]
  61. Lang, K. Monographie der Harpacticiden; Håkan Ohlsson: Lund, German, 1948; 1682p. [Google Scholar]
  62. Sarvala, J. A parthenogenetic life cycle in a population of Canthocamptus staphylinus (Copepoda, Harpacticoida). Hydrobiologia 1979, 62, 113–129. [Google Scholar] [CrossRef]
  63. Smyly, W.J.P. Observations on the life-history of the harpacticoid copepod, Canthocamptus staphylinus (Jurine). Ann. Mag. Nat. Hist. 1957, 10, 509–512. [Google Scholar] [CrossRef]
  64. Alekseev, V.R.; Defaye, D. Taxonomic differentiation and world geographical distribution of the Eucyclops serrulatus group (Copepoda, Cyclopidae, Eucyclopinae). In Studies on Freshwater Copepoda: A Volume in Honour of Bernard Dussart. Crustaceana Monographs; Defaye, D., Suárez, E., von Vaupel Klein, J.C., Alekseev, V., Eds.; Brill: Leiden, The Netherlands, 2011; Volume 16, pp. 41–72. [Google Scholar]
  65. Grigorovich, I.A.; Dovgal, I.V.; MacIsaac, H.J.; Monchenko, V.I. Acineta nitocrae: A new suctorian epizootic on nonindigenous harpacticoid copepods, Nitocra hibernica and N. incerta, in the Laurentian Great Lakes. Arch. Hydrobiol. 2001, 152, 161–176. [Google Scholar] [CrossRef] [Green Version]
  66. Lesko, L.T.; Hudson, P.L.; Reid, J.W.; Chriscinske, M.A. Harpacticoid Copepods of the Laurentian Great Lakes; Great Lakes Science Center: Ann Arbor, MI, USA, 2003. Available online: http://www.glsc.usgs.gov/greatlakescopepods/Key.asp?GROUP=Harpacticoid (accessed on 13 September 2021).
  67. Duggan, I.C.; Van Overdijk, C.D.A.; Bailey, S.A.; Jenkins, P.T.; Limén, H.; MacIsaac, H.J. Invertebrates associated with residual ballast water and sediments of cargo-carrying ships entering the Great Lakes. Can. J. Fish. Aquat. Sci. 2005, 62, 2463–2474. [Google Scholar] [CrossRef] [Green Version]
  68. Hudson, P.L.; Reid, J.W.; Lesko, L.T.; Selgeby, J.H. Cyclopoid and harpacticoid copepods of the Laurentian Great Lakes. Ohio Biol. Surv. Bull. New Ser. 1998, 12, 1–50. [Google Scholar]
  69. Aljanabi, S.M.; Martinez, I. Universal and rapid salt-extraction of high quality genomic DNA for PCR-based techniques. Nucleic Acids Res. 1997, 25, 4692–4693. [Google Scholar] [CrossRef] [PubMed]
  70. Walsh, P.S.; Metzger, D.A.; Higushi, R. Chelex 100 as a medium for simple extraction of DNA for PCR-based typing from forensic material. Biotechniques 1991, 10, 506–513. [Google Scholar] [CrossRef] [Green Version]
  71. Larkin, M.A.; Blackshields, G.; Brown, N.P.; Chenna, R.; Mcgettigan, P.A.; Mcwilliam, H.; Valentin, F.; Wallace, I.M.; Wilm, A.; Lopez, R.; et al. Clustal W and Clustal X version 2.0. bioinformatics 2007, 23, 2947–2948. [Google Scholar] [CrossRef] [PubMed] [Green Version]
  72. Librado, P.; Rozas, J. DnaSP v5: A software for comprehensive analysis of DNA polymorphism data. Bioinform. Appl. Note 2009, 25, 1451–1452. [Google Scholar] [CrossRef] [Green Version]
  73. Posada, D. jModelTest: Phylogenetic model averaging. Molecular Biology and Evolution. Mol. Biol. Evol. 2008, 25, 1253–1256. [Google Scholar] [CrossRef] [PubMed]
  74. Kumar, S.; Stecher, G.; Li, M.; Knyaz, C.; Tamura, K. MEGA X: Molecular evolutionary genetics analysis across computing platforms. Mol. Biol. Evol. 2018, 35, 1547–1549. [Google Scholar] [CrossRef]
  75. Swofford, D.L. PAUP*. Phylogenetic Analysis Using Parsimony (* and Other Methods); Version 4; Sinauer Associates: Sunderland, UK, 2003. [Google Scholar]
  76. Young, S.-S.; Lee, Y.-Y.; Liu, M.-Y. Genetic variability and divergence of Neutrodiaptomus tumidus Kiefer 1937 (Copepoda: Calonida) among 10 subpopulations in the high mountain range of Taiwan and their phylogeographical relationships indicated by mtDNA COI gene. Zool. Stud. 2014, 53, 22. [Google Scholar] [CrossRef] [Green Version]
  77. Thum, R.A.; Harrison, R.G. Deep genetic divergences among morphologically similar and parapatric Skistodiaptomus (Copepoda: Calanoida: Diaptomidae) challenge the hypothesis of Pleistocene speciation. Biol. J. Linn. Soc. 2009, 96, 150–165. [Google Scholar] [CrossRef] [Green Version]
  78. Leigh, J.W.; Bryant, D. POPART: Full-feature software for haplotype network construction. Methods Ecol. Evol. 2015, 6, 1110–1116. [Google Scholar] [CrossRef]
  79. Excoffier, L.; Lischer, H.E.L. Arlequin suite ver 3.5: A new series of programs to perform population genetics analyses under Linux and Windows. Mol. Ecol. Resour. 2010, 10, 564–567. [Google Scholar] [CrossRef] [PubMed]
  80. Tajima, F. Statistical method for testing the neutral mutation hypothesis by DNA polymorphism. Genetics 1989, 123, 585–595. [Google Scholar] [CrossRef]
  81. Fu, Y.X. Statistical tests of neutrality of mutations against population growth, hitchhiking and background selection. Genetics 1997, 147, 915–925. [Google Scholar] [CrossRef]
  82. Pons, J.; Barraclough, T.G.; Gomez-Zurita, J.; Cardoso, A.; Duran, D.P.; Hazell, S.; Kamoun, S.; Sumlin, W.D.; Vogler, A.P. Sequence-Based Species Delimitation for the DNA Taxonomy of Undescribed Insects. Syst. Biol. 2006, 55, 595–609. [Google Scholar] [CrossRef] [Green Version]
  83. Bouckaert, R.; Heled, J.; Kü Hnert, D.; Vaughan, T.; Wu, C.-H. BEAST 2: A Software Platform for Bayesian Evolutionary Analysis. PLoS Comput. Biol. 2014, 10, e1003537. [Google Scholar] [CrossRef] [PubMed] [Green Version]
  84. Jones, G. Mathematical Biology Algorithmic improvements to species delimitation and phylogeny estimation under the multispecies coalescent. J. Math. Biol. 2017, 74, 447–467. [Google Scholar] [CrossRef]
  85. Rambaut, A.; Drummond, A.J.; Xie, D.; Baele, G.; Suchard, M.A. Copyedited by: YS MANUSCRIPT CATEGORY: Software for Systematics and Evolution Software for Systematics and Evolution Posterior Summarization in Bayesian Phylogenetics Using Tracer 1.7. Syst. Biol. 2018, 67, 2. [Google Scholar] [CrossRef] [Green Version]
  86. Burton, R.S.; Byrne, R.J.; Rawson, P.D. Three divergent mitochondrial genomes from California populations of the copepod Tigriopus californicus. Gene 2007, 403, 53–59. [Google Scholar] [CrossRef]
  87. Garlitska, L.; Neretina, T.; Schepetov, D.; Mugue, N.; De Troch, M.; Baguley, J.G.; Azovsky, A. Cryptic diversity of the “cosmopolitan” harpacticoid copepod Nannopus palustris: Genetic and morphological evidence. Mol. Ecol. 2012, 21, 5336–5347. [Google Scholar] [CrossRef]
  88. Willett, C.S.; Ladner, J.T. Investigations of fine-scale phylogeography in Tigriopus californicus reveal historical patterns of population divergence. BMC Evol. Biol. 2009, 9, 139. [Google Scholar] [CrossRef] [PubMed] [Green Version]
  89. Sakaguchi, S.O.; Ueda, H. Genetic analysis on Pseudodiaptomus inopinus (Copepoda, Calanoida) species complex in Japan: Revival of the species name of P. japonicus Kikuchi, 1928. Plankton Benthos Res. 2018, 13, 173–179. [Google Scholar] [CrossRef] [Green Version]
  90. Barreto, F.S.; Watson, E.T.; Lima, T.G.; Willett, C.S.; Edmands, S.; Li, W.; Burton, R.S. Genomic signatures of mitonuclear coevolution across populations of Tigriopus californicus. Nat. Ecol. Evol. 2018, 2, 1250–1257. [Google Scholar] [CrossRef] [PubMed] [Green Version]
  91. Figueroa, N.J.; Figueroa, D.F.; Hicks, D. Phylogeography of Acartia tonsa Dana, 1849 (Calanoida: Copepoda) and phylogenetic reconstruction of the genus Acartia Dana, 1846. Mar. Biodivers. 2020, 50, 23. [Google Scholar] [CrossRef] [Green Version]
  92. Brancelj, A.; Karanovic, T. A new subterranean Maraenobiotus (Crustacea: Copepoda) from Slovenia challenges the concept of polymorphic and widely distributed harpacticoids. J. Nat. Hist. 2015, 49, 2905–2928. [Google Scholar] [CrossRef]
  93. Cox, A.J.; Hebert, P.D.N. Colonization, extinction, and phylogeographic patterning in a freshwater crustaceanfile: Evolutionary genomics in the Metazoa-the mitochondrial DNA as a model system. Mol. Ecol. 2001, 10, 371–386. [Google Scholar] [CrossRef] [PubMed]
  94. Huemer, P.; Hebert, P.D.N.; Mutanen, M.; Wieser, C.; Wiesmair, B.; Hausmann, A.; Yakovlev, R.; Möst, M.; Gottsberger, B.; Strutzenberger, P.; et al. Large geographic distance versus small DNA barcode divergence: Insights from a comparison of European to South Siberian Lepidoptera. PLoS ONE 2018, 13, e0206668. [Google Scholar] [CrossRef] [PubMed]
  95. Pentinsaari, M.; Hebert, P.D.N.; Mutanen, M. Barcoding beetles: A regional survey of 1872 species reveals high identification success and unusually deep interspecific divergences. PLoS ONE 2014, 9, e108651. [Google Scholar] [CrossRef] [Green Version]
  96. Rawson, P.D.; Burton, R.S. Molecular evolution at the cytochrome oxidase subunit 2 gene among divergent populations of the intertidal copepod, Tigriopus californicus. J. Mol. Evol. 2006, 62, 753–764. [Google Scholar] [CrossRef] [PubMed]
  97. Ketmaier, V.; Marrone, F.; Alfonso, G.; Paulus, K.; Wiemann, A.; Tiedemann, R.; Mura, G. Mitochondrial DNA regionalism and historical demography in the extant populations of Chirocephalus kerkyrensis (Branchiopoda: Anostraca). PLoS ONE 2012, 7, e30082. [Google Scholar] [CrossRef] [Green Version]
  98. Knowlton, N.; Weigt, L.A. New dates and new rates for divergence across the Isthmus of Panama. Proc. R. Soc. B Biol. Sci. 1998, 265, 2257–2263. [Google Scholar] [CrossRef] [Green Version]
  99. Marino, I.A.M.; Pujolar, J.M.; Zane, L. Reconciling deep calibration and demographic history: Bayesian inference of post glacial colonization patterns in Carcinus aestuarii (Nardo, 1847) and C. maenas (Linnaeus, 1758). PLoS ONE 2011, 6, e28567. [Google Scholar] [CrossRef] [Green Version]
  100. Zofkova, M.; Timms, B.V. A conflict of morphological and genetic patterns in the australian anostracan Branchinella longirostris. Hydrobiologia 2009, 635, 67–80. [Google Scholar] [CrossRef]
  101. Sworobowicz, L.; Mamos, T.; Grabowski, M.; Wysocka, A. Lasting through the ice age: The role of the proglacial refugia in the maintenance of genetic diversity, population growth, and high dispersal rate in a widespread freshwater crustacean. Freshw. Biol. 2020, 65, 1028–1046. [Google Scholar] [CrossRef]
  102. Burton, R.S.; Pereira, R.J.; Barreto, F.S. Cytonuclear genomic interactions and hybrid breakdown. Annu. Rev. Ecol. Evol. Syst. 2013, 44, 281–302. [Google Scholar] [CrossRef]
  103. Barreto, F.S.; Moy, G.W.; Burton, R.S. Interpopulation patterns of divergence and selection across the transcriptome of the copepod Tigriopus californicus. Mol. Ecol. 2011, 20, 560–572. [Google Scholar] [CrossRef] [PubMed]
  104. Goetze, E. Cryptic speciation on the high seas; global phylogenetics of the copepod family Eucalanidae. Proc. R. Soc. B Biol. Sci. 2003, 270, 2321–2331. [Google Scholar] [CrossRef]
  105. Lee, C.E. Rapid and repeated invasions of fresh water by the copepod Eurytemora affinis. Evolution 1999, 53, 1423–1434. [Google Scholar] [CrossRef] [PubMed]
  106. Lee, C.E.; Frost, B.W. Morphological stasis in the Eurytemora affinis species complex (Copepoda: Temoridae). Hydrobiologia 2002, 480, 102–115. [Google Scholar] [CrossRef]
  107. Soltis, D.E.; Morris, A.B.; McLachlan, J.S.; Manos, P.S.; Soltis, P.S. Comparative phylogeography of unglaciated eastern North America. Mol. Ecol. 2006, 15, 4261–4293. [Google Scholar] [CrossRef]
  108. Bowen, B.W.; Gaither, M.R.; DiBattista, J.D.; Iacchei, M.; Andrews, K.R.; Grant, W.S.; Toonen, R.J.; Briggs, J.C. Comparative phylogeography of the ocean planet. Proc. Natl. Acad. Sci. USA 2016, 113, 7962–7969. [Google Scholar] [CrossRef] [Green Version]
  109. Bickford, D.; Lohman, D.J.; Sodhi, N.S.; Ng, P.K.L.; Meier, R.; Winker, K.; Ingram, K.K.; Das, I. Cryptic species as a window on diversity and conservation. Trends Ecol. Evol. 2007, 22, 148–155. [Google Scholar] [CrossRef]
  110. Dawson, M.N. Parallel phylogeographic structure in ecologically similar sympatric sister taxa. Mol. Ecol. 2012, 21, 987–1004. [Google Scholar] [CrossRef]
  111. Kreger, K.M.; Shaban, B.; Wapstra, E.; Burridge, C.P. Phylogeographic parallelism: Concordant patterns in closely related species illuminate underlying mechanisms in the historically glaciated Tasmanian landscape. J. Biogeogr. 2020, 47, 1674–1686. [Google Scholar] [CrossRef]
  112. Siivonen, L. The history of the Fennoscandian mammal fauna. Acta Zool. Fenn. 1982, 169, 7–10. [Google Scholar]
  113. Buchovska, J.; Danusevičius, D.; Baniulis, D.; Stanys, V.; Šikšnianiene, J.B.; Kavaliauskas, D. The location of the Northern glacial refugium of scots pine based on mitochondrial DNA markers. Balt. For. 2013, 19, 2–12. [Google Scholar]
  114. Dering, M.; Kosiński, P.; Wyka, T.P.; Pers-Kamczyc, E.; Boratyński, A.; Boratyńska, K.; Reich, P.B.; Romo, A.; Zadworny, M.; Żytkowiak, R.; et al. Tertiary remnants and Holocene colonizers: Genetic structure and phylogeography of Scots pine reveal higher genetic diversity in young boreal than in relict Mediterranean populations and a dual colonization of Fennoscandia. Divers. Distrib. 2017, 23, 540–555. [Google Scholar] [CrossRef] [Green Version]
  115. Jensen, T.C.; Walseng, B.; Hessen, D.O.; Dimante-Deimantovica, I.; Novichkova, A.A.; Chertoprud, E.S.; Chertoprud, M.V.; Sakharova, E.G.; Krylov, A.V.; Frisch, D.; et al. Changes in trophic state and aquatic communities in high Arctic ponds in response to increasing goose populations. Freshw. Biol. 2019, 64, 1241–1254. [Google Scholar] [CrossRef]
  116. Najdenski, H.; Dimova, T.; Zaharieva, M.M.; Nikolov, B.; Petrova-Dinkova, G.; Dalakchieva, S.; Popov, K.; Tokarevich, N.K. Migratory birds along the Mediterranean—Black Sea Flyway as carriers of zoonotic pathogens. Can. J. Microbiol. 2018, 64, 915–924. [Google Scholar] [CrossRef] [Green Version]
  117. Lee, C.E. Evolutionary mechanisms of habitat invasions, using the copepod Eurytemora affinis as a model system. Evol. Appl. 2016, 9, 248–270. [Google Scholar] [CrossRef]
  118. Hartl, D.L.; Clark, A.G. Principles of Population Genetics, 4th ed.; Sinauer Associates: Franklin County, MA, USA, 2007. [Google Scholar]
  119. Pichler, F.B. Genetic Assessment of Population Boundries and Gene Exchange in Hector’s Dolphin; Department of Conservation: Wellington, New Zealand, 2002; Volume 44, pp. 1–37. [Google Scholar]
  120. Gollner, S.; Stuckas, H.; Kihara, T.C.; Laurent, S.; Kodami, S.; Arbizu, P.M. Mitochondrial DNA analyses indicate high diversity, expansive population growth and high genetic connectivity of vent copepods (Dirivultidae) across different oceans. PLoS ONE 2016, 11, e0163776. [Google Scholar] [CrossRef]
  121. Gerlach, S.A. On the importance of marine meiofauna for benthos communities. Oecologia 1971, 6, 176–190. [Google Scholar] [CrossRef]
Figure 1. Maximum likelihood phylogenetic trees based on sequences of the mitochondrial cytochrome oxidase subunit I (COI) mtDNA gene (a) and the nuclear ITS1-5.8SrRNA-ITS2 region (b) of Attheyella crassa. Numbers at the nodes are bootstrap values. As an outgroup, sequences of Elaphoidella bidens (accession numbers MW851202-MW851206) for COI gene tree and Tigriopus californicus (KF851276) for ITS gene tree were used. The bars between the trees indicate the “species” identified by different species delimitation methods for each gene (ABGD, GMYC, PTP) and for both genes together (STACEY). Median joining networks of (c) COI and (d) ITS haplotypes from A. crassa. Black dots indicate median vectors (ancestral, unsampled, or extinct haplotypes). Black hatch marks denote the number of mutational steps between haplotypes. Circles are proportional to the haplotype frequency.
Diversity 13 00448 g001
Figure 2. Maximum likelihood phylogenetic trees based on sequences of mitochondrial cytochrome oxidase subunit I (COI) mtDNA (a) and 18S ribosomal RNA gene (b) of Canthocamptus staphylinus. Numbers beside nodes are bootstrap values. As an outgroup, sequences of Attheyella crassa (accession numbers MH477663-MH477668) for COI gene tree and A. crassa (EU380307) for 18S were used. A dashed line indicates that the sequence downloaded from GenBank contains ambiguities which are unlikely to affect its position in the tree. The bars between the trees indicate the “species” identified by different species delimitation methods for each gene (ABGD, GMYC, PTP) and for both genes together (STACEY). Median joining networks of (c) COI and (d) 18S haplotypes from C. staphylinus. Black dots indicate median vectors (ancestral, unsampled, or extinct haplotypes). Black hatch marks denote the number of mutational steps between haplotypes. Circles are proportional to the haplotype frequency.
Diversity 13 00448 g002
Figure 3. Maximum likelihood phylogenetic trees based on sequences of (a) the mitochondrial cytochrome oxidase subunit I (COI) gene and (b) the nuclear ITS1-5.8SrRNA-ITS2 gene region of Eucyclops serrulatus and relatives. Numbers at the nodes are bootstrap values. Outgroup sequences were obtained from GenBank, including Cyclops insignis (accession numbers KC627291-KC627294) and C. abysorum (KC627287-KC627290) for COI gene tree and Mesocyclops ogunnus (GQ848502) and M. pehqeiensis (GQ848500) for ITS gene tree. The bars between the trees indicate the “species” identified by different species delimitation methods for each gene (ABGD, GMYC, PTP) and for both genes together (STACEY). Median joining networks of (c) COI and (d) ITS haplotypes from E. serrulatus. Black dots indicate median vectors (ancestral, unsampled, or extinct haplotypes). Black hatch marks denote the number of mutational steps between haplotypes. Circles are proportional to the haplotype frequency.
Diversity 13 00448 g003
Figure 4. Maximim likelihood tree based on sequences of mitochondrial cytochrome oxidase subunit I (COI) mtDNA gene of Nitokra hibernica and related species (a). Numbers at the nodes are bootstrap values. As an outgroup, sequences of Flexilia brevipes (accession numbers MH976594-MH976596) and Pseudoameira crassicornis (MK037002, MK037019, MK036966) were used. (b) Median-joining network of COI haplotypes from Nitokra hibernica. Black dot indicates a median vector (ancestral, unsampled, or extinct haplotype). Black hatch marks denote the number of mutational steps between haplotypes. Circles are proportional to the haplotype frequency.
Diversity 13 00448 g004
Figure 5. Maps of the sampling locations and phylogenetic clades division of A. crassa (a), C. staphylinus (b), E. serrulatus (c), and Nitokra hibernica (d). Colors correspond with the colors of clades in the phylogenetic trees (Figure 1, Figure 2, Figure 3 and Figure 4a,b).
Diversity 13 00448 g005
Table 1. Number (N) and lengths of analyzed sequences (alignments), nucleotide diversity ( π ), haplotype diversity (Hd), number of different haplotypes (h), number of polymorphic sites (S) and mutations (Eta) for the studied species.
SpeciesN of SequencesAligned Sequence Length (bp)πHdN of HaplotypesSEta
mtDNArRNAmtDNArRNAmtDNArRNAmtDNArRNAmtDNArRNAmtDNArRNAmtDNArRNA
Attheyella crassa37175454610.0930.0330.8680.83112677328132
Canthocamptus staphylinus591060615760.1030.0010.940.6430417932053
Eucyclops serrulatus38126546280.1930.0110.8620.7581251311115711
Nitokra hibernica10-554-0.013-0.911-7-26-26-
Table 2. Average model-corrected genetic distances (%) between two main clades (E and W) of Attheyella crassa and between them and other Attheyella species: below diagonal—COI, above diagonal—ITS, in the diagonal values within clades—COI/ITS.
Species/CladeWestern CladeEastern CladeA. nordenskioldiiA. dentata
W clade1.3/0.266.48--
E clade26.15.5/0.62--
A. nordenskioldii34.532.4--
A. dentata35.842.536.10.8/-
Table 3. Sample size (N), nucleotide diversity ( π ), haplotype diversity (Hd), number of haplotypes (h), Tajima’s D statistic and Fu’s Fs statistic among all populations of the studied species based on COI gene sequences.
SpeciesCladePopulationN π (%) Hd/hTajima’s DFu’s Fs
A. crassaE clade Pääjärvi31.11.0/3--
Hiiu1--/1--
Vänern20.181.0/2--
Nyuvchim 30.00.0/1--
Pechora1--/1--
Karkalai20.91.0/2--
Narach40.090.5/2−0.610.172
Vychegda 1--/1--
Rybinsk300/1--
Glubokoe1--/1--
Total clade210.780.91/15--
W cladeGeneva30. 10.66/2--
Sognsvann60.070.33/2−0.93−0.003
Rybinsk700/1--
Total clade163.20.61/5--
C. staphylinusF cladePääjärvi1100/1--
Vänern 90.70.97/8−0.74−2.91 *
Total clade210.0150.73/9--
C cladeGeneva80.50.64/4−1.79 *1.34
Zurich1--/1--
Võrtsjärv 50.00.0/1--
Narach51.00.9/51.611.28
Orlov100.90.64/50.243.56 *
Plau am see20.00.0/1--
Stechlin20.00.0/1--
Fernsteinsee1--/1--
Zell am see20.00.0/1--
Hallstatt1--/1--
Total clade372.20.94/21
E. serrulatusE cladeSevDvina1--/1--
Lena1--/1--
Karkalai 60.90.33/2−1.332.59
Dniester 50.00.0/1--
Orlov 21.71/2--
Tauride 1--/1--
Total clade151.00.79/8--
W cladeOslo30.70.66/2--
Florence20.00.0/1--
Creteil20.00.0/1--
Transkarpathia50.00.0/1--
Orlov 60.70.8/40.280.82
Tauride 31.10.66/2--
Total clade201.00.85/11--
N. hibernica Narach30.00.0/3--
Võrtsjärv 20.182/1--
Pyhäjärvi 20.00.0/1--
Hallstatt1----
Müritz20.182/1--
Total clade101.30.91/6--
* p-values < 0.05
Table 4. Average model-corrected genetic distances (in %) between the two main clades (Fennoscandian and Continental) of Canthocamptus staphylinus and between them and other Canthocamptus species: below diagonal—COI, above diagonal—18S, in the diagonal—values within clades COI/18S.
Species/CladeF Clade (Fennoscandian)C Clade (Continental) C. microstaphylinusC. (B.) longifurcatusC. kitaurensis
F clade 2.8/0.0030.007---
C clade 33.23.6/0.007---
C. microstaphylinus38.243.31.1--
C. (B.) longifurcatus34.232.141.0--
C. kitaurensis46.415.344.639.9-
Table 5. Average model-corrected genetic distances (%) between two main clades (E and W) of Eucyclops serrulatus and between them and other Eucyclops species: below diagonal—COI, above diagonal—ITS, in the diagonal—values within clades COI/ITS.
Species/cladeE cladeW cladeE. cuatrocienegasE. prionophorusE. taiwanensis
E clade2.1/0.342.41---
W clade36.61.3/0.22---
E. cuatrocienegas43.243.5---
E. prionophorus48.443.638.50.52/--
E. taiwanensis39.142.241.341.60.44/-
Table 6. Average model-corrected COI distances (%) between Nitokra and Nitocrella species, and within N. hibernica itself.
SpeciesN. hibernicaN. lacustris
Nitokra hibernica3.6-
Nitokra lacustris47.3-
Nitocrella achaiae53.449.7
Table 7. Model-corrected COI genetic distances and observed p-distances between cryptic lineages of different freshwater copepod taxa. The rate variation parameter α was estimated for each dataset separately. The “split age” is a transformation of the model distance under a range of COI divergence rates between 1.4%–4% Ma−1, applied in some other crustacean studies [97,98,99,100,101].
SpeciesOrderModelГ Distribution Parameter (α)Inter-Clade Distances, %
Model Distances GTR+Гp-Distances“Split Age”
Ma
Data Reference
Attheyella crassaHarpacticoidaGTR+Г0.5826.116.47—19[51]; this study
Canthocamptus staphylinusHarpacticoidaGTR+Г0.5033.217.48—23[52]; this study
Eucyclops serrulatusCyclopoidaGTR+Г0.5936.620.69—26[48]; this study
Eudiaptomus hadziciCalanoidaGTR+Г0.6917.6–42.112.3–24.0 [21]
Neutrodiaptomus tumidusCalanoidaGTR+Г0.1915.2–28.36.7–9.4 [76]
Hemidiaptomus ingensCalanoidaGTR+Г0.2128.2–56.311.4–17.7 [26]
Skistodiaptomus pallidusCalanoidaGTR+Г0.1733.9–48.116.0–17.2 [77]
Publisher’s Note: MDPI stays neutral with regard to jurisdictional claims in published maps and institutional affiliations.

