Article

Seasonal Dynamics and Diversity of Haemosporidians in a Natural Woodland Bird Community in Slovakia

by
Alžbeta Šujanová
1,
Eva Špitalská
2 and
Radovan Václav
1,*
1
Institute of Zoology, Slovak Academy of Sciences, Dúbravská Cesta 9, 84506 Bratislava, Slovakia
2
Institute of Virology, Biomedical Research Center, Slovak Academy of Sciences, Dúbravská Cesta 9, 84505 Bratislava, Slovakia
*
Author to whom correspondence should be addressed.
Diversity 2021, 13(9), 439; https://doi.org/10.3390/d13090439
Submission received: 9 August 2021 / Revised: 9 September 2021 / Accepted: 10 September 2021 / Published: 10 September 2021
(This article belongs to the Special Issue Bird Parasites)

Abstract

:
Despite the ubiquity of disease seasonality, mechanisms behind the fluctuations in seasonal diseases are still poorly understood. Avian hemosporidiosis is increasingly used as a model for ecological and evolutionary studies on disease dynamics, but the results are complex, depending on the focus (hosts, parasites, vectors) and scale (individuals, community, populations) of the study. Here, we examine the local diversity of haemosporidian parasites and the seasonal patterns of infections, parasite richness, and diversity in a natural woodland bird community in Slovakia. In 35 avian species, we detected 111, including 19 novel, haemosporidian cytochrome b lineages. The highest numbers of lineages were detected during spring and autumn, corresponding with higher avian species richness and infection prevalence in the avian community during these periods of time. Nevertheless, the haemosporidian community in the local breeders in summer was relatively stable, Haemoproteus lineages dominated in the local avian haemosporidian community, and only few parasite lineages were abundant within each genus. While prevailing Leucocytozoon infections in spring suggest that the majority of sampled birds wintered in the Mediterranean region, Plasmodium infections in spring can be due to relapses in reproductively active short-distance migrants. Multiple haemosporidian infections, both intra- and inter-generic ones, were common in the local avian community. Infection intensity peaked during summer and tended to be higher in older birds, pointing to the role of supressed immunity in reproductively active birds.

Graphical Abstract

1. Introduction

Despite the ubiquity of seasonal disease incidences, mechanisms behind the fluctuations in seasonal diseases are poorly understood [1,2,3]. Disease seasonality is thought to be driven by seasonal changes in: (1) abiotic conditions affecting pathogen survival outside hosts, (2) host behaviour affecting host abundance and contact rate, (3) host immune function affecting host susceptibility to pathogens, and (4) the abundance of vectors and heterospecific hosts affecting pathogen availability [3]. However, the identification of the underlining mechanisms behind the seasonality is difficult due to the complexity of interactions between the individual drivers [2]. For example, disease seasonality can exhibit different patterns depending on whether the focus is on a single host species or a wider host community [4]. Additionally, disease detection may strongly depend on infection intensity [5], which can importantly confound the patterns of disease prevalence and seasonality.
Avian hemosporidiosis is increasingly used as a model for ecological and evolutionary studies on disease dynamics [6]. Seasonality in avian parasitaemia was first described by Danilewsky [7], suggesting that parasitaemia in wild birds in Ukraine was higher in warm seasons [6]. Beaudoin et al. [8] developed a functional model of avian malaria prevalence for songbirds of the temperate climate zone in North America, identifying prevalence peaks in spring and late summer/early autumn. The spring peak is usually explained by infection relapses, which could be induced by changing hormone levels, internal clock of parasites, or through stimulation by vectors [9,10,11,12]. Strenuous physical activity during spring migration can also contribute to the higher spring infection prevalence [12,13]. Yet, long-distance migratory birds might show higher parasite prevalence and diversity than short-distance migrants or resident birds, as the former encounter parasites across more diverse ecological settings [14,15,16,17,18]. High bird densities at stopover sites may also increase the risk of avian hemosporidiosis in migratory birds [19].
Infection seasonality may be related to fluctuations in absolute and relative numbers of birds of different age cohorts. Most birds contract infection as fledglings or during the first weeks after fledging, likely due to weaker immune function [20,21]. In contrast, older birds often show higher prevalence than juveniles due to the accumulation of haemosporidian infections throughout their lifetime [22,23]. For example, Emmenegger et al. [24] studied the effect of age in European bee-eaters Merops apiaster, reporting that haemosporidian prevalence for birds in their second calendar year was lower by 10% compared to that in older birds. Nonetheless, infection seasonality in birds can occur even within age cohorts. While high infection intensity can decline soon with the development of the immune system in fledglings [20], breeding activity can temporarily increase infection intensity through the supressed immune system in adult birds, e.g., [21]. Consequently, in addition to a relatively high abundance of immunologically naïve juveniles, the infection peak at the end of summer can also be due to higher numbers of immunologically supressed adult breeders towards the end of the breeding season.
The local structure of haemosporidians and avian hosts can also affect seasonal dynamics in infection prevalence and intensity in the local avian community. Haemosporidian lineages that show higher host specificity perform better in related host species with a similar immune system [25,26]. The relative abundance of host species also is important because abundant host species are thought to reach higher parasite prevalence and diversity than less common host species [4,27]. In turn, generalist parasites may infect a wider range of host species than specialists, but they can reach lower intensities in their hosts compared to parasites specialised on fewer host species [26,28]. Therefore, seasonal fluctuations in infection prevalence and intensity can be related to intra- and inter-seasonal fluctuations in local host and parasite communities, both in terms of diversity and species composition.
Numerous studies reported that the same parasite lineages can perform differently between host species [4,16,19,26,29,30,31,32]. For example, Lynton-Jenkins et al. [31] reported a decreased prevalence of one group of Leucocytozoon lineages in great tits between autumn and spring, while the prevalence of the same lineages increased in blue tits. Furthermore, a study by Hunag et al. [21] detected seasonally distinct infection patterns of Haemoproteus lineage WW2 in garden warbler Sylvia borin and Phylloscopus spp. Interestingly, these authors also recorded differences in the intensity of infection of lineage PARUS1 between juvenile and adult birds. Furthermore, differences in haemosporidian lineage prevalence were also shown between populations within host species [33]. In fact, local adaptations were suggested to play role in certain host-parasitic associations. In Sardinia, endemic haemosporidian lineages were dominant in sedentary birds compared to short-distance and long-distance migrants [34]. The community-wide outcome of these associations for disease seasonality, therefore, can be strongly dependent on the local structure and strength of host-parasite associations [26].
Here, we examine the local diversity of haemosporidian parasites in a natural wetland bird community in Slovakia. Our aim is to describe the seasonal patterns of infection prevalence, infection intensity, and parasite richness and diversity. Moreover, associations between avian species and haemosporidian cytochrome b lineages are examined to establish their local structure, abundance, and seasonal fluctuations, as well as the levels of structural and phylogenetic host specificity of the lineages detected.

2. Materials and Methods

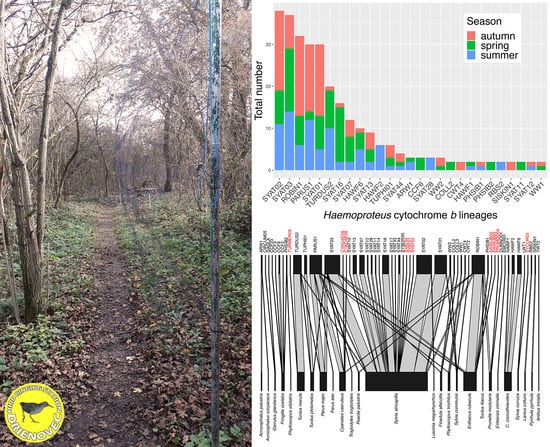
2.1. Study Area, Field Methods and Study Species

Wild birds were sampled in south-east Slovakia near the Drienovec village at the Drienovec Bird Ringing Station (48°1′11.303″ N; 17°4′2.255″ E; see [35]). The study site (ca. 7.7 ha) is represented by a mosaic of woody wetland and forest meadow ecotones at 190 m a.s.l. Birds were captured, banded, and sampled under the permits of the Ministry of the Environment of the Slovak Republic No. 269/132/05-5.1_p and 9830/2017-6.3. Birds were captured using mist nets for three years (2017, 2018, 2019) between April and November. The blood sample was taken from a brachial vein and ring code, species and, if possible, age and sex were recorded for each bird sampled, and the birds were subsequently released. Blood samples were stored in 70% ethanol at 4 °C until DNA extraction (within 7 months). Totally, 1851 birds of 61 species were blood-sampled (spring: April, n = 444; summer: June–July, n = 474; autumn: September–November, n = 933; Figure 1). Birds were sampled each year in the second half of April, between mid-June and mid-July, and between mid-September and the beginning of November. These three sampling periods were chosen for our study area and climatic zone to obtain representative samples for haemosporidian community composition in birds during spring migration, breeding, and autumn migration periods, respectively.

2.2. DNA Extraction

DNA extractions for samples collected in 2017 and 2019 were performed using the QIAamp DNA Blood Kit (Qiagen, Hilden, Germany) following the manufacturer’s recommendation. DNA from samples taken in 2018 was extracted using a standard phenol-chloroform extraction with ethanol precipitation [36]. Extracted DNA was resolved to a final concentration of ca. 100 ng/µL and stored at −20 °C until subsequent analyses. The quantity and quality of DNA samples was assessed by NanoPhotometer Pearl (Implen, Munich, Germany).

2.3. PCR Analyses

The DNA samples were examined for haemosporidian infection intensity using quantitative real-time PCR (qPCR) targeting 182 bp fragment of cytochrome b (cyt b) gene [37]. All reactions were carried out using GoTaq qPCR Master Mix (Promega, Madison, WI, USA) on a CFX96 real-time thermocycler (Bio-Rad, Hercules, CA, USA). The total volume of the reactions was 20 μL, containing 10 μL of GoTaq qPCR Master Mix 2×, 0.5 μL of each primer (10 μM concentration), 6 μL of molecular grade water, and 3 μL of DNA template (ca. 300 ng). The following cycling conditions were used: 95 °C for 2 min, followed by 40 cycles of 95 °C for 30 s, and 64 °C for 35 s (with a plate read) followed by a final melt curve analysis using instrument default settings. The samples were run in duplicate for all of the samples, together with two non-template controls to check for non-specific amplifications. At the end of the reactions, the amplification curves and melting curves were inspected to obtain values of threshold cycles (Ct) for each sample and determine false positives [21]. For quantification of parasites, seven samples with known quantities [37] were included in each reaction to establish amplification efficiencies and standard curves.
A synthetic double-stranded DNA product (Eurofins Genomics, Ebersberg, Germany), designed from a 220 bp fragment of the conserved rDNA region of Plasmodium relictum (Accession #NC012426; [37]), was used as a positive control. The DNA was diluted to a starting concentration of 106 copies/µL using online calculator on www.thermofisher.com (accessed on 1 May 2021). This starting solution was then serially diluted by 10-fold to prepare a series of solutions from 106 copies of genomic DNA per µL down to 1 copy/µL (that is, there were seven dilutions: 106, 105, 104, 103, 102, 101, and 100). To determine the microarray limit of detection, 3 µL of these diluted DNA samples were used as templates for the amplifications of the cyt b gene.
We applied two conservative criteria for accepting qPCR data as valid, following Friedl & Groscurth [38]. Firstly, we only accepted PCR runs with the correlation coefficient for the standard curve higher than 0.99. Secondly, if a run was accepted, we only accepted samples if SD values of parasite intensities (i.e., relative numbers of DNA copies; see Section 2.4) for the two replicates were lower than 50. This second criterion roughly corresponds to the criterion by Friedl & Groscurth [38] that SD of Ct values for replicates should be lower than 1. Finally, qPCR data for five of the accepted samples were conservatively excluded from analyses on parasite intensity because qPCR data suggested very high parasite intensities (>366 DNA copies per 100 avian red blood cells) for these samples.
In addition to qPCR analysis, all of the samples were analysed by nested PCR assays targeting a mtDNA cyt b gene fragment [39,40]. In the first step, HaemNF1 and HaemNR3 primers were used to amplify the 617 bp fragment. PCR reactions were performed in 20 cycles, which included initial denaturation at 94 °C for 2 min, followed by 20 cycles of denaturation at 94 °C for 30 s, annealing at 50 °C for 30 s and elongation at 72 °C for 45 s and consequently final elongation at 72 °C for 10 min. Subsequently, the amplicon was added as a template to the second step of nested PCR with primers HaemF and HaemR2, targeting a 480 bp amplicon of Haemoproteus sp. and Plasmodium sp., and the set of HaemFL and HaemR2L primers amplifying a 478 bp fragment of Leucocytozoon sp. The PCR protocol was adjusted so that the number of cycles was raised to 35 and the annealing temperature was lowered to 48 °C for Leucocytozoon. Each reaction with the total volume of 10 µL contained 1 µL of template DNA (ca. 20 ng), 5 µL of SuperHot Master Mix (2X) (Bioron, Ludwigshafen, Germany), 0.25 µL of each primer (with concentrations 10 pmol/µL) and 3.25 µL of miliQ water. PCR products from the second round were separated and visualized on 2% agarose gel with SYBR® Safe DNA gel stain (Invitrogen, Carlsbad, CA, USA). Positive PCR products were purified using a Qiagen purification kit (Qiagen, Hilden, Germany). The purified PCR fragments were sent for sequencing in both directions (Macrogen Europe, Amsterdam, The Netherlands).

2.4. Sequence and Statistical Analysis

The sequences were edited and aligned using Unipro UGENE software v1.32 [41]. The resulting contigs of 478 and 476 bp for Haemoproteus/Plasmodium and Leucocytozoon parasites, respectively, were examined with the BLAST algorithm in GenBank (http://www.blast.ncbi.nlm.nih.gov/Blast.cgi (accessed on 1 July 2021)) and MalAvi [42] (http://130.235.244.92/Malavi/blast.html (accessed on 1 July 2021)) databases. The sequences without double peaks (n = 252/310, 225/255 and 95/131 sequences for Haemoproteus, Plasmodium and Leucocytozoon parasites, respectively) were considered as single-lineage infections and their identity was assessed by a BLAST search. The majority of these sequences matched (100%) with sequences published in GenBank and Malavi. The remaining single-infection sequences were submitted as new lineages to both databases (n = 10, 1 and 8 sequences for Haemoproteus, Plasmodium and Leucocytozoon parasites, respectively). GenBank accession codes (MalAvi lineage names) for the sequences determined in this study are: Haemoproteus spp.—MZ571097 (ERIRUB02), MZ571099 (PRUMOD04), MZ571100 (TURMER08), MZ571101 (ERIRUB03), MZ571102 (CYACAE09), MZ571103 (CYACAE08), MZ571106 (SYAT50), MZ571107 (SYAT51), MZ571108 (SYAT52), MZ571109 (SYCUR03); Plasmodium spp.—MZ571110 (TURMER09); Leucocytozoon spp.—MZ571111 (TURMER10), MZ571112 (TURMER11), MZ571113 (TUPHI14), MZ571115 (PARUS93), MZ571117 (TURMER12), MZ571118 (TURMER13), MZ571119 (TURMER14), MZ571120 (PARUS94).
The unresolved sequences with double peaks or positions containing two or more different bases were subjected to a BLAST search to identify the most closely matching lineage. If such sequences matched completely known lineages for some of the suggested bases at undefined positions, we considered such sequences as multiple infections involving one or more of the known lineages.
The Exp (H′) index, reflecting the effective number of species [43], is based on the Shannon diversity index H′ [44]. The Exp (H′) was calculated for avian hosts and parasite lineages for spring, summer and autumn.
Host specificity was examined considering two contexts: (1) structural host specificity, reflecting the relative ecological importance of each host species in the host community and (2) phylogenetic host specificity, reflecting the importance of relatedness among host species in the host community [45]. Structural host specificity was described using two indices: H2 and d′ [46]. These metrics were developed for the analysis of bipartite networks to quantify the level of ecological specialization [47,48]. The H2 index is a community-level index of specificity, reflecting a measure of structural specificity of the entire network; it ranges from 0 (the most generalist community) to 1 (the most specialist community; [46]). The d′ index is a measure of structural specificity at a species level, and ranges from 0 (the most generalist species) to 1 (most specialist species). Phylogenetic host specificity was described using the SESMPD index [45], assuming that the more closely related host species have a greater tendency to share the same parasite. The index represents the standardized effect size of the mean phylogenetic distance between each pair of parasitised host species. Positive index values indicate greater phylogenetic distance among parasitised host species (low phylogenetic host specificity), while negative values indicate high phylogenetic host specificity [45].
Seasonal fluctuations in the prevalence and intensity of haemosporidian infection were examined at the level of the entire host community with Bayesian multivariate multilevel models. The data for infection prevalence represented prevalence for each species per season (spring, summer, and autumn) and year (2017–2019). Since we could not determine the infection status for single samples for 3 avian species, infection prevalence was examined for 58 of 61 avian species sampled. Parasite intensity, referring to the number of parasite DNA copies per 100 avian red blood cells, was determined for each sample based on qPCR data and sample DNA concentration following Friedl & Groscurth [38] and assuming that the average genome size of a passerine bird is 2.8 pg [49]. Parasite intensity data was examined with a Bayesian model for each individual bird of known age (2 age categories: birds hatched that year—HY, and birds hatched in previous years—AHY) for which we obtained valid parasite intensity data (n = 359 birds of 35 avian species). We could not determine age for 13 of the 372 birds (the 13 birds comprised 7 species) with valid parasite intensity data and, thus, this data was not included in the Bayesian model. The inclusion of all data, but excluding age as a categorical predictor, would not change the result on the association between date and parasite intensity.
As the data obtained from different species were not independent [50], we accounted for the phylogenetic dependency in both Bayesian models on parasite prevalence and intensity, constructing a covariance matrix of avian species following Hadfield & Nakagawa [51]. Avian phylogenies were obtained from Birdtree.org (http://birdtree.org (accessed on 1 May 2021)), which contains a Bayesian posterior distribution of phylogenies for 6670 avian species/operational taxonomic units [52]. We downloaded 1000 trees from the “Hackett sequenced species” data set for 58 avian species for parasite prevalence data and 35 avian species for parasite intensity data. The maximum credibility tree was selected from the downloaded trees using TreeAnnotator in BEAST v2.6.3 [53].
In addition to modelling phylogenetic covariance as a random effect, the random effect of avian species was included in both Bayesian models to account for the species effects that were unrelated to phylogenetic relationships [54]. The effect of species was nested in year that was used as an additional random effect in both models to account for inter-annual variation in response variables.
The Bayesian model on parasite intensity used log-transformed parasite intensity data (n = 359 intensity values) to satisfy the Gaussian distribution. Due to obtaining multiple observations of parasite intensity per avian species, for this response variable, we ran a phylogenetic model with repeated measurements following Bürkner [54]. Consequently, fixed effects included (1) age of birds (HY and AHY), (2) mean date of sampling per species (continuous variable where April 1st = 1), (3) second power of mean date of sampling per species to account for a potential quadratic relationship between date and parasite intensity, and (4) within species variability of date of sampling within species, which was calculated as a difference between date of sampling and mean date of sampling per species.
For parasite prevalence, we ran a Bayesian model assuming the binomial distribution. Prevalence was examined as proportions (infected birds/all birds) for each species per season and year (n = 220 prevalence values). The proportions between the number of all birds of a specific species and the number of all birds per season and year were used as weights to account for variation in the number of sampled birds per species. Season (spring, summer, and autumn) as a categorical predictor was used as a single fixed effect, as it was not possible to examine prevalence at the scale of date due to sample size limitations. Similarly, sample size limitations did not allow for examining the role of age in infection prevalence at the host community scale.
All statistical analyses and plots were performed with R software [55]. The vegan package [56] was used to obtain values of the Exp (H′) diversity index. The structural host specificity indices were calculated using the bipartite package [57,58] with “H2fun” and “dfun” functions. The bipartite package was used to prepare plots for host-parasite networks for each parasite genus. The SESMPD index was calculated using the picante package [59]. To test the significance of the values of this index, we used a null model implemented in the picante package as “taxa.labels” that randomizes the names of the host species but preserves the distribution of phylogenetic branches [59]. Bayesian multilevel models were fitted using the brms package and “brm” function [60,61], following Bürkner [54], for the implementation of the phylogenetic relationships between species as well as the repeated measurements within species. The contingency tables were examined with the Chi2 test using the “chisq.test” function in the stats package [55].

3. Results

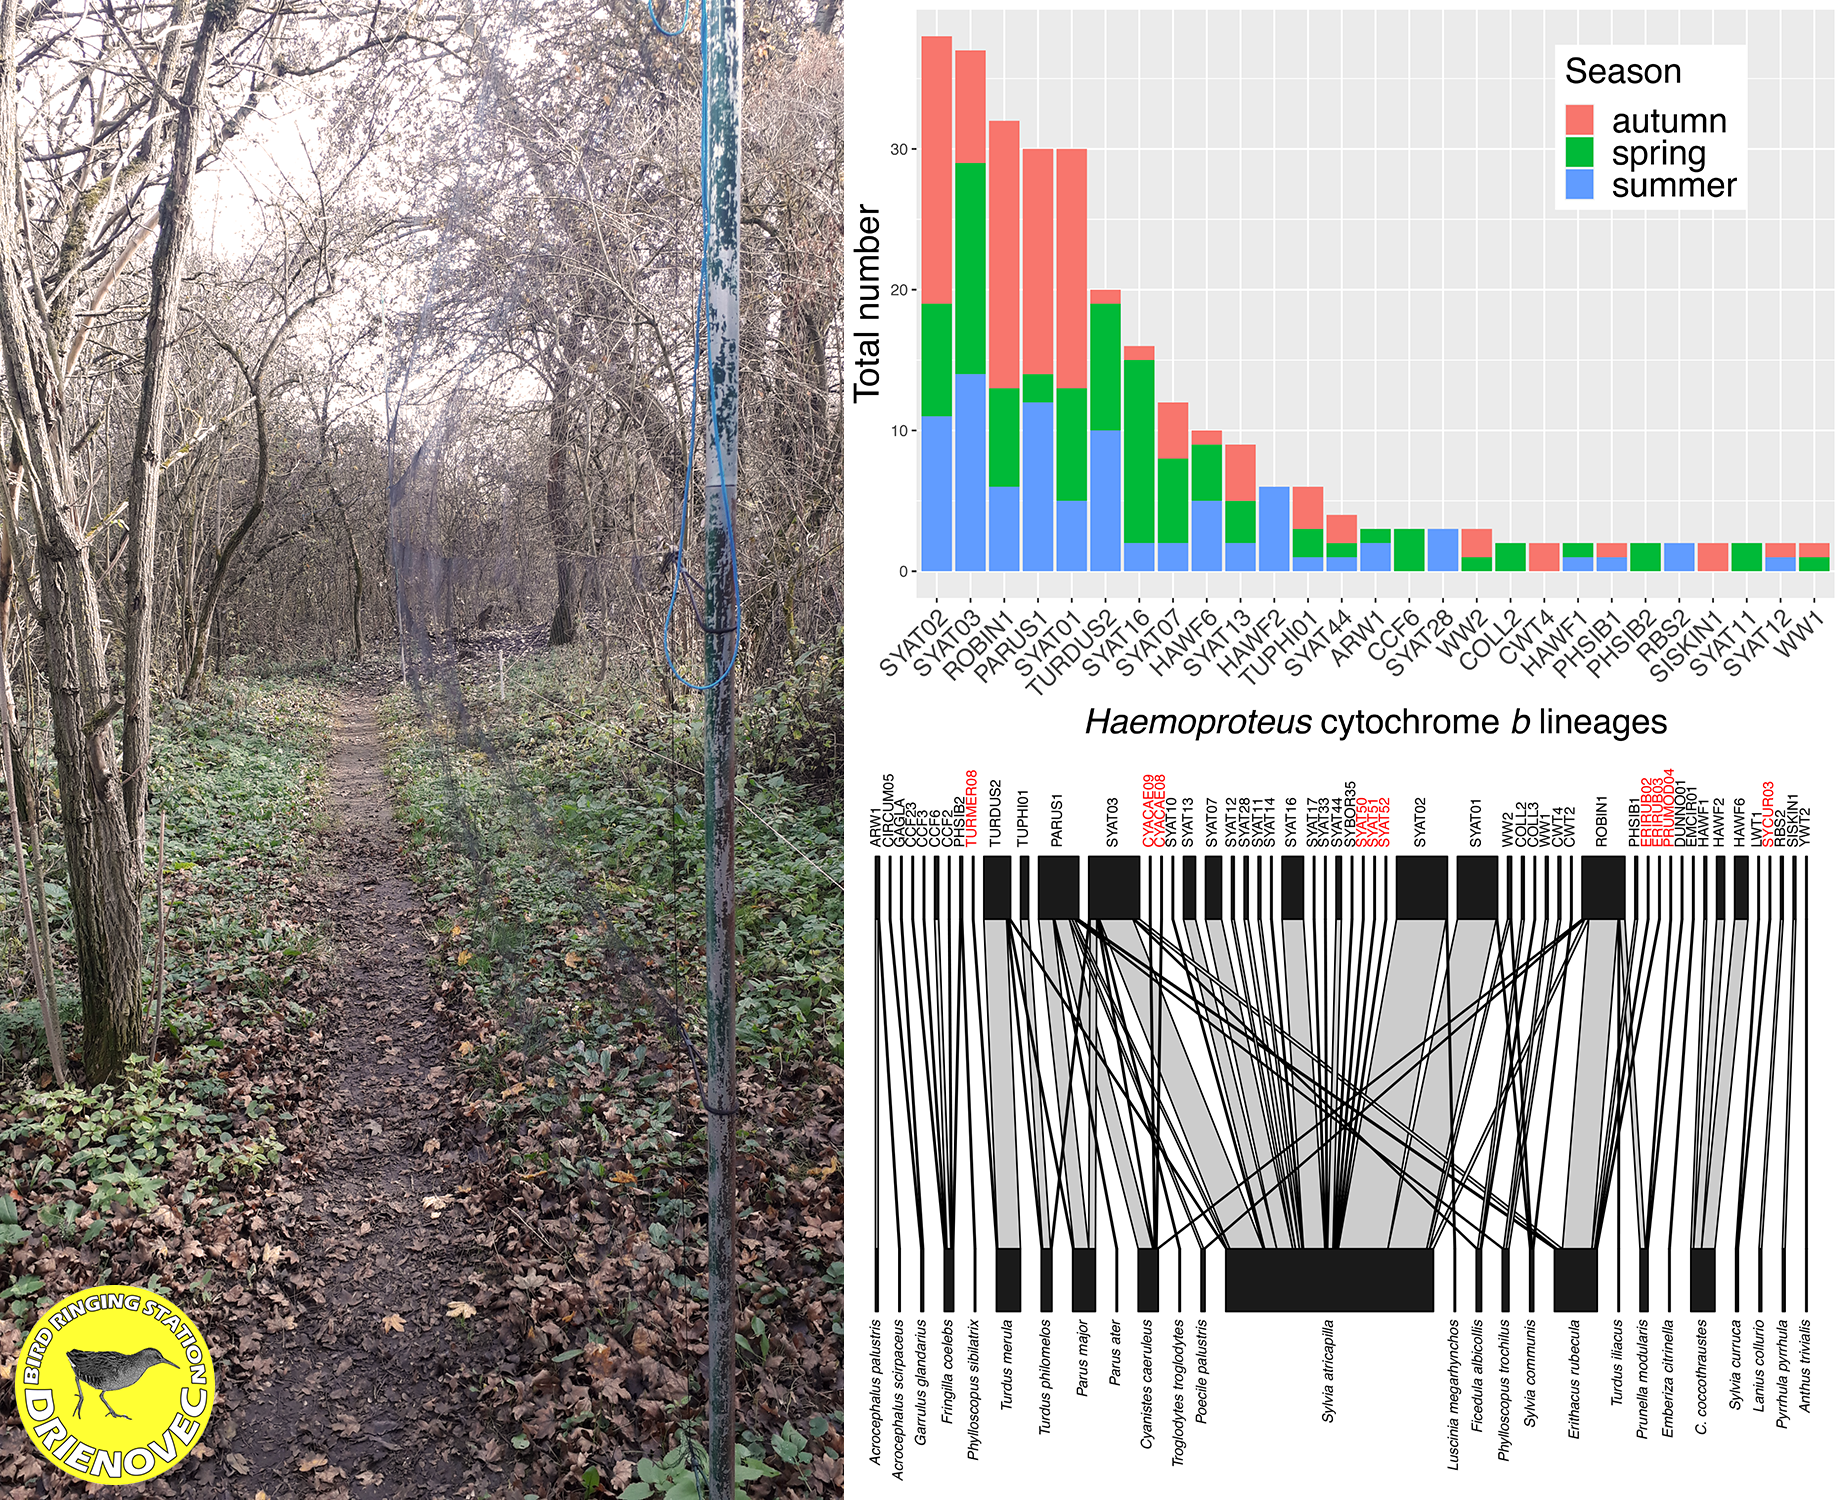
3.1. Avian and Haemosporidian Communities

Our analysis involved 1851 birds of 61 species that were sampled over 3 years during spring, summer and autumn (Figure 2, Table 1). The majority of the birds sampled comprised short-distance migrants and most of the birds were sampled in autumn rather than spring and summer (Figure 2). Both the richness and diversity of avian species sampled were relatively higher in autumn than spring and summer (Table 2).
Combining the results of quantitative RT-PCR (qPCR) and nested PCR, 767 of the 1775 (43%) bird samples were found to be positive for haemosporidian parasites; 76 samples provided ambiguous results and were not involved in further analyses. At least 1 positive sample was detected in birds of 71% (41/58) avian species (Table 1). Of the 767 positive samples, it was possible to determine the genus of haemosporidians for 700 samples: 675 (96%) samples were positive for Haemoproteus/Plasmodium and 258 (37%) for Leucocytozoon; 233 (33%) samples were positive for both Haemoproteus/Plasmodium and Leucocytozoon. Further, of the 700 samples for which we were able to determine the parasite’s genus, we were able to unambiguously determine at least one cytochrome b lineage for 587 samples: 300, 248 and 119 samples for Haemoproteus, Plasmodium and Leucocytozoon lineages, respectively, including 84 samples positive for both Haemoproteus/Plasmodium and Leucocytozoon parasites.
While the absolute number of positive samples was comparable between spring, summer and autumn for Haemoproteus, the number of positive samples for Plasmodium and Leucocytozoon was markedly higher in autumn than spring and summer (Figure 3). There was a significant relationship between time of year and haemosporidian genus for haemosporidian prevalence (Haemoproteus, Plasmodium, and Leucocytozoon: spring = 25, 9, and 9%, summer = 21, 5, and 4%, autumn = 13, 23, and 8%; Chi2-test: χ2 = 16.77, df = 4, p < 0.01). This result on the relative number of positive samples was mainly due to the higher-than-expected prevalence of Plasmodium-positive samples in autumn and the lower-than-expected prevalence of Haemoproteus-positive samples in autumn.
We identified 53, 14 and 44 cytochrome b lineages for Haemoproteus, Plasmodium and Leucocytozoon, respectively, in birds of 35 avian species (Table 1). A total of 19 lineages (10, 1, and 8 for Haemoproteus, Plasmodium, and Leucocytozoon, respectively) were detected for the first time by this study (Table 1). While the richness of haemosporidian lineages was relatively higher in spring and autumn than summer, lineage diversity was markedly higher in spring than summer and autumn (Table 2). The latter result was largely due to the high diversity of Leucocytozoon lineages in spring (Table 2).
A similar number (5–6) of lineages dominated in Haemoproteus and Plasmodium, but only a single lineage dominated in Leucocytozoon (Figure 4). While the dominant Haemoproteus lineages, with the exception of TURDUS2, were regularly detected throughout the whole season, the dominant Plasmodium and Leucocytozoon lineages occurred predominantly in autumn (Figure 4). The most frequently detected haemosporidian lineages during spring and summer comprised five Haemoproteus (spring: SYAT03 and SYAT16; summer: SYAT03, SYAT02, PARUS1, and TURDUS2) and five Plasmodium (spring: SGS1, TURDUS1, LINN1, SYAT05, and GRW11) lineages (Figure 4).
Intra-generic multiple infections (infections involving different lineages of the same haemosporidian genus) were revealed for all the three haemosporidian genera, but multiple infections with more than two lineages were only detected in a single sample for Plasmodium (Table 3). The proportion of multiple (≥double) infections was relatively higher in summer than spring and autumn for all the genera (the relationship between the type of infection, single vs. multiple, and time of year, Haemoproteus: χ2 = 7.7, df = 2, p = 0.021; Plasmodium: χ2 = 11.18, df = 2, p < 0.01; Leucocytozoon: χ2 = 13.23, df = 2, p < 0.01).
We identified the following lineage combination for intra-generic multiple infections: SYAT02 + SYAT28 (n = 2), SYAT02 + SYAT07 (1), SYAT07 + SYAT12 (1), SYAT16 + SYATSYAT44 (1), SYAT16 + SYBOR35 (1), SYAT01 + SYAT17 (1), and SYAT03 + TURDUS2 (1) for Haemoproteus spp. and TUPHI08 + LINN1 (1) and BT7 + TURDUS1 (1) for Plasmodium spp. We were not able to determine more than one lineage involved in intra-generic multiple infections for Leucocytozoon.
Inter-generic multiple infections involving Haemoproteus-Leucocytozoon and Plasmodium-Leucocytozoon lineages also were detected in our study (Table 4). The relationship between infection type (intra-generic vs. inter-generic) and time of year was insignificant for Haemoproteus and Plasmodium lineages (proportions of Haemoproteus infections with or without Leucocytozoon lineages: χ2 = 0.28, df = 2, p = 0.87; proportions of Plasmodium infections with or without Leucocytozoon lineages: χ2 = 3.08, df = 2, p = 0.21). However, Leucocytozoon infections coinfected with Haemoproteus lineages occurred more often than expected in summer (proportions of Leucocytozoon infections with or without Haemoproteus lineages: χ2 = 28, df = 2, p < 0.001) and with Plasmodium lineages more often than expected in autumn (proportions of Leucocytozoon infections with or without Plasmodium lineages: χ2 = 52.04, df = 2, p < 0.001).

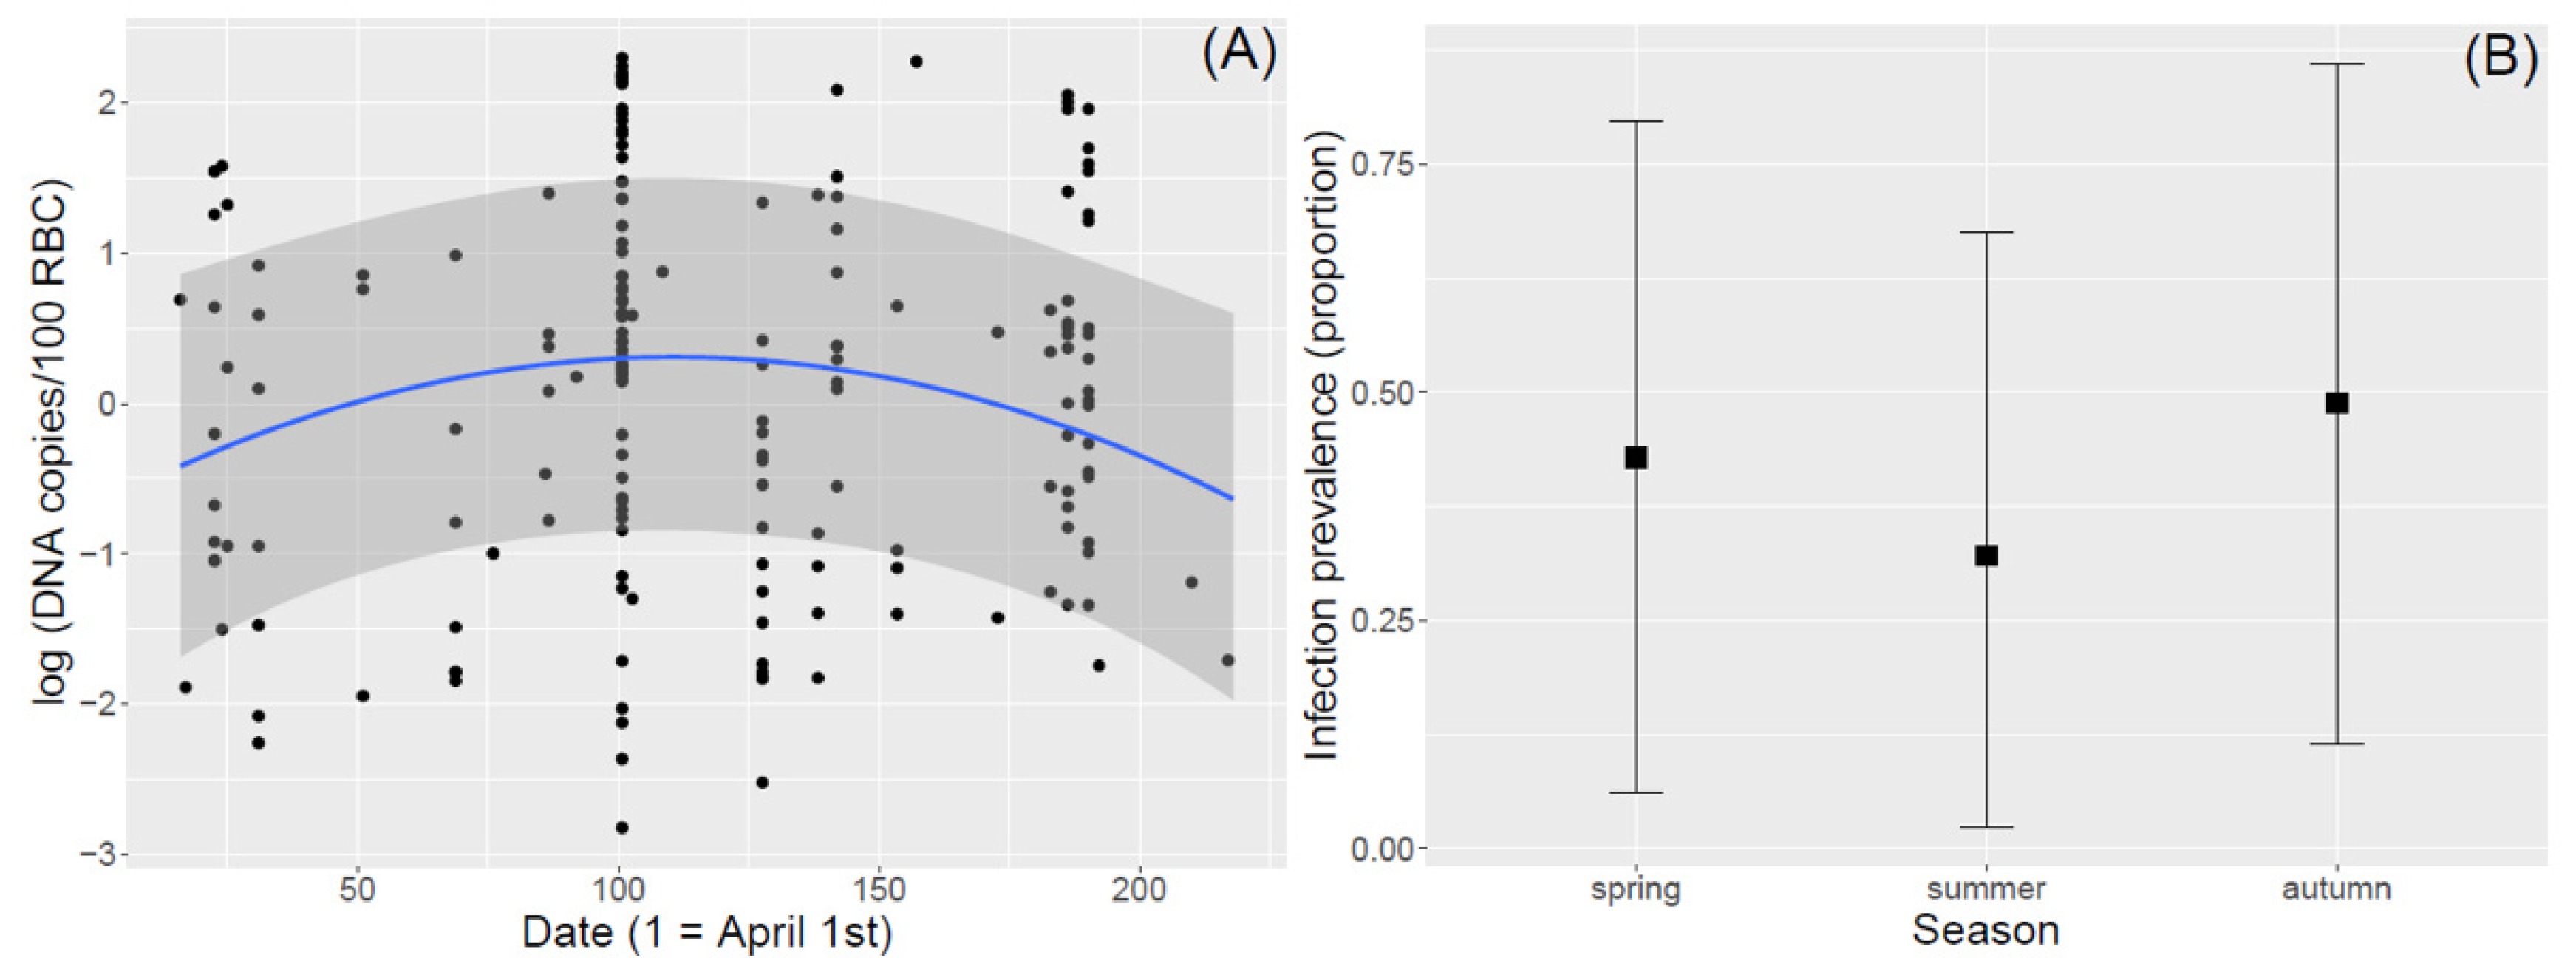
3.2. Seasonal Variation in Infection Intensity and Prevalence

Following the conservative criteria to accept the data of qPCR (see Methods), we were able to determine the intensity of haemosporidian infection for 372 (49%) of the 762 haemosporidian-positive samples. The intensity of infection ranged between 0.002 and 199 DNA copies/100 red blood cells (RBC), but it was highly skewed towards zero (median and 25–75% quantiles: 1.36, 0.09–9.04). Controlling for the random effects of avian species identity, year, and the phylogenetic relationships between avian species, we found that infection intensity at the level of the local avian community had a quadratic relationship with date (Table 5). Infection intensity peaked during summer around mid-July (Figure 5A). Infection intensity in older (AHY) birds was almost twice as high as in younger (HY) birds (back-transformed estimated marginal means of the number of DNA copies/100 RBC: AHY—1.75; HY—0.98), and the analysis detected a strong trend for the effect of age (Table 5). Although the random effects were small, they were important based on 95% credible intervals (CI; Table 5).
In contrast to infection intensity, infection prevalence at the level of the local avian community reached its lowest values in summer (Figure 5B). Although infection prevalence in spring and autumn was comparable (back-transformed estimated marginal means: spring—42.8%, summer—32.1%, autumn—48.8%), prevalence was only significantly different between summer and autumn (one-sided hypothesis tests: spring vs. summer: posterior p = 0.09; summer vs. autumn: posterior p = 0.01). Random effects of avian species identity, year, and avian phylogeny affected infection prevalence based on 95% CI (Table 6).

3.3. Host-Parasitic Associations

The highest (>50%) infection prevalence in frequently sampled (n > 30) bird species was observed in song thrush Turdus philomelos (78%), Eurasian blackbird T. merula (67%), Eurasian blue tit Cyanistes caeruleus (64%), common chaffinch Fringilla coelebs (61%), Eurasian blackcap Sylvia atricapilla (60%), hawfinch C. coccothraustes (60%), and great tit Parus major (53%; Table 1).
Examining the structural parasite specificity in terms of the d′ index, and considering only species with >10 positive samples, hawfinch, song thrush, Eurasian bullfinch P. pyrrhula, lesser whitethroat Sylvia curruca, common chaffinch, and Eurasian blackbird can be considered to be primarily infected by Haemoproteus and Leucocytozoon, while the Eurasian blackbird also shows a tendency to be relatively highly infected by Plasmodium lineages (Table 1).
In line with the results for avian hosts, the structural host specificity in terms of the H2 index indicated that at the parasite community level, Haemoproteus and Leucocytozoon lineages detected in our study in general represented intermediate host specialists, while Plasmodium lineages in general represented host generalists (Table 7). When focusing on individual lineages, we revealed a considerable variation in structural host specificity between lineages within all the three genera (Table 7). Interestingly, while some lineages such as Haemoproteus lineages SYAT01 and WW2 (associated with Sylviidae), Plasmodium lineage LINN1 (associated mainly with Turdidae and Muscicapidae), and Leucocytozoon lineages PARUS20 and PARUS22 (associated mainly with Paridae) showed a low structural specificity, they showed a significant phylogenetic host specificity (Table 1; Figure 6).

4. Discussion

In this study, we examined seasonal variation in local diversity and infection patterns of haemosporidian parasites for an avian community in a natural woody wetland in Slovakia. For this community, represented almost entirely (>99%) by passerines, with dynamic temporal changes in its structure and size, we detected 112 haemosporidian cytochrome b lineages, including 19 novel ones, in 35 avian species. The highest numbers of lineages were detected during spring and autumn, which corresponded with higher avian species richness and infection prevalence in the avian community during these periods. Conversely, infection intensity peaked during summer and tended to be higher in older birds.
The highest haemosporidian infection prevalence for commonly sampled bird species was observed in song thrush, Eurasian blackbird, Eurasian blue tit, common chaffinch, Eurasian blackcap, hawfinch, and great Tit. These thrushes, tits, finches, and a Sylvia warbler represent both locally and regionally abundant bird species. Our study, therefore, accords with the expectation that infection prevalence is a positive function of host abundance [4,62,63]. Nevertheless, despite their higher abundances and sampling rates, haemosporidian prevalence was relatively low in European robin Erithacus rubecula and common chiffchaff Phylloscopus collybita (see [64,65] for similar results), and their associated haemosporidians mostly represented structural and phylogenetic generalist lineages. Finally, even though multiple haemosporidian lineages showed similar prevalence in different hosts within the local avian community, exhibiting low structural specificity, some of these lineages were primarily found in phylogenetically related hosts: Haemoproteus lineages SYAT01 and WW2 in Sylviid warblers, Plasmodium lineage LINN1 in thrushes and old world flycatchers, and Leucocytozoon lineages PARUS20 and PARUS22 in tits.

4.1. Haemosporidian Diversity

Overall, Haemoproteus lineages dominated in the local avian haemosporidian community. Although the composition of Haemoproteus lineages fluctuated between spring and autumn, this genus showed similar species richness and diversity during spring, summer, and autumn periods. In turn, while Leucocytozoon lineages showed a comparable overall richness as those of the genus Haemoproteus, the richness and diversity of Leucocytozoon lineages dropped in summer, and Leucocytozoon parasites did not represent abundant avian haemosporidians in the locally breeding bird species. Lineages of the genus Plasmodium showed the lowest richness and diversity, even though the richness of lineages of this genus increased in autumn.
The highest haemosporidian lineage diversity was observed in spring, which was mainly due to the high diversity of Leucocytozoon lineages. The most common Leucocytozoon lineages detected in spring were HAWF7 and SFC8 associated with hawfinch and European robin, respectively. Valkiūnas [66] found that in spring, after arrival to the breeding grounds in North Europe, Leucocytozoon infections predominate in middle-distance migratory birds wintering in the Mediterranean region, while Haemoproteus infections are typical for long-distance (trans-Saharan) migrants wintering in Africa. Our study supports these findings, because bird species with a high infection prevalence in spring comprise short-distance migrants wintering in West and South Europe [67,68,69]. Furthermore, the seasonal dynamics of infections involving Leucocytozoon lineages suggests that the local parasite community for this genus is mainly sustained by birds breeding in North Europe and wintering in South Europe.
The lineages of the genus Plasmodium were least represented in the local avian community, though their abundance, but not diversity, increased in autumn. This result accords with previous work indicating an environmental barrier for more intensive transmission of avian malaria parasites in northern latitudes, with successful parasite transmission in these regions being mostly restricted to the warmest period of the year during late summer/early autumn [70]. Yet, generalist Plasmodium lineages TURDUS1 and SGS1 were fairly common in spring in several short-distance migrants: Eurasian wren T. troglodytes, song thrush, European robin, yellowhammer Emberiza citrinella, and common chaffinch. As these species belong to the typical early-season singing birds and TURDUS1 and SGS1 lineages were also most abundant in autumn, it is possible that these spring infections are caused by spring relapses in immunologically supressed, reproductively active, birds, e.g., [71,72]. It is important to note that Plasmodium infections could be underestimated in our study if the nested PCR procedure favoured Haemoproteus parasites.

4.2. Haemosporidian Multiple Infections

We found that intra-generic multiple infections were relatively more common in summer than spring or autumn, but this pattern was significant only for Leucocytozoon parasites. Additionally, samples infected with Leucocytozoon parasites were more likely found to be coinfected with Haemoproteus parasites in summer and with Plasmodium parasites in autumn. These results suggest that birds infected with Leucocytozoon parasites have a higher chance of being coinfected with other Leucocytozoon lineages and with Haemoproteus parasites during the summer period, and with Plasmodium parasites during autumn. Experimental inoculations of sporozoites of different genera, e.g., using sporozoites administration in a different sequence, could be performed to test this hypothesis. Importantly, additional information about dipteran vectors is needed to see how the ecology of vectors and bird hosts contribute to specific types of multiple infections. Finally, different sets of primers should be used in the future to study multiple infections, because many samples interpreted as single infections may readily involve multiple infections [73].

4.3. Haemosporidian Infection Prevalence and Intensity

Our results on infection prevalence at the community level support the functional model proposed by Beaudoin et al. [8]. Namely, we found elevated parasite prevalence in spring and autumn, even though the peak in autumn was more pronounced than that in spring. This result may indicate that the period of summer (June–July), when most of the bird species are still reproductively active at the study site, is relatively less important for parasite circulation and avian host health. This picture, however, is deceiving because infection intensity was found to peak in summer. Therefore, even though relatively fewer birds were infected with haemosporidians in summer at the community level, infected birds showed higher parasite intensity in this period. Moreover, older (after-hatch-year) birds tended to show higher parasite intensities than younger (hatch-year) birds. These results suggest that elevated parasite intensities in summer can be related to supressed immune functions in certain reproductively active birds [21]. As specific multiple infections occur more likely in summer (see Section 4.2), dominantly involving bird hosts primarily infected by Haemoproteus and Leucocytozoon parasites, it is possible that these multiple infections can also be responsible for increased parasite intensities in the avian community in summer. Importantly, these results on parasite prevalence and intensity imply that haemosporidian parasite transmission and circulation can locally be maintained by relatively few super-hosts, i.e., by birds with high infection intensities in sparsely infected avian communities.
In conclusion, this is one of the few studies examining temporal changes in the haemosporidian population structure at the avian community level. We found that a local avian community in Slovakia was characterised by Haemoproteus lineages, with Leucocytozoon lineages enriching the haemosporidian community mainly in spring after winter migration and, together with Plasmodium lineages, in autumn during autumn migration. In accordance with previous studies, despite the mixture of the locally breeding birds with spring and autumn migrants, the haemosporidian community in the local breeders in summer was relatively stable [66] and only few parasite lineages were found to dominate within each genus (Figure 4). We found that while several passerines in the local avian community were readily infected by various Haemoproteus and Leucocytozoon lineages, only the Eurasian blackbird was readily infected by parasite lineages of any of the three genera. These results deserve attention because the Eurasian blackbird is a suitable model system for diverse questions on the ecology and evolution of vector-borne pathogens, e.g., [35,74], but baseline data about infection patterns in this species are largely lacking for natural habitats (but see [26,75] for haemosporidians).

Author Contributions

Conceptualization, R.V.; Methodology, R.V. and E.Š.; Formal Analysis, R.V.; Investigation, A.Š., E.Š. and R.V.; Resources, R.V. and E.Š.; Writing—Original Draft Preparation, A.Š. and R.V.; Writing—Review & Editing, R.V. and E.Š.; Visualization, A.Š. and R.V.; Supervision, R.V.; Project Administration, R.V.; Funding Acquisition, R.V. All authors have read and agreed to the published version of the manuscript.

Funding

This research was financially supported by the Slovak Research and Development Agency (grant number APVV-16-0463) and by the Scientific Grant Agency of Ministry of Education and Slovak Academy of Sciences (VEGA grant No. 2/0023/20).

Institutional Review Board Statement

The study was approved by the the Ministry of the Environment of the Slovak Republic (No. 269/132/05-5.1_p and 9830/2017-6.3).

Data Availability Statement

Not applicable.

Acknowledgments

We thank Milan Olekšák and the ringers of the Drienovec Ringing Station for their assistance with bird capture and fieldwork. Soňa Brestovičová helped with labwork. Staffan Bensch and three anonymous reviewers provided valuable comments and suggestions.

Conflicts of Interest

The authors declare no conflict of interest.

References

  1. Dowell, S.F. Seasonal variation in host susceptibility and cycles of certain infectious diseases. Emerg. Infect. Dis. 2001, 7, 369. [Google Scholar] [CrossRef]
  2. Altizer, S.; Dobson, A.; Hosseini, P.; Hudson, P.; Pascual, M.; Rohani, P. Seasonality and the dynamics of infectious diseases. Ecol. Lett. 2006, 9, 467–484. [Google Scholar] [CrossRef] [Green Version]
  3. Grassly, N.C.; Fraser, C. Seasonal infectious disease epidemiology. Proc. R. Soc. B Biol. Sci. 2006, 273, 2541–2550. [Google Scholar] [CrossRef] [Green Version]
  4. Ellis, V.A.; Medeiros, M.C.; Collins, M.D.; Sari, E.H.; Coffey, E.D.; Dickerson, R.C.; Lugarini, C.; Stratford, J.A.; Henry, D.R.; Merrill, L. Prevalence of avian haemosporidian parasites is positively related to the abundance of host species at multiple sites within a region. Parasitol. Res. 2017, 116, 73–80. [Google Scholar] [CrossRef]
  5. Fallon, S.M.; Bermingham, E.; Ricklefs, R.E. Island and taxon effects in parasitism revisited: Avian malaria in the lesser antilles. Evolution 2003, 57, 606–615. [Google Scholar] [CrossRef]
  6. Ishtiaq, F. Ecology and evolution of avian malaria: Implications of land use changes and climate change on disease dynamics. J. Indian Inst. Sci. 2021, 101, 213–225. [Google Scholar] [CrossRef]
  7. Danilewsky, V. La Parasitologie Comparée du Sang. 1. Nouvelles Recherches sur les Parasites du Sang. Des. Oiseaux; Darre: Kharkov, Ukraine, 1889. [Google Scholar]
  8. Beaudoin, R.L.; Applegate, J.E.; Davis, D.E.; McLean, R.G. A model for the ecology of avian malaria. J. Wildl. Dis. 1971, 7, 5–13. [Google Scholar] [CrossRef] [Green Version]
  9. Applegate, J.E. Spring relapse of plasmodium relictum infections in an experimental field population of english sparrows (passer domesticus). J. Wildl. Dis. 1971, 7, 37–42. [Google Scholar] [CrossRef]
  10. Cosgrove, C.L.; Wood, M.J.; Day, K.P.; Sheldon, B.C. Seasonal variation in plasmodium prevalence in a population of blue tits cyanistes caeruleus. J. Anim. Ecol. 2008, 77, 540–548. [Google Scholar] [CrossRef]
  11. Svensson-Coelho, M.; Loiselle, B.A.; Blake, J.G.; Ricklefs, R.E. Resource predictability and specialization in avian malaria parasites. Mol. Ecol. 2016, 25, 4377–4391. [Google Scholar] [CrossRef]
  12. Pigeault, R.; Cozzarolo, C.-S.; Choquet, R.; Strehler, M.; Jenkins, T.; Delhaye, J.; Bovet, L.; Wassef, J.; Glaizot, O.; Christe, P. Haemosporidian infection and co-infection affect host survival and reproduction in wild populations of great tits. Int. J. Parasitol. 2018, 48, 1079–1087. [Google Scholar] [CrossRef]
  13. Hasselquist, D.; Östman, Ö.; Waldenström, J.; Bensch, S. Temporal patterns of occurrence and transmission of the blood parasite haemoproteus payevskyi in the great reed warbler acrocephalus arundinaceus. J. Ornithol. 2007, 148, 401–409. [Google Scholar] [CrossRef]
  14. Møller, A.P.; Erritzøe, J. Host immune defence and migration in birds. Evol. Ecol. 1998, 12, 945–953. [Google Scholar] [CrossRef]
  15. Waldenström, J.; Bensch, S.; Kiboi, S.; Hasselquist, D.; Ottosson, U. Cross-species infection of blood parasites between resident and migratory songbirds in Africa. Mol. Ecol. 2002, 11, 1545–1554. [Google Scholar] [CrossRef] [PubMed] [Green Version]
  16. Ishak, H.D.; Loiseau, C.; Hull, A.C.; Sehgal, R.N. Prevalence of blood parasites in migrating and wintering california hawks. J. Raptor Res. 2010, 44, 215–223. [Google Scholar] [CrossRef]
  17. Walther, E.L.; Carlson, J.S.; Cornel, A.; Morris, B.K.; Sehgal, R.N. First molecular study of prevalence and diversity of avian haemosporidia in a central california songbird community. J. Ornithol. 2016, 157, 549–564. [Google Scholar] [CrossRef]
  18. Ciloglu, A.; Ergen, A.G.; Inci, A.; Dik, B.; Duzlu, O.; Onder, Z.; Yetismis, G.; Bensch, S.; Valkiūnas, G.; Yildirim, A. Prevalence and genetic diversity of avian haemosporidian parasites at an intersection point of bird migration routes: Sultan marshes national park, Turkey. Acta Trop. 2020, 210, 105465. [Google Scholar] [CrossRef] [PubMed]
  19. Kelly, T.R.; MacGillivray, H.L.; Sarquis-Adamson, Y.; Watson, M.J.; Hobson, K.A.; MacDougall-Shackleton, E.A. Seasonal migration distance varies with natal dispersal and predicts parasitic infection in song sparrows. Behav. Ecol. Sociobiol. 2016, 70, 1857–1866. [Google Scholar] [CrossRef]
  20. Sol, D.; Jovani, R.; Torres, J. Parasite mediated mortality and host immune response explain age-related differences in blood parasitism in birds. Oecologia 2003, 135, 542–547. [Google Scholar] [CrossRef]
  21. Huang, X.; Jönsson, J.; Bensch, S. Persistence of avian haemosporidians in the wild: A case study to illustrate seasonal infection patterns in relation to host life stages. Int. J. Parasitol. 2020, 50, 611–619. [Google Scholar] [CrossRef]
  22. Davidar, P.; Morton, E.S. Living with parasites: Prevalence of a blood parasite and its effect on survivorship in the purple martin. Auk 1993, 110, 109–116. [Google Scholar]
  23. Wilson, K.; Bjørnstad, O.N.; Dobson, A.P.; Merler, S.; Poglayen, G.; Randolph, S.E.; Read, A.F.; Skorping, A. Heterogeneities in macroparasite infections: Patterns and processes. Ecol. Wildl. Dis. 2002, 44, 6–44. [Google Scholar]
  24. Emmenegger, T.; Alves, J.A.; Rocha, A.D.; Costa, J.S.; Schmid, R.; Schulze, M.; Hahn, S. Population-and age-specific patterns of haemosporidian assemblages and infection levels in european bee-eaters (merops apiaster). Int. J. Parasitol. 2020, 50, 1125–1131. [Google Scholar] [CrossRef] [PubMed]
  25. Parker, I.M.; Saunders, M.; Bontrager, M.; Weitz, A.P.; Hendricks, R.; Magarey, R.; Suiter, K.; Gilbert, G.S. Phylogenetic structure and host abundance drive disease pressure in communities. Nature 2015, 520, 542–544. [Google Scholar] [CrossRef] [Green Version]
  26. Ellis, V.A.; Huang, X.; Westerdahl, H.; Jönsson, J.; Hasselquist, D.; Neto, J.M.; Nilsson, J.-A.; Nilsson, J.; Hegemann, A.; Hellgren, O. Explaining prevalence, diversity and host specificity in a community of avian haemosporidian parasites. Oikos 2020, 129, 1314–1329. [Google Scholar] [CrossRef]
  27. Vázquez, D.P.; Poulin, R.; Krasnov, B.R.; Shenbrot, G.I. Species abundance and the distribution of specialization in host–parasite interaction networks. J. Anim. Ecol. 2005, 74, 946–955. [Google Scholar] [CrossRef]
  28. Drovetski, S.V.; Aghayan, S.A.; Mata, V.A.; Lopes, R.J.; Mode, N.A.; Harvey, J.A.; Voelker, G. Does the niche breadth or trade-off hypothesis explain the abundance–occupancy relationship in avian haemosporidia? Mol. Ecol. 2014, 23, 3322–3329. [Google Scholar] [CrossRef]
  29. Neto, J.M.; Pérez-Rodríguez, A.; Haase, M.; Flade, M.; Bensch, S. Prevalence and diversity of plasmodium and haemoproteus parasites in the globally-threatened aquatic warbler acrocephalus paludicola. Parasitology 2015, 142, 1183–1189. [Google Scholar] [CrossRef]
  30. Slowinski, S.P.; Fudickar, A.M.; Hughes, A.M.; Mettler, R.D.; Gorbatenko, O.V.; Spellman, G.M.; Ketterson, E.D.; Atwell, J.W. Sedentary songbirds maintain higher prevalence of haemosporidian parasite infections than migratory conspecifics during seasonal sympatry. PLoS ONE 2018, 13, e0201563. [Google Scholar] [CrossRef]
  31. Lynton-Jenkins, J.G.; Bründl, A.C.; Cauchoix, M.; Lejeune, L.A.; Sallé, L.; Thiney, A.C.; Russell, A.F.; Chaine, A.S.; Bonneaud, C. Contrasting the seasonal and elevational prevalence of generalist avian haemosporidia in co-occurring host species. Ecol. Evol. 2020, 10, 6097–6111. [Google Scholar] [CrossRef] [PubMed]
  32. Neto, J.M.; Mellinger, S.; Halupka, L.; Marzal, A.; Zehtindjiev, P.; Westerdahl, H. Seasonal dynamics of haemosporidian (apicomplexa, haemosporida) parasites in house sparrows passer domesticus at four european sites: Comparison between lineages and the importance of screening methods. Int. J. Parasitol. 2020, 50, 523–532. [Google Scholar] [CrossRef]
  33. Santiago-Alarcon, D.; Bloch, R.; Rolshausen, G.; Schaefer, H.M.; Segelbacher, G. Prevalence, diversity, and interaction patterns of avian haemosporidians in a four-year study of blackcaps in a migratory divide. Parasitology 2011, 138, 824–835. [Google Scholar] [CrossRef] [PubMed]
  34. Pellegrino, I.; Ilahiane, L.; Boano, G.; Cucco, M.; Pavia, M.; Prestridge, H.L.; Voelker, G. Avian haemosporidian diversity on sardinia: A first general assessment for the insular mediterranean. Diversity 2021, 13, 75. [Google Scholar] [CrossRef]
  35. Mtierová, Z.; Derdáková, M.; Chvostáč, M.; Didyk, Y.M.; Mangová, B.; Rusňáková Tarageľová, V.; Selyemová, D.; Šujanová, A.; Václav, R. Local population structure and seasonal variability of borrelia garinii genotypes in ixodes ricinus ticks, Slovakia. Int. J. Environ. Res. Public Health 2020, 17, 3607. [Google Scholar] [CrossRef] [PubMed]
  36. Sambrook, J.; Fritsch, E.F.; Maniatis, T. Molecular Cloning: A Laboratory Manual, 2nd ed.; Cold Spring Harbor Laboratory Press: Plainview, NY, USA, 1989; ISBN 978-0-87969-309-1. [Google Scholar]
  37. Bell, J.A.; Weckstein, J.D.; Fecchio, A.; Tkach, V.V. A new real-time pcr protocol for detection of avian haemosporidians. Parasites Vectors 2015, 8, 383. [Google Scholar] [CrossRef] [Green Version]
  38. Friedl, T.W.P.; Groscurth, E. A real-time PCR protocol for simple and fast quantification of blood parasite infections in evolutionary and ecological studies and some data on intensities of blood parasite infections in a subtropical weaverbird. J. Ornithol. 2012, 153, 239–247. [Google Scholar] [CrossRef]
  39. Bensch, S.; Stjernman, M.; Hasselquist, D.; Ostman, O.; Hansson, B.; Westerdahl, H.; Pinheiro, R.T. Host specificity in avian blood parasites: A study of plasmodium and haemoproteus mitochondrial DNA amplified from birds. Proc. Biol. Sci. 2000, 267, 1583–1589. [Google Scholar] [CrossRef] [Green Version]
  40. Hellgren, O.; Waldenström, J.; Bensch, S. A new PCR assay for simultaneous studies of leucocytozoon, plasmodium, and haemoproteus from avian blood. J. Parasitol. 2004, 90, 797–802. [Google Scholar] [CrossRef]
  41. Okonechnikov, K.; Golosova, O.; Fursov, M. The UGENE team Unipro UGENE: A unified bioinformatics toolkit. Bioinformatics 2012, 28, 1166–1167. [Google Scholar] [CrossRef] [Green Version]
  42. Bensch, S.; Hellgren, O.; Pérez-Tris, J. MalAvi: A public database of malaria parasites and related haemosporidians in avian hosts based on mitochondrial cytochrome b lineages. Mol. Ecol. Resour. 2009, 9, 1353–1358. [Google Scholar] [CrossRef]
  43. Jost, L. Entropy and diversity. Oikos 2006, 113, 363–375. [Google Scholar] [CrossRef]
  44. Shannon, C.E. A mathematical theory of communication. Bell Syst. Tech. J. 1948, 27, 379–423. [Google Scholar] [CrossRef] [Green Version]
  45. Esser, H.J.; Herre, E.A.; Blüthgen, N.; Loaiza, J.R.; Bermúdez, S.E.; Jansen, P.A. Host specificity in a diverse neotropical tick community: An assessment using quantitative network analysis and host phylogeny. Parasites Vectors 2016, 9, 372. [Google Scholar] [CrossRef] [Green Version]
  46. Blüthgen, N.; Menzel, F.; Blüthgen, N. Measuring specialization in species interaction networks. BMC Ecol. 2006, 6, 9. [Google Scholar] [CrossRef] [Green Version]
  47. Blüthgen, N.; Fründ, J.; Vázquez, D.P.; Menzel, F. What do interaction network metrics tell us about specialization and biological traits. Ecology 2008, 89, 3387–3399. [Google Scholar] [CrossRef] [PubMed] [Green Version]
  48. Poulin, R. Network analysis shining light on parasite ecology and diversity. Trends Parasitol. 2010, 26, 492–498. [Google Scholar] [CrossRef]
  49. Tiersch, T.R.; Wachtel, S.S. On the evolution of genome size of birds. J. Hered. 1991, 82, 363–368. [Google Scholar] [CrossRef]
  50. Felsenstein, J. Phylogenies and the comparative method. Am. Nat. 1985, 125, 1–15. [Google Scholar] [CrossRef]
  51. Hadfield, J.D.; Nakagawa, S. General quantitative genetic methods for comparative biology: Phylogenies, taxonomies and multi-trait models for continuous and categorical characters. J. Evol. Biol. 2010, 23, 494–508. [Google Scholar] [CrossRef]
  52. Jetz, W.; Thomas, G.H.; Joy, J.B.; Hartmann, K.; Mooers, A.O. The global diversity of birds in space and time. Nature 2012, 491, 444–448. [Google Scholar] [CrossRef]
  53. Bouckaert, R.; Vaughan, T.G.; Barido-Sottani, J.; Duchêne, S.; Fourment, M.; Gavryushkina, A.; Heled, J.; Jones, G.; Kühnert, D.; De Maio, N.; et al. BEAST 2.5: An advanced software platform for bayesian evolutionary analysis. PLoS Comput. Biol. 2019, 15, e1006650. [Google Scholar] [CrossRef] [Green Version]
  54. Bürkner, P.-C. Estimating Phylogenetic Multilevel Models with Brms. Available online: https://cran.r-project.org/web/packages/brms/vignettes/brms_phylogenetics.html (accessed on 9 August 2021).
  55. Team, R.C. R: A Language and Environment for Statistical Computing; R Foundation for Statistical Computing: Vienna, Austria, 2020. [Google Scholar]
  56. Oksanen, J.; Blanchet, F.G.; Friendly, M.; Kindt, R.; Legendre, P.; McGlinn, D.; Minchin, P.R.; O’Hara, R.B.; Simpson, G.L.; Solymos, P.; et al. Vegan: Community Ecology Package. Available online: https://CRAN.R-project.org/package=vegan (accessed on 9 August 2021).
  57. Dormann, C.F.; Fründ, J.; Blüthgen, N.; Gruber, B. Indices, graphs and null models: Analyzing bipartite ecological networks. Open Ecol. J. 2009, 2, 7–24. [Google Scholar] [CrossRef]
  58. Dormann, C.F. How to be a specialist? Quantifying specialisation in pollination networks. Netw. Biol. 2011, 1, 1–20. [Google Scholar]
  59. Kembel, S.W.; Cowan, P.D.; Helmus, M.R.; Cornwell, W.K.; Morlon, H.; Ackerly, D.D.; Blomberg, S.P.; Webb, C.O. Picante: R tools for integrating phylogenies and ecology. Bioinformatics 2010, 26, 1463–1464. [Google Scholar] [CrossRef] [Green Version]
  60. Bürkner, P.-C. Brms: An R package for bayesian multilevel models using stan. J. Stat. Softw. 2017, 80, 1–28. [Google Scholar] [CrossRef] [Green Version]
  61. Bürkner, P.-C. Advanced bayesian multilevel modeling with the R package brms. R J. 2018, 10, 395–411. [Google Scholar] [CrossRef]
  62. Morand, S.; Krasnov, B.R. The Biogeography of Host-Parasite Interactions; Oxford University Press: Oxford, UK, 2010; ISBN 978-0-19-956134-6. [Google Scholar]
  63. Santiago-Alarcon, D.; MacGregor-Fors, I.; Kühnert, K.; Segelbacher, G.; Schaefer, H.M. Avian haemosporidian parasites in an urban forest and their relationship to bird size and abundance. Urb. Ecosyst. 2016, 19, 331–346. [Google Scholar] [CrossRef]
  64. Bensch, S.; Jönsson, J.; Copete, J.L. Low prevalence of haemoproteus infections in chiffchaffs. Parasitology 2012, 139, 302–309. [Google Scholar] [CrossRef]
  65. Santiago-Alarcon, D.; MacGregor-Fors, I.; Falfán, I.; Lüdtke, B.; Segelbacher, G.; Schaefer, H.M.; Renner, S. Parasites in space and time: A case study of haemosporidian spatiotemporal prevalence in urban birds. Int. J. Parasitol. 2019, 49, 235–246. [Google Scholar] [CrossRef] [PubMed]
  66. Valkiūnas, G. The role of seasonal migrations in the distribution of haemosporidia of birds in north palaearctic. Ekologija 1993, 2, 57–67. [Google Scholar]
  67. Cepák Jaroslav, J.; Klvaňa, P.; Škopek, J.; Schröpfer, L.; Jelínek, M.; Hořák, D.; Formánek, J.; Zárybnický, J. Czech and Slovak Bird Migration Atlas; Aventinum: Prague, Czech Republic, 2008. [Google Scholar]
  68. Clement, P.; Christie, D.A. Hawfinch (coccothraustes coccothraustes). In Birds of the World, 1st ed.; del Hoyo, J., Elliott, A., Sargatal, J., Christie, D.A., de Juana, E., Eds.; Cornell Lab of Ornithology: Ithaca, NY, USA, 2000. [Google Scholar]
  69. Collar, N. European robin (erithacus rubecula). In Birds of the World, 1st ed.; del Hoyo, J., Elliott, A., Sargatal, J., Christie, D.A., de Juana, E., Eds.; Cornell Lab of Ornithology: Ithaca, NY, USA, 2000. [Google Scholar]
  70. Valkiūnas, G. Avian Malaria Parasites and Other Haemosporidia; CRC press: Boca Raton, FL, USA, 2005. [Google Scholar]
  71. Deviche, P.; Parris, J. Testosterone treatment to free-ranging male dark-eyed juncos (junco hyemalis) exacerbates hemoparasitic infection. Auk 2006, 123, 548–562. [Google Scholar] [CrossRef]
  72. Cornelius, J.; Zylberberg, M.; Breuner, C.; Gleiss, A.C.; Hahn, T. Assessing the role of reproduction and stress in the spring emergence of haematozoan parasites in birds. J. Exp. Biol. 2013, 217, 841–849. [Google Scholar] [CrossRef] [Green Version]
  73. Bernotienė, R.; Palinauskas, V.; Iezhova, T.; Murauskaitė, D.; Valkiūnas, G. Avian haemosporidian parasites (haemosporida): A comparative analysis of different polymerase chain reaction assays in detection of mixed infections. Exp. Parasitol. 2016, 163, 31–37. [Google Scholar] [PubMed]
  74. Evans, K.L.; Gaston, K.J.; Sharp, S.P.; McGowan, A.; Simeoni, M.; Hatchwell, B.J. Effects of urbanisation on disease prevalence and age structure in blackbird turdus merula populations. Oikos 2009, 118, 774–782. [Google Scholar] [CrossRef]
  75. Bentz, S.; Rigaud, T.; Barroca, M.; Martin-Laurent, F.; Bru, D.; Moreau, J.; Faivre, B. Sensitive measure of prevalence and parasitaemia of haemosporidia from european blackbird (turdus merula) populations: Value of PCR-RFLP and quantitative PCR. Parasitology 2006, 133, 685–692. [Google Scholar] [CrossRef] [Green Version]
Figure 1. Sampling rates for avian species captured in Drienovec, Slovakia, during 2017, 2018 and 2019.
Diversity 13 00439 g001
Figure 2. Alluvial plot describing the community structure of birds captured in Drienovec, Slovakia, during 2017, 2018 and 2019. Community structure is described in terms of time of year (spring, summer, autumn), age (HY: hatch-year; AHY: after-hatch-year), and migration strategy (SD: short-distance migrants; LD: long-distance migrants).
Diversity 13 00439 g002
Figure 3. Alluvial plot describing the community structure of haemosporidian parasites detected in Drienovec, Slovakia, during 2017, 2018 and 2019. Community structure is described in terms of time of year (spring, summer, autumn) and parasite genus (Haemoproteus, Plasmodium and Leucocytozoon).
Diversity 13 00439 g003
Figure 4. Frequencies of haemosporidian cytochrome b lineages detected in Drienovec, Slovakia, during 2017, 2018 and 2019. Lineage frequencies detected during spring, summer for the genera (A) Haemoproteus, (B) Plasmodium, and (C) Leucocytozoon. For genera Haemoproteus and Leucocytozoon, only lineages detected more than once are shown.
Diversity 13 00439 g004
Figure 5. Intensity and prevalence of haemosporidian infection for the entire avian community in Drienovec, Slovakia, during 2017, 2018 and 2019. Plots show (A) the relationship between parasite intensity and time of year and (B) differences in infection prevalence between spring, summer, and autumn.
Diversity 13 00439 g005
Figure 6. Bipartite plots on the host–parasite networks for haemosporidian parasites and avian species in Drienovec, Slovakia, during 2017, 2018 and 2019. Bipartite plots are shown for (A) Haemoproteus, (B) Plasmodium, and (C) Leucocytozoon lineages. Lineage names detected in this study are shown in red.
Diversity 13 00439 g006aDiversity 13 00439 g006b
Table 1. List of avian species sampled and haemosporidian parasites detected in Drienovec, Slovakia, during 2017, 2018 and 2019. For each bird species we report migratory strategy (MS: SD = short-distance migrant, LD = long-distance migrant), number of sampled individuals during three years and for two age classes (AHY: after-hatch-year, HY: hatch-year), haemosporidian prevalence in percent (proportion), values of structural parasite specificity in terms of the d′ index (d′ H, P and L: specificity for Haemoproteus, Plasmodium and Leucocytozoon lineages, respectively), and haemosporidian cytochrome b lineages (H: Haemoproteus, P: Plasmodium and L: Leucocytozoon). New lineages are in bold. Note that it was not possible to identify lineage for each positive sample while multiple lineages were often identified in individual blood samples. Furthermore, the d′ index was not possible to calculate for each parasite genus due to sample size limitations. Sample sizes for prevalence may not correspond with the number of sampled birds per species as it was not possible to determine infection status for some (n = 76) of the samples.
Bird SpeciesMSn (’17/’18/’19)HYAHYPrevalenced′ Hd′ Pd′ LHaemosporidian Lineage (n)
Caprimulgiformes
Caprimulgus europaeusLD1 (0/1/0)100 (0/1)---
Gruiformes
Crex crexLD1 (0/1/0)100 (0/1)---
Rallus aquaticusSD1 (0/1/0)01100 (1/1)---
Accipitriformes
Buteo buteoSD2 (1/0/1)020 (0/2)---
Coraciiformes
Alcedo atthisSD1 (0/1/0)100 (0/1)---
Piciformes
Dendrocopus majorSD7 (1/1/5)3417 (1/6)--0.47L: SFC8 (1)
Dryobates minorSD1 (1/0/0)10- (0/0)---
Jynx torquillaLD2 (1/0/1)110 (0/2)---
Passeriformes
Laniidae
Lanius collurioLD5 (4/0/1)2340 (2/5)1.00--H: RBS2 (2)
Corvidae
Garrulus glandariusSD11 (3/4/4)4730 (3/10)1.00-1.00H: CIRCUM05 (1), GAGLA02 (1), L: COCOR02 (1), GAGLA06 (2)
Remizidae
Remiz pendulinusSD6 (3/0/3)510 (0/5)---
Paridae
Cyanistes caeruleusSD121 (42/48/31)942864 (76/118)0.560.170.52H: CYACAE08 (1), CYACAE09 (1), PARUS1 (11), ROBIN1 (1), SYAT03 (1), P: BT7 (4), COLL1 (1), GRW11 (3), LINN1 (1), PADOM02 (1), SGS1 (7), TUPHI08 (1), TURDUS1 (25), L: PARUS4 (8), PARUS14 (1), PARUS15 (1), PARUS16 (1), PARUS18 (1), PARUS20 (1)
Parus aterSD10 (0/7/3)9170 (7/10)0.060.041.00H: PARUS1 (1), P: GRW11 (2), SGS1 (1), TURDUS1 (1), L: PERATE06 (1)
Parus majorSD175 (35/86/54)1264953 (92/172)0.460.230.58H: PARUS1 (11), SYAT03 (5), TURDUS2 (1), P: BT7 (4), GRW06 (1), GRW11 (5), SGS1 (27), TURDUS1 (20), L: BT1 (1), PARUS4 (12), PARUS7 (1), PARUS16 (4), PARUS19 (1), PARUS20 (1), PARUS22 (7), PARUS25 (1), PARUS81 (1), PARUS93 (1), PARUS94 (1)
Lophophanes cristatusSD1 (0/1/0)100 (0/1)---
Poecile montanusSD1 (1/0/0)01100 (1/1)--0.28L: PARUS22 (1)
Poecile palustrisSD23 (4/8/11)14930 (7/23)0.170.170.32H: PARUS1 (2), ROBIN1 (1), P: GRW11 (1), SGS1 (1), L: PARUS20 (1), PARUS22 (1)
Acrocephalidae
Hippolais icterinaLD2 (0/1/1)110 (0/1)---
Acrocephalus arundinaceusLD1 (0/1/0)100 (0/1)---
A. palustrisLD13 (2/5/6)31031 (4/13)0.89--H: ARW1 (2),
A. scirpaceusLD5 (0/5/0)3240 (2/5)0.701.00-H: ARW1 (1), P: SW5 (1)
A. schoenobaenusLD5 (0/5/0)500 (0/5)---
Locustellidae
Locustella naeviaLD4 (0/4/0)400 (0/4)---
Hirundinidae
Hirundo rusticaLD7 (4/3/0)520 (0/7)---
Sylvidae
Sylvia atricapillaSD372 (109/158/85)15821460 (213/355)0.710.140.50H: PARUS1 (2), ROBIN1 (3), SYAT01 (29), SYAT02 (37), SYAT03 (25), SYAT07 (12), SYAT10 (1), SYAT11 (2), SYAT12 (2), SYAT13 (9), SYAT14 (1), SYAT16 (16), SYAT17 (1), SYAT28 (3), SYAT33 (1), SYAT44 (4), SYAT50 (1), SYAT51 (1), SYAT52 (1), SYBOR35 (1), TURDUS2 (1), WW2 (2), P: GRW11 (1), LINN1 (1), SGS1 (3), SYAT05 (2), L: PARUS4 (1), PARUS16 (1), SYAT22 (2), SYCON05 (1), SFC8 (1)
S. borinLD7 (1/6/0)4314 (1/7)---
S. communisLD12 (3/9/0)4845 (5/11)0.58--H: CWT2 (1), SYAT01 (1), WW2 (1)
S. currucaLD35 (14/10/11)23341 (13/32)1.000.381.00LWT1 (1), SYCUR03 (1), P: GRW11 (4), SGS1 (2), L: REB11 (1), RECOB3 (1), SYBOR23 (2)
Phylloscopidae
Phylloscopus collybitaSD73 (14/16/43)9539 (6/65)-0.00-P: TURDUS1 (1)
P. sibilatrixLD4 (1/1/2)1350 (2/4)0.81--H: PHSIB2 (1)
P. trochilusLD28 (7/16/5)12732 (9/28)0.81-0.56CWT4 (2), PARUS1 (1), WW1 (2), L: BT1 (1), SFC8 (1)
Aegithalidae
Aegithalos caudatusSD8 (2/3/3)0813 (1/8)---
Regulidae
Regulus ignicapillaSD4 (0/1/3)040 (0/3)---
Regulus regulusSD20 (3/6/11)101020 (4/20)-0.000.47P: TURDUS1 (1), L: BT2 (1)
Sittidae
Sitta europaeaSD5 (2/2/1)4120 (1/5)-0.32-P: GRW11 (1)
Certhiidae
Certhia familiarisSD9 (2/3/3)2722 (2/9)-0.07-P: SGS1 (1)
Troglodytidae
T. troglodytesSD29 (12/4/13)101959 (16/27)0.000.200.54H: SYAT03 (1), P: BT7 (2), TURDUS1 (8), SGS1 (1), L: PARUS20 (1)
Turdidae
Turdus iliacusSD1 (0/0/1)10100 (1/1)0.05--H: ROBIN1 (1)
Turdus merulaSD96 (26/33/37)455167 (64/95)0.940.501.00TURDUS2 (17), TURMER08 (1), P: LINN1 (9), SYAT05 (16), TURDUS1 (4), TURMER09 (1), L: NEVE01 (2), TUMER03 (2), TUMER10 (1), TURMER10 (1), TURMER11 (1), TURMER12 (1), TURMER13 (1), TURMER14 (1)
Turdus philomelosSD40 (8/10/22)221878 (31/40)0.740.301.00H: TUPHI01 (6), TURDUS2 (1), P: LINN1 (8), SYAT05 (3), TURDUS1 (3), L: EUSE2 (1), SANG02 (1), STUR1 (2), TUPHI06 (7), TUPHI13 (4), TUPHI14 (1)
Muscicapidae
Muscicapa striataLD1 (0/0/1)10- (0/0)---
Ficedula albicollisLD29 (6/7/16)151314 (4/29)0.74--H: COLL2 (2), COLL3 (1), SYAT03 (1)
Ficedula hypoleucaLD3 (1/1/1)1133 (1/3) --
Luscinia megarhynchosLD17 (6/6/5)81124 (4/17)0.000.53-H: SYAT02 (1), P: AFTRU4 (1), LINN1 (2)
Erithacus rubeculaSD354 (78/171/135)22512525 (85/336)0.650.130.68H: ERIRUB02 (1), ERIRUB03 (1), PARUS1 (2), PHSIB1 (2), ROBIN1 (22), SYAT03 (4), P: BT7 (1), LINN1 (10), SGS1 (5), SYAT05 (2), SYBOR2 (1), TURDUS1 (7), L: BT2 (4), PARUS25 (1), SFC8 (2)
Phoenicurus phoenicurusLD6 (1/3/2)3317 (1/6)---
Phoenicurus ochrurosSD5 (1/1/3)2320 (1/5)-0.07-P: SGS1 (1)
Prunellidae
Prunella modularisSD75 (33/21/21)542138 (26/69)0.600.18-H: DUNNO01 (1), PRUMOD04 (1), ROBIN1 (4), P: BT7 (4), COLL1 (1), SGS1 (3), SYAT05 (1), SYBOR2 (1), TURDUS1 (8)
Passeridae
Passer montanusSD5 (1/4/0)2360 (3/5)-0.07-P: SGS1 (1)
Motacillidae
Anthus trivialisLD8 (0/7/1)5325 (2/8)1.000.161.00H: YWT2 (1), P: BT7 (1), TURDUS1 (1), L: TRPIP1 (1)
Fringillidae
Fringilla coelebsSD31 (8/7/16)52661 (19/31)0.970.081.00H: CCF2 (1), CCF3 (1), CCF6 (3), CCF23 (1), PHSIB2 (1), P: SGS1 (2), TURDUS1 (3), L: BRAM3 (2)
F. montifringillaSD2 (0/0/2)020 (0/2)---
Coccothraustes coccothraustesSD44 (16/12/16)192560 (25/42)1.000.071.00H: HAWF1 (2), HAWF2 (6), HAWF6 (10), P: SGS1 (1), L: HAWF7 (8)
Linaria cannabinaSD3 (2/1/0)2133 (1/3)---
Carduelis carduelisSD47 (27/20/0)291813 (6/47)-0.13-P: GRW11 (1), LINN1 (1), SGS1 (2)
Chloris chlorisSD12 (10/2/0)750 (0/11)---
Serinus serinusSD1 (1/0/0)10- (0/0)---
Pyrrhula pyrrhulaSD39 (3/11/25)20842 (16/38)1.000.090.91H: SISKIN1 (2), P: GRW11 (1), LINN1 (1), TURDUS1 (1), L: PARUS25 (5), PICVIR01 (1), PRUMOD01 (2), PYRPYR01 (1)
Emberizidae
Emberiza citrinellaSD17 (4/9/4)31453 (8/15)1.000.13-H: EMCIR01 (1), P: GRW11 (2), SGS1 (4), SYAT05 (1), TURDUS1 (1)
Emberiza ciaSD1 (1/0/0)010 (0/1)---
Emberiza schoeniclusSD3 (0/1/2)120 (0/2)---
Table 2. Richness (S) and diversity of avian host species and haemosporidian cytochrome b lineages detected in Drienovec, Slovakia, during 2017, 2018 and 2019. Taxonomic diversity was examined in terms of the Exp (H′) index, reflecting the effective number of species based on the Shannon diversity index H’ for the given taxonomic group and time of year.
Time of YearSExp (H′)
Avian hosts (n = 61)spring3812.6
summer3010.9
autumn5017
Haemosporidian lineagesspring6038.0
summer4428.4
autumn6524.4
Haemoproteus (n = 53)spring2717.2
summer3018.4
autumn2613
Plasmodium (n = 14)spring86
summer54.2
autumn135.8
Leucocytozoon (n = 44)spring2522.3
summer97.6
autumn2615.2
Table 3. Relationship between the type of intra-generic infection and time of year for the frequency of haemosporidian cytochrome b lineages detected in Drienovec, Slovakia, during 2017, 2018 and 2019. Note that haemosporidian lineage identity was not known for all parasites involved in multiple infections.
Infection Type
Time of YearSingleDouble>DoubleTotal
Haemoproteus
spring85125102
summer7019897
autumn97104111
Plasmodium
spring296035
summer166022
autumn180171198
Leucocytozoon
spring286438
summer112720
autumn5610773
Table 4. Relationship between infection type, considering intra- vs. inter-generic infections, and time of year for the frequency of haemosporidian cytochrome b lineages detected in Drienovec, Slovakia, during 2017, 2018 and 2019. Note that haemosporidian lineage identity was not known for all parasites involved in multiple infections.
Infection Type
Time of YearIntra-Genericwith Leucocytozoon
Haemoproteus
spring9012
summer8710
autumn10011
Plasmodium
spring305
summer175
autumn15543
Intra-genericwith Haemoproteus
Leucocytozoon
spring2612
summer1010
autumn6211
Intra-genericwith Plasmodium
Leucocytozoon
spring335
summer155
autumn3043
Table 5. Bayesian multivariate multilevel model on the predictors of haemosporidian infection intensity in a local avian community in Drienovec, Slovakia, during 2017, 2018 and 2019.
ParameterEstimateEst. ErrorL-95% CIU-95% CIRhatBulk ESSTail ESSpMCMC
Random effects (SD)
Phylogeny (35 levels)0.050.030.010.11111261665
Year (3 levels)0.550.620.032.21784633
Year:Species (67 levels)0.240.150.010.5518123163
Fixed effects
Intercept−0.70.68−2.050.651255336200.134
Date0.020.0100.031736921,1920.013
Date^2~0~0~0~01681020,0080.006
Date/species~0~0~0~0172,435103,4550.466
Age_HY−0.250.16−0.560.06119,96851,2770.057
Residual effect (SD)
Sigma1.180.051.091.28115,78348,731
Table 6. Bayesian multivariate multilevel model on the predictors of haemosporidian infection prevalence in a local avian community in Drienovec, Slovakia, during 2017, 2018 and 2019.
ParameterEstimateEst. ErrorL-95% CIU-95% CIRhatBulk ESSTail ESSpMCMC
Random effects (SD)
Phylogeny (58 levels)0.120.050.040.25138,92135,894
Year (3 levels)0.720.720.032.69127,29218,348
Year:Species (130 levels)0.230.190.010.71148,27457,250
Fixed effects
Intercept−0.060.95−1.991.9134,46426,4860.469
Season_Spring−0.290.41−1.110.51180,28168,2700.242
Season_Summer−0.830.38−1.59−0.091103,34980,4390.014
Table 7. List of haemosporidian cytochrome b lineages detected in Drienovec, Slovakia, during 2017, 2018 and 2019. For each lineage, we report values of structural host specificity in terms of the d′ and H2 indices, phylogenetic specificity in terms of the SESMPD index. The indices were calculated at the level of haemosporidian lineage (d′, SESMPD) or genus (H2). Significant values (p ≤ 0.05) for the SESMPD index are denoted by asterisk. New lineages are in bold.
dSESMPDH2 dSESMPDH2 dSESMPDH2
Haemoproteus 0.70Plasmodium 0.31Leucocytozoon 0.69
ARW10.57−1.67 AFTRU40.72- BRAM30.48-
CIRCUM050.59- BT70.190.51 BT10.25−0.25
CCF230.42- COLL10.270.54 BT20.16−0.15
CCF20.42 GRW060.18- COCOR020.59-
CCF30.42- GRW110.20−2.64 * EUSE20.38-
CCF60.49- LINN10.18−1.87 * GAGLA060.64-
COLL20.49- PADOM020.26- HAWF70.46-
COLL30.43- SGS10.12−1.00 NEVE010.31-
CWT20.58- SW51.00- PARUS140.19-
CWT40.50- SYAT050.26−1.00 PARUS150.19-
DUNNO010.27- SYBOR20.160.40 PARUS160.12−1.06
EMCIR010.52- TUPHI080.26- PARUS180.19-
GAGLA020.59- TURDUS10.130.26 PARUS190.13-
HAWF10.43- TURMER090.31- PARUS200.19−1.69 *
HAWF20.45- PARUS220.28−2.99 *
HAWF60.46- PARUS250.29−0.09
LWT10.40- PARUS40.17−1.06
PARUS10.13−3.00 * PARUS70.13-
PHSIB10.11- PARUS810.13-
PHSIB20.530.34 PERATE060.61-
RBS20.76- PYRPYR010.38-
ROBIN10.11−0.18 PRUMOD010.44-
SISKIN10.44- PICVIR010.38-
SYAT010.18−3.35 * REB110.40-
SYAT020.180.37 RECOB30.40-
SYAT030.07−1.09 SANG020.38-
SYAT070.16- SFC80.141.77
SYAT100.00- STUR10.44-
SYAT110.10- SYAT220.10-
SYAT120.10- SYBOR230.46-
SYAT130.16- SYCON050.00-
SYAT140.00- TRPIP10.65
SYAT160.17- TUMER030.31
SYAT170.00- TUPHI060.47
SYAT280.12- TUPHI130.46
SYAT330.00- TUMER100.23
SYAT440.13- TURMER100.23
SYBOR350.00- TURMER110.23
TUPHI010.47- TUPHI140.38
TURDUS20.27−0.73 PARUS930.13
WW10.50- TURMER120.23
WW20.20−3.35 * TURMER130.23
YWT20.65- TURMER140.23
ERIRUB020.01 PARUS940.13
PRUMOD040.27
TURMER080.23
ERIRUB030.01
CYACAE090.19
CYACAE080.19
SYAT500.00
SYAT510.00
SYAT520.00
SYCUR030.40
Publisher’s Note: MDPI stays neutral with regard to jurisdictional claims in published maps and institutional affiliations.

