Abstract
Burullus Lake is Egypt’s second most important coastal lagoon. The present study aimed to shed light on the different types of polluted waters entering the lake from various drains, as well as to evaluate the zooplankton community, determine the physical and chemical characteristics of the waters, and study the eutrophication state based on three years of seasonal monitoring from 2017 to 2019 at 12 stations. The results revealed that Rotifera, Copepoda, Protozoa, and Cladocera dominated the zooplankton population across the three-year study period, with a total of 98 taxa from 59 genera and 10 groups detected in the whole-body lake in 2018 and 2019, compared to 93 species from 52 genera in 2017. Twelve representative surface water samples were collected from the lake to determine physicochemical parameters, i.e., temperature, pH, salinity, dissolved oxygen, biological oxygen demand, chemical oxygen demand, ammonia-N, nitrate–N, nitrate-N, total nitrogen, total phosphorus, dissolved reactive phosphorus, and chlorophyll-a, as well as Fe, Cu, Zn, Cr, Ni, Cd, and Pb ions. Based on the calculations of the water quality index (WQI), the lake was classified as having good water quality. However, the trophic state is ranked as hyper-eutrophic and high trophic conditions.
1. Introduction
The Deltaic Mediterranean coastline of Egypt, especially the middle part, has economic importance. From the west coast to the east coast, there are three Deltaic shallow lakes (Edku, Burullus, and Manzala Lakes). Burullus Lake is the second-largest natural lake in Egypt and is situated close to the Mediterranean Sea among the two main branches of the Nile. The importance of lakes as natural resources includes fish production, as they account for more than 40% of the overall fish production in Egypt. As a result of anthropogenic activity and pollution, its production has decreased to less than 12.22% now [1]. Burullus Lake is one of a network of protected areas throughout Egypt, designated and managed by the Egyptian Environmental Affairs Agency. It is registered as a Ramsar site in 1998. Additionally, Birdlife International has identified it as an important bird area (IBA) [2], due to its importance for refuge, migratory foraging, and breeding of water birds [3]. It covers an area of 410 km2 [4] of which 220 km2 are open water [5]. It is observable that the open water surface in the lake had reduced from 1092 km2 in 1801 [6] to 434.6 km2 in 1972 then reduced to 220 km2 in 2015 with a reduction of about 80.0% of the water area [5].
Coastal lakes are heavily influenced by anthropogenic activities from watersheds, as they receive inputs of freshwater and polluted waters containing organic and inorganic compounds from different sources [7]. These lakes collect massive amounts of drainage water from various drains around the Nile delta and connect to the Mediterranean Sea via El-Boughaz outlets [2]. Contamination of the marine environment is a major factor that poses a substantial threat to marine creatures’ survival [8]. Among the several pollutants, heavy metals are toxic, persistent, and abundant owing to their accumulation in the food chain and continued persistence in the ecosystem and their concentration increases through biomagnification [9]. The impacts of pollution have far-reaching consequences for public health, the economy, and the environment [10].
The process of eutrophication is driven by an increase in nutrients in the aquatic systems, particularly nitrogen and phosphorus in the ecosystem, which leads to an increase in primary production (photosynthesis) and an accumulation of organic matter in the lakes. In addition, silt from the drainage basins will accumulate over time, which makes the lake shallower and warmer. Eutrophication can also have a negative impact on the reservoir ecology as well as the natural stability of the lake, affecting practically all of the biological communities and their interactions in the water body [11]. Under natural conditions, the rate of this process is very slow and it takes hundreds or thousands of years.
Zooplankton are aquatic species with poor swimming abilities that float in the water column of ocean, seas, or freshwater bodies to travel for long distances [8,12,13]. Zooplanktons are important in the ecosystem because they connect the primary production and the higher levels, monitoring water quality, pollution, and the state of eutrophication [14,15]. In addition, zooplankton play an important role in the natural cycle of carbon and other elements in the sea [16]. On the other hand, zooplankton are the main suitable feeds for larval stages of many fish and shellfish species in marine hatcheries [8,12].
Seasonal zooplankton movement and the factors driving their inconstancy are very sensitive to changes in ecological variables, particularly in shallow, semi-enclosed inlets with densely populated shores, where increasing anthropogenic nutrient input has a serious influence on marine communities [17,18]. Monitoring of water quality is the first step that can lead to management and conservation of aquatic ecosystems. The chemical and physical factors influencing the marine environment include temperature, pH, salinity, dissolved oxygen, biological oxygen demand, chemical oxygen demand, nutrients, reactive phosphate, heavy metal pollutants, and others. These parameters are considered the most limiting factors affecting the survival and growth of aquatic organisms [19,20,21]. Poor water quality could be produced via low aquatic flow, municipal discharges, and wastewater effluents [22]. In this study, Burullus Lake was chosen because of its economic importance in Egypt, based on its various uses and surroundings, such as tourism, fisheries activity, nutrient enrichment, and industrial water sources, among others. Furthermore, any noticeable change in water quality has an impact on the health, structure, and growth of the fish population, so this paper aims to determine most of the parameters related to water quality and identify the major sources of pollution in Burullus Lake, Egypt over the course of three years, from 2017–2019, in conjunction with the study of eutrophication state and an assessment of potential ecological concerns. In addition, it aims to assess the community, occurrence, diversity, and abundance of zooplankton in Burullus Lake. Moreover, the current study will be a useful tool in assisting decision makers and authorities in charge for sustainable marine management and increasing the lake production.
2. Materials and Methods
2.1. Study Area and Sampling
Burullus Lake is located at (30°22′–31°35′ N; 30°33′–31°08′ E) with an area of about 460 km2, length of about 47 km, and width ranges between 6 and 16 km. It has an irregular elongated shape with 0.4–2.5 m depth. The lake receives seawater through a long canal (Boughaz El-Burullus) that connects the lake to the sea. Fresh water enters the lake through 8 drains and 1 freshwater canal. The lake is divided into 3 basins; eastern, middle, and western. It is situated on the eastern port of Rosetta side of the River Nile.
Water samples were collected seasonally for the period from winter 2017 to autumn 2019 in sterile containers and maintained in an icebox on the site. A total of 12 surface water samples were collected from 12 sites representing different environmental habitats. Information of the sampling sites with their latitude and longitude are presented in Table 1 and Figure 1.

Table 1.
Sites description in Burullus Lake.
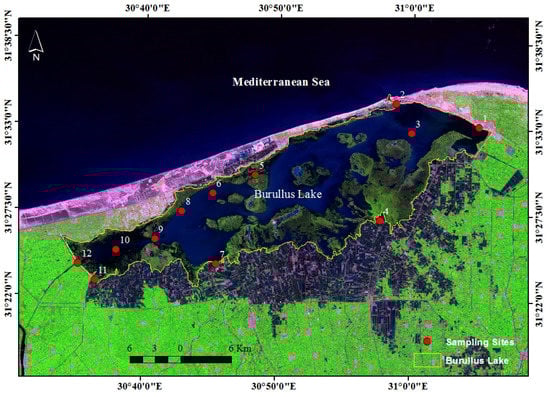
Figure 1.
Location map of the study area.
2.2. Methods
Analyses of the physicochemical parameters of collected water samples were investigated according to the standard methods APHA [23] to estimate various factors, such as biological oxygen demand (BOD), chemical oxygen demand (COD), ammonia-N, nitrate–N, nitrate-N, total nitrogen, dissolved reactive phosphorus, total phosphorus, and chlorophyll-a (Chlo-a).
Water temperature was determined by a mercury thermometer. The concentration of hydrogen ion (pH) was determined by pH meter Model 59003-20 USA. Salinity (‰) was measured by the Cole–Parmer model Check-mate 90 (CORNING) conductivity meter. Dissolved oxygen (DO) was measured by using the modified Winkler method.
2.2.1. Determination of Heavy Metals in Water
Water samples were filtered by 0.45 μm membrane filters. The filtrate water samples were preconcentrated individually with ammonium pyrrolidine di-thiocarbamate (APDC)-methyl isobutyl ketone (MIBK) extraction procedure APHA [23]. The Fe, Cu, Zn, Cr, Ni, Cd, and Pb were determined by atomic absorption spectrometer according to standard methods.
2.2.2. Zooplankton Quantitative Analysis
A horizontal quantitative sample was taken at each site. Zooplankton sampling from Burullus Lake was obtained by filtering 50 L of water through a small standard plankton net (mesh size 55 µm) using a 10 L plastic container. The collected samples were preserved directly with 4% neutral formalin solution in 250 mL polyethylene bottles. The volume of all samples was concentrated to 100 mL, and the whole sample was examined in a Petri dish under a research binocular microscope. For zooplankton count purposes, at any rate, two aliquots (2 mL of well-shaken suspension) were removed from each example utilizing a graduated pipette, set in an including chamber, and the number of individuals of every species was enumerated. The average number of duplicated assessments for each example was assessed, and enumerations were communicated as the number of organisms per cubic meter [11]. The organisms were identified and counted. The total number of zooplankton present in a cubic meter (m3) of water sample was calculated according to the following equation: [24]
where N = total number of zooplankton per cubic meter of filtered water; n = average number of zooplankton in 1 mL of zooplankton sample, v = volume of zooplankton concentrates (ml), V = volume of total water filtered (L).
N= n (v/V) ∗ 1000
2.2.3. Trophic State Index (TSI)
Carlson’s trophic state index (TSI) is used to provide a single assessable index for classifying lakes according to the trophic state of the lake. Recently, Carlson’s index has been usually accepted in the limnological community as a reasonable approach for this problem. It is used as an assessment of the trophic state for a marine body by some water quality factors containing: turbidity or transparency by the concentrations of Secchi disk depth (SD), ortho-phosphate (PO4), and chlorophyll-a (Chlo-a) [25]. The higher values correspond to the increase in fertility, which shows further eutrophic conditions. Each augments in TSI via 10 units relates to a decrease in the Secchi disk (SD) transparency through moiety and augment in the concentration of phosphorus via double. The spatial proration of the TSI data was recorded by the ordinary Kriging methodology [25] as follows:
where Ln is natural logarithm. Po4 is dissolved phosphorus in (µg L−1), Chlo-a is chlorophyll-a, in (µg L−1). The TSI index was calculated using Carlson’s trophic status index as the most important, in addition to the popular TSI process designated for the present research [26]. On the Carlson’s scale, if TSI is <30 characterizes oligotrophic, from 30 to 50 characterizes mesotrophic, from 50 to 70 eutrophic, and >80 hypereutrophic.
CTSI = [TSI (TP) + TSI (CA)]/2
The formulas for calculating TSI values from TP and Chlo-a are:
The formulas for calculating TSI values from TP and Chlo-a are:
a- TSI for Chlorophyll-a (CA) TSI = 6 − [(2.04 − 0.68 (chl − a))/(Ln (2)]
b- TSI for Total phosphorus (TP) TSI = 10[6 − (21.67/po4)/(Ln (2)]
Ecological risks of nitrogen and phosphorus were evaluated by using the following equation of the trophic index (TRIX) [1]:
where SRP, DIN, and Chlo-a are the concentrations of soluble reactive phosphorus, dissolved inorganic nitrogen, and chlorophyll-a, respectively. A percentage of DO is the absolute results of oxygen saturation deviation and is calculated as [100% DO]. Trophic index levels were defined in following Table 2.
TRIX = (LOG (Chlo-a × [% DO] × DIN × SRP + 1.5))/1.2
Table 2.
Trophic index levels.
2.2.4. Water Quality Index (WQI)
The water quality index (WQI) is described as a technique of rating that provides the composite effect of individual water quality factors on the general water quality [23]. The pollution index is a beneficial approach to give information about water quality. It was described as a rating reflecting the compound effect of different water quality factors on the total quality of water [27]. WQI is a mathematical way of summarizing multiple properties into a single value. Moreover, WQI is useful for comparing alterations in water quality across a region, or for measurement changes in water quality over time. In the current study, WQI was calculated using the equation developed by Tiwari and Manzoor [28]. The quality rating (qi) for the water quality factor was obtained by the following relation [28]:
where Si is the standard of the stream water quality, and Vi is the observed data of the factor at a known sampling site according to all parameters. The equation confirms that qi = 100 if the presented data are impartial and equal to its standard data. Therefore, the larger data of qi revealed polluted water. To compute the WQI, the quality rating qi corresponding to factor can be delimiting using Equation (6):
where i = 1. The average water quality index (AWQI) for n factors was computed using the following equation:
where n = number of factors. AWQI was classified into 4 categories: good (0.0–100), medium (100–150), bad (150–200), and very bad (over 200).
qi = 100 × [Vi/Si]
WQI = Σ qi
AWQI = Σqi/n
2.3. Descriptive Statistics
The relationships between different factors were calculated from the correlation matrix formed in IBM SPSS statistics, version 22 programs. The correlation coefficients are considered significant at 0.01 levels (2-tailed) and 95% confidence level (p ≤ 0.05). Statistical for zooplankton was performed by the primer 5 (Plymouth Routines in Multivariate Environmental Research) program to measure both the Shannon index (H), the evenness index (E), species richness (D), and the similarity index.
3. Results and Discussion
3.1. Water Characteristics and Physicochemical Parameters
The physicochemical parameters recorded at the sampled stations from 2017 to 2019 are summarized in Table 3. The temperature value is a crucial parameter for all biological processes [16]. The mean water temperature in the lakes fluctuated between a minimum mean value of 14.47 °C in the winter season of 2018 and a high of 31.23 °C in the summer. In the current study, the maximum value was observed in the year 2017 in the summer season, and the annual average of three years was 21.77 °C. According to EPA [29], the water temperature ranged from 15.1 to 32.6 °C in lake water, which is suitable for fish growth.
Table 3.
The annual averages, minimum, and maximum values of physicochemical parameters.
The pH values can affect the biological activities of microbial metabolites that can influence the further utilization of succeeding metabolic products. In the current study, the values of pH of water samples ranged between 7.32 and 9.36 with an annual mean of 8.09. The highest value was observed in front of El-Kashaa drain in the summer season of 2017, while the lowest result was noted at station 11 in the winter season of 2019.
According to the annual average values, the hot season (summer) recorded a higher pH level than the cold season (winter), which is correlated, mainly, to the increase in CO2 uptake because of the rise in the photosynthetic activity, which leads to high pH values [3,30]. High pH values occur according to the nature of effluent in the lake in addition to the fermentation process, decay of organic matter, and release of organic acids by bacterial activity [28]. These results were in the same ranges stated by Okbah and Hussein [31]. El-Alfy et al. [32] at the Burullus Lake showed that the dominant alkaline pH was >7.0. Additionally, Khairy et al. [33] showed that the average of pH values in Burullus Lake was 8.1.
Salinity has a significant influence on measuring numerous conditions of the aquatic biological processes and the chemistry of natural waters [34,35]. In the present study, salinities exhibited wide variations between 0.62 and 38.9‰, with the maximum value being noted in station 2, in front of El-Boughaz in 2017 in the winter season; whereas, the highest values were related to marine water intrusion along the Boughaz area. Conversely, the lowest value was recorded in front of drain El-Hoks (station 11) in 2018 in the summer season, with an average value of 0.62‰. Low salinity values indicate that the water content in the lake was mainly freshwater due to human activities and the quantity and quality of drainages runoff in the lake. Salinity distribution in the lagoon water reflects a decreased gradient from the east to the west. This gradient depends on the amount of drainage water that comes from the south drains, fresh Nile water from Brimbal Canal at the west, and sea water from the sea outlet at the east, and therefore, marine plankton species are restricted only in the eastern basin and in some cases dominate the community. According to previous references, the salinity of the lagoon increased from year to year, which creates high brackish water conditions especially in the eastern basin (>17 PSU) [36]. El-Shinnawy [37] reported that the high salinity and presence of marine forms in the eastern basin at Burullus Lake could be due to the closure policy of the pumping drain stations, which diminish the water level to be below sea level and permits seawater to enter the lagoon. As well, Nassar and Gharib [38] reported that the average salinity of the Burullus Lake in the year 2013 was 3.6‰.
Dissolved oxygen (DO) is considered as one of the maximum important factors controlling the biota in the aquatic habitat [16]. In the current study, DO values varied from 0.9 to 19.87 mg L−1. The higher value was obtained at the front of El-Kashaa drain in the year 2017 in the summer season, while the lowest value was documented at station 11 in the winter season of 2018, with an annual mean of the study period of 8.83 mg L−1. Under low dissolved oxygen, many marine plants and animals may not survive [39]. The decrease in oxygen supply in the water showed a negative effect on aquatic life. The highest value occurs during the summer season due to the increase in photosynthetic activity during this season, which liberates an important quantity of oxygen to the surrounding water ecosystem, since the photosynthetic method was regarded as the highest source of oxygen in the aquatic environment [33]. Moreover, the quantity of DO in water could be based on the salinity and temperature of the water, as cold liquid can hold more DO than warmish liquid [40]. These results agreed with those achieved by Hereher et al. [41] and Khairy et al. [33] who showed that the average concentration of DO along the Burullus Lake was 7.6 mg L−1.
Biological oxygen demand (BOD) gives data on the biological convertible amount of the content of organic content in marine samples. In the current work, BOD in the lakeshores habitat varied from 1.67 to 176.60 mg L−1, with an average value of 23.63 mg L−1. The maximum value was recorded at station 9 (Abou Amer) in the year 2018 in the autumn season, and the lowest result was showed in facing the El-Boughaz outlet in the spring season of 2019 due to the dilution effect of low organic matter loaded seawater. BOD values of 3 mg L−1 indicate pure water, but values that reach 5 mg L−1 give an indication of doubtful purity of water [42]. The high values of DO may be because of the abundance of plankton, which enhanced water quality with oxygen throughout photosynthesis activity [15,43,44]. In addition, augmented oxygen reduction is essential for oxidation of the organic matter in the aquatic body [45,46]. Younis and Nafea [47] recorded that the concentration of biological oxygen demand in the water samples at Burullus Lake ranged from 11.7 to 36.66 mg L−1.
Chemical oxygen demand (COD) is an important parameter for determining the quality of water and wastewater quality. The COD test is used to monitor water treatment plant efficiency. In the current study, COD showed different values between different habitats. It varied from 30.12 to 423.98 mg L−1. The maximum value was recorded in the year 2018 in the winter season, and the lowest value was recorded in the year 2018 in the autumn season, with an annual average value of 100.39 mg L−1. The permissible limit for COD in marine water is 100 mg L−1 [48]. The average data of COD parameter in all environments were exceeding 40 mg L−1, hence the lake is measured as polluted water as reported by Hassan et al. [45] who stated that water bodies contain COD > 40 mg L−1 are considered as polluted waters; however, those containing COD > 120 mg L−1 are extremely polluted.
Nitrogen and phosphorous are the nutrients most likely to remain deficient in the contaminated environment. Nutrients from anthropogenic pollution can degrade water quality and alter the balance of marine food webs [16,19]. Ammonia (NH4) contents in the water of lakeshores habitat varied from 0.013 to 4.45 mg L−1, which was the maximum value recorded in station 7 in front of downstream 8 and 9 drains in the winter season in the year 2017. The annual average value during the three-year period of the study was 0.613 mg L−1. The minimum values may be related to increases in plankton biomass. The high phytoplankton population in water bodies utilizes a high content of ammonium ions in preference to other inorganic nitrogen [49]. Our results agree with Okbah and Hussien [25], who showed that in the regional variations of NH4, the minimum mean concentration was 3.70 μmol L−1. In contrast, the maximum mean value of NH4 was 12.33 μmol L−1.
Nitrite (NO2) is the noxious via-creation of nitrifying bacteria (nitrospiration) in substrate consuming NH3 or a filter. In the current study, nitrite ranged from 2.98 (summer season) to 419.71 mg L−1 in station 6, in the spring season in the year 2018, with a mean value throughout the three-year stage of this study of 126.93 mg L−1. The highest value of water nitrite is related to human activities of diverse origin mainly from domestic drainage. It also occurs due to the nitrification of free ammonia and a reduction in nitrate to nitrite and use of ammonium fertilizers. Minimum values of nitrite are explicating to these places that are far away from any pollution sources. Nassar and Gharib [38] recorded that the average concentration of NO2 in Burullus Lake was 0.1 µmol L−1.
Nitrate (NO3) is considered as the most stable and predominant inorganic nitrogen form in seawater, in addition to major nutrients for the phytoplankton growth [50]. Nitrate serves as another electron acceptor under anoxic conditions. The present values of nitrate ranged from 0.13 to 1.64 mg L−1. The present study found that the highest value of nitrate was observed in the year 2017 in the winter season in station 6 in the north of the lake. The increase in nitrate values may be attributed to the discharge of sewage wastes and the increase in mineralization of organic matter. Additionally, it is noticed that the high results of nitrate are related to drainage 9 and 8 of the agricultural wastewater that are loaded by high amounts of nitrogenous fertilizers, discharged into these sites. The minimum value was recorded in station 5 in the middle of the lake, which related to the increase in aquatic plants that feed on nutrients and cause depletion in their concentration [51,52,53]. Abd El-Hamid [54] reported that NO3 concentrations in water samples at Burullus Lake ranged from 0.15 to 0.47 mg L−1.
Total nitrogen (TN) concentration in the investigated area showed narrow variation, ranging between a minimum value of 0.52 mg L−1 at sampling site 2 in front of El-Boughaz in the summer season and a maximum value of 10.33 mg L−1 at El-Shakhlouba in the winter season as a result of the effect of industrial, agricultural, and demotic wastes through drains 8 and 9, with an average concentration of 3.40 mg L−1. It is obvious that the water of this lake surrounds a considerable quantity of particulate nitrogen related to organisms and products of their metabolism, besides decay [31]. These results agree with El-Zeiny and El-Kafrawy [55]; they showed that the highest concentrations of TN have been noticed in the parts polluted by fertilizer, run-off animal wastes, and domestic sewage at the southeastern and western part of the lake.
Phosphorous is needed for the formation of cellular enzymatic compounds used in the processes of synthesis and degradation. The most common sources of phosphorous in bacterial sources are K2HPO4, KH2PO4, NaH2PO4, Na2HPO4, or mixtures of them [56]. The current results found that total phosphorus content showed its high values in water in the year 2019, with a high value (60.96 mg L−1) in winter in station 7 and a low value (2105.77 mg L−1) in summer in station 2 at summer season. While the annual average through the three-year time of the study was 607.23 mg L−1. Maximum values are related to industrial effluents and domestic sewage disposal to these sites. In contrast, the minimum values are related to an increase in plankton, which feed on nutrients and cause depletion in its concentration [56]. El-Zeiny and El-Kafrawy [55] documented that the concentration of total phosphorous in Burullus Lake ranged from 4.42 to 53.6 mg L−1.
Chlorophyll-a (Chlo-a) is considered as the main pigment that can be used for the determination of phytoplankton biomass, and it is used as a trophic state indicator and reflected the water quality in the aquacultures ecosystem [57]. In the current study, the Chlo-a contents ranged from 6.25 to 383.81 μg L−1. The average value for three years was 62.93 μg L−1. In general, the higher result was found in station 4 in front of drain 7 in the autumn season, while the lowest value was exhibited at station 2 in the spring season of 2017. The high values of Chlo-a in the investigated area are undoubtedly due to the rich supply of reactive silicate and reactive phosphate; these nutrient salts contribute to the growth of phytoplankton expressed in high levels of Chlo-a, which lead to the eutrophication process in the Lake. Abd El-Hamid et al. [54] reported that chlorophyll-a concentrations in aquatic samples of Burullus Lake ranged from 3.1 to 108 µg L−1.
Generally, it is notable that regarding the Chlo-a and NH4 in Burullus Lake, the minimum results were recorded at the northern part of the lake especially in the next El-Boughaz part due to it receiving water from the sea by the Al-Boughaz outlet. On the other hand, the maximum values of Chlo-a and NH4 were noted at the southern part of Burullus Lake; this may be due to a dense population of phytoplankton as a result of the huge amounts of discharged wastewater that is heavily loaded with nutrient. Moreover, NH4, TN, and total P exhibited high contents in station 7 in front of drains 8 and 9 compared with the sampling sites.
3.2. Heavy Metals
The maximum, minimum, and average concentrations of heavy metal ions in the water samples collected from Burullus Lake are shown in Table 4.
Table 4.
The annual averages, minimum, and maximum values of metals concentrations.
The different heavy metals, including Pb3+, Cr3+, Ni2+, and Cd2+, are toxic ions to living organisms even at quite low concentrations, whereas Zn2+ and Cu2+ are more biologically essential as natural constituents of aquatic ecosystems and, generally, only become toxic at very high concentrations. Heavy metals are normally entering the aquatic environment through erosion of the geological matrix, or due to anthropogenic activities caused by industrial effluents, domestic sewage, and mining wastes [58]. Fe2+ compounds in aquatic environments resulting in Fe2+ precipitate in alkaline and oxidizing conditions [34]. In the current work, the Fe2+ values in the water varied from 6.68 to 220.71 μg L−1. The maximum value was recorded in the year 2018, while the annual average for three years was 49.29 μg L−1. The high concentration of oxygen leads to Fe2+ oxidation and subsequent hydrolysis to form insoluble Fe(OH)3. The maximum concentration of Fe2+ observed in the current study may be due to the industrial wastewater discharged to the coastal area of the Mediterranean Sea. High levels of Fe2+ may decrease the microbial degradation of hydrocarbon in seawater because excessive concentrations break down enzyme action [59]. Eid et al. [60] found that Fe2+ concentrations in Burullus Lake were high during the growing season.
Copper complexation in water is affected by dense phytoplankton blooms [61]. In the current study, the mean values of Cu2+ content in Burullus Lake ranged from 1.64 to 34.56 μg L−1. The maximum value was recorded in the year 2017 in station 7, and the annual average of the three years was 8.81 μg L−1. The maximum concentration of Cu2+ may lead to a negative impact on microbial degradation of hydrocarbon in seawater, which excessively breaks down the action of the enzyme [62]. Nafea and Zyada [63] noticed that the concentration of copper content in the water of Burullus Lake ranged between 19.2 and 35.8 36.9 mg L−1.
Zinc is an essential ion for the growth of marine organisms, and its concentration is affected by plankton communities [59]. The current work observed that Zn2+ showed its high mean value in water (34.56 μg L−1) in station 2 in the year 2017 and the low one (0.12 μg L−1), and the average low value was 11.28 μg L−1. The relatively high Zn2+ level is suggestive of the influence of refuse dump and domestic sewage sources. It could also be attributed to industrial effluents and urbanization. High temperature and low dissolved oxygen concentration lead to an increase in toxicity of Zn2+ [22]. Cr is one of the biochemically active transition metals in the aquatic environment [64]. In the current study, dissolved chromium values in the water of the lake varied from 2.29 to 34.98 μg L−1. The maximum value was recorded in 2019, and the annual average of three years was 10.19 μg L−1. The values in the lake are within the EPA limit (100 μg L−1) [64]. Cr oxidizes easily from trivalent to hexavalent. Cr3+ ion is not toxic, but an essential nutrient, but Cr6+ ion is very toxic and may damage adrenals, livers, and lungs.
Ni2+ contents in water bodies are attributed as results from industrial and urban activities and may accumulate in many types of fishes and macrophytes [65]. In the current study, Ni2+ ions contents ranged between 1.59 and 12.98 μg L−1. The maximum value was observed in the year 2018, and the annual average of three years was 5.44 μg L−1. The higher value of Ni is associated with Fe and Mn, because of the fact that Ni2+ has been scavenged directly from water by hydrous MnO2 [59]. El-Amier et al. [64] showed that nickel concentration along Burullus Lake ranged from 1.26 to 9.37 µg L−1 with an average value of 5.10 µg L−1. Cd2+ is one of the greatest poisonous metals with widespread carcinogenic effects in humans and is considered to be toxic if its concentration exceeds 0.01 mg L−1 both in drinking and irrigation water [9,12]. Cd2+ ions are extremely toxic to fish. Cd2+ contents ranged from 0.04 to 3.35 μg L−1 in front of Burullus east drain in the year 2018 as a result of agricultural wastes, especially agricultural fertilizers, and the annual average was 1.186 μg L−1.
Pb2+ is a very significant ion in the aquatic system [66]. Lead contents in the current study showed its high mean values in water (18.51 μg L−1) at station 7 in the year 2019, while it showed a low mean value of 0.29 μg L−1 with annual averages from three years of 4.87 μg L−1. The highest values of lead can disrupt the health system of phytoplankton, which is an important source of oxygen production in seas. The great level of lead may be attributed to the agricultural and industrial effluents in addition to the spill of fishing boats, which are distributed along the coast of the study area. However, many ships have been painted by a dye containing a high concentration of Pb2+ metal. Pb2+ in high concentrations causes hemorrhages and congestion of the gastrointestinal tract and kidneys of fish [67]. Masoud et al. [68] recorded that the concentration of lead content along Burullus Lake ranged from 4.5 to 10.1 µg L−1.
3.3. Water Quality Indices and Carlson Trophic State Index
The water quality index (WQI) is the most effective way to communicate water quality. The present values of WQI and AWQI were calculated according to standard limits of drinking water parameters of WHO [22] (maximum permissible limits), as presented in Table 5. Average WQI values along Northern Delta Lake Burullus across three years were 80.67, 68.23, and 90.24, for the years 2017, 2018, and 2019, respectively. In general, this means that the waters of Burullus Lake are classified under good water quality (suitable for all uses) during the sampling period at most sites. Contamination levels of the water of Burullus Lake are coved by industrial effluents, untreated domestic and sewage water coming from drainage water. Eutrophication and organic pollutants are still the major pollution problems in aquatic environments. Eutrophication is the method by which aquatic lakes are supplemented with nutrients, increasing the production of rooted aquatic plants and algae to levels considered to be an interference with desirable water uses such as recreation, fish maintenance, and water supply [26].
Table 5.
Water quality indices and average water quality indices of Burullus Lake water.
According to average TSI values during the period from 2017 to spring 2019, the Burullus Lake in this study is classified as hypertrophic, as shown in Table 6. This classification is a result of different human activities, domestic, industrial sewage, and agricultural runoff from the River Nile and their related drainage systems. This causes over-enrichment of nutrients in the water bodies leading to algal blooms. The decaying method of dead alga can produce the exhaustion of dissolved oxygen in the aquatic lake producing an anoxic environment [14].
Table 6.
Carlson’s trophic state index of Burullus Lake during the sampling period.
The water quality index provides a convenient means of summarizing complex water quality data. To recognize the trophic condition of Lake Burullus, the trophic index (TRIX) of water quality was calculated [69]. It is a linear mixture of four state factors correlated to the primary production of oxygen and chlorophyll-a, in addition to nutritional conditions, for example, inorganic phosphors and dissolved inorganic nitrogen [70]. This scale was associated with the four-category scales for water quality state: excellent, very good, good, and fair [17]. According to the seasonal assessment of TRIX and Carlson’s trophic state indices, the sites are categorized at a high eutrophic level in most stations for three years, as shown in Table 7, revealing the existence of anthropogenic pressure. Very high trophic level exposed high nutrient levels, low transparency, and recurrent hypoxia/anoxia in bottom waters [1].
Table 7.
TRIX and Carlson’s trophic state indices.
3.4. Zooplankton Community
Zooplankton serve in the evaluation and productivity of the ecosystem, since they are considered as an essential food for other organisms. The studies of the distributions of zooplankton are beneficial for the monitoring of definite characteristics of the environment such as hydrographic, pollution, eutrophication, and long-term changes, which are signs of environmental disturbances. Therefore, zooplankton studies becoming very important in both marine and freshwater ecosystems [27,28]. In the current study, the comparison among the three years (2017 to 2019 seasons) in the distribution, density, and occurrence of zooplankton was conducted. The zooplankton assemblage was dominated by Rotifera, Copepoda, Protozoa, and Cladocera, respectively, while other groups have rare occurrence so appear and disappear in different years and stations. Over the study period, mean zooplankton density was higher in the western basin (333,579 ind. M−3) in the same trend with Khalil [71], Dumont and El-Shabrawy [72] and Saad et al. [73]. The middle and eastern basins (290,707 and 142,978 ind. M−3, respectively) may be increased for phytoplankton in this area [28], while mean zooplankton density was higher in the 2017 year (301,664 ind. M−3) than the 2019 and 2018 years (238,703 and 226,897 ind. M−3, respectively) as shown in Table 8.
Table 8.
Mean zooplankton in three years at Burullus Lake.
In 2017, a total of 93 taxa from 52 genera and 10 groups were noted for the study, namely, Protozoa (16 taxa); Rotifera (34 taxa), the same number in Saad et al. [73], the dominant species being Brachionus angularis, Brachionus calyciflorus, and Keratella valga; Copepoda (28 taxa), the dominant species being Acanthocyclpos vernalis, Mesocyclops leuckarti, and Thermocyclops crassus; Cladocera (nine taxa), the dominant species being Daphnia hyaline and Daphnia longispina, and taxon for each of Ostacoda, Cirripeda, Nematoda, Annelid, Decapoda, and Velliger of lamellibranchs.
In 2018, a total of 98 taxa from 59 genera and 10 groups with larvae were documented for the study, namely, Protozoa (20 taxa from 16 genera); Rotifera (35 taxa), the dominant species being Brachionus angularis, Brachionus calyciflorus, Keratella valga, and Keratella quadrata; Copepoda (28 taxa), the dominant species being Acanthocyclpos vernalis, Mesocyclops leuckarti, and Thermocyclops crassus; Cladocera (nine taxa), the dominant species being Moina micrura, and taxon for each of Ostacoda, Cirripeda, Nematoda, Annelid, Decapoda, and Velliger of lamellibranchs.
In 2019, a total of 98 taxa from 59 genera and 10 groups with larvae were detailed for the study, namely, Protozoa (20 taxa from 16 genera); Rotifera (35 taxa), the dominant species being Brachionus angularis, Brachionus calyciflorus, Keratella valga, and Keratella quadrata; Copepoda (28 taxa), the dominant species being Acanthocyclpos vernalis, Mesocyclops leuckarti, and Thermocyclops crassus; Cladocera (nine taxa), the dominant species being Moina micrura, and taxon for each of Ostacoda, Cirripeda, Nematoda, Annelid, Decapoda, and Velliger of lamellibranchs. While, Shaltout [74] recorded 90 taxa in Burullus Lake.
The lowest population densities of zooplankton at the sites of the eastern sector are perhaps due to their vertical migration far of sunlight. Many authors concluded that the zooplankton has a high population density in the summer season, but their lowest one happens in winter [14,16,75]. Additionally, it is difficult to distinguish between the effects of most environmental factors on the abundance at most aquatic ecosystems due to inter-relation between them; also, the biological and ecological factors have the same effects of environmental factors on zooplankton abundance inside any aquatic system [12,76]. So, it is not surprising that the standing crop of zooplankton decline in autumn, although environmental conditions are good; this is perhaps due to the great amounts of fish fries that are received at these zones. Heneash et al. [77] reported that Copepoda were related (twice) mainly to domestic activities, while Rotifera were related to aquaculture activities [12,16].
3.5. Biostatistics for Seasonal Zooplankton Population
The data representing the diversity indices of the stations calculated from annual data are presented in Table 9. The total of species, in general, ranged between 16 in the middle sector in 2018 to 29 species in the western sector in 2019. The index of richness was found to be varied between 0.1 in the eastern sector St. 1 in 2018 and 2.14 in the western sector St. 9 in 2019. The results of the Evenness index analysis showed that the value was 1.0 to all stations except for stations number 1 and 3 in the eastern sector in 2018. The values of the Shannon species diversity index varied between 0.67 in the western sector St. 12 in 2018 and 2.50 in the middle sector St. 5 in 2019. Saad et al. [78] reported that the population density of zooplankton was noticeably higher in the western part of the lake, with a major peak of an average of 1,764,333 org. m3. Moreover, regarding seasonal variation, there was a gradual growth in zooplankton standing crop from a minimum of 523,300 org. m3 in autumn until reaching a maximum of 1,353,182 org.m3 in summer, with an overall average of 902,911 org. m3.
Table 9.
Biostatics for seasonal zooplankton in 2017–2019.
3.6. Similarity between Sites
During the year 2017, the data indicated the presence of three clusters (Figure 2A). The first cluster included station 3 in the seaside of El-Burullus Boughaz with relatively low similarity to the other stations being 75% on average. The second cluster included three stations 9,4, and 10 with 92% similarity between them, but a sub-cluster was found between stations 4 and 10 with 97.5% being the highest similarity in this period. However, the third cluster included other stations being 86% (stations 7, 8, 1, 5, 12, 2, 6, and 11). However, this cluster contains three sub-clusters (between stations 7and 8, sub-cluster station 1, sub-cluster between 5, 12, 2, 6, and 11).
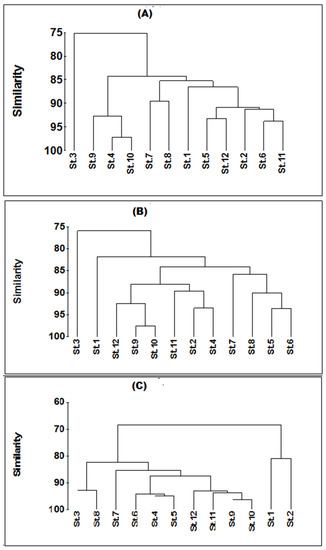
Figure 2.
Dendrogram representing the similarity between Lake Burullus surveyed stations during years (A) 2017, (B) 2018, and (C) 2019.
During the year 2018, the data indicated the presence of four clusters (Figure 2B). The first cluster included station 3 in the seaside of El-Boughaz with relatively low similarity to the other stations being 76% on average. The second cluster included station 1 with 82% on average near to El-Boughaz. The third cluster included six stations with 88% (stations 12, 9, 10, 11, 2, and 4), and the highest similarity was between station 9 and 10 with 98%. The fourth cluster was between stations 7, 8, 5, and 6, but the highest similar one was between 5 and 6 with 94%.
During the year 2019, the data were found to be similar to that obtained in 2018 with slight differences in the arrangement of stations. Four major clusters were documented during this year. The first cluster was El-Boughaz station 3 with 76%. The second cluster included three stations with 81% on average nearby El-Boughaz. The third cluster included some the rest of the stations with four sub-clusters. The first included station 12, which had 93.5%. The second sub-cluster was between stations 9 and 10, with 98% highest similarity. The third sub-cluster included stations 11 with 90% (Figure 2C). The fourth sub-cluster was between stations 2 and 4 with 93% on average. The fourth cluster was between stations 7, 8, 5, and 6, but the highest similarity was between 5 and 6 with 94%.
The changes in the character of the water are also reflected in the zooplankton population. Changes in the zooplankton population may be due to the changes in water conditions, introducing freshwater species and eliminating marine ones. Dumont and El-Shabrawy [72] conclude that, from the early onset of dam construction in the Nile valley, slight changes happened in the zooplankton of Lake Burullus and three other delta lakes.
3.7. Spatial and Temporal Patterns of Zooplankton Community
Zooplankton density was higher in the western basin with value 333,579 ind. m−3 than in the middle and eastern basins (290,707 and 142,978 ind. m−3, respectively); this may be due to the increase in phytoplankton in this area, and it is near freshwater sources as reported by Saad et al. [78].
However, mean zooplankton density was higher in the 2017 year (301,664 ind. m−3) than in 2019 and 2018 (238,703 and 226,897 ind. m−3, respectively). Seasonally, at both eastern and middle sectors, the autumn season recorded the highest mean in 2017 and 2018, but in the 2019 summer season, we found a high abundance of zooplankton. In the western sector, in winter, we registered the highest zooplankton abundance (Figure 3 and Table 10).
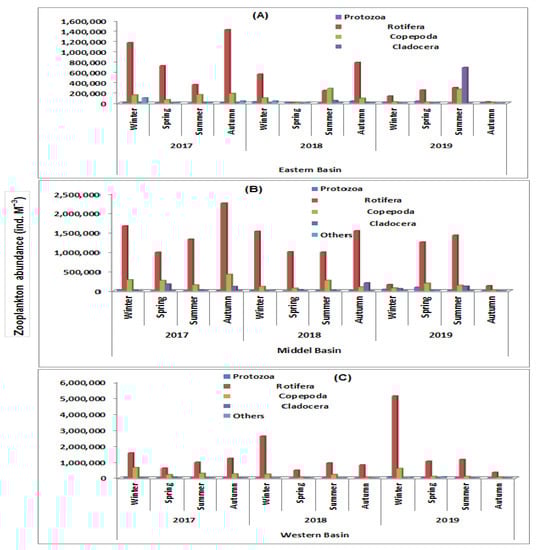
Figure 3.
Seasonal mean of zooplankton densities (ind. m3 ± standard deviation) in Burullus Lake by taxonomic division in various basins (A) eastern basin, (B) middle basin, and (C) western basin.
Table 10.
Seasonal average of zooplankton densities (ind./m3 ± standard deviation) and distribution in Burullus Lake by taxonomic division in various basins.
3.8. The Correlation between Physicochemical Parameters and Zooplankton Groups
Correlation analysis was achieved by Pearson’s correlation coefficient. The correlation matrix was calculated for the water quality parameters. A result of the correlation coefficient was evaluated as follows: 0.0 (no); 0.3–0.5 (low); 0.5–0.7 (medium); 0.7–0.9 (high); 0.9–1 (very high). In the present study, there were high significant correlations between many parameters such as Protozoa with Rotifera, Cirriped larvae, Velliger of lamellibranchs, salinity, and Zn ions (r = 0.925, 0.991, 0.946, 0.998, 0.897, respectively). Rotifera also showed a significant correlation with Copepoda, Cirriped larvae, pH, salinity, Chlo-a, and Pb ions (r = 0.954, 0.984, 0.925, 0.968, 0.961, 0.814, respectively). There is a significant positive correlation between Copepoda and Cirriped larvae, Velliger of lamellibranchs, salinity, and Zn ions (r = 0.992, 0.944, 0.999, 0.894, respectively). Cirriped larvae correlated negatively and some parameters such as salinity, NO3, and Chlor-a (r = −0.995, −0.970, −0.999, respectively). Ostracoda showed a negatively significant correlation with BOD, NH4, NO3, and Fe (r = −0.995, −0.981, −0.970, −0.959, respectively).
Cladocera correlated positively with parameters such as Ostracoda and Annelida with r = 0.97 and 0.94, respectively; while, it correlated negatively with parameters such as BOD, NH4, NO3, and Fe ions (r = −0.041, −0.91, −1.00, −0.999, respectively).
Velliger of lamellibranch showed correlations with DO, NO2, PO4, Cu, and Zn (r = 1, 0.96, −0.88, 0.89, and −0.975, respectively). Salinity has negative correlations with Chlor-a and Cr (r = −1 and −0.925, respectively). The variations in correlation coefficients between salinity and zooplankton groups are due to the difference in species. The variations of mean salinity of the lake water are a result of the amount of drain water entering the lake from the southern part (this part receives freshwater supply from six drains) and seawater inflow to the lake from the northern part through El-Boughaz as well as the amount of evaporation from the external area of the lake. Salinity can be considered as a limiting factor for the abundance and diversity of zooplankton populations in the lake and the reverse relation between salinity and zooplankton. The pH concentration lies on the alkaline side, the minimum value recorded in the western sector showing an inverse relation to zooplankton. El-Enany [79] stated that Protozoa, Cladocera, and Copepoda were abundant in the stations characterized by high TS, EC, PO4, and Ca. The high numbers of drains from the River Nile, which carries high amounts of nutrients and salts, lead to the eutrophication of water.
3.9. Comparison of Burullus Lake with Other lakes
In current study, the physicochemical parameter values obtained from the Burullus Lake, in comparison to the most similar lakes in Egypt and the Mediterranean area, are presented in Table 11.
Table 11.
Comparison between the physicochemical parameters values of Burullus Lake and the most similar lakes in Egypt and the Mediterranean area.
4. Conclusions
Lake Burullus is a very important lake in Egypt, due to its dimensions and economic activities. Burullus Lake is suffering from a high level of aquatic plants, expansion in fish farming, fishing, growing of human activities, and agricultural drainage effluents. In the current study, the properties of water quality, eutrophication, and zooplankton community of Burullus Lake were estimated based on three years (2017/2019) of seasonal monitoring at 12 stations. It could be concluded that water quality parameters showed wide variations, due to the discharge of drainage water from various pollution sources through different times and locations. The increase in pollution level may be due to the inflow of untreated water from industries and households around the drains of the lake, while the recorded increase in the eutrophication level may be attributed to the inflow of effluent of agricultural water with high nutrient levels. The heavy metal distribution in the lake depends on some factors, as characteristics, amounts, and type of input water. The current work is an attempt to examine the applicability of Carlson’s indices and trophic state indices for ranging the eutrophication case of Burullus Lake in concert with a numeral of physicochemical descriptors, as described previously. On the other hand, zooplankton species in Burullus Lake preferred a freshwater habitat than a marine habitat. The current study concluded that zooplankton are composed of four main groups: Rotifer, Copepod, Protozoa, and Cladocera, in addition to rare groups, namely, Ostracoda, Nematoda, Annelid, Cirripeda, and Decapoda. During the period from 2017 to 2019, it observed about 98 zooplankton species in addition to six larval stages. Assessment of correlation matrix was carried out to check the significant relationship between biological and physicochemical factors. It is highly recommended that drainage water should be treated before reaching the lake, removing unwanted plants from the water bodies and providing decision-makers with data.
Author Contributions
Conceptualization, A.E.A., A.M.M.H., A.M.S. and M.A.; methodology, A.E.A., A.M.M.H., A.M.S. and A.T.M.; software, A.E.A., A.M.M.H., M.A. and A.G.; formal analysis, A.E.A. and A.T.M.; investigation, A.M.M.H. and A.T.M.; resources, A.M.S., W.F.A. and A.G.; data curation, A.M.S. and M.A.; writing—original draft preparation, A.E.A., A.M.M.H., W.F.A. and A.G.; writing—review and editing, A.E.A, M.A. and A.T.M.; visualization, A.E.A., A.T.M., W.F.A. and A.G.; supervision, A.M.M.H., A.M.S. and M.A.; project administration, A.E.A.; funding acquisition, A.T.M. and W.F.A. All authors have read and agreed to the published version of the manuscript.
Funding
This research was funded by Taif University Researchers Supporting Project number TURSP-2020/39, Taif University, Taif, Saudi Arabia.
Institutional Review Board Statement
Not applicable.
Informed Consent Statement
Not applicable.
Data Availability Statement
The data presented in this study are available in article.
Acknowledgments
The authors gratefully acknowledge Taif University Researchers Supporting Project number TURSP-2020/39, Taif University, Taif, Saudi Arabia.
Conflicts of Interest
The authors declare no conflict of interest.
References
- Peng, S. The Nutrient, Total Petroleum Hydrocarbon and Heavy Metal Contents in the Seawater of Bohai Bay, China: Temporal—Spatial Variations, Sources, Pollution Statuses, and Ecological Risks. Mar. Pollut. Bull. 2015, 95, 445–451. [Google Scholar] [CrossRef] [PubMed]
- Shaltout, K.H.; Al-Sodany, Y.M. Vegetation Analysis of Burullus Wetland: A Ramsar site in Egypt. Wetl. Ecol. Manag. 2008, 16, 421–439. [Google Scholar] [CrossRef]
- Goher 1, M.A.S.; Saber, M.R.; Mohamed, R.G.; Hafez, A.K.; Mautner, F.A. Synthesis, Spectra, Crystal Structure and Thermal Properties of a Polymeric 1-D Cobalt (II) Cyanato Complex with Hexamethylenetetramine. J. Coord. Chem. 2009, 62, 234–241. [Google Scholar] [CrossRef]
- Shaltout, A.M.; Kim, J.; Boltasseva, A.; Shalaev, V.M.; Kildishev, A. V Ultrathin and Multicolour Optical Cavities with Embedded Metasurfaces. Nat. Commun. 2018, 9, 1–7. [Google Scholar] [CrossRef] [PubMed]
- Mohsen, A.; Elshemy, M.; Zeidan, B.A. Change Detection for Lake Burullus, Egypt Using Remote Sensing and GIS Approaches. Environ. Sci. Pollut. Res. 2018, 25, 30763–30771. [Google Scholar] [CrossRef]
- Shaltout, K.H.; Khalil, M.T.; Al-Sodany, Y.M. Lake Burullus: Burullus Protected Area; Publication of National Biodiversity Unit, Egyptian Environmental Affairs Agency (EEAA): Cairo, Egypt, 2005.
- Aliaume, C.; Do Chi, T.; Viaroli, P.; Zaldívar, J.M. Coastal Lagoons of Southern Europe: Recent Changes and Future Scenarios. Transit. Waters Monogr. 2007, 1, 1–12. [Google Scholar]
- Abo-Taleb, H.A.; Zeina, A.F.; Ashour, M.; Mabrouk, M.M.; Sallam, A.E.; El-Feky, M.M. Isolation and Cultivation of the Freshwater Amphipod Gammarus Pulex (Linnaeus, 1758), with an Evaluation of Its Chemical and Nutritional Content. Egypt. J. Aquat. Biol. Fish. 2020, 24, 69–82. [Google Scholar] [CrossRef]
- Ghoneim, M.M.; El-Desoky, H.S.; El-Moselhy, K.M.; Amer, A.; Abou El-Naga, E.H.; Mohamedein, L.I.; Al-Prol, A.E. Removal of Cadmium from Aqueous Solution Using Marine Green Algae, Ulva Lactuca. Egypt. J. Aquat. Res. 2014, 40, 235–242. [Google Scholar] [CrossRef]
- Al Prol, A.E. Study of Environmental Concerns of Dyes and Recent Textile Effluents Treatment Technology: A Review. Asian J. Fish. Aquat. Res. 2019, 3, 1–18. [Google Scholar] [CrossRef]
- ALProl, A.E.A.; Moselhy, K.M.E.; Abdel, M.; Amer, A.; Abdel-moneim, M. Bioremediation of Reactive Blue 19 and Reactive Black 5 from Aqueous Solution by using Fungi Aspergillus niger. Int. J. Curr. Microbiol. App. Sci. 2017, 6, 1676–1686. [Google Scholar]
- Ashour, M.; Abo-Taleb, H.; Abou-Mahmoud, M.; El-Feky, M.M.M. Effect of the Integration between Plankton Natural Productivity and Environmental Assessment of Irrigation Water, El-Mahmoudia Canal, on Aquaculture Potential of Oreochromis Niloticus. Turk. J. Fish. Aquat. Sci. 2018, 18. [Google Scholar] [CrossRef]
- Heneash, A.M.M.; Ashour, M.; Matar, M. Effect of Un-Live Microalgal Diet, Nannochloropsis Oculata and Arthrospira (Spirulina) Platensis, Comparing to Yeast on Population of Rotifer, Brachionus Plicatilis. Mediterr. Aquac. J. 2015, 63–70. [Google Scholar] [CrossRef]
- Heneash, A.M.M.; Alprol, A.E. Monitoring of Water Quality and Zooplankton Community in Presence of Different Dietary Levels of Commercial Wood Charcoal of Red Tilapia. J. Aquac. Res. Dev. 2020, 11, 1–6. [Google Scholar] [CrossRef]
- Magouz, F.I.; Essa, M.A.; Matter, M.; Mansour, A.T.; Alkafafy, M.; Ashour, M. Population Dynamics, Fecundity and Fatty Acid Composition of Oithona Nana (Cyclopoida, Copepoda), Fed on Different Diets. Animals 2021, 11, 1188. [Google Scholar] [CrossRef] [PubMed]
- Abo-Taleb, H.; Ashour, M.; El-Shafei, A.; Alataway, A.; Maaty, M.M. Biodiversity of Calanoida Copepoda in Different Habitats of the North-Western Red Sea (Hurghada Shelf). Water 2020, 12, 656. [Google Scholar] [CrossRef]
- Marcus, N. An Overview of the Impacts of Eutrophication and Chemical Pollutants on Copepods of the Coastal Zone. Zool. Stud. 2004, 43, 211–217. [Google Scholar]
- Abualnaja, K.; Alprol, A.; Ashour, M.; Mansour, A. Influencing Multi-Walled Carbon Nanotubes for the Removal of Ismate Violet 2R Dye from Wastewater: Isotherm, Kinetics, and Thermodynamic Studies. Appl. Sci. 2021, 11, 4786. [Google Scholar] [CrossRef]
- Ashour, M.; Kamel, A. Enhance Growth and Biochemical Composition of Nannochloropsis Oceanica, Cultured under Nutrient Limitation, Using Commercial Agricultural Fertilizers. J. Mar. Sci. Res. Dev. 2017, 7. [Google Scholar] [CrossRef]
- Ashour, M.; Mabrouk, M.M.; Ayoub, H.F.; El-Feky, M.M.M.; Sharawy, Z.Z.; Hoseinifar, S.H.; Rossi, W.; Van Doan, H.; El-Haroun, E.; Goda, A.M.-S. Effect of Dietary Seaweed Extract Supplementation on Growth, Feed Utilization, Hematological Indices, and Non-Specific Immunity of Nile Tilapia, Oreochromis Niloticus Challenged with Aeromonas Hydrophila. J. Appl. Phycol. 2020, 32, 3467–3479. [Google Scholar] [CrossRef]
- Abbas, E.M.; Ali, F.S.; Desouky, M.G.; Ashour, M.; El-Shafei, A.; Maaty, M.M.; Sharawy, Z.Z. Novel Comprehensive Molecular and Ecological Study Introducing Coastal Mud Shrimp (Solenocera Crassicornis) Recorded at the Gulf of Suez, Egypt. J. Mar. Sci. Eng. 2021, 9, 9. [Google Scholar] [CrossRef]
- Abualnaja, K.M.; Alprol, A.E.; Abu-Saied, M.A.; Mansour, A.T.; Ashour, M. Studying the Adsorptive Behavior of Poly(Acrylonitrile-co-Styrene) and Carbon Nanotubes (Nanocomposites) Impregnated with Adsorbent Materials towards Methyl Orange Dye. Nanomaterials 2021, 11, 1144. [Google Scholar] [CrossRef] [PubMed]
- Federation, W.E.; Association, A.P.H. Standard Methods for the Examination of Water and Wastewater, 21st ed.; American Public Health Association (APHA): Washington, DC, USA, 2005. [Google Scholar]
- Santhanam, R.; Srinivasan, A. A Manual of Marine Zooplankton; Oxford & IBH Publishing Company: Devon, UK, 1994; ISBN 8120409124. [Google Scholar]
- El Zokm, M.; Gehan, R.; Tadros, A.; Okbah, M.; Ibrahim, G. Eutrophication Assessment Using TRIX and Carlson’s Indices in Lake Mariout Water, Egypt. Egypt. J. Aquat. Biol. Fish. 2018, 22, 331–349. [Google Scholar] [CrossRef]
- El-Hamid, H.T.A.; Hegazy, T.A.; Ibrahim, M.S.; Khalid, M. Assessment of Water Quality of the Northern Delta Lakes, Egypt. J. Environ. Sci. 2017, 46, 21–34. [Google Scholar]
- El-Feky, M.M.; Alprol, A.E.; Heneash, A.M.M.; Abo-Taleb, H.; Omer, M. Evaluation of Water Quality and Plankton for Mahmoudia Canal in Northern West of Egypt. Egypt. J. Aquat. Biol. Fish. 2019, 22, 461–474. [Google Scholar] [CrossRef][Green Version]
- Tiwari, J.N.; Manzoor, A. Water Quality Index for Indian Rivers. In Ecology and Pollution of Indian Rivers; Aashish Publishing House: New Delhi, India, 1988; pp. 271–286. [Google Scholar]
- EPA, U. National Recommended Water Quality Criteria EPA-822-R-02-047. Off. Sci. Technol. 2002, 4304T, 21. [Google Scholar]
- Goher, M.A.S.; Mautner, F.A.; Abu-Youssef, M.A.M.; Hafez, A.K.; Badr, A.M.-A. Synthesis and Crystal Structure of Three New 2D Polymeric Cadmium (II) Complexes of Some Pyridine Derivatives with Different Cadmium (II)–Azide Topologies. J. Chem. Soc. Dalton Trans. 2002, 3309–3312. [Google Scholar] [CrossRef]
- Okbah, M.A.; Hussein, N.R. Impact of environmental conditions on the phytoplankton structure in Mediterranean Sea Lagoon, Lake Burullus, Egypt. Water Air Soil Pollut. 2006, 172, 129–150. [Google Scholar] [CrossRef]
- El-Alfy, M.A.; Darwish, D.H.; El-Amier, Y.A. Land Use Land Cover of the Burullus Lake Shoreline (Egypt) and Health Risk Assessment of Metal-Contaminated Sediments. Hum. Ecol. Risk Assess. Int. J. 2020, 1–23. [Google Scholar] [CrossRef]
- Khairy, H.M.; Shaltout, K.H.; El-sheekh, M.M.; Eassa, D.I. Algal Diversity of the Mediterranean Lakes in Egypt. In Proceedings of the International Conference on Advances in Agricultural, Biological & Environmental Sciences (AABES-2015), London, UK, 22–23 July 2015; pp. 22–134. [Google Scholar] [CrossRef]
- Dunlop, H.M.; Gardner, D. Chemical and hydrographic observations in the bristol channel during April and June 1971. J. Mar. Biol. Assoc. UK 1973, 53, 299–319. [Google Scholar]
- Magouz, F.I.; Essa, M.A.; Matter, M.; Mansour, A.T.; Gaber, A.; Ashour, M. Effect of Different Salinity Levels on Copepoda (Oithona Nana) Population Dynamics, Production, and Composition. Diversity 2021, 30, 1–12. [Google Scholar]
- Zalat, A.; Vildary, S.S. Distribution of Diatom Assemblages and Their Relationship to Environmental Variables in the Surface Sediments of Three Northern Egyptian Lakes. J. Paleolimnol. 2005, 34, 159–174. [Google Scholar] [CrossRef]
- El-Shinnawy, I.A.E. Water Budget Estimate for Environmental Management at Al-Burullus Lake, Egypt. In Proceedings of the 4th International Conference and Exhibition for Environmental Technologies Environment, Cairo, Egypt, 24–28 November 2003. [Google Scholar]
- Nassar, M.Z.A.; Gharib, S.M. Spatial and Temporal Patterns of Phytoplankton Composition in Burullus Lagoon, Southern Mediterranean Coast, Egypt. Egypt. J. Aquat. Res. 2014, 40, 133–142. [Google Scholar] [CrossRef]
- Sharawy, Z.Z.; Ashour, M.; Abbas, E.; Ashry, O.; Helal, M.; Nazmi, H.; Kelany, M.; Kamel, A.; Hassaan, M.; Rossi, W.; et al. Effects of Dietary Marine Microalgae, Tetraselmis Suecica, on Production, Gene Expression, Protein Markers and Bacterial Count of Pacific White Shrimp Litopenaeus Vannamei. Aquac. Res. 2020, 51, 2216–2228. [Google Scholar] [CrossRef]
- Alnagaawy, A.M.; Sherif, M.H.; Assy, M.G.; Shehata, A.S. Impact of Industrial Pollutants on Some Water Quality Parameters of Edku, Mariout Lakes and the Nile River. Int. J. Environ. 2018, 1, 1–15. [Google Scholar]
- Hereher, M.; Salem, M.; Darwish, D. Mapping Water Quality of Burullus Lagoon Using Remote Sensing and Geographic Information System. J. Am. Sci. 2010, 7, 138–143. [Google Scholar]
- Weber, T.J. Wastewater Treatment. Met. Finish. 2002, 100, 781–797. [Google Scholar] [CrossRef]
- El-Shenody, R.A.; Ashour, M.; Ghobara, M.M.E. Evaluating the Chemical Composition and Antioxidant Activity of Three Egyptian Seaweeds: Dictyota Dichotoma, Turbinaria Decurrens, and Laurencia Obtusa. Braz. J. Food Technol. 2019, 22. [Google Scholar] [CrossRef]
- Elshobary, M.E.; El-Shenody, R.A.; Ashour, M.; Zabed, H.M.; Qi, X. Antimicrobial and Antioxidant Characterization of Bioactive Components from Chlorococcum Minutum. Food Biosci. 2020, 35, 100567. [Google Scholar] [CrossRef]
- Hassan, M.; Khalil, T.; El-halim, A.; Saad, A.; Gamal, M.E.S. Zooplankton Community Structure of Lake Edku, Egypt. Egypt. J. Aquat. Biol. Fish. 2017, 21, 55–77. [Google Scholar] [CrossRef]
- Magouz, F.I.; Matter, M.; Essa, M.A.; El-shafei, A.; Tageldein, A.; Mahmoud, S.F.; Ashour, M. Effect of Extended Feeding with Live Copepods, Oithona Nana, and Artemia Franciscana on the Growth Performance, Intestine Histolo- Gy, and Economic Viability of European Seabass ( Dicentrarchus Labrax ) Postlarvae. Fresenius Environ. Bull. 2021, 30, 7106–7116. [Google Scholar]
- Younis, A.M.; Nafea, E.M. Impact of Environmental Conditions on the Biodiversity of Mediterranean Sea Lagoon, Burullus Protected Area, Egypt. World Appl. Sci. J. 2012, 19, 1423–1430. [Google Scholar] [CrossRef]
- Tayel, F.T.; Radwan, A.E.-A.M.; Morsy, A.M.; Abd El-Halim, A.M.; Al-Prol, A.E.; El-Alfy, M.A.; Basiony, A.I. Relation of Some Hydrochemicals with Hydrogen Sulphide Levels in Sediments of Lake Burullus, Egypt. Asian J. Geogr. Res. 2018, 1–11. [Google Scholar] [CrossRef]
- Ashour, M. Current and Future Perspectives of Microalgae-Aquaculture in Egypt, Case Study: SIMAF-Prototype-Project. Egypt. J. Anim. Prod. 2020, 57, 163–170. [Google Scholar] [CrossRef]
- Ewins, B.P.A.; Spencer, C.P. The annual cycle of nutrients in the menai straits. J. Mar. Biol. Assoc. UK 1967, 47, 533–542. [Google Scholar] [CrossRef]
- Ashour, M.; El-Shafei, A.A.; Khairy, H.M.; Abd-Elkader, D.Y.; Mattar, M.A.; Alataway, A.; Hassan, S.M. Effect of Pterocladia Capillacea Seaweed Extracts on Growth Parameters and Biochemical Constituents of Jew’s Mallow. Agronomy 2020, 10, 420. [Google Scholar] [CrossRef]
- Hassan, S.H.; Ashour, M.; Soliman, A.A.F.; Hassanien, H.A.; Alsanie, W.F.; Gaber, A.; Elshobary, M.E. The Potential of a New Commercial Seaweed Extract in Stimulating Morphoagronomic and Bioactive Properties of Eruca Vesicaria (L.) Cav. Sustianability 2021, 11, 1–21. [Google Scholar]
- Hassan, S.M.; Ashour, M.; Sakai, N.; Zhang, L.; Hassanien, H.A. Impact of Seaweed Liquid Extract Biostimulant on Growth, Yield, and Chemical Composition of Cucumber (Cucumis Sativus). Agriculture 2021, 11, 320. [Google Scholar] [CrossRef]
- Abd El-Hamid, H.T. Detection and Remediation of Hydrocarbon Wastes along the Coastline from Damietta to Port Said. Ph.D. Thesis, Faculty of Science, Damietta University, Damietta, Egypt, 2015; pp. 4, 255. [Google Scholar]
- El-Zeiny, A.; El-Kafrawy, S. Assessment of Water Pollution Induced by Human Activities in Burullus Lake Using Landsat 8 Operational Land Imager and GIS. Egypt. J. Remote. Sens. Space Sci. 2017, 20, S49–S56. [Google Scholar] [CrossRef]
- Lawson, E.O. Physico-Chemical Parameters and Heavy Metal Contents of Water from the Mangrove Swamps of Lagos Lagoon, Lagos, Nigeria, Physicngrove Swamps of Lagos Lagoon, Lagos, Nigeria. Adv. Biol. Res. 2011, 5, 8–21. [Google Scholar]
- El-otify, A.M. Evaluation of the Physicochemical and Chlorophyll- a Conditions of a Subtropical Aquaculture in Lake Nasser Area, Egypt. Beni-Suef Univ. J. Basic Appl. Sci. 2015, 3, 1–10. [Google Scholar] [CrossRef]
- Bahnasawy, M.; Khidr, A.; Dheina, N. Assessment of Heavy Metal Concentrations in Water, Plankton, and Fish of Lake Manzala, Egypt. Turk. J. Zool. 2011, 35, 271–280. [Google Scholar] [CrossRef]
- Masoud, M.S.; Mohamed, E.A. Distribution of Some Metal Concentration in Water and Sediments of Lake. Afr. J. Environ. Sci. Technol. 2005, 4, 280–298. [Google Scholar]
- Eid, E.M.; Shaltout, K.H.; El-sheikh, M.A.; Asaeda, T. Seasonal Courses of Nutrients and Heavy Metals in Water, Sediment and above- and below-Ground Typha Domingensis Biomass in Lake Burullus (Egypt): Perspectives for Phytoremediation. Flora 2012, 207, 783–794. [Google Scholar] [CrossRef]
- Chemistry, S.M. Analytical Fractionation of Dissolved Copper, Lead and Cadmium in Coastal Seawater. Mar. Chem. 1981, 10, 487–503. [Google Scholar]
- Prol, A.; Azzem, M.; Amer, A.; El-Metwally, M.; El-Hamid, H.; El–Moselhy, K. Adsorption of Cadmium (II) Ions (II) from Aqueous Solution onto Mango Leaves. Asian J. Phys. Chem. Sci. 2017, 2, 1–11. [Google Scholar] [CrossRef]
- Nafea, E.M.A.; Zyada, M.A. Biomonitoring of Heavy Metals Pollution in Lake Burrullas, Northern Delta, Egypt. Afr. J. Environ. Sci. Technol. 2015, 9, 1–7. [Google Scholar]
- El-amier, Y.A.; El-alfy, M.A.; Nofal, M.M. Macrophytes potential for removal of heavy metals from aquatic ecosystem, Egypt: Using metal accumulation index (MAI). Plant Arch. 2018, 18, 2131–2144. [Google Scholar]
- Hayward, J. Studies on the Growth of Rhaeodactylum. V. The relationship to iron, manganese and zinc. J. Mar. Biol. Assoc. UK 1969, 49, 439–446. [Google Scholar] [CrossRef]
- Al Prol, A.E.; El-Metwally, M.E.A.; Amer, A. Sargassum Latifolium as Eco-Friendly Materials for Treatment of Toxic Nickel (II) and Lead (II) Ions from Aqueous Solution. Egypt. J. Aquat. Biol. Fish. 2019, 23, 285–299. [Google Scholar] [CrossRef]
- Abdelhamid, A.M.; El-Ayouty, S.A. Effect on Catfish (Clarias Lazera) Composition of Ingestion Rearing Water Contaminated with Lead or Aluminum Compour. Arch. Anim. Nutr. Berlin 1991, 41, 757–763. [Google Scholar] [CrossRef] [PubMed]
- Masoud, M.S.; Fahmy, M.; Ali, A.; Mohamed, E.A. Heavy metal speciation and their accumulation in sediments of Lake Burullus, Egypt. Afr. J. Environ. Sci. Technol. 2011, 5, 280–298. [Google Scholar]
- Carlson, R.E. A Trophic State Index for Lakes. Limnol. Oceanogr. 1977, 22, 263–269. [Google Scholar] [CrossRef]
- Manisa, L.M.; Altinda, A.; Ergönül, M.B. Seasonal Fluctuations in the Zooplankton Composition of a Eutrophic Lake: Lake Marmara (Manisa, Turkey). Turk. J. Zool. 2007, 31, 121–126. [Google Scholar]
- Khalil, M.T. Plankton and Primary Productivity of Lake Manzala, Egypt. Hydrobiologia 1990, 196, 201–207. [Google Scholar] [CrossRef]
- Dumont, H.J.; El-Shabrawy, G.M. Lake Borullus of the Nile Delta: A Short History and an Uncertain Future. AMBIO 2007, 36, 677–682. [Google Scholar] [CrossRef]
- Saad, A.; Khalil, M.; El-Shabrawy, G.; Bcdir, T. Ecological studies on zoo plankton community of lake burullus, Egypt. Egypt. J. Aquat. Biol. Fish 2006, 10, 21–43. [Google Scholar] [CrossRef]
- Shaltout, K.H. Towards mainstreaming lake burullus biodiversity, North Coast, Assiut Univ. Ctry. Egypt 2010, 13, 71–87. [Google Scholar]
- El-Sherbiny, M.; Aamer, M.; Gab-Alla, A. Effect of Dredging and Dumping Operations on Zooplankton Community During the Construction of East Branch Harbor, Port Said, Eastern Mediterranean, Egypt. Catrina Int. J. Environ. Sci. 2006, 1, 53–62. [Google Scholar]
- Harley, C.D.G.; Hughes, A.R.; Hultgren, K.M.; Miner, B.G.; Sorte, C.J.B.; Thornber, C.S.; Rodriguez, L.F.; Tomanek, L.; Williams, S.L. The Impacts of Climate Change in Coastal Marine Systems. Ecol. Lett. 2006, 9, 228–241. [Google Scholar] [CrossRef]
- Heneash, A.M.; Alprol, A.E.; Abd El-Hamid, H.T.; Khater, M.; El Damhogy, K.A. Assessment of Water Pollution Induced by Anthropogenic Activities on Zooplankton Community in Mariout Lake Using Statistical Simulation. Arab. J. Geosci. 2021, 14, 1–21. [Google Scholar] [CrossRef]
- Saad, J.F.; Unrein, F.; Tribelli, P.M.; López, N.; Izaguirre, I. Influence of Lake Trophic Conditions on the Dominant Mixotrophic Algal Assemblages. J. Plankton Res. 2016, 38, 818–829. [Google Scholar] [CrossRef]
- El-Enany, H.R. Ecological Studies on Planktonic and Epiphytic Microinvertebrates in Lake Nasser. Ph.D. Thesis, Benha University, Banha, Egypt, May 2009. [Google Scholar]
- Jenhani, A.B.R.; Fathalli, A.; Djemali, I.; Changeux, T.; Romdhane, M.S. Tunisian Reservoirs: Diagnosis and Biological Potentialities. Aquat. Living Resour. 2019, 32, 17. [Google Scholar] [CrossRef]
- Bozkurt, A.; Tepe, Y. Zooplankton Composition and Water Quality of Lake Gölbaşi (Hatay-Turkey). Fresenius Environ. Bull. 2011, 20, 166–174. [Google Scholar]


Publisher’s Note: MDPI stays neutral with regard to jurisdictional claims in published maps and institutional affiliations. |
© 2021 by the authors. Licensee MDPI, Basel, Switzerland. This article is an open access article distributed under the terms and conditions of the Creative Commons Attribution (CC BY) license (https://creativecommons.org/licenses/by/4.0/).