Article

Assessing Assemblage Composition of Reproductively Mature Resource Fishes at a Community Based Subsistence Fishing Area (CBSFA)

by
Rebecca M. Weible
1,2,*,
Ku‘ulei S. Rodgers
1,2,
Alan M. Friedlander
2,3 and
Cynthia L. Hunter
1
1
School of Life Sciences, University of Hawai‘i at Mānoa, Honolulu, HI 96822, USA
2
Hawai‘i Institute of Marine Biology, University of Hawai‘i at Mānoa, Kāne‘ohe, HI 96744, USA
3
National Geographic Pristine Seas, Washington, DC 20036, USA
*
Author to whom correspondence should be addressed.
Diversity 2021, 13(3), 114; https://doi.org/10.3390/d13030114
Submission received: 31 January 2021 / Revised: 26 February 2021 / Accepted: 26 February 2021 / Published: 7 March 2021
(This article belongs to the Special Issue Coral Reef Ecology and Biodiversity)

Abstract

:
Nearshore fisheries in Hawai‘i have been steadily decreasing for over a century. Marine protected areas (MPAs) have been utilized as a method to both conserve biodiversity and enhance fisheries. The composition of resource fishes within and directly outside of the recently established Hā‘ena Community Based Subsistence Fishing Area (CBSFA) on the island of Kaua‘i were assessed to determine temporal and spatial patterns in assemblage structure. In situ visual surveys of fishes, invertebrates, and benthos were conducted using a stratified random sampling design to evaluate the efficacy of the MPA between 2016 and 2020. L50 values—defined as the size at which half of the individuals in a population have reached reproductive maturity—were used as proxies for identifying reproductively mature resource fishes both inside and outside the CBSFA. Surveys between 2016 and 2020 did not indicate strong temporal or spatial changes in overall resource fish assemblage structure; however, some species-specific changes were evident. Although overall resource species diversity and richness were significantly higher by 2020 inside the MPA boundaries, there is currently no strong evidence for a reserve effect.

1. Introduction

Marine protected areas (MPAs) have been increasingly employed as an effective method for managing overfished nearshore coral reef ecosystems [1,2]. MPAs have been shown to increase fish biomass, diversity, and reproductive output within the protected area, as well as enhance adjacent areas via adult and larval spillover [1,3]. However, MPAs are not a panacea for overfished stocks, poor habitat quality, or ineffective management or enforcement [1,3,4,5,6]. The effectiveness of a MPA is often reliant on careful consideration of key features, such as size, shape, configuration, larval connectivity and recruitment, life-history traits, habitat types, enforcement, and community support [3,5,6,7].
Nearshore fisheries declines in the State of Hawai‘i over the last century have paved the way for implementation of some level of protection in ~17% of state waters, yet only 3.4% of nearshore waters are considered to be highly protected [2]. It is within these few, highly protected areas where resource fish biomass is substantially greater compared to lower or non-protected areas [8]. Additionally, with such a wide variety of MPA features, restrictions, and enforcement comes varying degrees of success. Contrasting examples include the successful recovery of herbivorous species in the Kahekili Herbivore Fisheries Management Area (KHFMA) on Maui [7] and the rapid depletion of reefs upon the opening of the Waikīkī-Diamond Head Shoreline Fisheries Management Area on O‘ahu where restrictions to fishing are implemented on a yearly rotational basis [4]. In general, most of the MPAs in Hawai‘i follow contemporary styles of management, with the exception of a few community-based subsistence fishing areas (CBSFAs).
Communities in Hawai‘i have increasingly explored the development of co-management partnerships between state resource management agencies and community groups to incorporate aspects of traditional ecological knowledge and customary marine tenure and to devolve some management authority to local scales where it was traditionally based [9,10]. Despite efforts to re-establish local marine stewardship, CBSFAs are located in only three communities: Mo‘omomi on Moloka‘i, Miloli‘i on Hawai‘i, and Hā‘ena on Kaua‘i. In 2015, the Hā‘ena CBSFA became the first of its kind to officially institute and enforce rules and regulations, which were drafted and finalized through collaboration from the Hā‘ena community. The following year, the Hawai‘i Department of Land and Natural Resources (DLNR), the Division of Aquatic Resources (DAR), and the Division of Boating and Ocean Recreation (DOBOR), partnered with the University of Hawai‘i, Hawai‘i Institute of Marine Biology (UHHIMB), Coral Reef Ecology Lab (CREL), and the Coral Reef Assessment and Monitoring Program (CRAMP) to conduct surveys at Hā‘ena CBSFA to determine the efficacy of the rule changes over time [11]. Baseline surveys were conducted by the University of Hawai‘i Fisheries Ecology Research Laboratory (UH FERL) between 2013 and 2014 on the nearshore shallow reef flats before the regulations were approved [12]. These baseline surveys were not spatially representative of the areas covered in the 2016–2020 surveys and were therefore not included in this study.
This current study focuses on monitoring assemblage composition patterns of reproductively mature resource fish species throughout the full five-year monitoring period in an attempt to determine the efficacy of the CBSFA. Resource fish species were defined by the Hā‘ena community and the reproductive maturity of these species was determined using L50 values derived from previous studies (Table A1) [13,14,15,16,17,18,19,20,21,22,23,24,25,26,27]. The objective of this study was to examine fish assemblage structure of reproductively mature resource fishes throughout this monitoring period, so as to examine the efficacy of the Hā‘ena CBSFA rules enacted in 2015 and to provide information for adaptive management strategies relative to the existing rules and regulations.

2. Materials and Methods
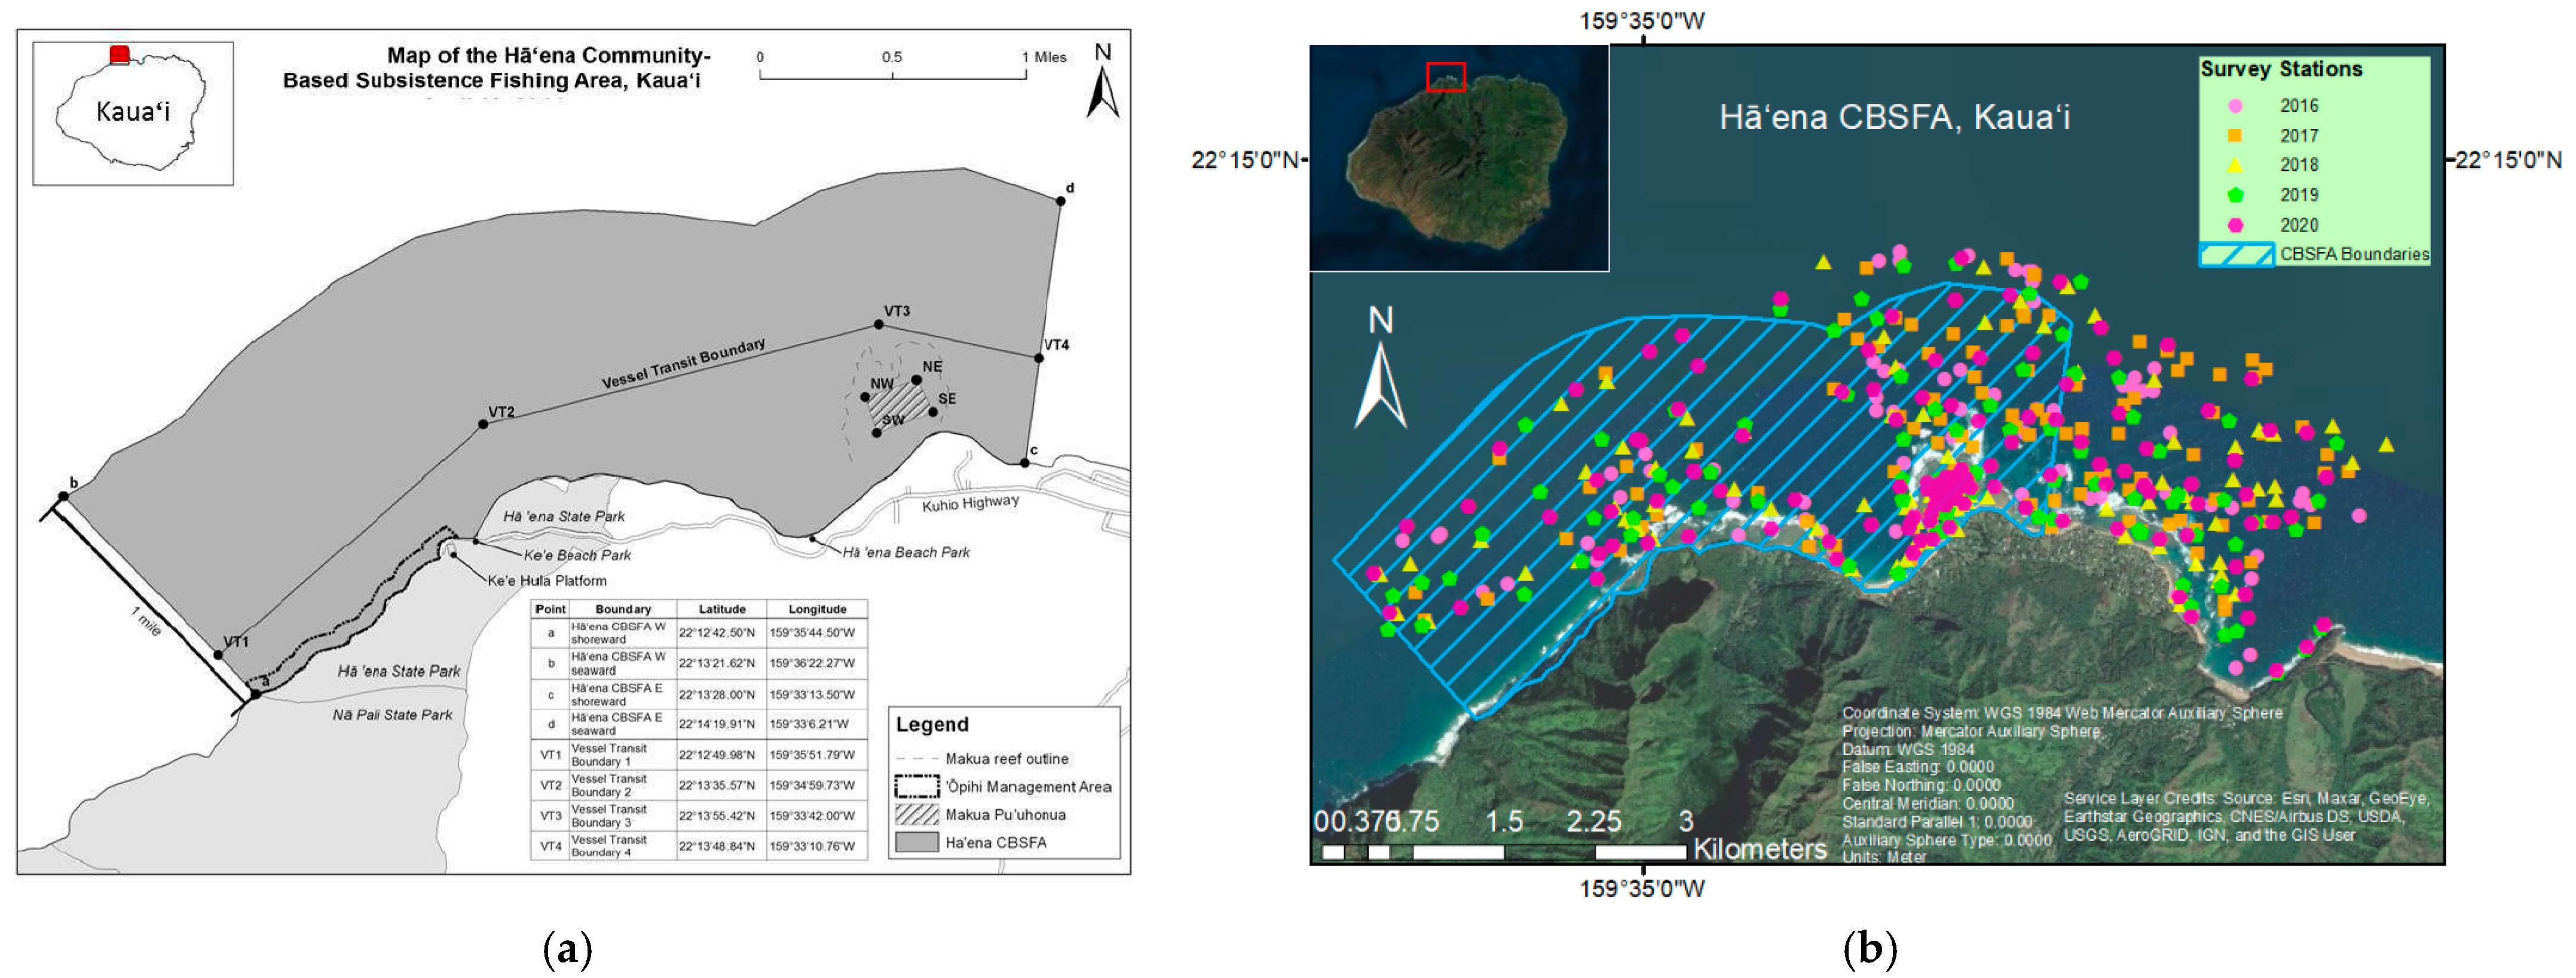
Hā‘ena is located on the north shore of Kaua‘i Island within the Hawaiian Archipelago. Coral reef structures extend along the inner reef of the Hā‘ena coast in shallow water, and along the forereef into deeper depths (~20 m). Its location on the north shore exposes Hā‘ena’s reefs to high wave energy and flushing year round, but particularly during winter months (November–March) when large North Pacific swells regularly generate waves in excess of 10 m. Several streams enter the ocean both within and adjacent to the CBSFA boundaries. These boundaries extend 1610 m (~1 mile) offshore and 5633 m (~3.5 miles) along the coastline [11,28] (Figure 1a). There are varying fishing restrictions within the CBSFA boundaries, including a designated area on the shallow backreef where all fishing is prohibited. This area is referred to as the Makua Pu‘uhonua, which translates to “nursery area” in Hawaiian, and was set aside to protect juvenile fishes during this critical life-history phase.

2.1. Sample Design

Surveys were conducted both within and directly east of the CBSFA (hereafter referred to as “inside” and “outside”) along the coast of Hā‘ena. Due to varying benthic structure, the Nā Pali State Park on the west side of the CBSFA boundaries was intentionally not surveyed. A stratified random sampling design was used to pre-determine survey stations to allow for spatial representation by depth, habitat type, and location (inside and outside). Approximately 100 random points were generated and stratified by depth (shallow < 7 m, deep ≥ 7 m) using ArcGIS 10.6.1 (Figure 1b). Points were overlaid on National Oceanographic and Atmospheric Administration (NOAA) habitat base maps [28]. Surveys were conducted at the original pre-determined stations. If hazardous conditions were encountered, depth estimates were in error, or <50% of the substrate was hard bottom, then divers swam the depth contour at a pre-determined compass heading (<100 m from the original site) until safe conditions, accurate depths, and >50% hard substrate were reached.

2.2. Fish and Benthic Surveys

Fish counts and sizes were estimated inside and outside the CBSFA using the Kaua‘i Assessments of Habitat Utilization (KAHU) rapid assessment technique over a five year period [28]. This method employed 25 × 5 m belt transects [29], designed by the UH FERL Fish Habitat Utilization Study (FHUS). The time frame of this study included surveys conducted in August 2016 (n = 55 inside, n = 43 outside), August 2017 (n = 59 inside, n = 49 outside), August 2018 (n = 71 inside, n = 32 outside), and June and August in 2019 (n = 58 inside, n = 40 outside), and June and August in 2020 (n = 79 inside, n = 44 outside). At each station, a 25 m transect was deployed in the direction of a pre-determined compass bearing (0°, 90°, 180°, or 270°). All fish species, counts, and sizes (total length [cm]) were recorded within a 5-m swath (125 m2 total area per transect) for a minimum of 10 min [28]. Fish surveyors annually participated in calibration dives to account for observer variability.
A benthic surveyor followed the fish diver to quantify habitat types associated with each transect [28]. Photographs were taken of the substrate on a previously calibrated Cannon S100 camera at every 1 m mark at a 90° angle to the transect (n = 26). Invertebrate (urchins and sea cucumbers) abundances were also recorded. The surveyor also enumerated macroinvertebrates within a 2 m × 25 m swath (50 m2) along the transect line. The twenty-six benthic photographs collected at each transect were later processed by overlaying 30 points per photograph using the benthic image analysis program CoralNet [28].

2.3. Assessing Reproductive Maturity

L50 values—defined as the size at which half of the individuals in a population have reached reproductive maturity—were obtained from previous studies within the main Hawaiian Islands (MHI) (Table A1). Female L50 values were used rather than male L50 values owing to the disproportionate importance of large females in population reproductive output [17,19,29,30,31]. Careful consideration was taken to use L50 values that were most appropriate for Hā‘ena because L50 values have been shown to vary within and among islands in Hawai‘i between individuals within a species [26]. Acanthurus triostegus (convict tang, manini), which is an endemic subspecies, was the only resource fish with L50 values derived from gonad measurement on the northshore of Kaua‘i. The majority of the remaining L50 values were selected from similar reproductive studies conducted within the Hawaiian Archipelago [15,16,17,18,19,20,23,25,26,32]. A select few L50 values were chosen from reproductive studies from the Northwestern Hawaiian Islands (NWHI) [32] or Papua New Guinea (Kyphosus spp., lowfin chub, nenue) [33]. Resource fish species with L50 values from outside the Hawaiian Archipelago, with the exception of the one Papua New Guinea study, were excluded from our analyses.

2.4. Statistical Analysis

Changes in assemblage composition of resource fishes throughout the five years inside and outside the CBSFA were analyzed using both multivariate and univariate statistics in the R statistical software. Simpson’s diversity, Menhinick’s richness, and Pielou’s evenness were also calculated using biomass metrics for the resource fish assemblage. Biomass was calculated using the following equation:
W = a × (standard length)b,
where standard length in cm was converted from total length and the a and b parameters were obtained from the Hawai‘i Cooperative Fishery Research Unit database. Non-metric multidimentional scaling (nMDS) is a rank-based analysis that was used to visualize trophic level patterns in resource fish assemblages. Fish taxa were categorized into trophic categories (corallivores, herbivores, mobile invertebrate feeders, sessile invertebrate feeders, piscivores, zooplanktivores, and detritivores) according to various published sources and FishBase (www.fishbase.org (accessed on 7 March 2021)). Species that occurred in <5% of stations were eliminated prior to analysis. Biomass was down-weighted to account for rare species and a Bray–Curtis dissimilarity matric was used. Permutation-based multivariate analysis of variance (PERMANOVA) was conducted using Type II sum of squares on trophic level (herbivore, piscivore, planktivore, and mobile invertivore) matrices to assess patterns of resource fish species assemblages through time (2016, 2017, 2018, 2019, 2020) and location (inside or outside). Homogeneity of variances were assessed for reliability of the PERMANOVA results using the PERMDISP2 procedure [34]. Pairwise comparisons with a Holm’s correction was applied following significant (p < 0.05) PERMANOVA results. SIMPER (similarity percentages) were used to analyze resource species with the highest influence on the multivariate test; however, unequal sample sizes may result in unreliable SIMPER results [35]. Therefore, further univariate analyses were conducted to determine resource species patterns.
Univariate analyses included ANOVA with Holm’s correction on multiple pairwise comparisons on quarter-root or log10 transformed data. However, the large number of zeros in most of the datasets meant zero-inflated models were most appropriate. Due to the inability to run biomass, a non-integer response variable, through zero-inflated models, data were manually split into two sections and generalized linear models (GLMs) were used. Non-normal data were first divided into presence/absence to account for the high number of zeros present. A binomial distribution with a complementary-log–log link function was used for presence/absence data to account for the unequal number of zeros-to-ones in each matrix. Non-zero biomass data were analyzed using a Gamma distribution with a log-link function run on quarter-root transformed biomass. Least-squares means were applied to GLM models to examine pairwise comparisons.
Finally, distance-based RDAs (redundancy analyses) (dbRDAs) were used to compare biomass matrices with depth, habitat type, and percent cover of coral, calcareous coralline algae (CCA), turf, and macroalgae and abundances of invertebrates, to examine drivers of patterns in fish biomass over time and between management regimes. Turf was excluded from the analysis, as it was found to be highly correlated with CCA. An Akaike information criterion (AIC) forward and backwards step model selection was used to determine the critical variables to run in the dbRDA model using a Bray–Curtis index.
All analyses were run in the R statistical software using the following packages: tidyverse, pscl, MASS, rstatix, vegan, multcomp, multcompView, lsmeans, corrplot, GGally, ggplot2, gridExtra, ggpubr, plyr, and dplyr [36].

3. Results

A total of 156 fish species were surveyed over the 5 year period across all locations. Mobile invertivores and herbivores occurred at over 90% of the total stations, while planktivores, corallivores, and piscivores occurred at >50% of the stations surveyed. Of the 156 species, 32 (20.5%) were classified as resource fishes by the Hā‘ena community, and were composed mainly of herbivores (82.8%) and piscivores (48.5%). After eliminating species that occurred in <5% of the stations, 65 fish species overall and 19 resource fish species remained for analyses.

3.1. Overall Fish Assemblage

Fish assemblage structure showed a high degree of overlap among years (Figure 2a). Assemblage structure outside the CBSFA was more concordant and was a subset of the assemblage inside the CBSFA (Figure 2b). Clear spatial patterns in overall fish asseblages were evident among sub-locations in the nMDS plot (Figure 2c). Fish assemblages inside and outside shallow (<7 m) and inside and outside deep (≥7 m) strata had similar assemblage structures, while the Makua pu‘uhonua had a distinct assemblage (Figure 2c).
Simpson’s diversity did not significantly differ among the 5 years (F4,518 = 0.95, p = 0.44). Species richness was significantly lower in 2019 compared to 2016 (F4,518 = 2.51, p = 0.04), while evenness increased from 2017 to 2018, and declined again in 2020 (χ2 = 2.82, p = 0.02). While diversity and richness did not differ between locations (F1,518 = 0.57, p = 0.45 and F1,518 = 0.61, p = 0.43, respectively), evenness was significantly higher outside compared to inside the CBSFA (χ2 = 12.8, p < 0.001).

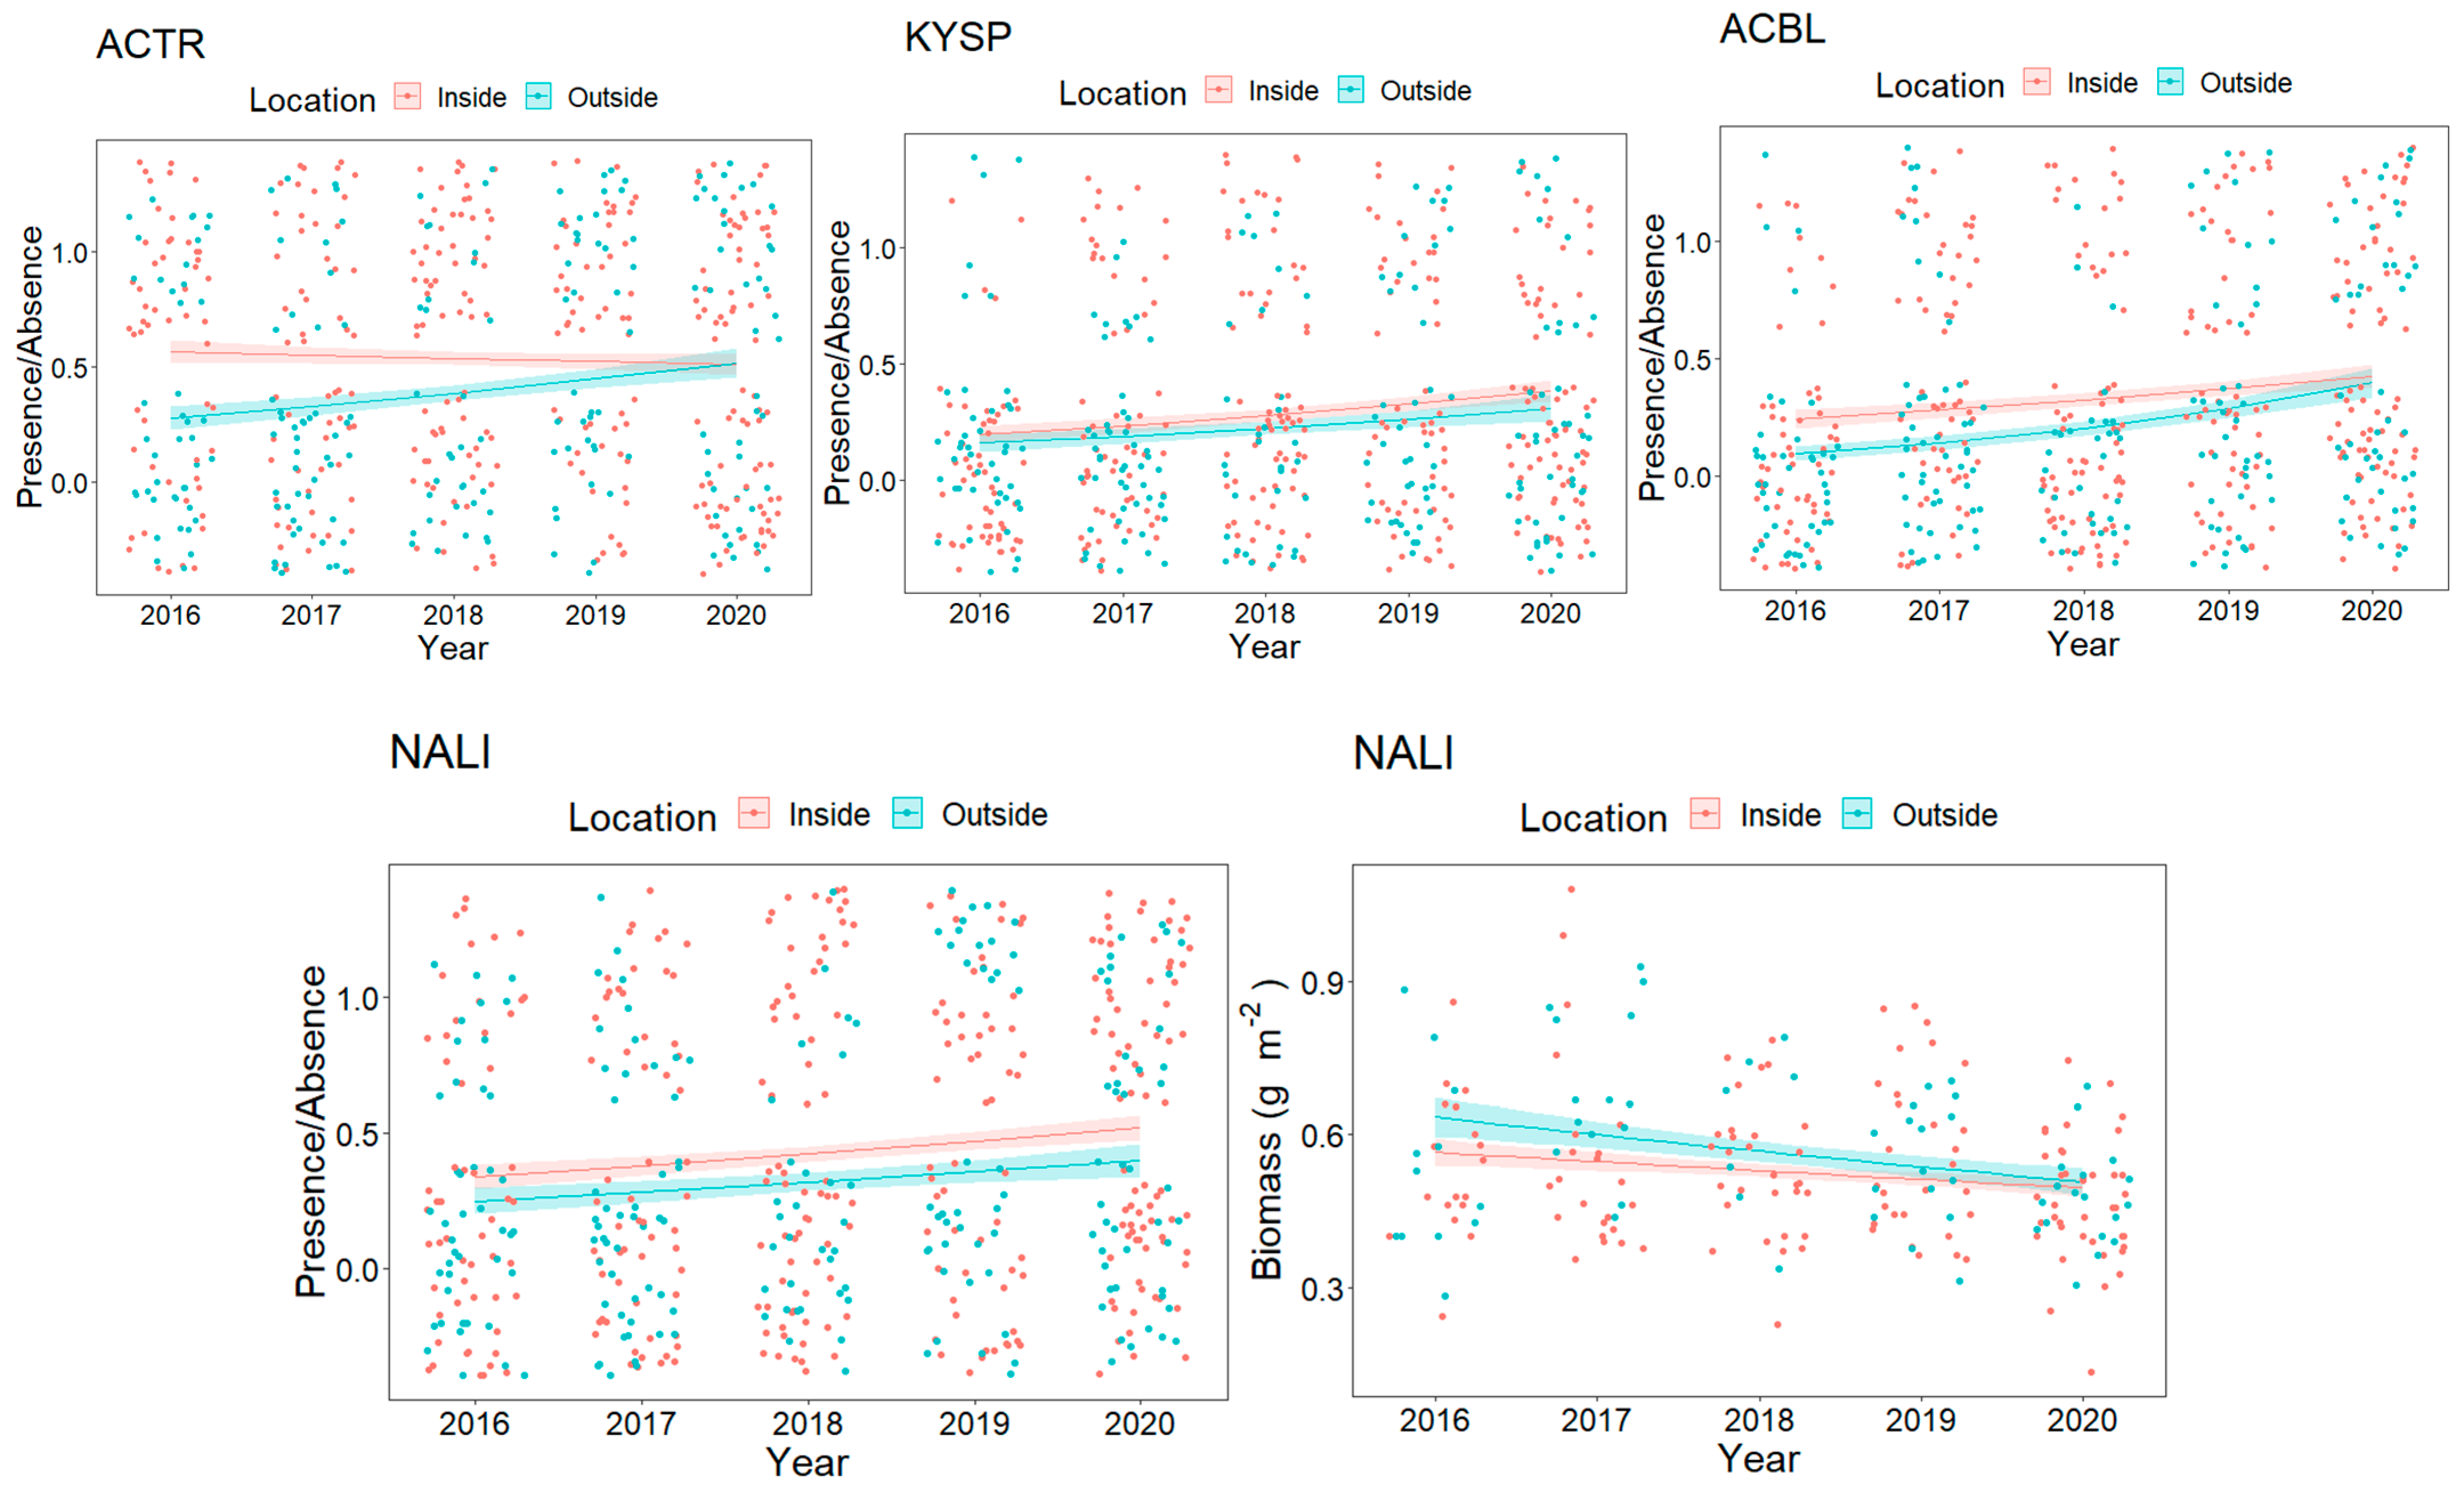
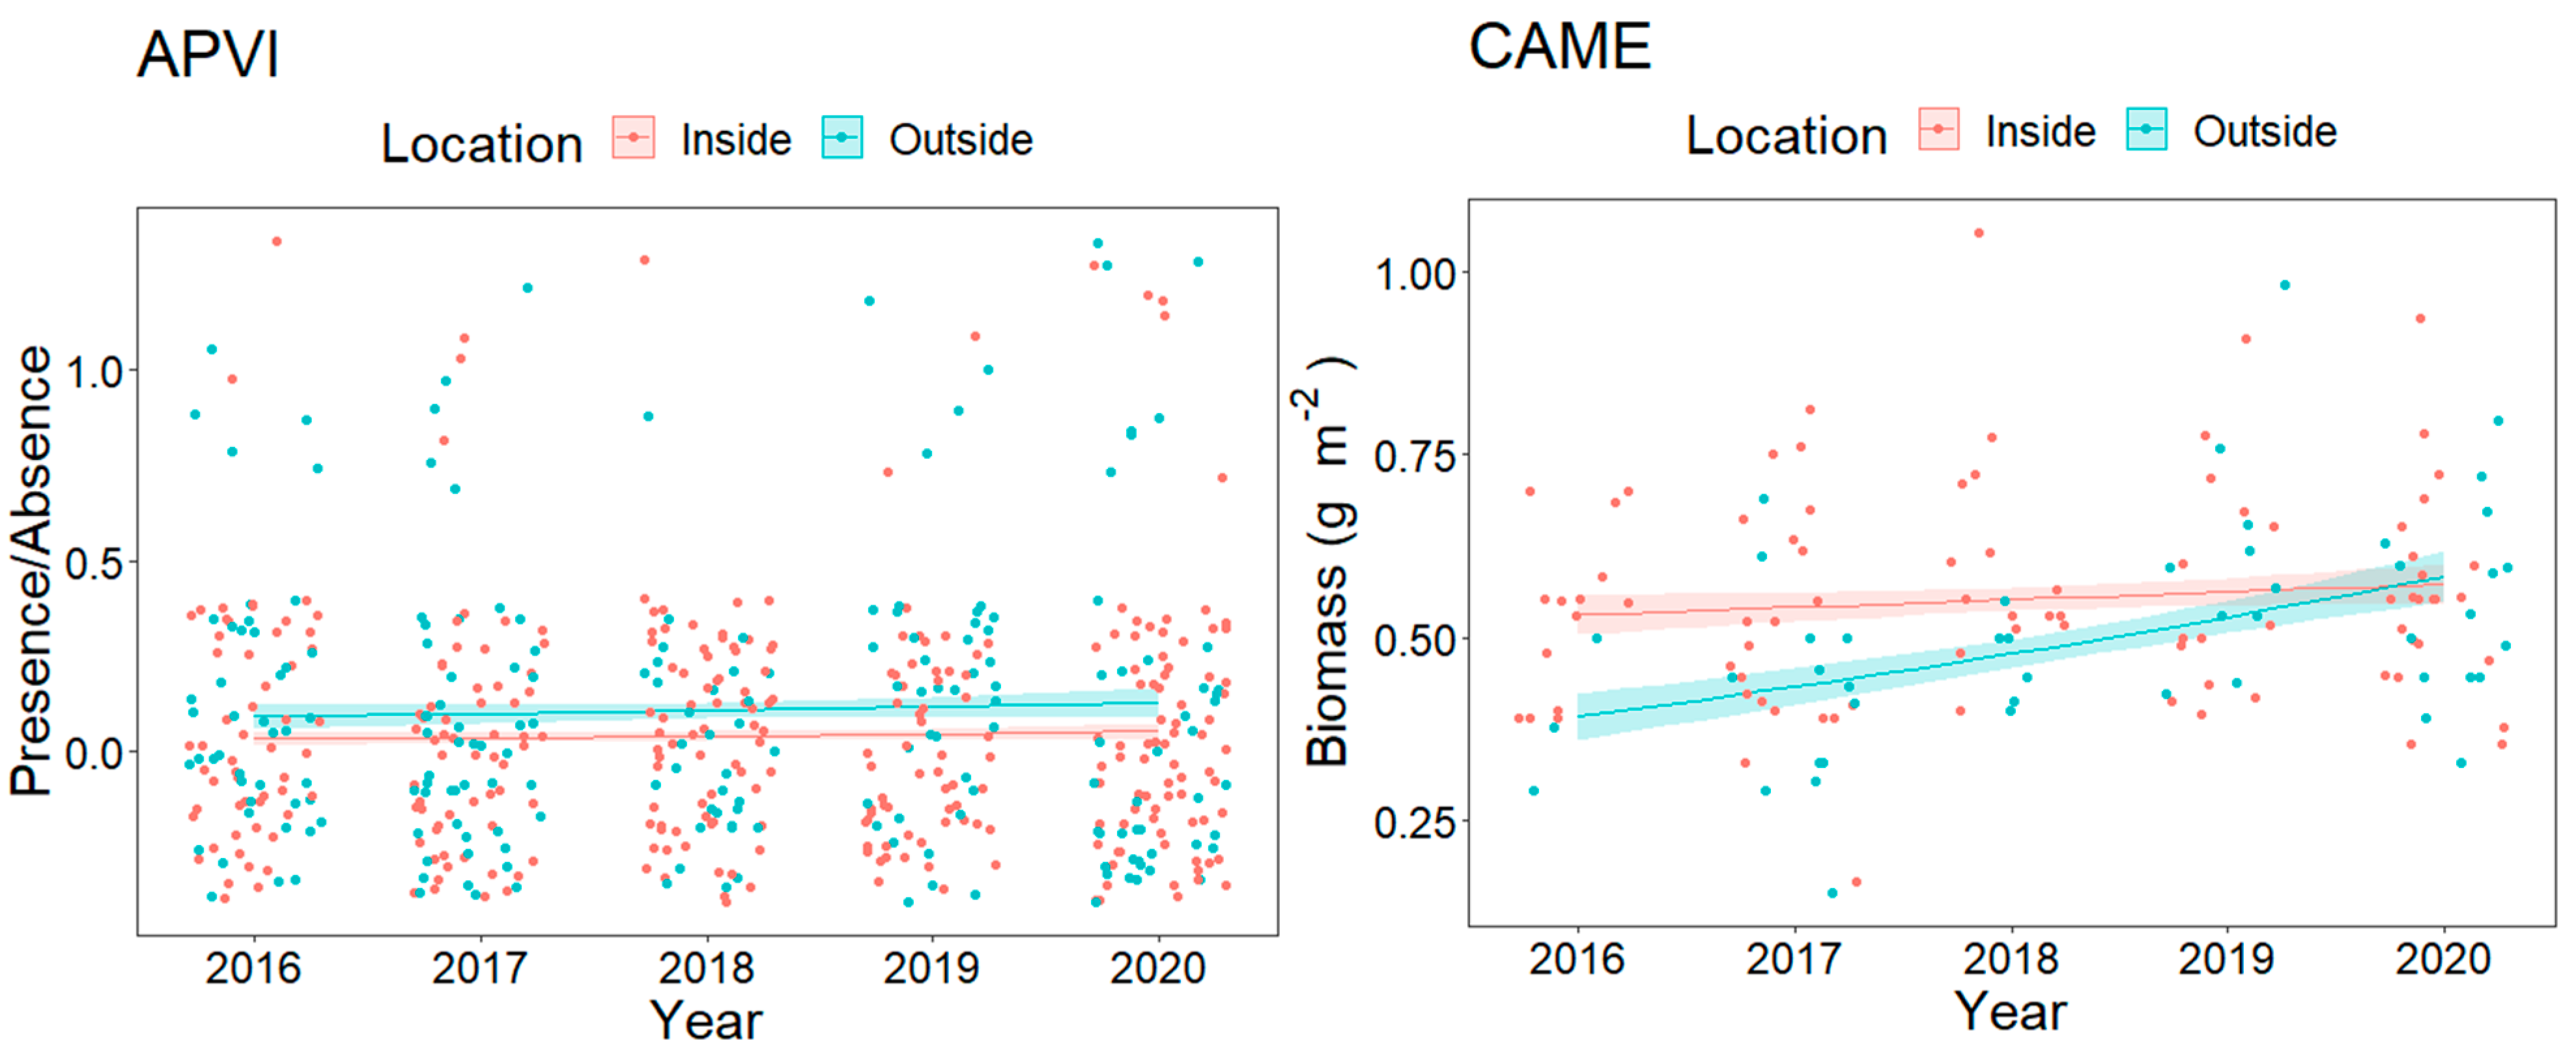
3.2. Resource Fish Assemblages (above L50)

The diversity of reproductively mature resource fishes (i.e., individuals above their respective L50 values) significantly increased from 2016, 2017, and 2018 to 2020 (χ2 = 3.46, p = 0.01), likely in part to increased species richness from 2017 and 2018 to 2020 (F4,447 = 2.84, p = 0.02). Evenness did not differ significantly over the 5-year period (p = 0.06) or between inside and outside the CBSFA boundaries (p = 0.31). Diversity was significantly higher inside the CBSFA compared to outside (χ2 = 5.33, p = 0.02), while species richness remained similar between locations (p = 0.21).

3.2.1. Trophic Level Assemblage

Reproductively mature trophic level resource fishes had distinct assemblages in 2016 and 2017, while no distinctions were evident between 2017, 2018, 2019, and 2020. There were small differences between the fish assemblages at deep water stations inside the CBSFA compared to deep water stations outside the boundaries. Shallow water stations inside and outside the boundaries have similar assemblages, yet were distinct from deeper water stations. Trophic level resource fish biomass revealed significant differences among years (PERMANOVA, Table 1). Specifically, pairwise comparisons detected higher biomass in 2017 and 2019 compared to 2016 (Pairwise, Table 2).
Reproductively mature herbivores and piscivores had higher abundances in 2020 compared to 2016 (χ2 = 7.15, p = 0.041 and χ2 = 7.68, p = 0.025, respectively). There was a higher number of herbivores inside the CBSFA (χ2 = 18.05, p < 0.001), while planktivores were more abundant outside the boundary (χ2 = 4.09, p = 0.045). Of the species present, mobile invertivores and planktivores had a higher biomass outside (χ2 = 11.83, p < 0.001 and χ2 = 4.41, p = 0.039, respectively), while herbivore and piscivore biomass was not significantly different by year or location (both p > 0.05).
Despite similar assemblage compositions through time and locations, specific species level changes were analyzed to examine species-level differences. Ten herbivore species, six piscivore species, and four mobile invertivore species were further analyzed. Spatial ordination plots did not reveal any distinct species assemblages through time or location for piscivores or mobile invertivores; however, herbivore species may be responsible for the distinction in assemblages between 2016 and 2017. Herbivore biomass in 2016 was significantly lower compared to 2020 in pairwise comparisons (pairwise, F4,438 = 1.77, p = 0.002).
Specific herbivorous species patterns show that A. triostegus, A. blochii (ringtail surgeonfish, pualu) and Naso lituratus (orangespine unicornfish, umaumalei) presences were higher inside the CBSFA (χ2 = 9.9, p = 0.002; χ2 = 6.6, p = 0.006; χ2 = 6.0, p = 0.013, respectively; Figure 3). N. lituratus was the only species that showed a significant trend, with a decrease in presence over the 5 year period (χ2 = 8.72, p = 0.022; Figure 3).
Reproductively mature piscivores showed a significant difference among years outside the CBSFA (PERMANOVA, F4,85 = 1.80, p = 0.037), where 2018 biomass was significantly higher compared to 2016 (p = 0.01). This was likely caused by the combination of Aprion virescens (green jobfish, uku) having higher presence outside the boundaries (χ2 = 8.79, p = 0.006; Figure 4) and Caranx melampygus (blue trevally, ‘omilu) biomass increasing both inside and outside the CBSFA boundaries in later years (Year: χ2 = 7.11, p = 0.023; Location: χ2 = 5.33, p = 0.026; Interaction: χ2 = 5.15, p = 0.028; Figure 4).
Although spatial patterns were not evident in the mobile invertivore nMDS plots, the PERMANOVA identified a significant location term where reproductively mature mobile invertivore biomass was higher outside the boundaries (p = 0.009). This was likely driven by the higher presence of Mulloidichthys flavolineatus (yellowstripe goatfish, weke) inside the boundaries, as well as higher biomass of the introduced Lutjanus kasmira (bluestripe snapper, ta‘ape) outside the boundaries (χ2 = 6.47, p = 0.018 and χ2 = 9.41, p = 0.003, respectively; Figure 5).

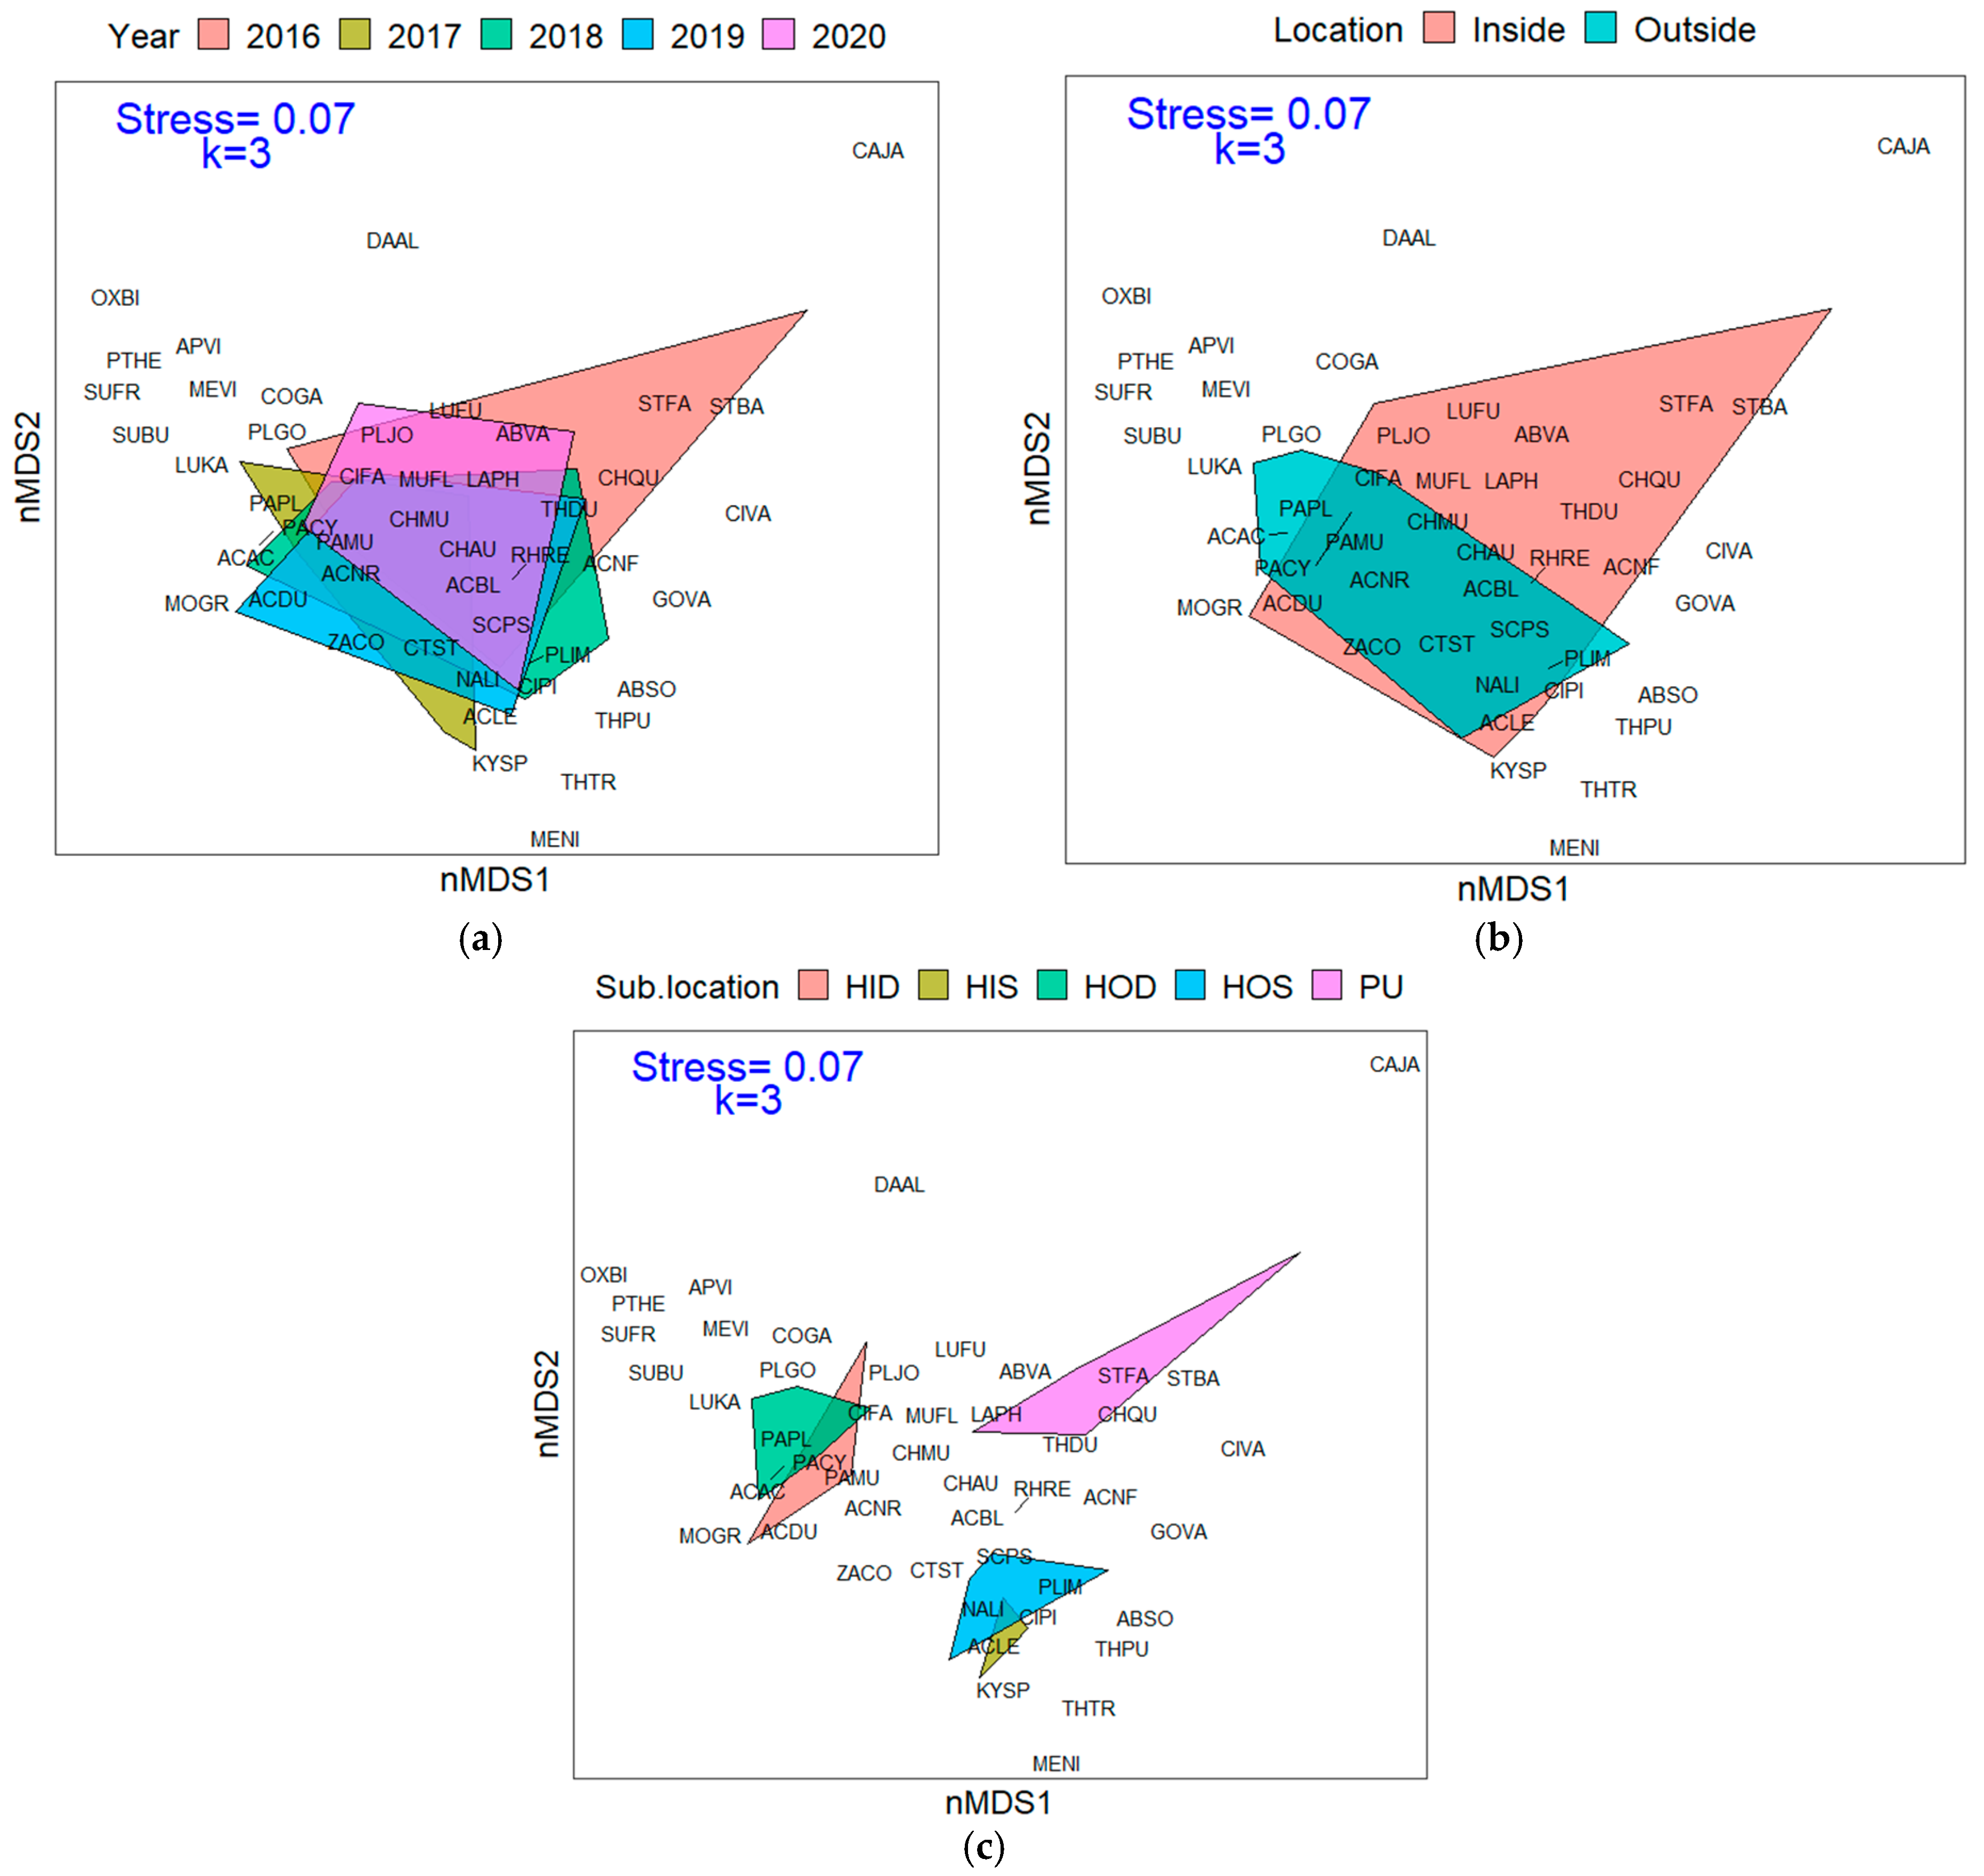
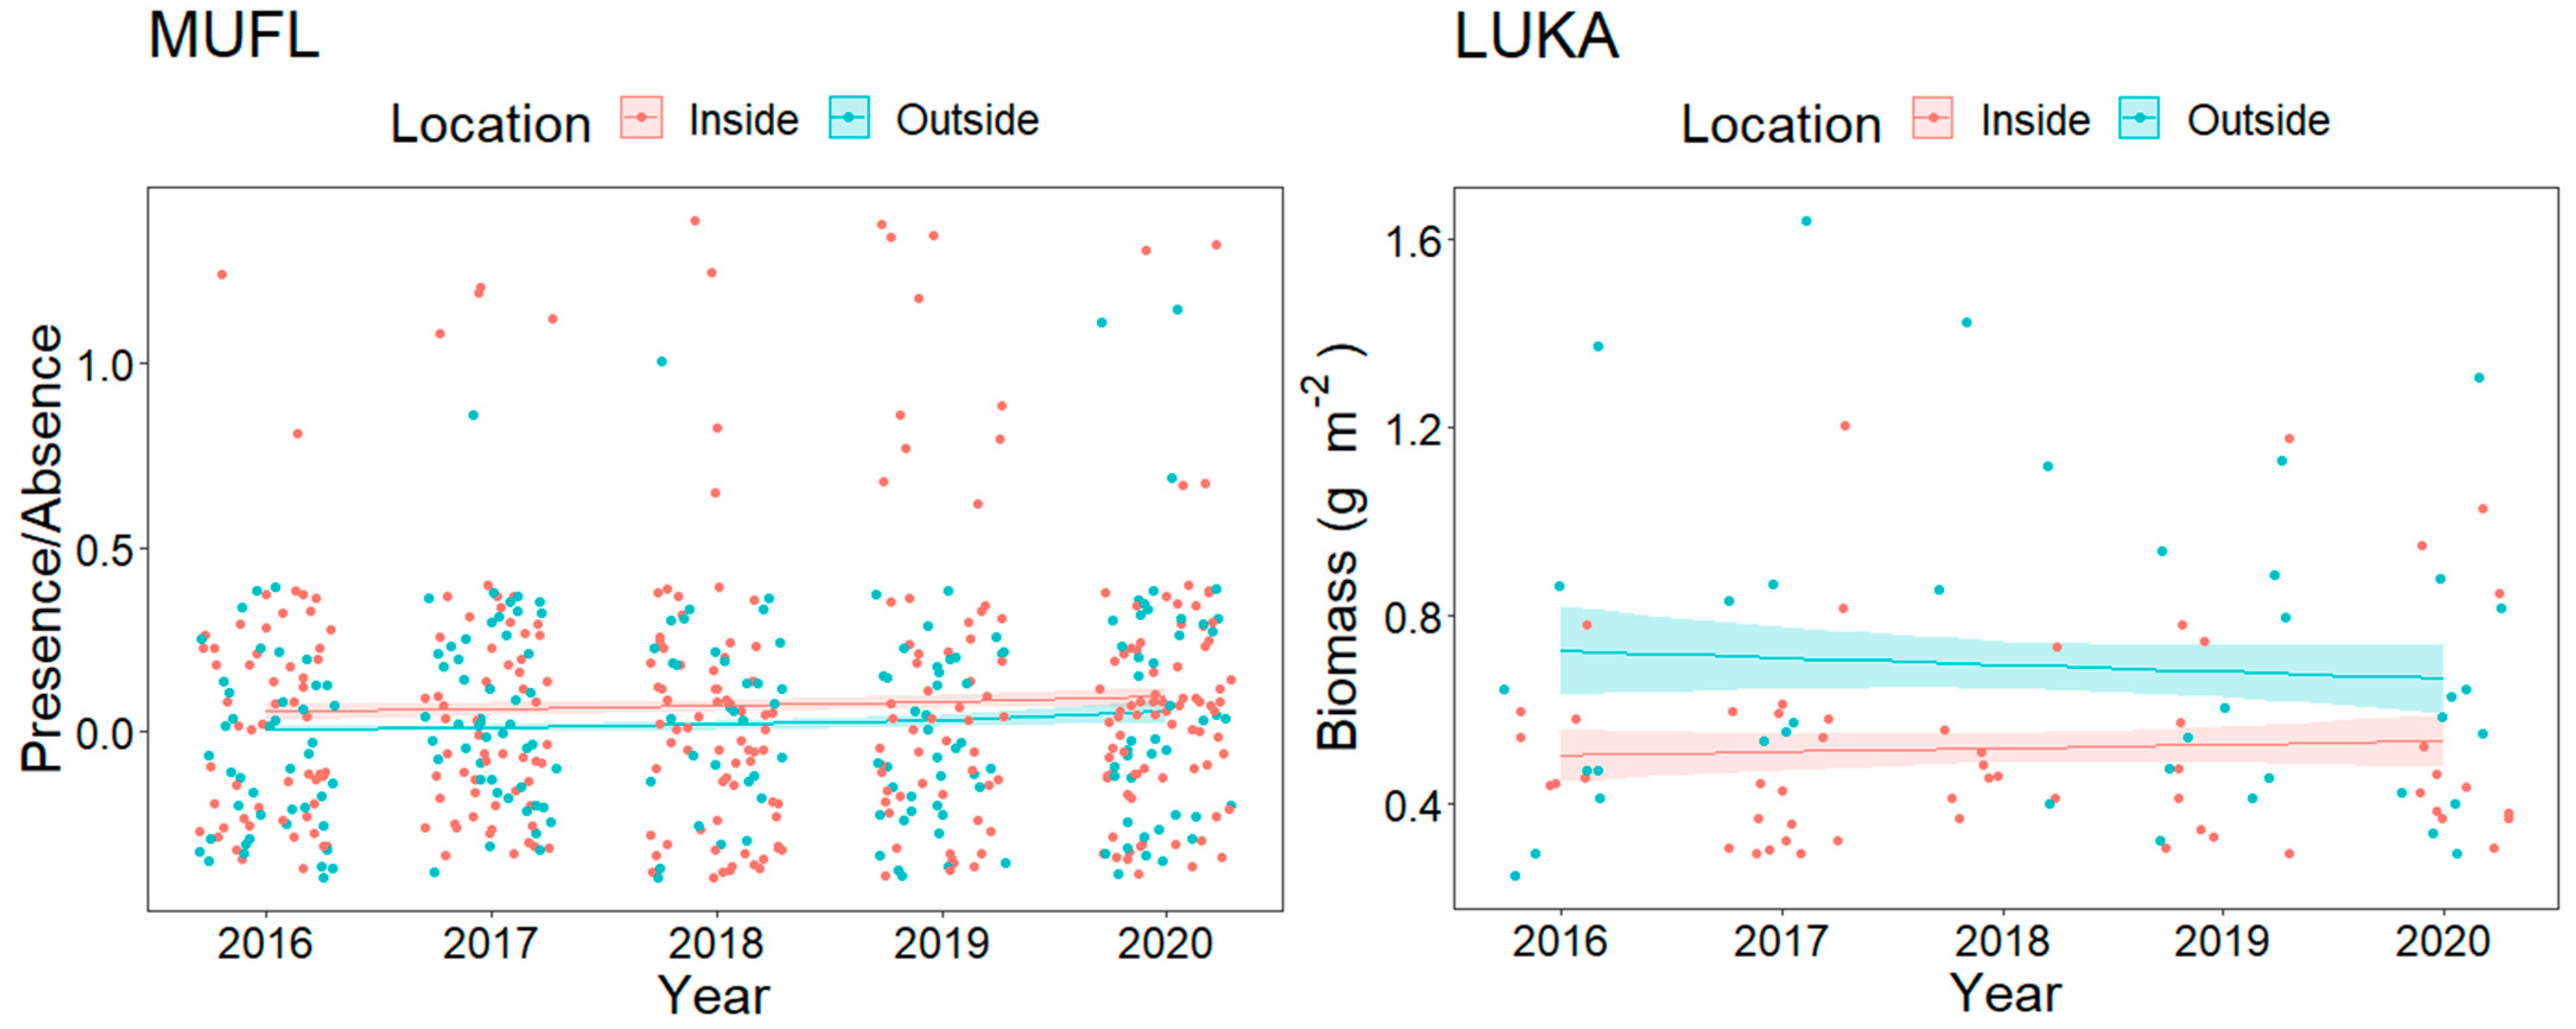
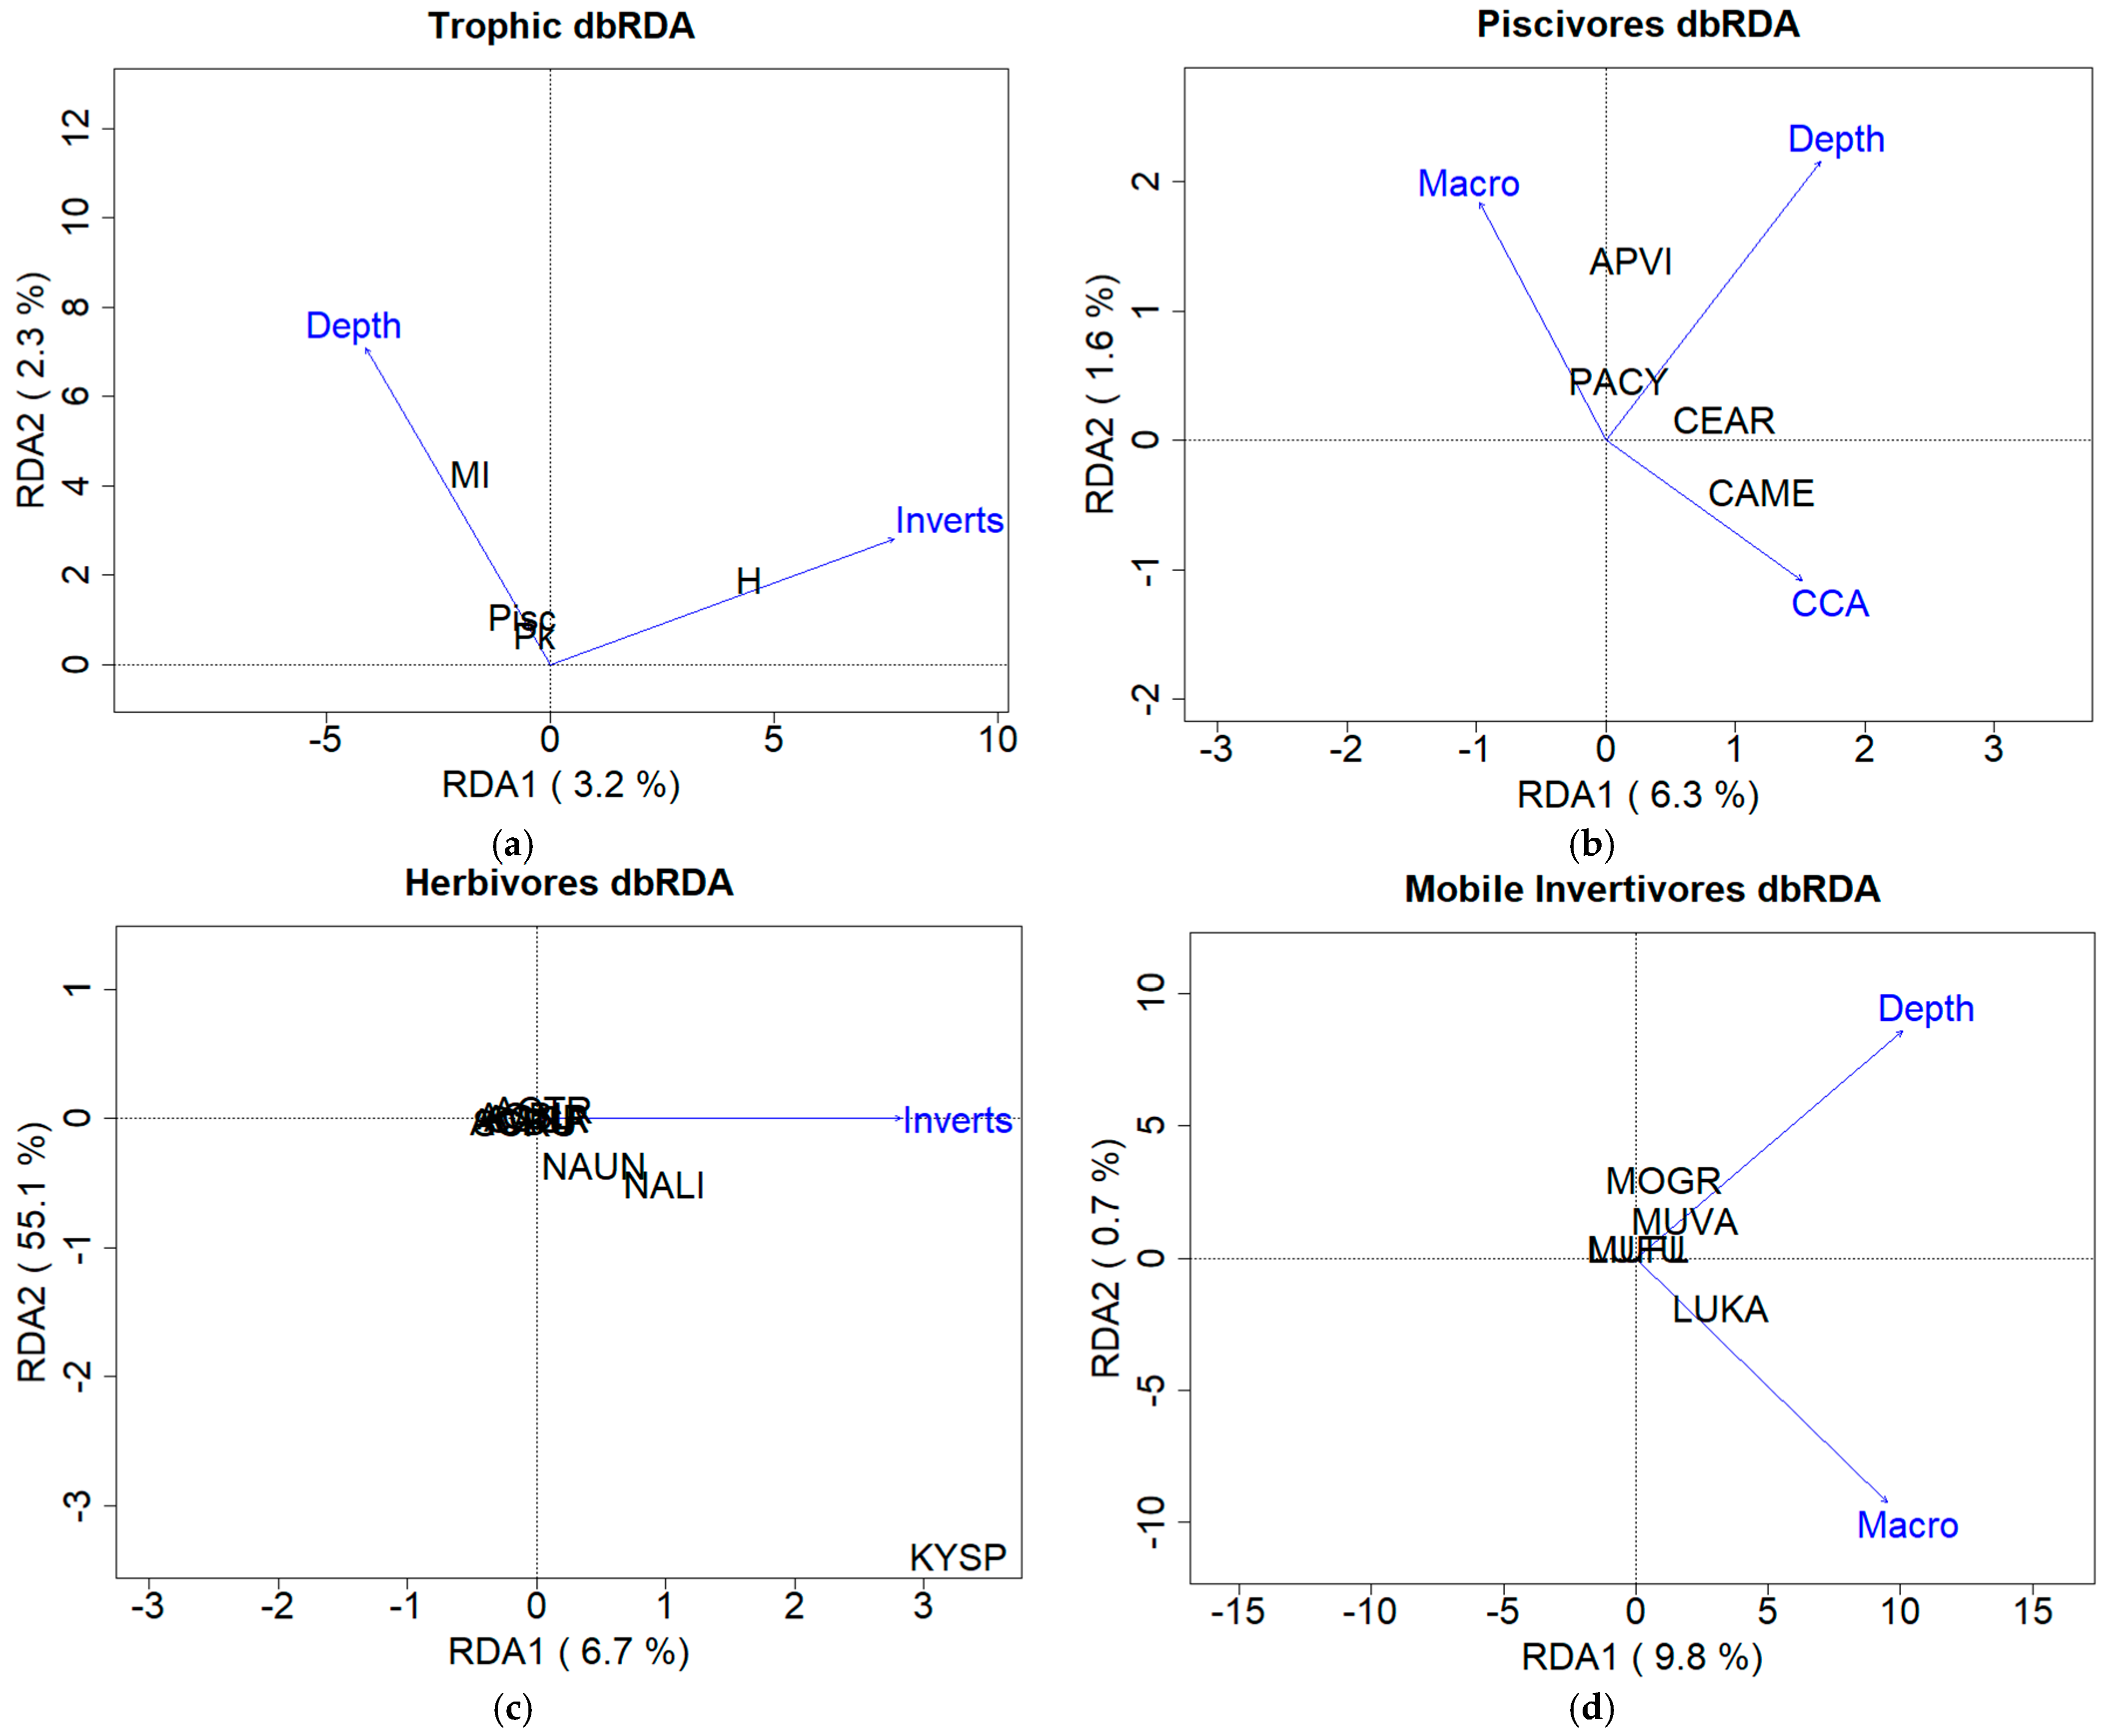
3.2.2. Fish and Benthic Community Relationships

Depth and invertebrate abundance only explained ~5% (adj R2) of the variance within reproductively mature resource fishes at the trophic assemblage level. Variations in the biomass of planktivores, piscivores, and mobile invertivores (5% adj R2; Figure 6a,d) were explained by depth, while the variance in herbivore biomass was mainly explained by the abundance of invertebrates (6% adj R2, Figure 6a,c). Within the piscivore assemblage, CCA, macroalgae (Mac), and depth explained ~ 6% (adj R2) of the variability in C. melampygus and A. virescens (Figure 6b). The majority of variance in each of the resource fish matrices remains unexplained by the variables included.

4. Discussion

Examining assemblage composition shifts and distributions through time is important in assessing the effectiveness of protected areas to implement adaptive management strategies [37,38]. Our overall results found no major shifts in fish assemblage composition in space or time inside or outside the Hā‘ena CBSFA. Furthermore, the dbRDA models comparing resource fish biomass to depth and benthic community composition estimates explained very little of the variance in resource fish above their L50 values (Figure 6). While overall, reproductively mature resource fish assemblages remained fairly constant over time, species level shifts were evident. The significantly increasing biomass values of the piscivorous C. melanpygus outside the CBSFA boundaries in later years may suggest early signs of spillover. Positive increases in reproductively mature resource fish diversity and richness through time and between management regimes, as well as positive trends of the species that show significant relationships through time and location suggest continual monitoring can be beneficial.
While few species level trends may be evident, the lack of major shifts in overall biomass at a temporal or spatial scale in reproductively mature resource fish assemblages may indicate several possible outcomes: (1) the CBSFA is having no effect, (2) five years is not sufficient time to see an effect, (3) habitats within and outside the CBSFA may be dissimilar, (4) the CBSFA boundaries are too small to show an effect, and/or (5) low sample sizes resulted in low statistical power. It is likely that the five year period may not have been sufficient time to begin seeing reserve effects. The Kahekili Herbivore Management Area on Maui took > 6 years before effects were witnessed [7]. It is also possible that the 2018 record breaking freshwater flood event may have delayed the effects of protection. This freshwater event caused major landslides and flooding that resulted in significantly lower total fish biomass on shallow Hā‘ena reefs [39]. Furthermore, the nMDS plots of the overall assemblage, trophic level, herbivore, and piscivore matrices demonstrate overlap on a spatial scale between inside and outside assemblages at the shallow stations and overlapping inside and outside assemblages at the deep stations. These patterns are consistent with the study design in comparing similar habitats within and outside the boundaries and are consistent with a lack of influx of resource fishes moving into the CBSFA if individuals are acquiring equal resources both inside and outside the boundaries.
The size and mosaic of habitats of an MPA can greatly affect the success of that area and the Hā‘ena CBSFA may be too small for the mobilities of resource fishes that we examined [40]. Within such a diverse group of organisms with varying functional roles and demands for energy [41], it is necessary for some species of fishes to travel longer distances to fulfill their energy, reproductive, and social requirements [42,43,44]. Although the majority of the Hā‘ena CBSFA is not fully protected against fishing, it is one of the larger MPAs in the state at roughly 8 km2, with is larger than the median size (1.2 km2) of MPAs in Hawai‘i [2]. Yet, considering the effective size for MPAs (10 to 100 km2 [2], the Hā‘ena CBSFA remains below the lower threshold.
Although sample sizes were >30 for all stations by year and location, limitations in sample sizes of individuals were evident for select species. Therefore, uncommon species with low sample sizes were excluded by eliminating species that occurred in <5% of stations for the purpose of improved detection of an MPA effect. Even in unfished regions, fish population distributions are naturally skewed to smaller individuals that are more abundant in size and as they become larger, their abundance decreases.
L50 values can vary not only by location and water temperature but also by season and year [45,46]. Although the L50 value for Acanthurus triostegus came directly from gonad measurements of individuals located around the Hā‘ena area, L50 values of most other species were derived from measurements of individuals from the MHI, some from the NWHI, and one from Papua New Guinea (Table A1). L50 values are the best estimate that can be used to assess reproductive maturity using in situ observations. Hence, conducting further research to acquire L50 values for all resource fish species from the Hā‘ena region could be beneficial in ensuring precise analyses of that specific location.

5. Conclusions

Overall resource fish assemblage composition did not change temporally or spatially over five years despite the implementation of fishing regulations. Results of this study suggest continuing annual surveys to evaluate long-term trends in order to better predict how resource fish assemblages may be changing within the current management regime. These monitoring data are essential if future adaptive changes in rules and regulations are to be implemented and effective. Furthermore, determining the habitat types and benthic structures that are benefical to specific resource fishes at the Hā‘ena CBSFA is crucial in assessing any emerging patterns of assemblage composition. Such contemporary research and management practices serve the purpose of providing data that allows local stakeholders and communities to adjust their rules and regulations as needed, thus, allowing an adaptive management strategy to be implemented [47]. CBSFAs place local and traditional knowledge and practices at the forefront of fisheries management, allowing accountability for fisheries by local community members [37]. One of the social side effects of most MPAs in Hawai‘i is the prevention of local fishers from practicing traditional fishing methods or incorporating adaptive management strategies due to temporary or permanent closures [48]. The integration of local and traditional knowledge and practices into the CBSFA design gives local people who use the protected area on a frequent basis accountability and a voice that can be beneficial in creating rules and regulations, especially as there are many communities that still depend on marine resources for subsistence.

Author Contributions

Conceptualization, K.S.R.; methodology, K.S.R.; validation, R.M.W.; formal analysis, R.M.W. and A.M.F.; investigation, R.M.W.; data curation, R.M.W.; writing—original draft preparation, R.M.W.; writing—review and editing, R.M.W., K.S.R., A.M.F. and C.L.H.; visualization, R.M.W.; supervision, K.S.R. and C.L.H.; funding acquisition, K.S.R. All authors have read and agreed to the published version of the manuscript.

Funding

This research was funded by the State of Hawai‘i Department of Land and Natural Resources, Division of Aquatic Resources, award grant number 35228.

Institutional Review Board Statement

Ethical review and approval were waived for this study, due to methodologies that do not disturb or alter the marine biota.

Informed Consent Statement

Not applicable.

Data Availability Statement

Data publicly available at the Division of Aquatic Resources and the University of Hawai‘i, Hawai‘i Institute of Marine Biology Coral Reef Ecology Laboratory ([email protected]).

Acknowledgments

We acknowledge the assistance and dedication of the Hui Makaainana o Makana community group for their input and support of this project. We are extremely grateful to the Division of Aquatic Resources (DAR) for their extensive effort and resources provided in planning, diving, and project guidance. Special thanks to DAR Acting Director: Brian Nielsen and the DAR Kaua‘i Monitoring Team: Heather Ylitalo-Ward, Ka‘ilikea Shayler, McKenna Allen, and Mia Melamed, DAR O‘ahu Monitoring and Algal Invasive Species teams: Paul Murakawa, Kazuki Kageyama, Haruko Koike, Tiffany Cunanan, Justin Goggins, and Kimberly Fuller, DAR Maui Monitoring Team: Russell Sparks, Kristy Stone, Linda Castro, Tatiana Martinez, and DAR biostatistician Haruko Koike. We appreciate the efforts of the Coral Reef Ecology Lab: Anita Tsang, Sarah Severino, Justin Han, Andrew Graham, Yuko Stender, Angela Richards Dona, Keisha Bahr, Ashley McGowan for surveys and data analyses and Kostas Stamoulis and Jade Delevaux for additional fish behavior surveys. DAR Kaua‘i Education and Outreach Specialist: Katie Nalesere. These surveys would not have been possible without the vessels and operators provided by the DLNR: Division of Boating and Ocean Recreation (DOBOR), Kaua‘i under the direction of Joseph Borden. This is publication number 101 from the School of Life Sciences, University of Hawai‘i at Mānoa.

Conflicts of Interest

The authors declare no conflict of interest. The funders had a role in the design of the study, and in the collection of the data.

Appendix A

Table A1. List of resource fish species with sources from which L50 values were derived. Species derived from the Hā‘ena resource fish species list are noted with an asterisk (*) [13,14,15,16,17,18,19,20,21,22,23,24,25,26,27,32,33].
FamilyCodeTaxon NameCommonHawaiianEndemismL50 (cm)Citation
AcanthuridaeACBLAcanthurus blochiiRingtail SurgeonfishpualuNative27.6 Choat and Robertson, 2002, Kritzer, 2001
ACDUAcanthurus dussumieri * Eye-stripe SurgeonfishpalaniNative28.2Choat and Robertson, 2002, Kritzer, 2001
ACNRAcanthurus nigroris * Bluelined SurgeonfishmaikoNative15.7DiBattista et al., 2010
ACTRAcanthurus triostegus * Convict TangmaniniEndemic13.2Schemmel and Friedlander, 2017
NABRNaso brevirostrisSpotted Unicornfishkala loloNative26.9Choat and Robertson, 2002, Kritzer, 2001
NAHENaso hexacanthusSleek Unicornfishkala holoNative51.1Choat and Robertson, 2002, Kritzer, 2001
NALINaso lituratusOrangespine UnicornfishumaumaleiNative25Kritzer, 2001
NAUNNaso unicornis * Bluespine UnicornfishkalaNative33Nadon et al., 2015, Eble et al., 2009
CarangidaeCAMECaranx melampygus * Blue Trevally‘omiluNative47.5Sudekum et al., 1991, Nadon et al., 2015
CAORCarangoides orthogrammus * Island JackuluaNative45.4Nadon and Ault, 2016
SECRSelar crumenophthalmus * Big-Eyed ScadakuleNative17FishBase
SEDUSeriola dumerili * AmberjackkahalaNative99.5FishBase
HolocentridaeMYBEMyripristis berndtiBigscale Soldierfish‘u‘uNative17.5Murty, 2002, Craig and Franklin, 2008, Kritzer, 2001
KyphosidaeKYSPKyphosus species *Lowfin ChubnenueNative25.3Longnecker et al., 2013
LethrinidaeMOGRMonotaxis grandoculisBigeye EmperormuNative38.9Nadon and Ault, 2016
LutjanidaeAPVIAprion virescensGreen JobfishukuNative50Everson, 1989, Nadon, 2017
LUFULutjanus fulvusBlacktail Snapperto‘auIntroduced24Nadon and Ault, 2016
LUKALutjanus kasmiraBluestripe Snapperta‘apeIntroduced20Allen, 1985, Kritzer, 2001
MullidaeMUFLMulloidichthys flavolineatus * Yellowstripe GoatfishwekeNative19.9Cole, 2009, Nadon, 2017
MUVAMulloidichthys vanicolensis * Yellowfin Goatfishweke ‘ulaNative20.6Cole, 2009, Kritzer, 2001
PACYParupeneus cyclostomusBlue Goatfishmoano keaNative26.9Nadon and Ault, 2016
PAPOParupeneus porphyreus * Whitesaddle GoatfishkūmūEndemic26.4Nadon et al., 2015
ScaridaeCACACalotomus carolinus * Stareye Parrotfish Native24.3DeMartini and Howard, 2016
CHPEChlorurus perspicillatus * Spectacled Parrotfishuhu uliuliEndemic34.5DeMartini and Howard, 2016
CHSOChlorurus spilurus Native17.2DeMartini and Howard, 2016
SCDUScarus dubius * Regal ParrotfishlauiaEndemic23.2Nadon and Ault, 2016
SCPSScarus psittacus * Palenose ParrotfishuhuNative13.9DeMartini and Howard, 2016
SCRUScarus rubroviolaceus * Redlip ParrotfishpālukalukaNative35DeMartini and Howard, 2016
EpinephelidaeCEARCephalopholis argusBlue-spotted Grouper Introduced20Schemmel et al., 2016
* = Hā‘ena species list.

References

  1. Gaines, S.D.; White, C.; Carr, M.H.; Palumbi, S.R. Designing Marine Reserve Networks for Both Conservation and Fisheries Management. Proc. Natl. Acad. Sci. USA 2010, 107, 18286–18293. [Google Scholar] [CrossRef] [Green Version]
  2. Friedlander, M.A.; Goodell, W.; Mary, K. Characteristics of Effective Marine Protected Areas in Hawai‘i. Aquat. Conserv. Mar. Freshw. Ecosyst. 2019, 29, 103–117. [Google Scholar] [CrossRef] [Green Version]
  3. Burgess, S.C.; Nickols, K.J.; Griesemer, C.D.; Barnett, L.A.K.; Dedrick, A.G.; Satterthwaite, E.V.; Yamane, L.; Morgan, S.G.; White, J.W.; Botsford, L.W. Beyond Connectivity: How Empirical Methods Can Quantify Population Persistence to Improve Marine Protected-Area Design. Ecol. Appl. 2014, 24, 257–270. [Google Scholar] [CrossRef] [Green Version]
  4. Williams, D.I.; Walsh, W.J.; Miyasaka, A.; Friedlander, A.M. Effects of Rotational Closure on Coral Reef Fishes in Waikiki-Diamond Head Fishery Management Area, Oahu, Hawaii. Mar. Ecol. Prog. Ser. 2006, 310, 139–149. [Google Scholar] [CrossRef] [Green Version]
  5. Agardy, T. Information Needs for Marine Protected Areas: Scientific and Societal. Bull. Mar. Sci. 2000, 66, 875–888. [Google Scholar]
  6. Lubchenco, J.; Groud-Colvert, K. Making Waves: The Science and Politics of Ocean Protection. Science 2015, 350, 382–383. [Google Scholar] [CrossRef] [PubMed]
  7. Williams, I.D.; White, D.J.; Sparks, R.T.; Lino, K.C.; Zamzow, J.P.; Kelly, E.L.A.; Ramey, H.L. Responses of Herbivorous Fishes and Benthos to 6 Years of Protection at the Kahekili Herbivore Fisheries Management Area, Maui. PLoS ONE 2016, 11. [Google Scholar] [CrossRef] [Green Version]
  8. Friedlander, A.M.; Brown, E.K.; Monaco, M.E. Coupling Ecology and GIS to Evaluate Efficacy of Marine Protected Areas in Hawaii. Ecol. Appl. 2007, 17, 715–730. [Google Scholar] [CrossRef] [PubMed] [Green Version]
  9. Friedlander, A.M.; Golbuu, Y.; Ballesteros, E.; Caselle, J.E.; Gouezo, M.; Olsudong, D.; Sala, E. Size, Age, and Habitat Determine Effectiveness of Palau’s Marine Protected Areas. PLoS ONE 2017, 12, e0174787. [Google Scholar] [CrossRef]
  10. Friedlander, A.M.; Stamoulis, K.A.; Kittinger, J.N.; Drazen, J.; Tissot, B.N. Understanding the Scale of Marine Protection in Hawai‘i: From Community-Based Management to the Remote Northwestern Hawaiian Islands Marine National Monument. Adv. Mar. Biol. 2014, 69, 153–203. [Google Scholar] [PubMed]
  11. Weible, R.M. An In-Depth Investigation of Resource Fishes within and Surrounding a Community-Based Subsistence Fishing Area at Hā‘ena, Kaua‘i. M.S. Thesis, University of Hawai‘i, Mānoa, HI, USA, 2019. [Google Scholar]
  12. Goodell, W.; Stamoulis, K.A.; Friedlander, A.M. Coupling Remote Sensing with In Situ Surveys to Determine Reef Fish Habitat Associations for the Design of Marine Protected Areas. Mar. Ecol. Prog. Ser. 2017, 588, 121–134. [Google Scholar] [CrossRef] [Green Version]
  13. Allen, G.R. 1985. Snappers of the World: An Annotated and Illustrated Catalogue of Lutjanid Species Known to Date. FAO Fish. Synop. 1985, 6, 208. [Google Scholar]
  14. Choat, J.H.; Robertson, D.R. Age-Based Studies. In Coral Reef Fishes: Dynamics and Diversity in a Complex Ecosystem; Academic Press: San Diego, CA, USA, 2002; pp. 57–80. [Google Scholar]
  15. Cole, K.S. Size-Dependent and Age-Based Female Fecundity and Reproductive Output for Three Hawaiian Goatfish (Family Mullidae) Species, Mulloidichthys flavolineatus (Yellowstripe Goatfish), M. vanicolensis (Yellowfin Goatfish), and Parupeneus porphyreus (Whitesaddle Goatfish); Report; Division of Aquatic Resources Dingell-Johnson Sport Fish Restoration: Honolulu, HI, USA, 2009. [Google Scholar]
  16. Craig, M.T.; Franklin, E.C. Life History of Hawaiian Redfish: A Survey of Age and Growth in ‘Aweoweo (Priacanthus meeki) and U‘u (Myripristis berndti); Hawaii Institute of Marine Biology: Kaneohe, HI, USA, 2008. [Google Scholar]
  17. DeMartini, E.E.; Howard, K.G. Comparisons of Body Sizes at Sexual Maturity and at Sex Change in the Parrotfishes of Hawaii: Input Needed for Management Regulations and Stock Assessments. J. Fish Biol. 2016, 88, 523–541. [Google Scholar] [CrossRef]
  18. DiBattista, J.D.; Wilcox, C.; Craig, M.T.; Rocha, L.A.; Bowen, B.W. Phylogeography of the Pacific Blueline Surgeonfish, Acanthurus nigroris, Reveals High Genetic Connectivity and a Cryptic Endemic Species in the Hawaiian Archipelago. J. Mar. Biol. 2011, 2011. [Google Scholar] [CrossRef] [Green Version]
  19. Eble, J.A.; Langston, R.; Bowen, B.W. Growth and Reproduction of Hawaiian Kala, Naso unicornis; Fisheries Local Action Strategy, Final Report; Division of Aquatic Resources: Honolulu, HI, USA, 2009. [Google Scholar]
  20. Everson, A.R.; Williams, H.A.; Ito, B.M. Maturation and Reproduction in Two Hawaiian Eteline Snappers, Uku, Aprion virescens, and Onaga, Etelis coruscans. Fish. Bull. 1989, 87, 877–888. [Google Scholar]
  21. Kritzer, J.P.; Davies, C.R.; Mapstone, B.D. Characterizing Fish Populations: Effects of Sample Size and Population Structure on the Precision of Demographic Parameter Estimates. Can. J. Fish. Aquat. Sci. 2001, 58, 1557–1568. [Google Scholar] [CrossRef]
  22. Murty, V.S. Marine Ornamental Fish Resources of Lakshadweep. CMFRI Spec. Publ. 2002, 72, 1–134. [Google Scholar]
  23. Nadon, M.O.; Ault, J.S.; Williams, I.D.; Smith, S.G.; DiNardo, G.T. Length-Based Assessment of Coral Reef Fish Populations in the Main and Northwestern Hawaiian Islands. PLoS ONE 2015, 10, e0133960. [Google Scholar] [CrossRef] [PubMed]
  24. Nadon, M.O.; Ault, J.S. A Stepwise Stochastic Simulation Approach to Estimate Life History Parameters for Data-Poor Fisheries. Can. J. Fish. Aquat. Sci. 2016, 73, 1874–1884. [Google Scholar] [CrossRef]
  25. Schemmel, E.M.; Donovan, M.K.; Wiggins, C.; Anzivino, M.; Friedlander, A.M. Reproductive Life History of the Introduced Peacock Grouper Cephalopholis argus in Hawaii. J. Fish Biol. 2016, 89, 1271–1284. [Google Scholar] [CrossRef]
  26. Schemmel, E.M.; Friedlander, A.M. Participatory Fishery Monitoring is Successful for Understanding the Reproductive Biology Needed for Local Fisheries Management. Environ. Biol. Fishes 2017, 100, 171–185. [Google Scholar] [CrossRef]
  27. Sudekum, A.E.; Parrish, J.D.; Radtke, R.L.; Ralston, S. Life History and Ecology of Large Jacks in Undisturbed Shallow Oceanic Communities. Fish. Bull. 1991, 88, 493–513. [Google Scholar]
  28. Rodgers, K.; Bahr, K.; Dona, A.R.; Weible, R.; Tsang, A.; Han, J.H.; McGowan, A. 2016 Long-Term Monitoring and Assessment of the Hā‘ena, Kaua‘i Community Based Subsistence Fishing Area; Report; The Hawai‘i Coral Reef Assessment and Monitoring Program: Honolulu, HI, USA, 2017. [Google Scholar]
  29. Brock, V.E. A Preliminary Report on a Method of Estimating Reef Fish Populations. J. Wildl. Manag. 1954, 18, 297–308. [Google Scholar] [CrossRef]
  30. Nadon, M.O. Improving Stock Assessment Capabilities for the Coral Reef Fishes of Hawai‘i and the Pacific Region. Ph.D. Thesis, University of Miami, Miami, FL, USA, 2014. [Google Scholar]
  31. Hixon, M.A.; Johnson, D.W.; Sogard, S.M. BOFFFFs: On the Importance of Conserving Old-Growth Age Structure in Fishery Populations. Ices J. Mar. Sci. 2014, 71, 2171–2185. [Google Scholar] [CrossRef] [Green Version]
  32. Nadon, M.O. Stock Assessment of the Coral Reef Fishes of Hawaii, 2016; Report; National Oceanic Atmospheric Administration: Washington, DC, USA, 2017. [Google Scholar]
  33. Longenecker, K.R.; Langston, R.; Bolick, H.; Kondio, U. Size and Reproduction of Exploited Reef Fishes at Kamiali Wildlife Management Area, Papua New Guinea; Bishop Museum Press: Honolulu, HI, USA, 2013. [Google Scholar]
  34. Anderson, M.J. Distance-Based Tests for Homogeneity of Multivariate Dispersions. Biometrics 2006, 62, 245–253. [Google Scholar] [CrossRef] [PubMed]
  35. Clarke, K.R. Non-parametric multivariate analyses of changes in community structure. Aust. J. Ecol. 1993, 18, 117–143. [Google Scholar] [CrossRef]
  36. R Core Team. R: A Language and Environment for Statistical Computing; R Foundation for Statistical Computing: Vienna, Austria, 2020. [Google Scholar]
  37. Friedlander, A.M.; Donovan, M.K.; Stamoulis, K.A.; Williams, I.D.; Brown, E.K.; Conklin, E.J.; DeMartini, E.E.; Rodgers, K.S.; Sparks, R.T.; Walsh, W.J. Human-Induced Gradients of Reef Fish Declines in the Hawaiian Archipelago Viewed through the Lens of Traditional Management Boundaries. Aquat. Conserv. Mar. Freshw. Ecosyst. 2018, 28, 146–157. [Google Scholar] [CrossRef]
  38. Magris, R.A.; Treml, E.A.; Pressey, R.L.; Weeks, R. Integrating Multiple Species Connectivity and Habitat Quality into Conservation Planning for Coral Reefs. Ecography 2016, 39, 649–664. [Google Scholar] [CrossRef]
  39. Rodgers, K.S.; Stefanak, M.P.; Tsang, A.O.; Han, J.J.; Graham, A.T.; Stender, Y.O. Impact to Coral Reef Populations at Hā‘ena and Pila‘a, Kaua‘i, Following a Record 2018 Freshwater Flood Event. Diversity 2021, 13, 66. [Google Scholar] [CrossRef]
  40. Botsford, L.W.; Brumbaugh, D.R.; Grimes, C.; Kellner, J.B.; Largier, J.; O’Farrell, M.R.; Ralston, S.; Soulanille, E.; Wespestad, V. Connectivity, Sustainability, and Yield: Bridging the Gap between Conventional Fisheries Management and Marine Protected Areas. Rev. Fish Biol. Fish. 2009, 19, 69–95. [Google Scholar] [CrossRef]
  41. Barneche, D.R.; Kulbicki, M.; Floeter, S.R.; Friedlander, A.M.; Maina, J.; Allen, A.P. Scaling Metabolism from Individuals to Reef-Fish Communities at Broad Spatial Scales. Ecol. Lett. 2014, 17, 1067–1076. [Google Scholar] [CrossRef]
  42. DeMartini, E.E.; Anderson, T.W.; Friedlander, A.M.; Beets, J.P. Predator Biomass, Prey Density, and Species Composition Effects on Group Size in Recruit Coral Reef Fishes. Mar. Biol. 2011, 158, 2437–2447. [Google Scholar] [CrossRef]
  43. Green, A.L.; Maypa, A.P.; Almany, G.R.; Rhodes, K.L.; Weeks, R.; Abesamis, R.A.; Gleason, M.G.; Mumby, P.J.; White, A.T. Larval Dispersal and Movement Patterns of Coral Reef Fishes, and Implications for Marine Reserve Network Design. Biol. Rev. 2015, 90, 1215–1247. [Google Scholar] [CrossRef]
  44. Weeks, R.; Green, A.L.; Joseph, E.; Peterson, N.; Terk, E. Using Reef Fish Movement to Inform Marine Reserve Design. J. Appl. Ecol. 2016, 54, 145–152. [Google Scholar] [CrossRef]
  45. Fromentin, J.M.; Fonteneau, A. Fishing Effects and Life History Traits: A Case Study Comparing Tropical versus Temperate Tunas. Fish. Res. 2001, 53, 133–150. [Google Scholar] [CrossRef] [Green Version]
  46. Kaiser, M.J.; Blyth-Skyrme, R.E.; Hart, P.J.B.; Edwards-Jones, G.; Palmer, D. Evidence for Greater Reproductive Output per Unit Area in Areas Protected from Fishing. Can. J. Fish. Aquat. Sci. 2007, 64, 1284–1289. [Google Scholar] [CrossRef]
  47. Tissot, B.N.; Walsh, W.J.; Hixon, M.A. Hawaiian Islands Marine Ecosystem Case Study: Ecosystem-and Community-Based Management in Hawaii. Coast. Manag. 2009, 37, 255–273. [Google Scholar] [CrossRef]
  48. Jokiel, P.L.; Rodgers, K.S.; Walsh, W.J.; Polhemus, D.A.; Wilhelm, T.A. Marine Resource Management in the Hawaiian Archipelago: The Traditional Hawaiian System in Relation to the Western Approach. J. Mar. Biol. 2011, 2011, 1–16. [Google Scholar] [CrossRef] [Green Version]
Figure 1. Hā‘ena site maps of (a) community-based subsistence fishing area (CBSFA) boundaries, the restricted Makua pu‘uhonua, the vessel transit boundary, and the ‘opihi (limpet, Cellana spp.) management area with coordinates [28] and (b) survey stations from all five years within and outside the CBSFA boundaries.
Diversity 13 00114 g001
Figure 2. Non-metric multidimentional scaling (nMDS) plots of overall fish species assemblages by (a) 5 years, (b) inside or outside, and (c) sub-location divisions with depth incorporated. Clear spatial patterns in overall fish asseblages are evident in the sub-location nMDS. See Table A1 for species code identification. Sub-location codes are as follows: Hā‘ena Inside Deep (HID), Hā‘ena Inside Shallow (HIS), Hā‘ena Outside Deep (HOD), Hā‘ena Outside Shallow (HOS), and Pu‘uhonua (PU; located within Hā‘ena Inside Shallow).
Diversity 13 00114 g002
Figure 3. Generalized linear model (GLM) plots of significant trends in both presence/absence and biomass data among locations (ACTR, ACBL, and NALI-presence/absence), years (KYSP, NALI-biomass), and interaction between years and locations (ACTR). Species codes are as follows: A. triostegus (ACTR), A. blochii (ACBL), N. lituratus (NALI), and Kyphosus spp. (KYSP).
Diversity 13 00114 g003
Figure 4. Generalized linear model (GLM) plots of significant trends in both presence/absence and biomass between locations (APVI-presence/absence and CAME-biomass), and among years (CAME-biomass). Species codes are as follows: A. virescens (APVI) and C. melanpygus (CAME).
Diversity 13 00114 g004
Figure 5. GLM plots of significant trends in both presence/absence and biomass data among locations (MUFL-presence/absence and LUKA-biomass). Species codes are as follows: Mulloidichthys flavolineatus (MUFL) and Lutjanus kasmira (LUKA).
Diversity 13 00114 g005
Figure 6. Distanced-based redundancy analyses (dbRDA) plots of (a) trophic level correlations, (b) piscivore correlations, (c) herbivore correlations, and (d) mobile invertivore correlations with benthic substrate components.
Diversity 13 00114 g006
Table 1. PERMANOVA results for trophic level matrix across year and location. Bold numbers indicate significance. Df = degrees of freedom, SS = sum of squares, MS = mean squares. Significant values in bold.
DfSSMSPseudo-FR2p
Location10.580.582.1140.0040.052
Year42.520.632.2920.0190.001
Location:Year40.970.240.8790.0070.613
Residuals433119.110.28 0.911
Table 2. Pairwise comparison with holm’s adjustment results for trophic level matrix across years. Significant values in bold.
PairsF.ModelR2p-Valuep-Adjusted
2016 vs.20173.5200.0210.0010.010
2016 vs. 20182.1510.0120.0460.276
2016 vs.20195.5650.0340.0010.010
2016 vs. 20202.9320.0150.0140.112
2017 vs. 20181.9290.0110.0710.355
2017 vs. 20190.8590.0050.5000.752
2017 vs. 20201.7110.0080.1150.460
2018 vs. 20192.5030.0140.0200.140
2018 vs. 20201.0450.0050.3760.752
2019 vs. 20201.4220.0070.1990.597
Publisher’s Note: MDPI stays neutral with regard to jurisdictional claims in published maps and institutional affiliations.

