Article

Genetic Diversity and Population Structure of Wild Beets (Beta spp.) from the Western Iberian Peninsula and the Azores and Madeira Islands

by
Maria Manuela Veloso
1,2,*,
Maria Cristina Simões-Costa
2,
Joana Bagoin Guimarães
1,
Carla Marques Ribeiro
3,
Isabel Evaristo
4,
Dalila Espírito-Santo
2,
Cândido Pinto-Ricardo
5,
Octávio S. Paulo
3 and
Maria Cristina Duarte
3
1
Unidade de Investigação de Biotecnologia e Recursos Genéticos, Instituto Nacional de Investigação Agrária e Veterinária, Quinta do Marquês, 2784-505 Oeiras, Portugal
2
Linking Landscape, Environment, Agriculture and Food (LEAF Research Center), Instituto Superior de Agronomia, Universidade de Lisboa, Tapada da Ajuda, 1349-017 Lisboa, Portugal
3
Centre for Ecology, Evolution and Environmental Changes (cE3c), Faculdade de Ciências, Universidade de Lisboa, Campo Grande, 1749-016 Lisboa, Portugal
4
Unidade de Investigação de Sistemas Agrários Florestais e Sanidade Vegetal, Instituto Nacional de Investigação Agrária e Veterinária, Quinta do Marquês, 2784-505 Oeiras, Portugal
5
Instituto de Tecnologia Química e Biológica, Universidade Nova de Lisboa (ITQB-UNL), Av. da República, 2780-501 Oeiras, Portugal
*
Author to whom correspondence should be addressed.
Diversity 2021, 13(11), 593; https://doi.org/10.3390/d13110593
Submission received: 30 September 2021 / Revised: 10 November 2021 / Accepted: 15 November 2021 / Published: 19 November 2021

Abstract

:
In this work, using simple sequence repeat (SSR) markers, we present new insights into the genetic diversity, differentiation, and structure of Beta vulgaris subsp. maritima of western Iberia and the Azores and Madeira islands and of B. macrocarpa from southern Portugal. B. macrocarpa occurs only in southern Portugal and frequently in sympatry with B. vulgaris subsp. maritima, showing genetic introgression. B. macrocarpa has a better-defined structure than B. vulgaris subsp. maritima, which has a high degree of admixture. A great differentiation (FST ranging from 0.277 to 0.184) was observed among the northern populations of B. vulgaris subsp. maritima. In contrast, only a small differentiation (FST ranging from 0.000 to 0.026) was detected among the southern B. vulgaris subsp. maritima populations. The inland B. vulgaris subsp. maritima populations (“RIO” and “VMT”) are distinct from each other, which also occurs with the two islands’ populations (“MAD” and “AZO”). The existence of two distinct Atlantic Sea currents can explain the fact that Madeira is related to the southern populations, while the Azores is related to the northern populations. We consider that understanding the relationships existing within Beta spp. is key to future genetic studies and for the establishment of conservation measures. Our results show that the southern coastal areas of Portugal should be considered as a potential site for in situ conservation of the beet wild relatives. Special attention is needed in what concerns B. macrocarpa because this is a rare species that also occurs in a sympatric relationship with B. vulgaris subsp. maritima.

1. Introduction

The genus Beta (Amaranthaceae family) is native to Europe, North Africa, and adjacent areas of the East Atlantic Coast, from about 15° N (Cabo Verde Islands) to about 58° N (south of Norway and southern Sweden) and West Asia. Climatic changes contributed to establishing the Iberian Peninsula as a differentiation center and origin of the postglacial northward expansion of plants (e.g., Beta genus) [1,2]. Frese et al. [3] proposed three Beta genepools; the primary ones include Beta vulgaris L. subsp. maritima Arcang. (sea beet), B. vulgaris subsp. vulgaris (cultivated beets), and B. macrocarpa Guss. (large-fruited beet). Sea beet is an outcrossing species and a typical coastal taxon of the Mediterranean basin [4], but it also exists in more continental habitats [5,6,7,8]. Its distribution in mainland Portugal was updated by Monteiro et al. [9]. B. macrocarpa is self-compatible and occurs in the Iberian Peninsula, North Africa, Canary Islands, and West Asia (Mediterranean basin) [10]. In Portugal, it is presently only found in the south, in salt marshes and sandy soils of the Natural Park of Ria Formosa, where it is sympatric with B. vulgaris subsp. maritima [9], and in Castro Marim and Vila Real de Santo António Marsh Natural Reserve. It is at risk of genetic erosion, as its survival is linked to the traditional management of salt winning areas that can be lost with the modernization of sea salt production [11]. Therefore, it was included in the European Red List of Vascular Plants [12] and was recently classified as Vulnerable in the red list of Portuguese vascular plants [10].
Natural polyploids of B. macrocarpa were reported in the Canary Islands by Buttler [13] and Villain et al. [14], who also observed diploid and tetraploid forms in this species. Beta species can interbreed, so the tetraploid type is believed to be a natural amphidiploid between diploid B. macrocarpa and an unknown diploid of the B. vulgaris complex [15]. McFarlane [16] reported on B. vulgaris subsp. Maritima × B. macrocarpa hybrids, stating that they are rare due to the different flowering dates in the two species. The self-fertility of B. macrocarpa is an additional barrier for crossing with B. vulgaris subsp. maritima. Cytogenetic diversity within wild beet populations from Portugal was reported by Castro et al. [17]. Although most of those populations were diploid, some harbored diploids, tetraploids, and hexaploids. The regions where individuals from genetically distinct populations interbreed and form genetically mixed offsprings (hybrid zones) have been recognized to be important for evolutionary studies [18,19].
Sea beet and sugar beet have the same number of chromosomes (2n = 18) [20], but the size of their genome is different, which is 567 Mbp for sea beet [21] and 731 Mbp for sugar beet [22]. The first complete reference genome for B. vulgaris subsp. vulgaris (RefBeet) generated a broad view of genome evolution in Beta [22]. Funk et al. [23] published a new reference genome (EL10.1) that, together with RefBeet, provides new opportunities for studying the content and organization of the beet genome [24].
Beet crops are of great agricultural relevance. Andrello et al. [25], using SNPs, clarified the pattern of genetic structure among beet cultivated groups, and recently, Galewski and McGrath [24] identified two biological groups in the B. vulgaris subsp. vulgaris complex: the table group and a group formed by chard, fodder beet, and sugar beet (sugar and table beet are the most divergent).
The breeding gene pool of sugar beet is narrow, and it is considered that it lacks sufficient genetic variation to cope with stress. Recent results of Abou-Elwafa [26] indicate that sugar beet breeding lines they studied have a promising high degree of genetic variability concerning responses to deficit irrigation. Nonetheless, it is known that introgression subsets of wild relative diversity into crop plants are important in order to incorporate abiotic stress tolerance and other agronomic challenges valuable for increasing the resiliency of agriculture [19]. The wild beet relatives possess a high level of genetic diversity that is important to introduce useful traits in the present breeding programs. Wild beet was already used for sugar beet genetic improvement against pathogens [27], but its potential for improvement against abiotic factors has not yet been exploited. It has been proposed that the ability to accumulate compatible solutes is a breeding goal for abiotic stress tolerance [28]. Biochemical and physiological characterization of Portuguese wild beets from different habitats was performed [8,29], providing evidence of different behavior between salt marsh and inland ecotypes.
B. vulgaris subsp. maritima harbors genetic diversity whose patterns are determined by the mating system [30] and possibly also by marine currents when concerning coastal plant populations [1,31]. To investigate the genetic diversity found within B. vulgaris, molecular markers, such as microsatellites (SSRs), have been used since they yield high content of genetic data [32,33]. SSRs have also been used to investigate the pattern of genetic structuring in natural populations [34,35] and to distinguish varieties [36], to define relationships among populations [37], and as a diagnostic tool in selective breeding [38].
Despite the studies previously performed on the Beta species of the Iberian Peninsula, knowledge is deficient on southwestern populations which were only partially represented. In our work, using SSRs, we present new insights into the genetic diversity, differentiation, and structure of these populations which include coastal and inland B. vulgaris subsp. maritima and B. vulgaris subsp. maritima/B. macrocarpa sympatric populations. In addition, the study includes B. vulgaris subsp. maritima from the Madeira and Azores islands. We envisage eliminating the existing gap and expect that our knowledge will also be useful to define locations to be considered genetic reserves. The conservation and the active management of B. vulgaris subsp. maritima and of the vulnerable B. macrocarpa could then be a more rational procedure.

2. Material and Methods

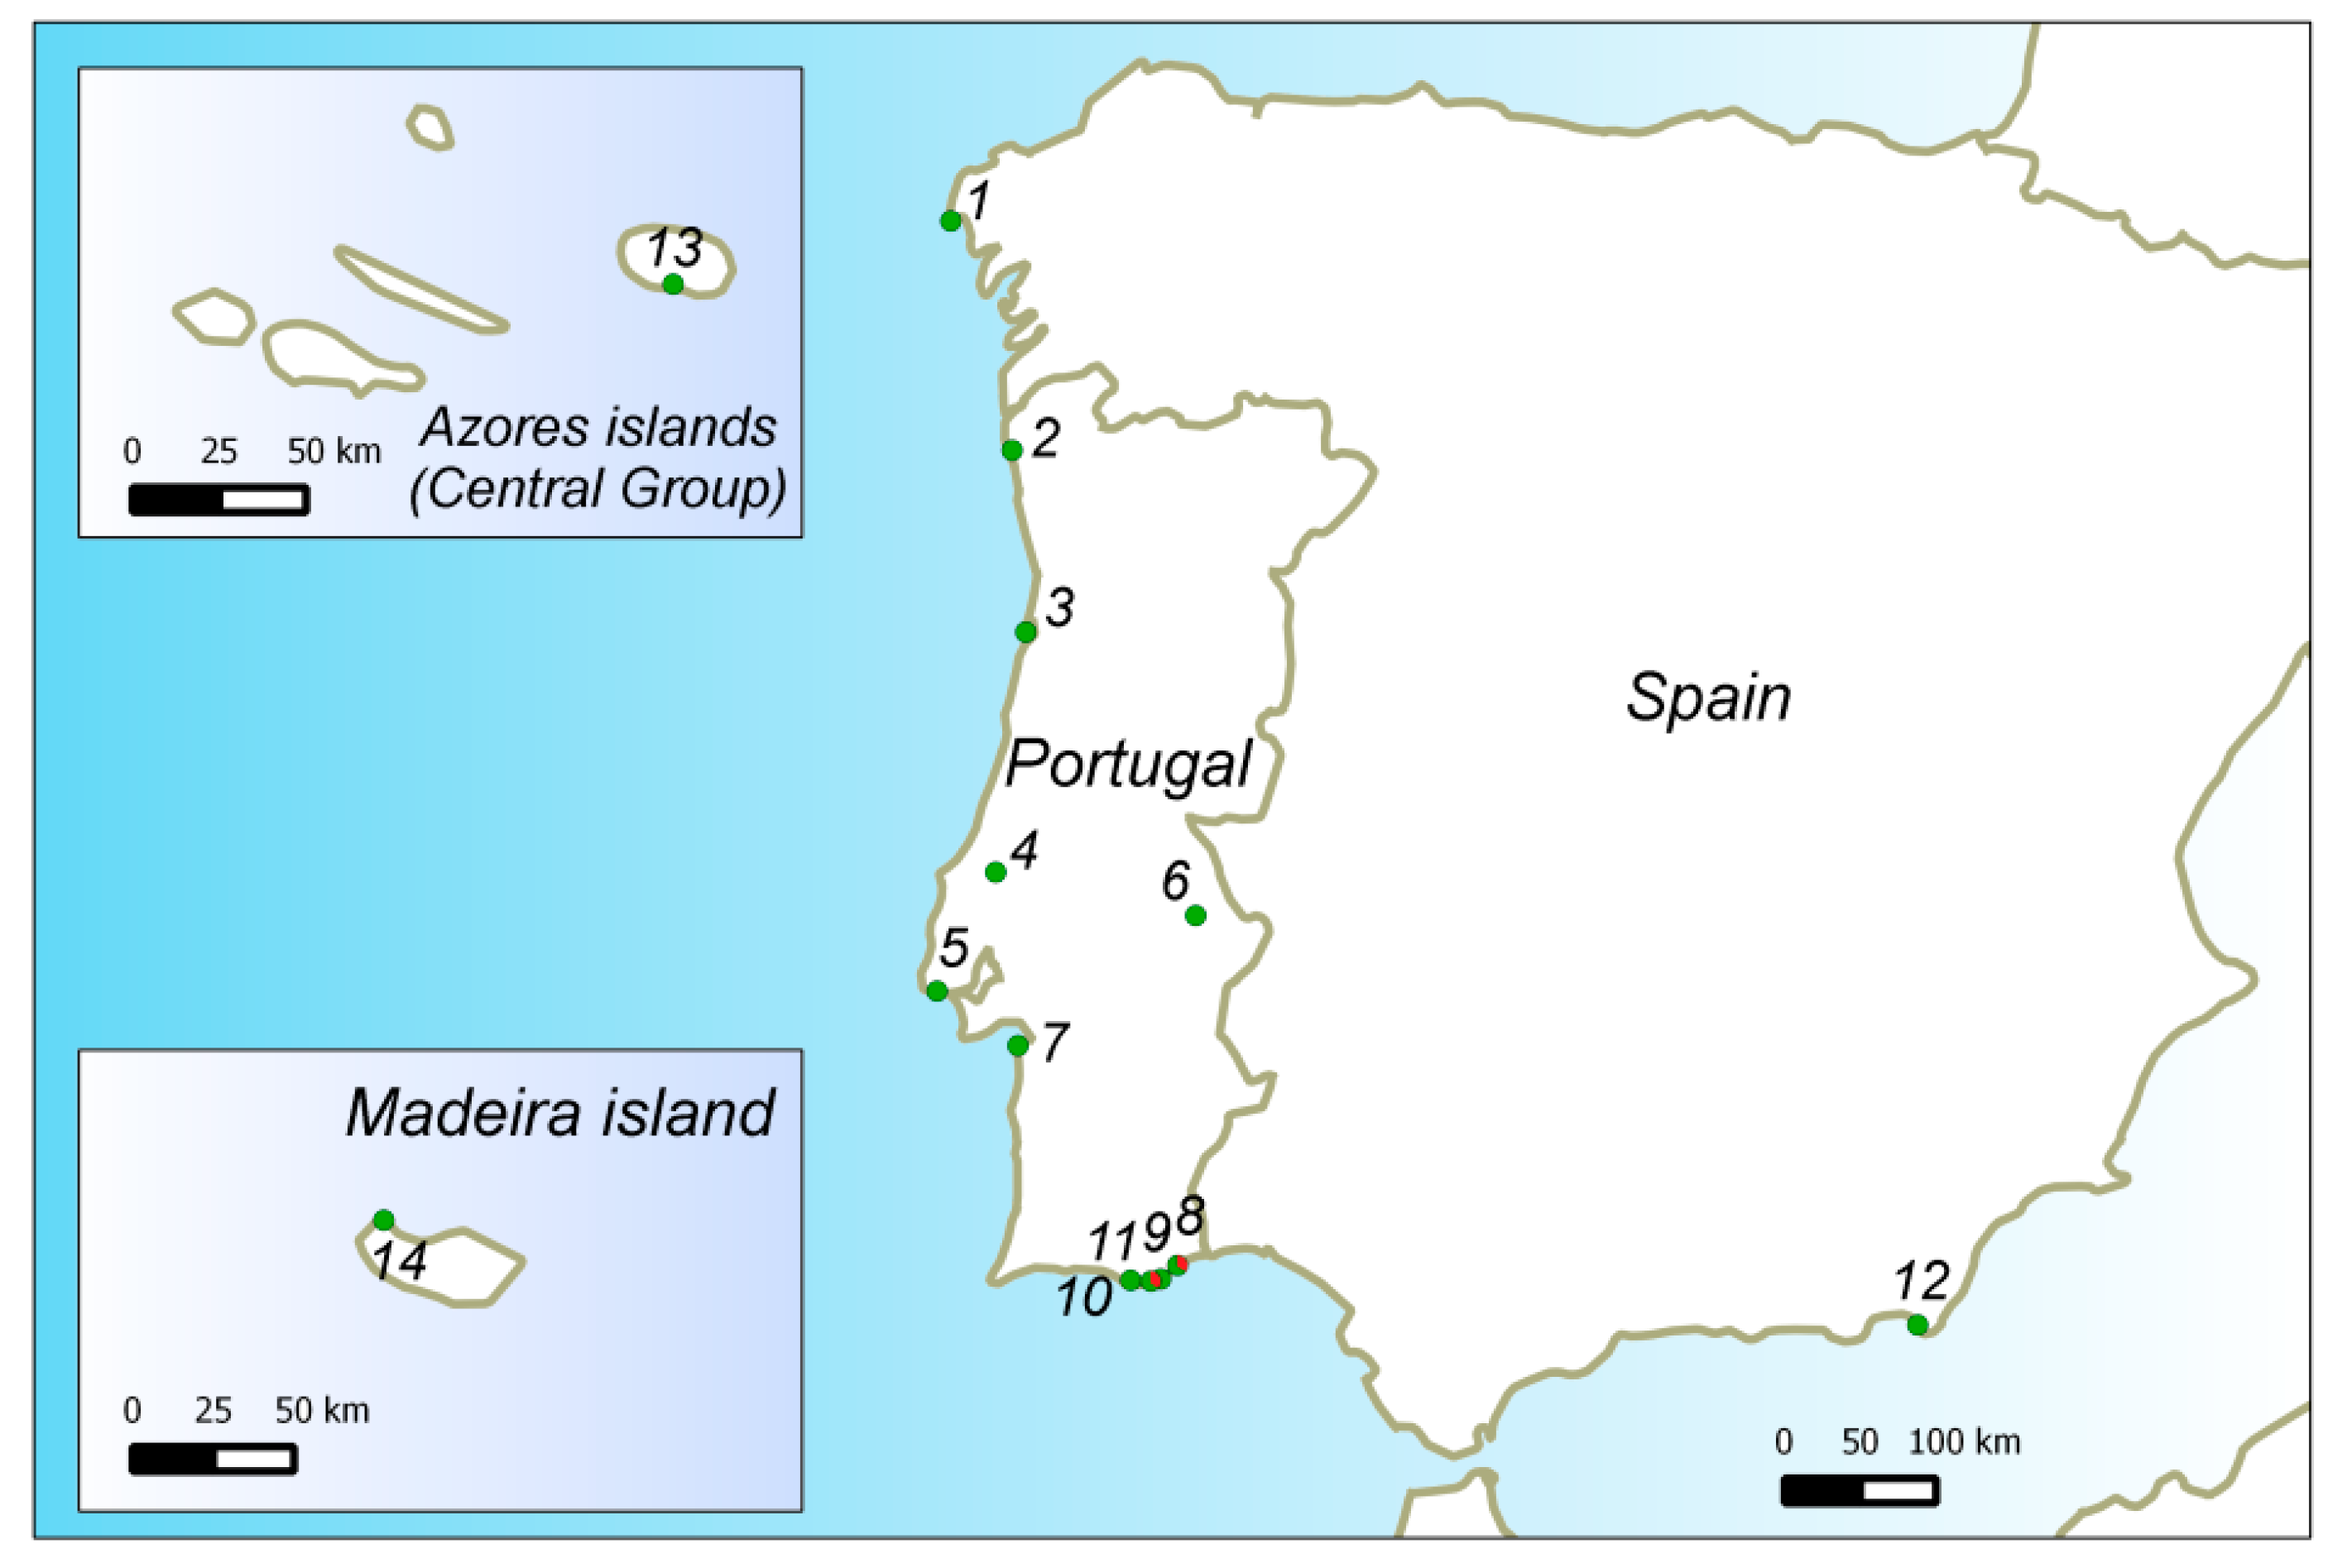
2.1. Plant Material and Sampling

Beta spp. were sampled from 14 different geographical locations (Figure 1): nine locations (1–3, 5, 7–11) from the Iberian Atlantic Coast, extending from the Finisterra Cape (northern Spain) to Tavira (southern Portugal); two locations (4, 6) from inland Portugal, one at a natural salt mine (“Rio Maior”) the other at a pasture land, 200 km east more inland (“Vaiamonte”); two locations from Macaronesian Portuguese Archipelagos, one from the Terceira Island (Azores) (13), other from the Madeira Island (14); one location (12) from the Spain Mediterranean Coast (Gata Cape, Almeria). The Algarve locations of “Tavira” and “Quinta de Marim” (8 and 11) are both B. macrocarpa and B. vulgaris subsp. maritima populations living in sympatry. At these two locations, samples of B. macrocarpa and B. vulgaris subsp. maritima were collected. Details on the sampling locations are shown in Table S1. The field sampling was carried out during surveys performed between 2007 and 2012, following Hawkes et al. [39]. Young leaves from 23–45 plants from each Iberian population and 9 plants from Madeira and 11 plants from the Azores Islands were collected and stored at −80 °C until DNA extraction.

2.2. DNA Extraction, PCR Amplification, and Fragments Sizing

DNA was isolated from young leaves using the DNeasy Plant Mini Kit (QIAGEN GmbH, Hilden, Germany), according to the manufacturer’s protocol. DNA quality and concentration were visually checked on 0.8% agarose gel. DNA concentration was also estimated using a NanoDrop ND2000 spectrophotometer (Thermo Scientific, Waltham, MA, USA).
For Beta genotyping, we used the six SSR loci referred to in our previous work [8], which were developed by Richards et al. [40] from a genomic library of sugar beet, and by McGrath et al. [41] from a mapping population of an intraspecific cross between diploid sugar beet and table beet. The sequences of the primers used are provided in Table S2. PCR was conducted in a final volume of 10 μL containing 20 ng of DNA, 1× reaction buffer, 2.3 mM MgCl2, 0.2 mM dNTPs, 0.25 µM forward primer fluorescently labeled with WellRED dyes (D3 or D4) at the 5′-end and unlabeled reverse primers, and 0.2 units of Taq DNA polymerase (Merck). The PCR was programmed as follows: 3 min at 94 °C for the initial denaturation, followed by 30 cycles of denaturation at 94 °C for 30 s, annealing at optimum Ta for 30 s, and extension at 72 °C for 1 min. A final extension step was at 72 °C for 7 min, and the reaction was finished with a continuous cycle at 4 °C. The reactions were conducted in a Biometra TGradient thermocycler. The PCR reactions were carried out separately for each microsatellite, and mixtures of PCR products of different markers with different dyes (or distinct allele size ranges) were prepared for simultaneous detection of the amplified alleles. Subsequently, 1.0 µL of the PCR mixture was added to 24 µL formamide, and 0.5 µL fragment size standard labeled with WellRED dye D1 (DNA size standard kit, 400, Beckman Coulter, Brea, CA, USA). Capillary electrophoresis was performed to separate the PCR products using the CEQ 8000 Genetic Analysis System (Beckman Coulter Inc., Brea, CA, USA). The sizes of the amplified products were determined based on an internal standard included with each sample. Data analysis was performed using the CEQ 8000 Fragment Analysis software, version 9.0, according to the manufacture’s recommendations (Beckman Coulter Inc., Brea, CA, USA). Sizes of fragments were automatically calculated using the CEQ 8000 Genetic Analysis System.

2.3. Data Analysis

For the interpretation of the results, we performed analyses for the following datasets: the whole Beta spp. populations (northern, southern, and Islands); the northern populations of B. vulgaris subsp. maritima; the southern populations of B. vulgaris subsp. maritima; the southern populations from the Algarve region where B. macrocarpa (“TAVX” and “PMX”) occurs in sympatry with B. vulgaris subsp. maritima (“TAV”, “ML”, “PM”). The latitude of the Geodesic Center of Portugal (Vila de Rei, latitude: 39°41′37″ N) was used to separate the northern populations from the southern ones. The climatic conditions are quite distinct from north to south, being rainier and colder in the north, drier and hotter in the south. Concerning the Islands, the thermal amplitude is small, with a mean temperature ca. 19 °C at Madeira and 17 °C at the Azores; the annual precipitation is higher at the Madeira location (ca. 1000 mm) than at the Azores location (ca. 820 mm).
Microchecker software v2.2.3 [42] was used for the detection of null alleles, stuttering, and allele dropout. GenAlEx 6.503 [43,44] was used to assess the genetic diversity measured as the number of alleles per locus (Na), the number of unique alleles (Npa), and the observed and expected heterozygosity (Ho and He). Allelic richness (Ar) among different populations was calculated following the rarefaction procedure [45]. The rarefaction method allows for comparisons between groups with different sample sizes. The genetic distance between each pair of individuals was calculated following the Nei methodology [46]. This analysis was performed based on the SSR genotypes with two alleles, excluding those genotypes for which a third allele was observed for one or more loci. The differentiation between the populations was estimated using Wright´s FST and Slatkin’s RST, and the analysis of molecular variances (AMOVA) was calculated using GenAlEx 6.503, with 999 permutations for testing variance components. FST results were interpreted following Del Carpio et al. [47], where 0 indicates no differentiation between populations, and a value of 1 indicates complete differentiation. Populations were considered to have great differentiation when FST values were between 0.15 and 0.25, moderate differentiation when FST values were between 0.05 and 0.15, and little differentiation when FST values were less than 0.05.
The neighbor-joining algorithm, as implemented in the DARwin software package version 6.0.12 [48], was based on a dissimilarity matrix, and the reliability of the tree topology was assessed via bootstrapping over 1000 replicates.
Regarding the PCoA, the distance matrix was calculated following Peakall and Smouse [44].
The level of genetic stratification among the studied germplasm was assessed using the STRUCTURE v.2.3.4 software [49]. This analysis was performed based on the SSR genotypes with two alleles, excluding those genotypes for which a third allele was observed for one or more loci. The analysis was performed considering both the admixture model and the correlated allele frequencies between populations, with values of K set from 1 to 17. The population information was incorporated into the analyses (LOCPRIOR model). Each run consisted of a burn-in period of 104 steps, followed by 106 MCMC (Monte Carlo Markov Chain) replicates assuming admixture model and correlated allele frequencies. K is the probable maximum population number that is assumed to represent and contribute to the genotypes of sampled individuals. To check the consistency of the results between runs with the same K, 17 replicates were run for each assumed K value. The approach suggested by Evanno et al. [50] was adopted to calculate the most likely value of K based on the second-order rate of change of the likelihood function with respect to K (DK). Once the number of genetic clusters was established, each individual was assigned to a cluster, and the overall membership of each sampled individual in the cluster was estimated.

3. Results

3.1. Overall Genetic Diversity

The genetic diversity of the wild beet populations was studied through a microsatellite analysis procedure similar to that one previously reported [8]. The six loci utilized (SB04, SB06, SB07, SB13, SB15, and BQ588629) amplified a total of 100 alleles, with an average of 16.7 alleles, ranging from 7 (SB13) to 25 (BQ588629) and with an average number of effective alleles (Ne) of 3.6. The polymorphism information content (PIC) ranged from 0.56 (SB13) to 0.90 (SB07) (Table 1), indicating that the used loci displayed a high level of variability and are useful diversity indicators, and it is evident that the locus SB07 displayed the highest values of Ne, He and PIC, while the locus SB13 displayed the lowest values (Table 1).
The overall genetic parameters of all the populations (Table 2 and Table S3) express the existence of a considerable genetic diversity for the B. vulgaris subsp. maritima populations. The observed heterozygosity (Ho) (mean of 0.66) and the expected heterozygosity (He) (mean of 0.71) were both high, although there was a difference between the northern and southern populations, generally higher in the south.
The number of alleles and the diversity (He) was lower in the northern than in the southern populations. Contrarily, the allelic richness (Ar) decreased with increased latitude. The inbreeding coefficient (F), for B. vulgaris subsp. maritima, exhibited values ranging from 0.000 (“AVE”) to 0.190 (“ALM”). Values close to zero indicated random mating in the populations “VCA”, “AVE”, “RIO”, “OEI”, “CMP”, “FUS” and “AZO”, while substantial positive values in the “ALM”, “ML” and “VMT” populations indicated interbreeding. The F negative value for “PMX” (B. macrocarpa) can be indicative of more heterozygotes than expected. When comparing genetic diversity of B. vulgaris subsp. maritima and B. macrocarpa (“TAVX” and “PMX”), it is evident that B. macrocarpa had lower values, which is typical of an inbreeding species. Polyploids were detected in “TAV” and “PM” locations (data not shown).

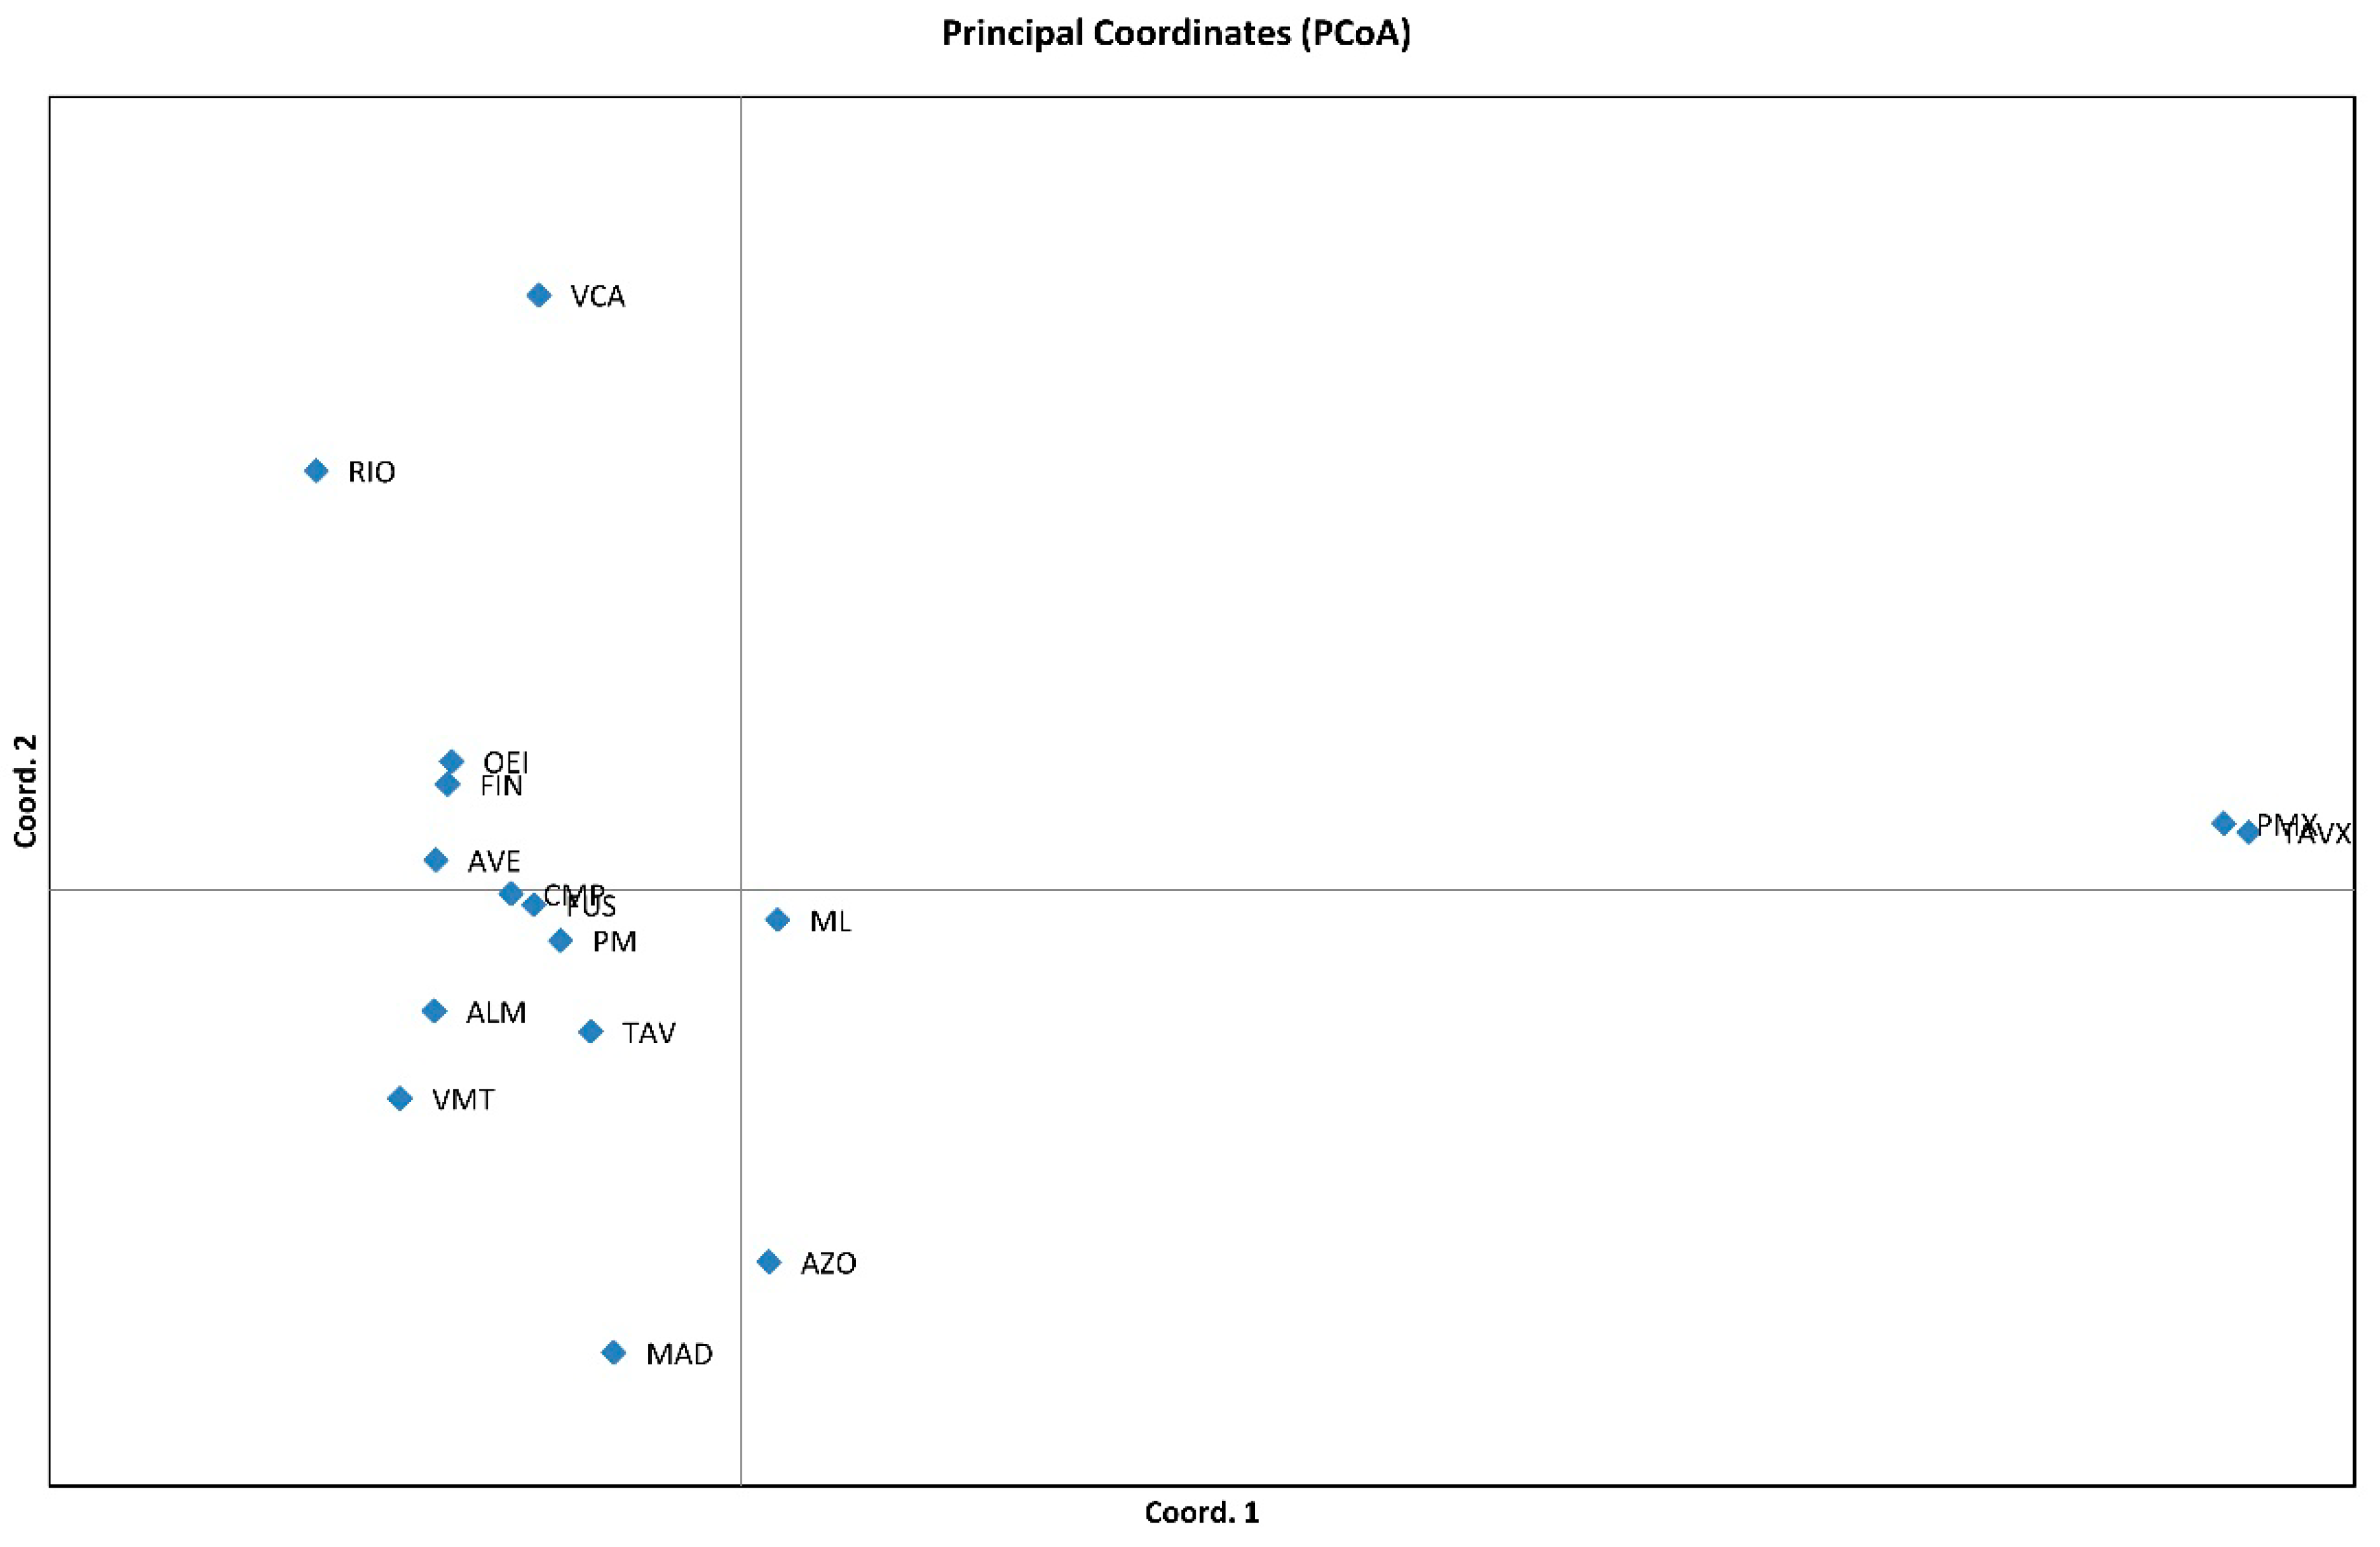
3.2. Genetic Relationships among Genotypes

The neighbor-joining tree generated from the genetic distance matrix corresponding to 390 samples illustrates the relationships among all the studied beets. When visualizing the population tree, no clear clustering emerged. Bootstrap values rarely reached 50%, indicating a low degree of resolution of the dendrogram. The exception is the set of 39 plants [16 from Quinta do Marim (“PMX”) and 23 from Tavira (“TAVX”)] that are in a separate branch from all the other plants, due to the fact that all of them are B. macrocarpa. All these beets have the same genotype (Table S3). When analyzing separately the northern and southern populations of B. vulgaris subsp. maritima, it is clear that no cluster groups were evident for the south in contrast to what was observed for the northern populations (“FIN”, “VCA” and “AVE”) (Figure S1A,B).
A PCoA analysis of the overall populations explained 63.60% of the variation in the first two axes, 50.75% in the first coordinate, and 12.85% in the second coordinate. Since “PMX” and “TAVX” are B. macrocarpa, they were only tenuously separated from each other but were the most distant from all the other populations. It is visible that “VCA”, “RIO”, “MAD”, and “AZO” were separated from each other and from the cloud of the remaining 10 B. vulgaris subsp. maritima populations. The two inland populations, “RIO” and “VMT”, although having similar values at coordinate 1, had markedly different values at coordinate 2. The islands populations, “MAD” and “AZO”, were relatively close to each other (Figure 2).

3.3. Differentiation of the Populations

Wright’s FST and Slatkin’s RST were used as a measure of the extent of the genetic differentiation among the populations. A highly pairwise differentiation (FST ranging from 0.619 to 0.346; RST ranging from 0.591 to 0.241) was detected between the B. vulgaris subsp. maritima populations and the B. macrocarpa populations. A great differentiation (FST ranging from 0.277 to 0.184; RST ranging from 0.294 to 0.106) was observed among the northern populations of B. vulgaris subsp. maritima. In contrast, only a small differentiation (FST ranging from 0.000 to 0.026; RST ranging from 0.005 to 0.063) was detected among the southern B. vulgaris subsp. maritima populations, suggesting the existence of close genetical affinities among these populations. The inland B. vulgaris subsp. maritima populations “RIO” and “VMT” had great differentiation values (FST = 0.156 and RST = 0.145). The same was observed (FST = 0.273 and RST = 0.178) with the two islands populations “AZO” and “MAD” (Table S4).
The analysis of molecular variance (AMOVA) indicated that the highest value of molecular variation was always found within individuals. When only the B. vulgaris subsp. maritima is considered, it is found that the value of this estimator was highest for its southern populations (88%). Considering the Algarve region, where the two Beta species (“TAV”, “TAVX”, “PM”, and “PMX”) live in sympatry, a variation value of 65% was observed. AMOVA also indicated that the variation among populations of B. vulgaris subsp. maritima was 4% in the south and 23% in the north (Table 3).

3.4. Genetic Structure

The Bayesian approach indicated that the most likely number of genetic clusters was K = 2 (Delta K = 131.81), while the second-best solution was K = 3 (Delta K = 2.88), and the third solution was K = 5 (Delta K = 1.45) (Figure 3 and Figure S2). Based on the results of the STRUCTURE analysis, it was considered that accession with a score higher than 0.80 was pure, while that with a lower score was considered to be admixed.
The two groups assigned at K = 2 correspond to B. vulgaris subsp. maritima populations (red color) and B. macrocarpa (green color). B. vulgaris subsp. maritima and B. macrocarpa were living in sympatry at Tavira and Quinta de Marim.
At k = 3, the clustering of B. vulgaris subsp. maritima populations is represented by two colors, green and blue, and B. macrocarpa by the red color. The B. vulgaris subsp. maritima populations that we considered pure were “FIN”, “VMT”, “CMP”, “TAV”, “FUS”, “PM”, “ALM” and “MAD”, for the blue color, “VCA” and “RIO” for the green color, and the B. macrocarpa populations “TAVX” and “PMX” for the red color. All other B. vulgaris subsp. maritima populations had some degree of admixture. The effect of introgression between B. vulgaris subsp. maritima and B. macrocarpa was also evident, with higher intensity in population “ML”. An important observation is that the two inland B. vulgaris subsp. maritima populations “RIO” and “VMT” were distinct from each other, which also occurred with the islands’ populations “AZO” and MAD”. K = 5 further indicates that the northern B. vulgaris subsp. maritima populations were less admixed than the southern ones. The genetic introgression between B. vulgaris subsp. maritima and B. macrocarpa was also revealed at “ML”, “TAV”, and “PM”.

4. Discussion

The genetic diversity of wild beet was previously studied using SSRs—namely, in some regions of the Iberian Peninsula [1]. However, studies concerning Portugal were only partial, and in our work, we present new insights into the diversity of wild beet by studying coastal, inland, and islands B. vulgaris subsp. maritima populations and also sympatric B. vulgaris subsp. maritima/B. macrocarpa populations from the southern coast of the country.
The observed high level of genetic diversity for B. vulgaris subsp. maritima and the low level of genetic diversity for B. macrocarpa could be explained by the distinct reproductive systems (outcrossing in B. vulgaris subsp. maritima and selfing pollination in B. macrocarpa). Outcrossing populations had greater allelic diversity, higher levels of heterozygosity, and showed lesser differentiation among populations [51]. These observations are in accordance with previous work [1,32,33,52], which also showed higher genetic diversity for the southern populations than for the northern ones, in several European regions and North Africa [1,33]. The Almeria (“ALM”) value, the only Mediterranean sample that we studied, presented a similar He to that of our southern populations, which contrasts with the results obtained by Richards et al. [33] for the Mediterranean wild beet. Future studies, including more samples from the Mediterranean coast, are needed to evaluate the significance of this discrepancy.
Considering the inbreeding coefficient (F), its greater than zero value observed for “FIN”, “VMT”, “ALM”, and “MAD” could be due to their geographic isolation. “FIN” and “ALM” were at Langosteira beach (Finisterra, Spain) and Cabo da Gata beach (Almeria, Spain), respectively, and “VMT” is an inland ruderal and isolated population, and “MAD” is an island population. The high F value for the B. vulgaris subsp. maritima “ML” is interesting since it is not an isolated population; furthermore, we did not detect in the field the presence of B. macrocarpa, but the results show that there was hybridization with this species (Figure 3). Possibly, this is an influence from the B. macrocarpa “PMX” population, which is located only ca. 5 Km away.
Several studies have revealed shared DNA polymorphisms between closed related species [17,53,54,55,56], with natural interspecific hybridization being estimated as approximately 25% of all plant species [57]. Genetic admixture and interspecific hybridization also occurred in the B. vulgaris subsp. maritima populations in the southern Portuguese region. The introgression was mostly detected in zones of sympatric distribution, meaning that no genetic barriers exist between B. vulgaris subsp. maritima and B. macrocarpa present in these locations. Indeed, it was shown that Beta section hybridization presents no major problems [58] and that genes may be exchanged uni- or bidirectionally [59]. Natural hybrids involving B. macrocarpa were reported by McFarlane [16], who stated that they are rare only due to differing flowering dates of parental species. One of the most widely recognized short-term benefits of admixture is heterosis and the emergence of novel phenotypes, which may increase the overall population genetic variance, resulting in a higher capacity to respond to selection pressure [60] fitness and adaptive responses [61,62].
Since B. vulgaris subsp. maritima from “TAV” and “ALM” locations had the highest number of unique alleles, these populations may need particular attention when defining a conservative strategy for the Beta species, as was previously proposed by Roussel et al. [62].
The B. macrocarpa populations were rather distinct from all the other populations when considering the genetic relationships among the genotypes, and all their 39 accessions had a close genetic relationship among them. It is evident that this resulted from the fact that these populations were the most divergent of all our studied beets. The lack of clear clustering patterns for the remaining B. vulgaris subsp. maritima populations is a consequence of the outcrossing biology of this beet, similarly to what was referred to for other species [63,64].
FST and RST are useful differentiation estimators, commonly used to describe population structuring [65,66]. A high degree of genetic differentiation was found when comparing B. macrocarpa with B. vulgaris subsp. maritima. B. macrocarpa was also shown to have a very low genetic variation, as a consequence of its reproductive system. Previous work for these two species reached identical conclusions when using nuclear SSRs and DArT markers [1,52]. The FST value we observed for the northern B. vulgaris subsp. maritima populations could be the result of a certain degree of geographic isolation of these populations. However, the same did not apply to B. vulgaris subsp. maritima southern populations. Therefore, according to the standards of Del Carpio et al. [47] and Mohammadi and Prasanna [67], the northern populations had a great differentiation that was not observed in the southern populations.
In our study, the clinal variation was only visible at K = 3 and K = 5, which contrasts with Andrello et al. [52] results that showed clinal variation at K = 2.
AMOVA results demonstrated that molecular variation was mainly found within individuals, as expected for an outcrossing species [24,63,68].
The distinct mating system of the two species (B. vulgaris subsp. maritima and B. macrocarpa) is also the cause of the distinct genetic structure we observed for each of the three different K values used. It is known that the breeding system and the gene flow have major evolutionary effects on population genetic structure [69,70]. It is also evident the effect of introgression between B. vulgaris subsp. maritima and B. macrocarpa, with higher intensity in the “ML” population, visible for all values of K.
Contrarily to the coastal beets, the origin of the Portuguese inland beets is presently unknown. It has been suggested that ruderal beets can result from cultivar seed escape [7], a hypothesis also supported by Saccomani et al. [69] for Italian ruderal beets. However, the “VMT” beets cannot be viewed as the result of seed escape since there is no report of sugar beet cultivation nearby [8]. We considered the possibility of some other anthropogenic influence. To clarify its origin as well as the origin of the “RIO” (also an inland beet), cytoplasmic DNA markers should be used in order to unravel their maternal origin, because the seed dispersal is a determinant of the genetic structure [70].
Concerning the populations from the islands, our STRUCTURE results (K = 3 and K = 5) indicate that while “MAD” was related to the southern populations, “AZO” was related to the northern populations (particularly to the “AVE” population). Admitting sea current dispersal suggested by Leys et al. [1], it is interesting to note that they resulted from two distinct Atlantic sea currents.

5. Conclusions

SSRs are useful tools for studying genetic diversity, even the limited number we used. We could discriminate the beet populations of northern and southern western Iberia and of the Madeira and Azores islands. The importance of some of these populations justifies the concern about their conservation. When selecting conservation sites one must consider the population´s total diversity and the allelic richness [71]. The B. vulgaris subsp. maritima southern populations were inferred to have the greatest contribution to total diversity. In addition, the beets of the southern coast of Portugal (particularly, from the Algarve region) should be further investigated as potential sites for in situ conservation due to the B. vulgaris subsp. maritima/B. macrocarpa genetic introgression. Furthermore, since B. macrocarpa is a threatened species, red listed as Vulnerable in Portugal, only present at salt marshes, it needs special attention for its conservation.
Wild beets are relevant genetic reservoirs for sugar beet improvement. Therefore, from the breeding point of view, conducting a close study on a particular population would be advisable when carrying out crop genetic improvement. Drought is a major constraint for sugar beet production, and the specific habitats of some western Iberia wild beets indicate they could have important characteristics for resistance to this and other abiotic stresses. A deeper study to fully evaluate the agronomic potential of these native populations is justified.

Supplementary Materials

The following are available online at https://www.mdpi.com/article/10.3390/d13110593/s1, Table S1: Sampling locations, Table S2: Primer sequence information, Table S3: SSR screening of 390 Beta spp. accessions using 6 loci, Table S4: Pairwise FST and RST matrix for all the populations, Figure S1: Neighbor-joining dendrogram for northern (A) and southern (B) populations, Figure S2: Exploration of K values for STRUCTURE analysis of Beta spp. accessions.

Author Contributions

Conceptualization, M.M.V. and M.C.D.; methodology, M.M.V., M.C.D. and D.E.-S.; software, J.B.G. and O.S.P.; validation, M.M.V., J.B.G. and O.S.P.; formal analysis, C.M.R., M.C.S.-C. and I.E.; investigation, M.M.V.; resources, M.M.V., M.C.D., C.P.-R. and D.E.-S.; writing—original draft preparation, M.M.V.; writing—review and editing, C.P.-R. and M.C.D.; supervision, M.M.V.; project administration, M.C.D.; funding acquision, M.C.D. and M.M.V. All authors have read and agreed to the published version of the manuscript.

Funding

This research was funded by Fundação para a Ciência e a Tecnologia, project PTDC/AGR-AAM/73144/2006. C.M.R. received the grant number INRB L-INIA-LRG/INRB-BI 1/20.

Institutional Review Board Statement

Not applicable.

Informed Consent Statement

Not applicable.

Data Availability Statement

The data presented in this study are available on request from the corresponding author. The data are not publicly available due to they are stored in a computer from Instituto Nacional de Investigação Agrária e Veterinária, at Oeiras, Portugal.

Acknowledgments

The authors thank J. A. Passarinho for help in plant sampling and M. M. Romeiras for the kind gift of the Azores samples; Pedro Duarte for preparing the graphic of sampling locations. We are also grateful to L. Freese for his important consultant role during the whole project.

Conflicts of Interest

The authors declare no conflict of interest.

References

  1. Leys, M.; Petit, E.J.; El-Bahloul, Y.; Liso, C.; Fournet, S.; Arnaud, J. Spatial genetic structure in Beta vulgaris subsp. maritima and Beta macrocarpa reveals the effect of contrasting mating system, influence of marine currents, and footprints of postglacial recolonization routes. Ecol. Evol. 2014, 4, 1828–1852. [Google Scholar] [CrossRef] [PubMed]
  2. Hewitt, G. The Genetic Legacy of the Quaternary Ice Ages. Nature 2000, 405, 907–913. [Google Scholar] [CrossRef] [PubMed]
  3. Frese, L.; Desprez, B.; Ziegler, D. Potential of genetic resources and breeding strategies for base-broadening in Beta. In Broadening the Genetic Base of Crop Production; Cooper, H.D., Spillane, C., Hodgkin, T., Eds.; CABI: Wallingford, UK, 2001; pp. 295–309. ISBN 978-0-85199-411-6. [Google Scholar]
  4. Biancardi, E.; Panella, L.W.; Lewellen, R.T. Beta maritima; Springer: New York, NY, USA, 2012; ISBN 978-1-4614-0841-3. [Google Scholar]
  5. Mörchen, M.; Cuguen, J.; Michaelis, G.; Hänni, C.; Saumitou-Laprade, P. Abundance and Length Polymorphism of Microsatellite Repeats in Beta vulgaris L. Theor. Appl. Genet. 1996, 92, 326–333. [Google Scholar] [CrossRef]
  6. Desplanque, B.; Boudry, P.; Broomberg, K.; Saumitou-Laprade, P.; Cuguen, J.; Van Dijk, H. Genetic Diversity and Gene Flow between Wild, Cultivated and Weedy Forms of Beta vulgaris L. (Chenopodiaceae), Assessed by RFLP and Microsatellite Markers. Theor. Appl. Genet. 1999, 98, 1194–1201. [Google Scholar] [CrossRef]
  7. Arnaud, J.-F.; Fénart, S.; Godé, C.; Deledicque, S.; Touzet, P.; Cuguen, J. Fine-Scale Geographical Structure of Genetic Diversity in Inland Wild Beet Populations. Mol. Ecol. 2009, 18, 3201–3215. [Google Scholar] [CrossRef] [PubMed]
  8. Ribeiro, I.C.; Pinheiro, C.; Ribeiro, C.M.; Veloso, M.M.; Simoes-Costa, M.C.; Evaristo, I.; Paulo, O.S.; Ricardo, C.P. Genetic Diversity and Physiological Performance of Portuguese Wild Beet (Beta vulgaris spp. maritima) from Three Contrasting Habitats. Front. Plant Sci. 2016, 7, 1293. [Google Scholar] [CrossRef] [Green Version]
  9. Monteiro, F.; Romeiras, M.M.; Batista, D.; Duarte, M.C. Biodiversity Assessment of Sugar Beet Species and Its Wild Relatives: Linking Ecological Data with New Genetic Approaches. Am. J. Plant Sci. 2013, 04, 21–34. [Google Scholar] [CrossRef] [Green Version]
  10. Carapeto, A.; Francisco, A.; Pereira, P.; Porto, M. (Eds.) Lista Vermelha Da Flora Vascular de Portugal Continental. Sociedade Portuguesa de Botânica, Associação Portuguesa de Ciência Da Vegetação PHYTOS e Instituto Da Conservação Da Natureza e Das Florestas (Coord.). Coleção «Botânica Em Português»; Imprensa Nacional: Lisboa, Portugal, 2000; Volume 7, ISBN 978-972-27-2876-8.
  11. Frese, L. Rationale for in Situ Management of Wild Beta Species. Crop Wild Relat. 2004, 2, 4–7. [Google Scholar]
  12. Bilz, M.; Kell, S.P.; Maxeted, N.; Landsdown, R.V. European Red List of Vascular Plants; Publications Office of the European Union: Luxembourg, 2011; ISBN 978-92-79-20199-8. [Google Scholar] [CrossRef]
  13. Buttler, K.P. Variation in Wild Populations of Annual Beet (Beta, Chenopodiaceae). Plant Syst. Evol. 1977, 128, 123–136. [Google Scholar] [CrossRef]
  14. Villain, S.; Touzet, P.; Cuguen, J. Reconstructing the Evolutionary History of Beta Section Beta with Molecular Data: A Focus on the Canary Islands. In Report of a Working Group on Beta and the World Beta Network, Proceedings of the Third Joint Meeting, Puerto Cruz, Spain, 8–11 March 2006; Bioversity International: Rome, Italy, 2009; pp. 31–37. Available online: http://www.ecpgr.cgiar.org/fileadmin/bioversity/publications/pdfs/1353_Report_Working_Group_Beta_World_Beta_Network.pdf (accessed on 18 July 2020).
  15. Abe, J.; Tsuda, C. Distorted Segregation in the Backcrossed Progeny between Beta vulgaris L. and B. macrocarpa Guss. Ikushugaku Zasshi 1988, 38, 309–318. [Google Scholar] [CrossRef] [Green Version]
  16. McFarlane, J.S. Naturally Occurring Hybrids between Sugarbeet and Beta macrocarpa in the Imperial Valley of California. J. Am. Soc. Sugar Beet Technol. 1975, 18, 245–251. Available online: https://agris.fao.org/agris-search/search.do?recordID=US19760083471 (accessed on 9 December 2020). [CrossRef]
  17. Castro, S.; Romeiras, M.M.; Castro, M.; Duarte, M.C.; Loureiro, J. Hidden Diversity in Wild Beta Taxa from Portugal: Insights from Genome Size and Ploidy Level Estimations Using Flow Cytometry. Plant Sci. 2013, 207, 72–78. [Google Scholar] [CrossRef] [PubMed]
  18. Anderson, E.C.; Thompson, E.A. A Model-Based Method for Identifying Species Hybrids Using Multilocus Genetic Data. Genetics 2002, 160, 1217–1229. [Google Scholar] [CrossRef]
  19. Warschefsky, E.; Penmetsa, R.V.; Cook, D.R.; Wettberg, E.J.B. von Back to the Wilds: Tapping Evolutionary Adaptations for Resilient Crops through Systematic Hybridization with Crop Wild Relatives. Am. J. Bot. 2014, 101, 1791–1800. [Google Scholar] [CrossRef] [PubMed]
  20. Paesold, S.; Borchardt, D.; Schmidt, T.; Dechyeva, D. A sugar beet (Beta vulgaris L.) reference FISH karyotype for chromosome and chromosome arm identification, integration of genetic linkage groups and analysis of major repeat family distribution. Plant J. 2012, 72, 600–611. [Google Scholar] [CrossRef]
  21. Del Rio, A.R.; Minoche, A.E.; Zwickl, N.F.; Friedrich, A.; Liedtke, S.; Schmidt, T.; Himmelbauer, H.; Dohm, J.C. Genomes of the wild beets Beta patula and Beta vulgaris ssp. maritima. Plant J. 2019, 99, 1242–1253. [Google Scholar] [CrossRef] [PubMed] [Green Version]
  22. Dohm, J.C.; Minoche, A.E.; Holtgrawe, D.; Capella-Gutierrez, S.; Zakrzewski, F.; Tafer, H.; Rupp, O.; Sörensen, T.R.; Stracke, R.; Reinhardt, R.; et al. The genome of the recently domesticated crop plant sugar beet (Beta vulgaris). Nature 2014, 505, 546–549. [Google Scholar] [CrossRef] [Green Version]
  23. Funk, A.; Galewski, P.; McGrath, J.M. Nucleotide-binding resistance gene signatures in sugar beet, insights from a new reference genome. Plant J. 2018, 95, 659–671. [Google Scholar] [CrossRef] [PubMed]
  24. Galewski, P.; McGrath, J.M. Genetic Diversity among Cultivated Beets (Beta vulgaris) Assessed via Population-Based Whole Genome Sequences. BMC Genom. 2020, 21, 189. [Google Scholar] [CrossRef] [PubMed] [Green Version]
  25. Andrello, M.; Henry, K.; Devaux, P.; Verdelet, D.; Desprez, B.; Manel, S. Insights into the Genetic Relationships among Plants of Beta Section Beta Using SNP Markers. Theor. Appl. Genet. 2017, 130, 1857–1866. [Google Scholar] [CrossRef]
  26. Abou-Elwafa, S.F.; Amin, A.E.A.; Eujayl, I. Genetic diversity of sugar beet under heat stress and deficit irrigation. Agron. J. 2020, 112, 3579–3590. [Google Scholar] [CrossRef]
  27. Panella, L.; Lewellen, R.T. Broadening the Genetic Base of Sugar Beet: Introgression from Wild Relatives. Euphytica 2007, 154, 383–400. [Google Scholar] [CrossRef]
  28. Wu, G.-Q.; Wang, C.-M.; Su, Y.-Y.; Zhang, J.-J.; Feng, R.-J.; Liang, N. Assessment of Drought Tolerance in Seedlings of Sugar Beet (Beta vulgaris L.) Cultivars Using Inorganic and Organic Solutes Accumulation Criteria. Soil Sci. Plant Nutr. 2014, 60, 565–576. [Google Scholar] [CrossRef] [Green Version]
  29. Pinheiro, C.; Ribeiro, I.C.; Reisinger, V.; Planchon, S.; Veloso, M.M.; Renaut, J.; Eichacker, L.; Ricardo, C.P. Salinity Effect on Germination, Seedling Growth and Cotyledon Membrane Complexes of a Portuguese Salt Marsh Wild Beet Ecotype. Theor. Exp. Plant Physiol. 2018, 30, 113–127. [Google Scholar] [CrossRef]
  30. Duminil, J.; Hardy, O.J.; Petit, R.J. Plant Traits Correlated with Generation Time Directly Affect Inbreeding Depression and Mating System and Indirectly Genetic Structure. BMC Evol. Biol. 2009, 9, 177. [Google Scholar] [CrossRef] [PubMed]
  31. Rodríguez-Sánchez, F.; Pérez-Barrales, R.; Ojeda, F.; Vargas, P.; Arroyo, J. The Strait of Gibraltar as a Melting Pot for Plant Biodiversity. Quat. Sci. Rev. 2008, 27, 2100–2117. [Google Scholar] [CrossRef]
  32. Fénart, S.; Arnaud, J.-F.; De Cauwer, I.; Cuguen, J. Nuclear and Cytoplasmic Genetic Diversity in Weed Beet and Sugar Beet Accessions Compared to Wild Relatives: New Insights into the Genetic Relationships within the Beta vulgaris Complex Species. Theor. Appl. Genet. 2008, 116, 1063–1077. [Google Scholar] [CrossRef]
  33. Richards, C.M.; Reeves, P.A.; Fenwick, A.L.; Panella, L. Genetic Structure and Gene Flow in Beta vulgaris subspecies maritima along the Atlantic Coast of France. Genet. Resour. Crop Evol. 2014, 61, 651–662. [Google Scholar] [CrossRef]
  34. Fievet, V.; Touzet, P.; Arnaud, J.-F.; Cuguen, J. Spatial Analysis of Nuclear and Cytoplasmic DNA Diversity in Wild Sea Beet (Beta vulgaris ssp. maritima) Populations: Do Marine Currents Shape the Genetic Structure? Mol. Ecol. 2007, 16, 1847–1864. [Google Scholar] [CrossRef]
  35. Manel, S.; Schwartz, M.K.; Luikart, G.; Taberlet, P. Landscape Genetics: Combining Landscape Ecology and Population Genetics. Trends Ecol. Evol. 2003, 18, 189–197. [Google Scholar] [CrossRef]
  36. Smulders, M.J.; Esselink, G.D.; Everaert, I.; De Riek, J.; Vosman, B. Characterisation of Sugar Beet (Beta vulgaris L. ssp. vulgaris) Varieties Using Microsatellite Markers. BMC Genet. 2010, 11, 41. [Google Scholar] [CrossRef] [PubMed] [Green Version]
  37. Parker, P.G.; Snow, A.A.; Schug, M.D.; Booton, G.C.; Fuerst, P.A. What Molecules Can Tell Us About Populations: Choosing and Using a Molecular Marker. Ecology 1998, 79, 361–382. [Google Scholar] [CrossRef]
  38. Abbasi, Z.; Majidi, M.M.; Arzani, A.; Rajabi, A.; Mashayekhi, P.; Bocianowski, J. Association of SSR Markers and Morpho-Physiological Traits Associated with Salinity Tolerance in Sugar Beet (Beta vulgaris L.). Euphytica 2015, 205, 785–797. [Google Scholar] [CrossRef]
  39. Hawkes, J.G.; Maxted, N.; Ford-Lloyd, B.V. The Ex Situ Conservation of Plant Genetic Resources; Springer: Amsterdam, The Netherlands, 2000; ISBN 978-0-7923-6442-9. [Google Scholar]
  40. Richards, C.M.; Brownson, M.; Mitchell, S.E.; Kresovich, S.; Panella, L. Polymorphic Microsatellite Markers for Inferring Diversity in Wild and Domesticated Sugar Beet (Beta vulgaris). Mol. Ecol. Notes 2004, 4, 243–245. [Google Scholar] [CrossRef]
  41. McGrath, J.M.; Trebbi, D.; Fenwick, A.; Panella, L.; Schulz, B.; Laurent, V.; Barnes, S.; Murray, S.C. An Open-Source First-Generation Molecular Genetic Map from a Sugarbeet × Table Beet Cross and Its Extension to Physical Mapping. Crop Sci. 2007, 47, S27–S44. [Google Scholar] [CrossRef]
  42. Oosterhout, C.V.; Hutchinson, W.F.; Wills, D.P.M.; Shipley, P. Micro-Checker: Software for Identifying and Correcting Genotyping Errors in Microsatellite Data. Mol. Ecol. Notes 2004, 4, 535–538. [Google Scholar] [CrossRef]
  43. Peakall, R.; Smouse, P.E. Genalex 6: Genetic Analysis in Excel. Population Genetic Software for Teaching and Research. Mol. Ecol. Notes 2006, 6, 288–295. [Google Scholar] [CrossRef]
  44. Peakall, R.; Smouse, P.E. GenAlEx 6.5: Genetic Analysis in Excel. Population Genetic Software for Teaching and Research—An Update. Bioinformatics 2012, 28, 2537–2539. [Google Scholar] [CrossRef] [PubMed] [Green Version]
  45. Alberto, F. StandArich_v1.00: An R Package to Estimate Population Allelic Richness Using Standardized Sample Size; University of Algarve: Faro, Portugal, 2006. [Google Scholar]
  46. Nei, M. Genetic Distance between Populations. Am. Nat. 1972, 106, 283–292. [Google Scholar] [CrossRef]
  47. Del Carpio, P.D.; Basnet, R.K.; De Vos, R.C.H.; Maliepaard, C.; Visser, R.; Bonnema, G. The Patterns of Population Differentiation in a Brassica rapa Core Collection. Theor. Appl. Genet. 2011, 122, 1105–1118. [Google Scholar] [CrossRef] [Green Version]
  48. Perrier, X.; Jacquemoud-Collet, J.P. DARwin Software, Version 6. Available online: https://darwin.cirad.fr/ (accessed on 18 July 2020).
  49. Pritchard, J.K.; Stephens, M.; Donnelly, P. Inference of Population Structure Using Multilocus Genotype Data. Genetics 2000, 155, 945–959. [Google Scholar] [CrossRef]
  50. Evanno, G.; Regnaut, S.; Goudet, J. Detecting the Number of Clusters of Individuals Using the Software Structure: A Simulation Study. Mol. Ecol. 2005, 14, 2611–2620. [Google Scholar] [CrossRef] [PubMed] [Green Version]
  51. Holtsford, T.P.; Ellstrand, N.C. Variation in Outcrossing Rate and Population Genetic Structure of Clarkia tembloriensis (Onagraceae). Theor. Appl. Genet. 1989, 78, 480–488. [Google Scholar] [CrossRef]
  52. Andrello, M.; Henry, K.; Devaux, P.; Desprez, B.; Manel, S. Taxonomic, Spatial and Adaptive Genetic Variation of Beta Section Beta. Theor. Appl. Genet. 2016, 129, 257–271. [Google Scholar] [CrossRef]
  53. Cao, Q.; Lu, B.-R.; Xia, H.; Rong, J.; Sala, F.; Spada, A.; Grassi, F. Genetic Diversity and Origin of Weedy Rice (Oryza sativa f. spontanea) Populations Found in North-Eastern China Revealed by Simple Sequence Repeat (SSR) Markers. Ann. Bot. 2006, 98, 1241–1252. [Google Scholar] [CrossRef] [Green Version]
  54. Abbott, R.; Albach, D.; Ansell, S.; Arntzen, J.W.; Baird, S.J.E.; Bierne, N.; Boughman, J.; Brelsford, A.; Buerkle, C.A.; Buggs, R.; et al. Hybridization and Speciation. J. Evol. Biol. 2013, 26, 229–246. [Google Scholar] [CrossRef] [PubMed] [Green Version]
  55. Wang, D.; Wang, Z.; Kang, X.; Zhang, J. Genetic Analysis of Admixture and Hybrid Patterns of Populus hopeiensis and P. tomentosa. Sci. Rep. 2019, 9, 4821. [Google Scholar] [CrossRef] [PubMed]
  56. Feng, L.; Zheng, Q.-J.; Qian, Z.-Q.; Yang, J.; Zhang, Y.-P.; Li, Z.-H.; Zhao, G.-F. Genetic Structure and Evolutionary History of Three Alpine Sclerophyllous Oaks in East Himalaya-Hengduan Mountains and Adjacent Regions. Front. Plant Sci. 2016, 7, 1688. [Google Scholar] [CrossRef] [Green Version]
  57. Mallet, J. Hybridization as an Invasion of the Genome. Trends Ecol. Evol. 2005, 20, 229–237. [Google Scholar] [CrossRef]
  58. Van Geyt, J.P.C.; Lange, W.; Oleo, M.; De Bock, T.S.M. Natural Variation within the Genus Beta and Its Possible Use for Breeding Sugar Beet: A Review. Euphytica 1990, 49, 57–76. [Google Scholar] [CrossRef]
  59. Petit, R.J.; Excoffier, L. Gene Flow and Species Delimitation. Trends Ecol. Evol. 2009, 24, 386–393. [Google Scholar] [CrossRef]
  60. Rius, M.; Darling, J.A. How Important Is Intraspecific Genetic Admixture to the Success of Colonising Populations? Trends Ecol. Evol. 2014, 29, 233–242. [Google Scholar] [CrossRef]
  61. Keller, S.R.; Taylor, D.R. Genomic Admixture Increases Fitness during a Biological Invasion. J. Evol. Biol. 2010, 23, 1720–1731. [Google Scholar] [CrossRef]
  62. Roussel, V.; Koenig, J.; Beckert, M.; Balfourier, F. Molecular Diversity in French Bread Wheat Accessions Related to Temporal Trends and Breeding Programmes. Theor. Appl. Genet. 2004, 108, 920–930. [Google Scholar] [CrossRef] [PubMed]
  63. Semagn, K.; Magorokosho, C.; Ogugo, V.; Makumbi, D.; Warburton, M.L. Genetic Relationships and Structure among Open-Pollinated Maize Varieties Adapted to Eastern and Southern Africa Using Microsatellite Markers. Mol. Breed. 2014, 34, 1423–1435. [Google Scholar] [CrossRef]
  64. Oliveira, H.R.; Tomás, D.; Silva, M.; Lopes, S.; Viegas, W.; Veloso, M.M. Genetic Diversity and Population Structure in Vicia faba L. Landraces and Wild Related Species Assessed by Nuclear SSRs. PLoS ONE 2016, 11, e0154801. [Google Scholar] [CrossRef] [Green Version]
  65. Meirmans, P.G.; Hedrick, P.W. Assessing Population Structure: FST and Related Measures. Mol. Ecol. Resour. 2011, 11, 5–18. [Google Scholar] [CrossRef]
  66. Balloux, F.; Lugon-Moulin, N. The estimation of population differentiation with microsatellite markers. Mol. Ecol. 2002, 11, 155–165. [Google Scholar] [CrossRef] [Green Version]
  67. Mohammadi, S.A.; Prasanna, B.M. Analysis of Genetic Diversity in Crop Plants—Salient Statistical Tools and Considerations. Crop Sci. 2003, 43, 1235–1248. [Google Scholar] [CrossRef] [Green Version]
  68. Monteiro, F.; Vidigal, P.; Barros, A.B.; Monteiro, A.; Oliveira, H.R.; Viegas, W. Genetic Distinctiveness of Rye In Situ Accessions from Portugal Unveils a New Hotspot of Unexplored Genetic Resources. Front. Plant Sci. 2016, 7, 1334. [Google Scholar] [CrossRef] [PubMed] [Green Version]
  69. Saccomani, M.; Stevanato, P.; Trebbi, D.; McGrath, J.M.; Biancardi, E. Molecular and Morpho-Physiological Characterization of Sea, Ruderal and Cultivated Beets. Euphytica 2009, 169, 19–29. [Google Scholar] [CrossRef]
  70. Ennos, R.A. Estimating the Relative Rates of Pollen and Seed Migration among Plant Populations. Heredity 1994, 72, 250–259. [Google Scholar] [CrossRef] [Green Version]
  71. Petit, R.J.; Mousadik, A.E.; Pons, O. Identifying Populations for Conservation on the Basis of Genetic Markers. Conserv. Biol. 1998, 12, 844–855. [Google Scholar] [CrossRef]
Figure 1. Map of sampling locations: 1—Finisterra (“FIN”); 2—Viana do Castelo (“VCA”); 3—Aveiro (“AVE”); 4—Rio Maior (“RIO”); 5—Oeiras (“OEI”); 6—Vaiamonte (“VMT”); 7—Comporta (“CMP”); 8—Tavira (“TAV”); 9—Fuseta (“FUS”); 10—Ludo (“ML”); 11—Quinta de Marim (“PM”);12—Cabo da Gata, Almeria (“ALM”); 13—Terceira, Azores Island (“AZO”); 14—Porto Moniz, Madeira Island (“MAD”). B. vulgaris subsp. maritima is represented by green color; B. macrocarpa is represented by red color.
Diversity 13 00593 g001
Figure 2. Scatter plot of the first and second principal coordinate based on the genetic variation of 6 SSR loci for 390 individuals of wild beet, from 16 populations. The explained variation in the first coordinate is 50.75% and in the second coordinate is 12.85%.
Diversity 13 00593 g002
Figure 3. Graphical display of the results of the STRUCTURE analysis, inferred at K = 2, K = 3, and K = 5. Each population accession is represented by a vertical line segmented into a number of colors identical to the K number: 1—Finisterra (“FIN”); 2—Viana do Castelo (“VCA”); 3—Aveiro (“AVE”); 4—Rio Maior (“RIO”); 5—Vaiamonte (“VMT”); 6—Oeiras (“OEI”); 7—Comporta (“CMP”); 8—Tavira (“TAV”, B. vulgaris subsp. maritima); 9—Tavira (“TAVX”, B. macrocarpa); 10—Fuseta (“FUS”); 11—Ludo (“ML”,); 12—Quinta de Marim (“PM”, B. vulgaris subsp. maritima); 13—Quinta de Marim (“PMX”, B. macrocarpa); 14—Almeria (“ALM”); 15—Azores (“AZO”); 16—Madeira (“MAD”). At K = 2, B. vulgaris subsp. maritima is represented by (red color) and B. macrocarpa by green color; at K = 3 and K = 5, B. macrocarpa is represented by red color.
Diversity 13 00593 g003
Table 1. SSRs loci used and their genetic diversity measures and F-statistics following Nei (1987) estimated over all wild beet populations for six SSRs loci: Na—number of alleles; Ne—number of effective alleles; Ho—observed heterozygosity; He—expected heterozygosity; PIC—polymorphism information content; FST—differentiation indices.
LocusNaNeHoHePICFST
SB04143.030.5900.6510.7310.202
SB06103.550.6100.6810.8080.233
SB07235.430.6100.7690.8980.216
SB1372.190.4400.5360.5590.191
SB15213.520.6350.6670.8120.225
BQ588629253.900.6690.6940.8320.254
Table 2. Genetic diversity of the 16 wild beet populations, based on the polymorphisms of six SSRs loci: N—number of plants; Na—number of alleles; Ne—number of effective alleles; Npa—number of unique alleles to a single population; Ar—allelic richness; Ho—observed heterozygosity; He—expected heterozygosity; F—fixation index (inbreeding coefficient).
PopulationNNaNeNpaArHoHeF
FIN306.5003.03636.6670.5470.6130.108
VCA284.8332.05204.8330.5000.5070.014
AVE236.0003.09126.1670.6580.6580.000
RIO286.1672.92806.1670.6490.6520.005
VMT317.6674.22747.6670.6340.7390.142
OEI359.0004.74919.1670.7090.7380.039
CMP3010.0005.316310.1670.7830.7860.004
TAV157.6665.31647.6670.7820.7620.054
FUS348.6675.12318.6670.7500.7740.031
ML308.3335.02228.3330.6500.7890.176
PM106.8335.11107.0000.7830.7850.105
ALM278.8335.07958.3330.6300.7780.190
AZO114.3332.68804.3330.5610.6150.088
MAD94.5003.39404.5000.6300.7100.113
TAVX302.5000.89912.5000.0440.0740.287
PMX192.3331.09202.3330.0880.084−0.041
Table 3. Analysis of molecular variance (AMOVA) based on 6 SSR loci, considering all wild beet populations (northern, southern, and Islands), the B. vulgaris subsp. maritima northern populations, the B. vulgaris subsp. maritima southern populations and the Algarve populations (B. vulgaris subsp. maritima/B. macrocarpa living in sympatry).
Source of VariationdfSum of SquaresVariance ComponentsVariation (%)
All populations
Among populations15397.1350.50521
Among individuals374771.7720.1617
Within individuals390679.0001.74172
Northern populations
Among populations261.2380.53323
Among individuals78146.8240.1024
Within individuals81136.0001.67973
Southern populations
Among populations641.9880.0884
Among individuals174442.2610.2078
Within individuals181385.0002.12788
Algarve populations
Among populations5140.2590.58827
Among individuals132234.9690.1698
Within individuals138199.0001.44265
With 1000 permutations; p < 0.001.
Publisher’s Note: MDPI stays neutral with regard to jurisdictional claims in published maps and institutional affiliations.

